
Abstract
Decarbonising the built environment is at the heart of many nations' route to net zero. This leads to policies that target specific technologies. Within such policies, there is a natural instinct to combine the need to reduce carbon emissions with solving other issues, such as fuel poverty. Here, we examine for the first time if, from a carbon perspective, this is optimal. By assembling energy performance certificates and household economic deprivation data, we use fuzzy matching techniques to produce a single statistically robust dataset of 44,300 households. Then, through secondary data analysis, we closely examine the carbon impact and cost of energy retrofits. Overall, upgrading to band C is the most viable strategy. However, the results demonstrate that households belonging to the least deprived 20% present more than double the carbon saving potential compared to those in the most deprived 20% (2.7 and 1.2tCO2/yr, respectively)
Keywords
Introduction
At the heart of many countries’ plans for net zero lies the use of Energy Performance Certificates (EPCs) or equivalent (1) Energy Performance Certificates estimate building energy and environmental performance based on operational and technical assumptions, and they are accompanied by recommendations for the ‘cost-optimal or cost-effective improvement of the energy performance of a building or building unit’.1,2 In the UK, new dwellings are assessed using the Standard Assessment Procedure (SAP), an energy model predating EPCs. 3 A building’s SAP rating is an energy performance indicator on a 1-100 scale, calculated based on modelled fuel costs per square metre. The higher the SAP rating, the better the energy efficiency and the lower the associated running costs. The rating is then associated with an EPC band, ranging from A (most efficient/cheapest to run) to G (least efficient/most expensive to run). A second rating within an EPC is the Environmental Impact (EI) rating, also ranging from 1 to 100, which is calculated using emissions factors from different fuel types and therefore is directly linked to CO2. Both ratings are normalised to unit floor area; thus, are independent of building size.
Energy Performance Certificates have been used for evaluating building energy performance4–7 and retrofitting,8,9 addressing the energy performance gap,10–12 assessing the relationship between energy efficiency and human health 13 and analysing changes in house prices.14–16 Recently, new application areas have gained attention, such as investment analysis17,18 and energy planning, i.e. the extraction of strategic thinking to inform energy savings or emissions reduction policies by assessing the current situation and characteristics of the building stock.19–23
The UK government has already adopted EPC ratings as a metric to inform policies, such as the Feed-in Tariff subsidy for renewable energy generation, 24 the legally binding fuel poverty targets, 25 the ambition to have as many homes as possible upgraded to band C by 2035 26 and the Minimum Energy Efficiency Standard for privately rented homes. 27 However, there is a lack of studies addressing the implications of EPCs in energy planning in the UK. 21 In addition, most of the current studies do not address future energy and carbon emissions; an omission of great importance as the path towards net zero requires informed decisions regarding buildings’ environmental impact. In this context, the need for broader use of EPCs to guide routes to carbon savings across dwellings has become increasingly prominent.
Retrofitting is a key area as around 80%–85% of the homes that will be inhabited in 2050 are already standing today.28,29 However, it is evident that the influence of EPCs on boosting retrofitting has been limited.30,31 Several criticisms have been levelled against the EPC system, such as ‘inaccuracy, the energy performance gap and the assumption that market transformation can be facilitated through information. 32 One of the most common criticisms is the quality and nature of the provided list of recommendations.30–33 Recommendations provided within EPCs have been characterised as generic, trivial and irrelevant, as owners often ignore them or think they would have performed the same retrofit interventions anyway.34–36 In addition, recommendations are found unable to account for cost-effectiveness, technical compatibility, or the building’s historical character. 37 A reason behind the generic nature of recommendations could be the potential increase in the EPC cost if tailored recommendations for each dwelling were provided. 38 Moreover, there is no certainty that applying the proposed measures would lead to investment recovery, indoor air quality improvement, increased property value or decreased energy bills. 38 It has been shown that 80% of the households that remember seeing an EPC when moving into a new home reported that they had not been provided with energy efficiency recommendations. 39
What is more, modelled energy use does not represent reality. Recent studies highlight a distinct performance gap between metered energy consumption and EPC-modelled energy use.40–42 Overall, existing research suggests that EPCs overestimate energy use; more specifically, the least energy-efficient homes (bands F and G) use less energy than predicted, whilst the opposite is true for the most energy-efficient ones (bands A and B). 42 In the UK, EPCs are found to overstate energy use by 8% for band C and 48% for bands F and G. 42 The discrepancies can be attributed to assumptions regarding occupant behaviour,43,44 calculation methods, 41 inaccuracies of the input data45,46 and difficulties in accounting for aspects of the regulated use which excludes appliances and cooking.
Despite these shortcomings, many countries’ plans to net zero continue to include EPC (or equivalent) band updating via retrofit as a core initiative. Recent schemes such as the Home Upgrade Grant provide energy efficiency upgrades and low-carbon heating by focusing on low-income households with an EPC rating between D and G. It has long been considered that alleviating fuel poverty and reducing carbon emissions are two sides of the same coin. 47 However, there is little evidence that this is the most effective way towards achieving net zero. It is crucial to obtain a link between a household’s deprivation status and the energy efficiency of buildings to inform new policies and provide further information to update the retrofitting strategies of future schemes.
This study aims to generate a deep understanding of the nature and scale of the challenges that countries face in meeting their carbon neutrality targets through the analysis of the EPC database of the current housing stock. To do so, we investigate relationships between energy efficiency ratings, cost of retrofit, carbon savings and indices of multiple deprivation using the UK city of Bath and its surrounding neighbours as a case study. Our observations are used to make suggestions about strategic retrofitting to reduce carbon emissions across the region.
Methodology and data
This study consists of secondary data analysis combining data on dwelling and Lower Super Output Area (LSOA) levels from two main sources: (i) EPC data and (ii) indices of multiple deprivation. EPCs were obtained from the Energy Performance of Buildings Register. 48 The EPC dataset for the study area was accessed in March 2022 and comprises 68,209 dwellings, including EPCs issued up to and including 31 December 2021. The EPC dataset also contains the list of recommendations for each dwelling in a separate file, together with the associated costs for some of their implementation. No information regarding individuals’ data is provided in the disclosure of EPC data. Deprivation data were assessed using the 2019 English Indices of Multiple Deprivation (IMD) – at LSOA level. 49 Indices of Multiple Deprivation ranks each LSOA from most to least deprived based on seven domains of deprivation: income, employment, education, health, crime, barriers to housing and services, and living environment. 50
Figure 1 shows the dataset-matching procedure, the main information extracted from each dataset and the number of dwellings considered and matched. Initially, EPC data are cleaned by keeping only the most recent entries for each dwelling. This leads to a set of 66,543 properties, 98% of the total properties in the EPC dataset. Next, each dwelling is linked with an LSOA code at postcode level using available LSOA lists for the study area. The link between the list of recommendations and the respective dwellings is based on an individual lodgement identifier key, guaranteed to be unique for each certificate. In agreement with the findings of a recent survey,
39
there are many certificates without a provided list of recommendations or with no associated costs. These entries were excluded from the working dataset, which finally comprises 44,288 dwellings, approximately 67% of the total EPC entries. Finally, to assess the barriers to improving the energy efficiency of the building stock by considering deprivation, IMD ranks and scores are mapped onto EPC data for each dwelling based on the LSOA codes. Flowchart of the matching process. Overall matching percentages are estimated against the original EPC dataset.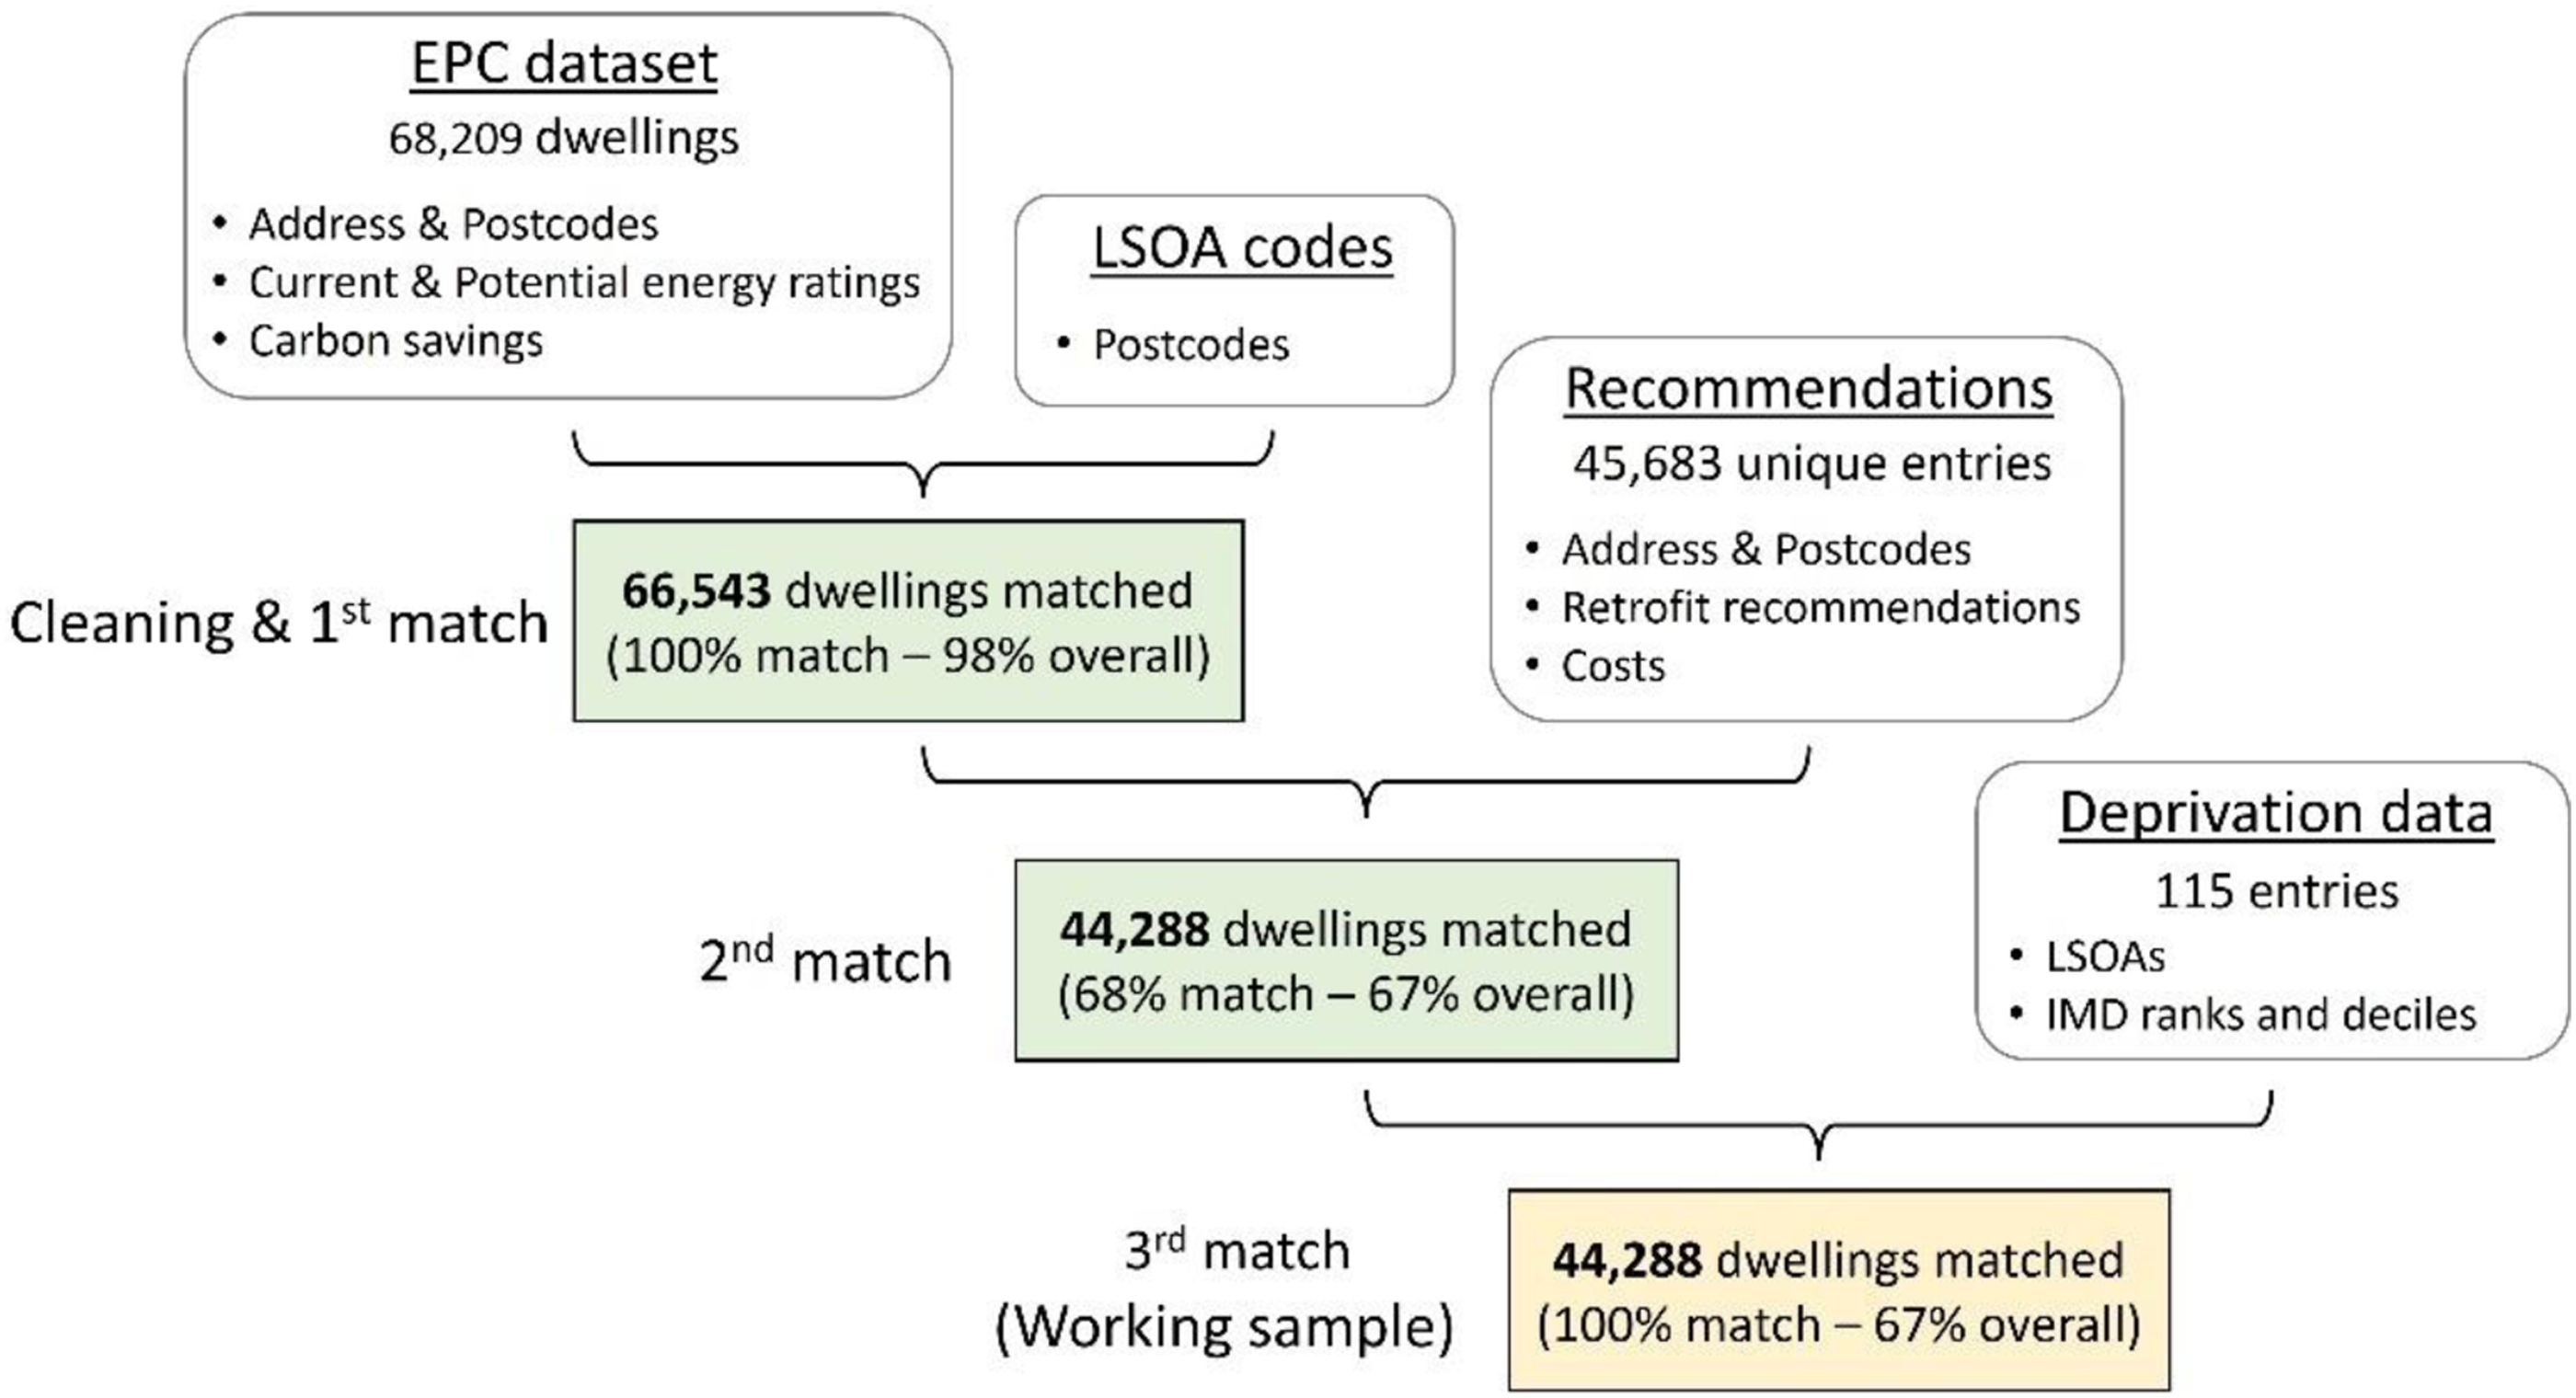
With regards to property type, dwellings are characterised as bungalows, flats, maisonettes and houses. For this study, the latter are further categorised as detached, semi-detached, mid-terrace and end-terrace. Enclosed mid/end-terraced houses are simply treated as mid/end-terraces, respectively. Park homes are excluded from the analysis due to their limited representation in the dataset. Carbon savings are estimated by subtracting current carbon emissions from the potential carbon emissions after a property has implemented the retrofit recommendations.
Aggregated retrofit recommendation categories are created based on 73 unique recommendation inputs identified in the dataset. With reference to the SAP2012 assessment, 51 aggregation produced a manageable set of 9 categories that grouped real-world implementation types. For example, different boiler or insulation types were grouped to simplify and facilitate data inspection. Recommendations regarding low-energy lighting, upgrading heating controls and installing room thermostats were grouped under a DIY category.
Recommendations are accompanied by corresponding cost estimates, provided as an indicative cost range. For instance, the cost associated with upgrading to a condensing boiler can vary between £1,500 and £3,500. However, the cost attributed to a specific recommendation is not the same for all properties. To work out the cost of retrofit for each dwelling, this study assumes an average cost for each recommendation based on the provided cost range. The sum of these costs gives the total average cost per property.
Results and discussion
Results are presented and discussed in terms of overall descriptive statistics of the working dataset, energy retrofit recommendations, current and potential energy ratings, carbon saving potential and cost implications for upgrading the stock’s energy efficiency. Note that the potential energy rating is the energy rating of a dwelling after having implemented all the recommendations. For the sake of simplicity, decile categories for the IMD are grouped into five groups: the Most Deprived 20%, 20%–40%, 40%–60%, 60%–80% and the Least Deprived 20%, and are referred to as MD20, D20–40, D40–60, D60–80 and LD20, respectively.
Descriptive statistics
Figure 2 shows the distribution of the deprivation groups and tenure across the working sample. Results show that private-rented and owner-occupied dwellings occupy more significant proportions amongst the less deprived population. For example, 63% of the LD20 households are owner-occupied, whilst about 37% are owner-occupied in the MD20 group. About 45% of dwellings in the MD20 are social-rented houses, while approximately 4% are social-rented in the LD20. (a) Distribution of multiple deprivation groups for the working sample. The number in brackets is the number of dwellings belonging to each group. (b) Tenure distribution across the deprivation groups. Data is based on the 2019 English Indices of Multiple Deprivation.
49
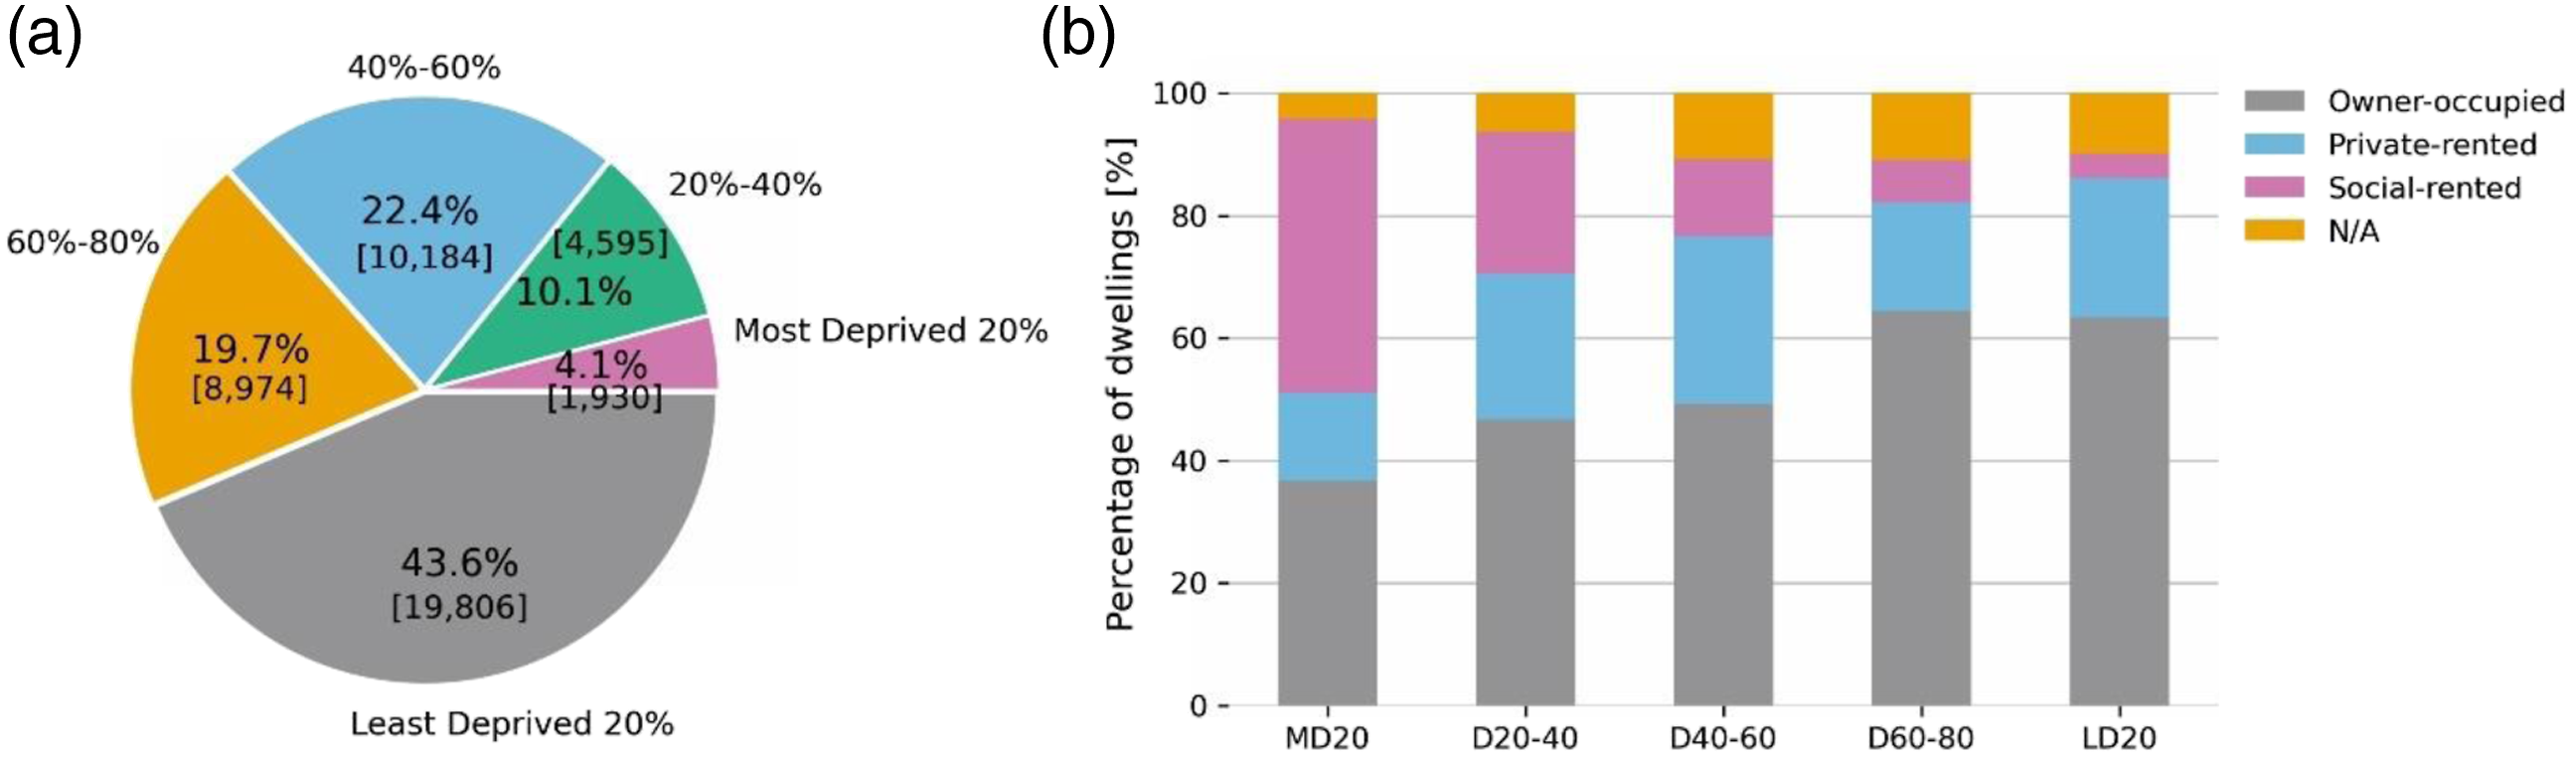
Figure 3 shows the distribution of different property types and construction age bands across the five deprivation groups. A higher proportion of the less deprived populations live in detached houses, while more people amongst the more deprived live in flats, mid-terraces and end-terraces. More deprived populations appear to live in newer homes, as most dwellings within the MD20 and D20-40 groups, 41% and 35%, respectively, were built between 1950 and 1966. On the contrary, most dwellings belonging to the less deprived groups were built pre-1900, indicating potential barriers to energy efficiency interventions, as a large proportion of those dwellings can be heritage buildings or listed buildings. (a) Property type and (b) construction age band distribution across deprivation groups.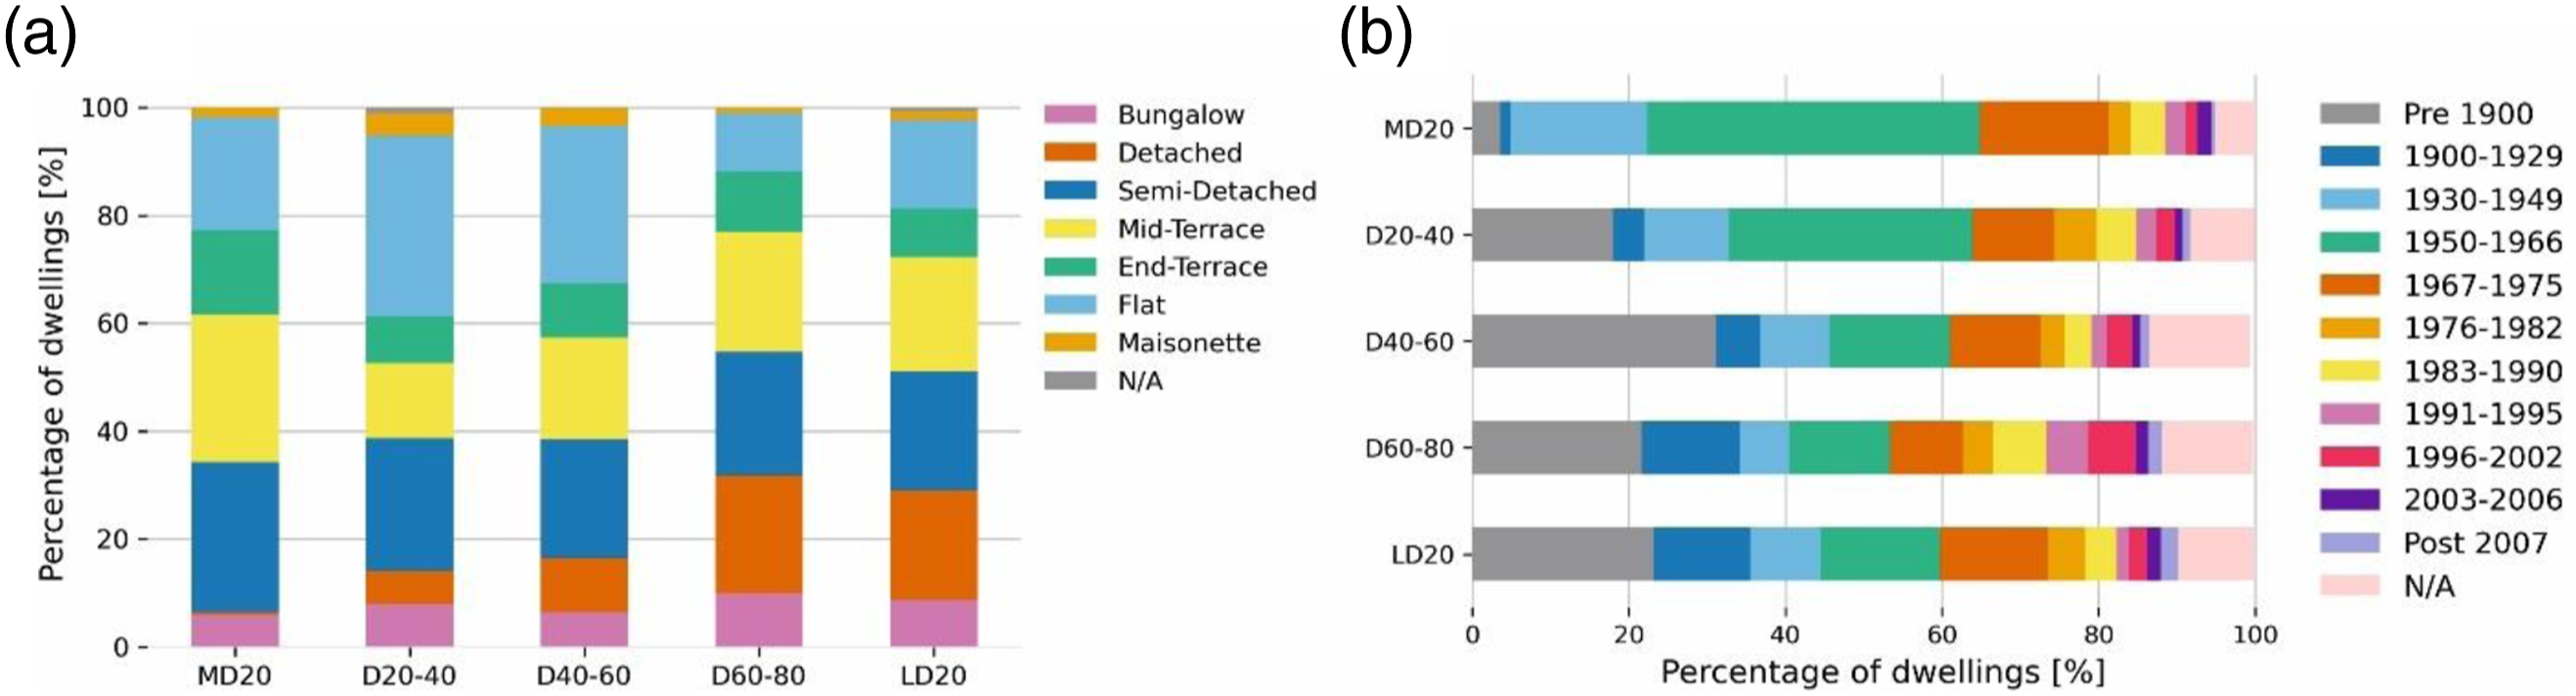
Energy retrofit recommendations
The analysis of the provided list of recommendations within the EPCs is key to appraising carbon-saving potential and cost implications. The distributions of the aggregated recommendation categories are profiled across the stock against construction age, property type, current energy rating and carbon saving potential, and are shown in Figure 4. Results show that renewables are recommended predominantly for houses and bungalows (40%), whilst glazing recommendations have the most significant proportions for flats and maisonettes (15%). Insulation, boiler upgrades and DIY recommendations have a comparatively similar prevalence across all types. Glazing makes up the most significant proportion for the oldest buildings (11% for pre-1900, 4% for 1900–1929), which are more likely to be of heritage importance, making the replacement of windows more difficult and expensive. Insulation is the prevalent recommendation for properties with a positive carbon saving potential (33%), followed by renewables (25%). The presence of properties exhibiting increased carbon emissions can be attributed to the inclination of SAP 2012 towards favouring fossil fuel-based heating systems over electric heaters. This is evident from the large proportion (32%) of storage heaters being recommended for properties displaying negative carbon saving potential. Percentage distribution of aggregated recommendations categories against (a) property type, (b) construction age, (c) current energy rating and (d) CO2 savings.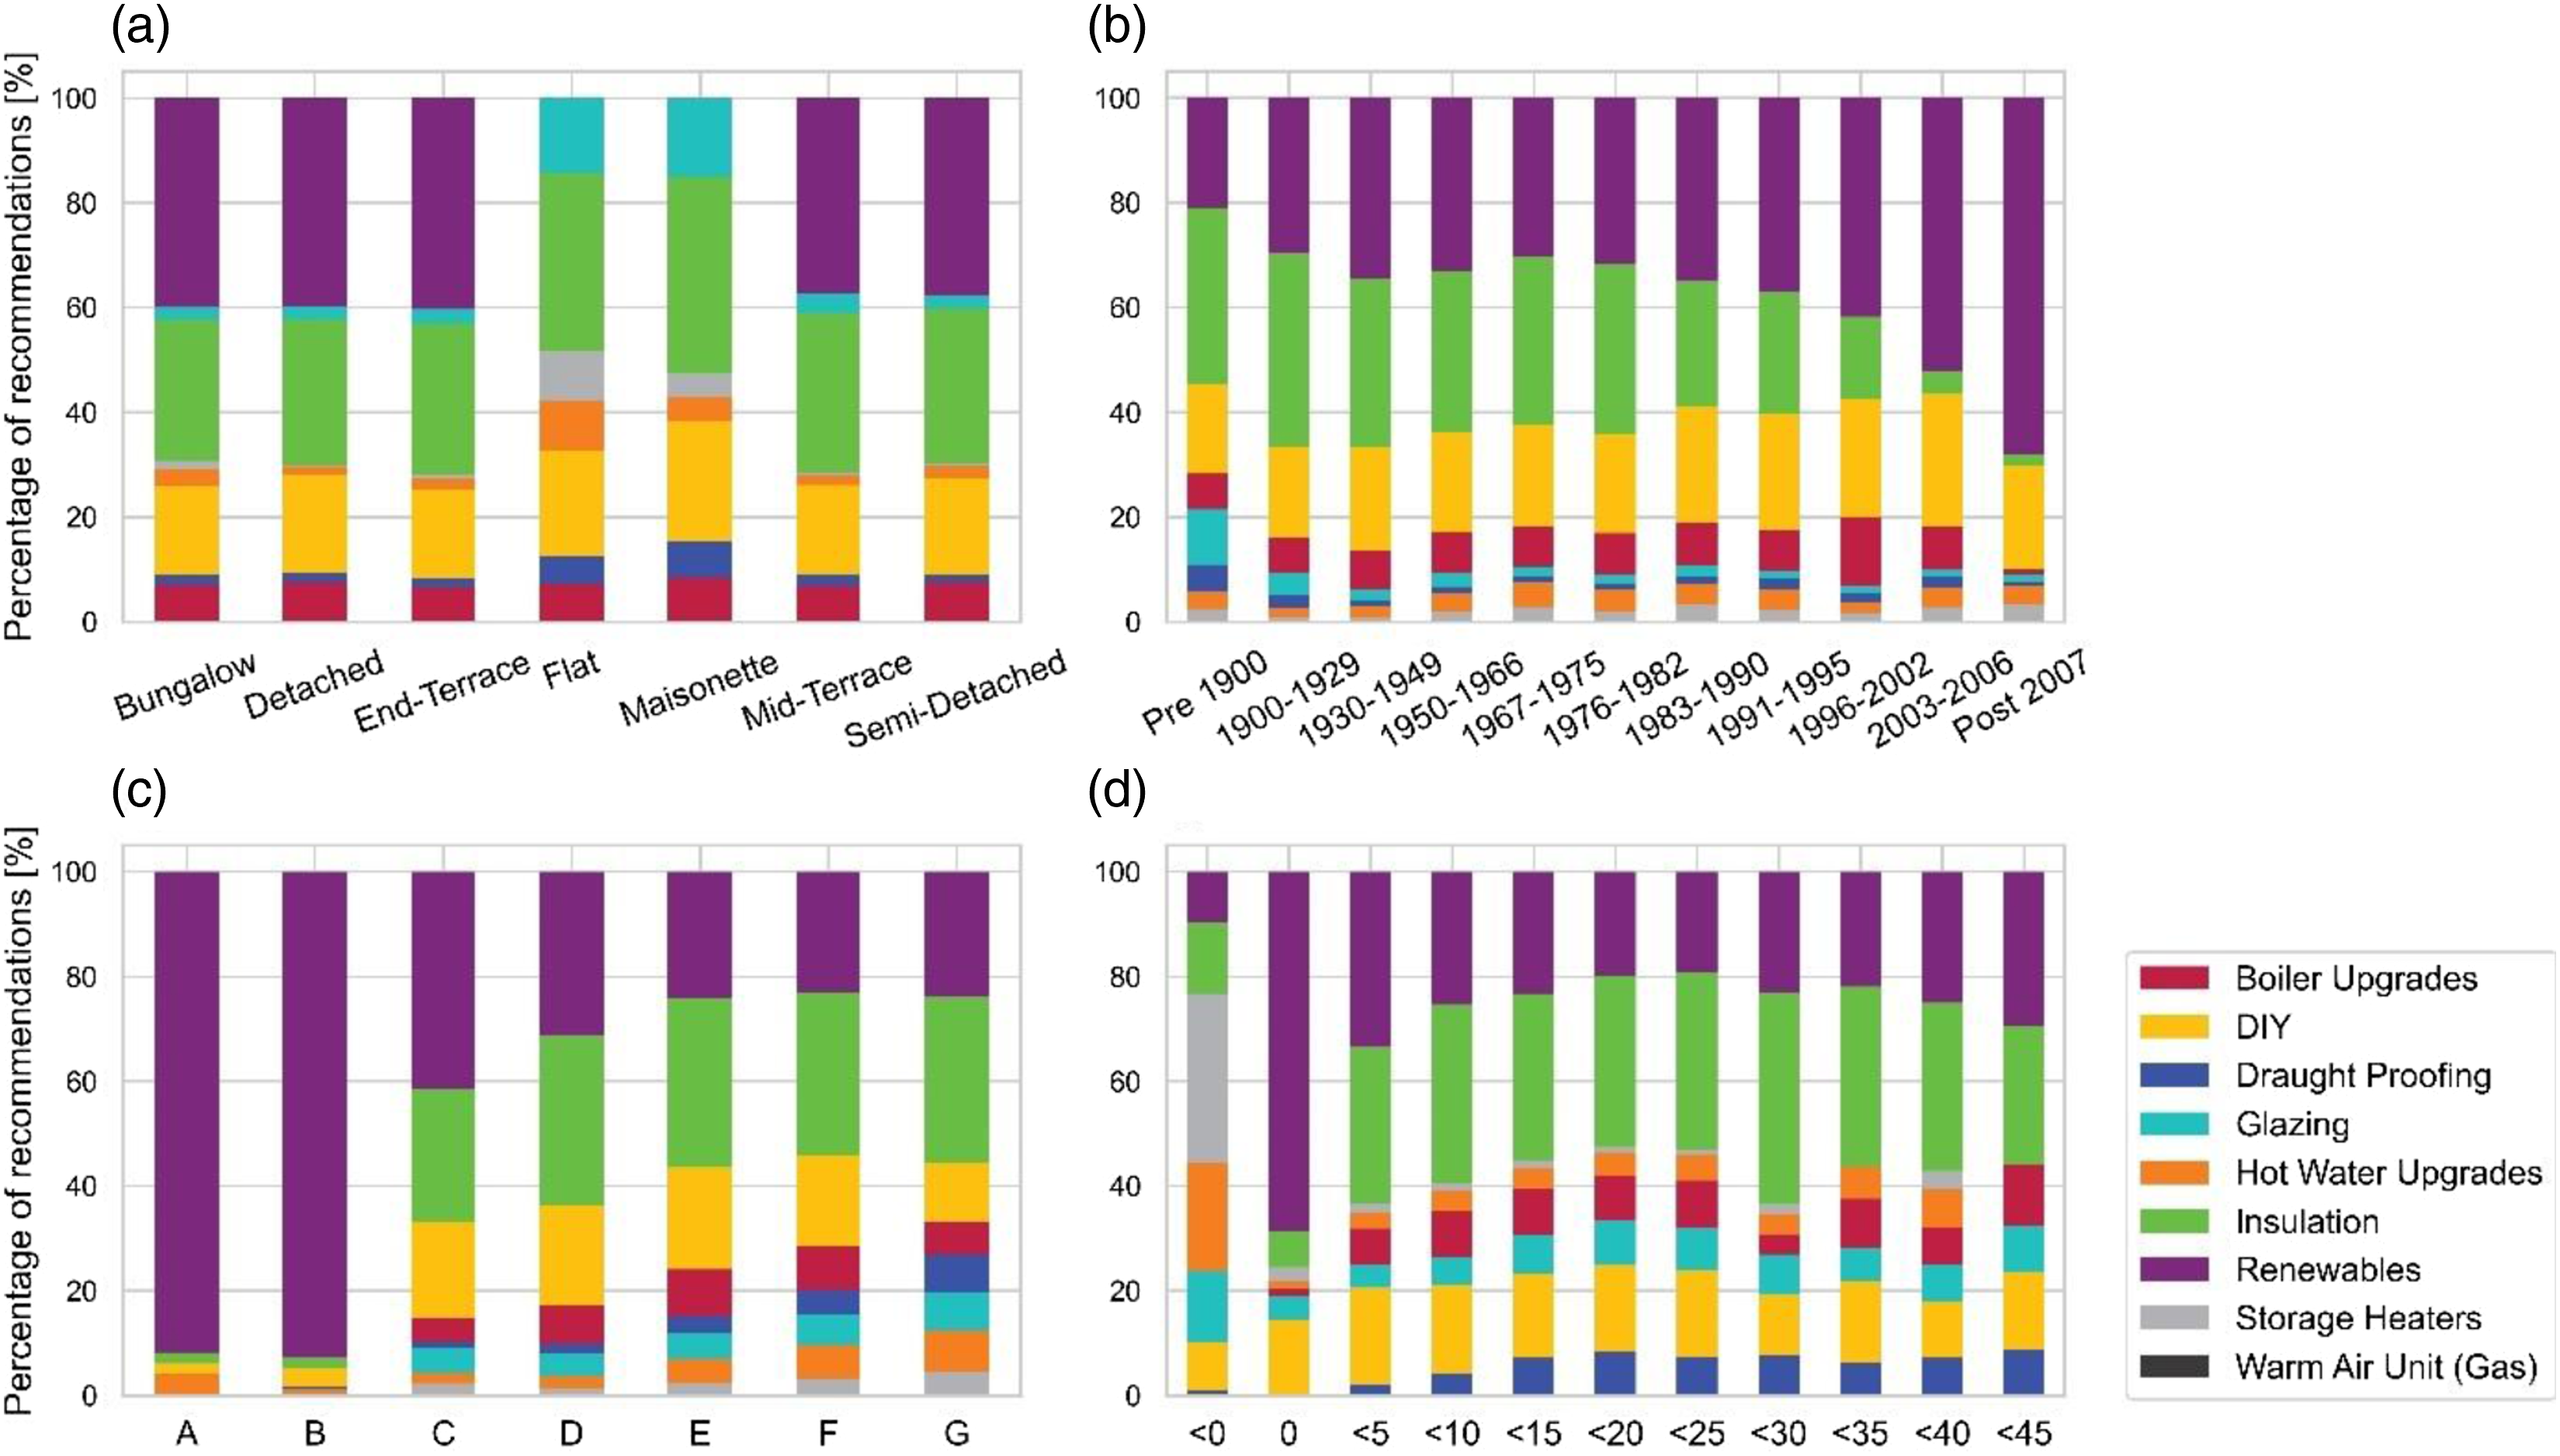
Current and potential energy ratings
Figure 5 shows each deprivation group’s current and potential energy rating distribution. Our findings indicate that dwellings in less deprived areas are less energy efficient compared to those in more deprived ones, this result may surprise many. This is explained by looking at Figure 3, where a larger proportion of more deprived households appear to live in newer homes, while a large proportion of houses in less deprived areas are detached houses, meaning they have a worse form factor. According to Figure 5(b), and across all deprivation groups, the dominant potential energy rating that could be achieved if the EPC recommendations were applied is band B, followed by band C. Current (a) and potential energy rating (b) distribution across the five deprivation groups.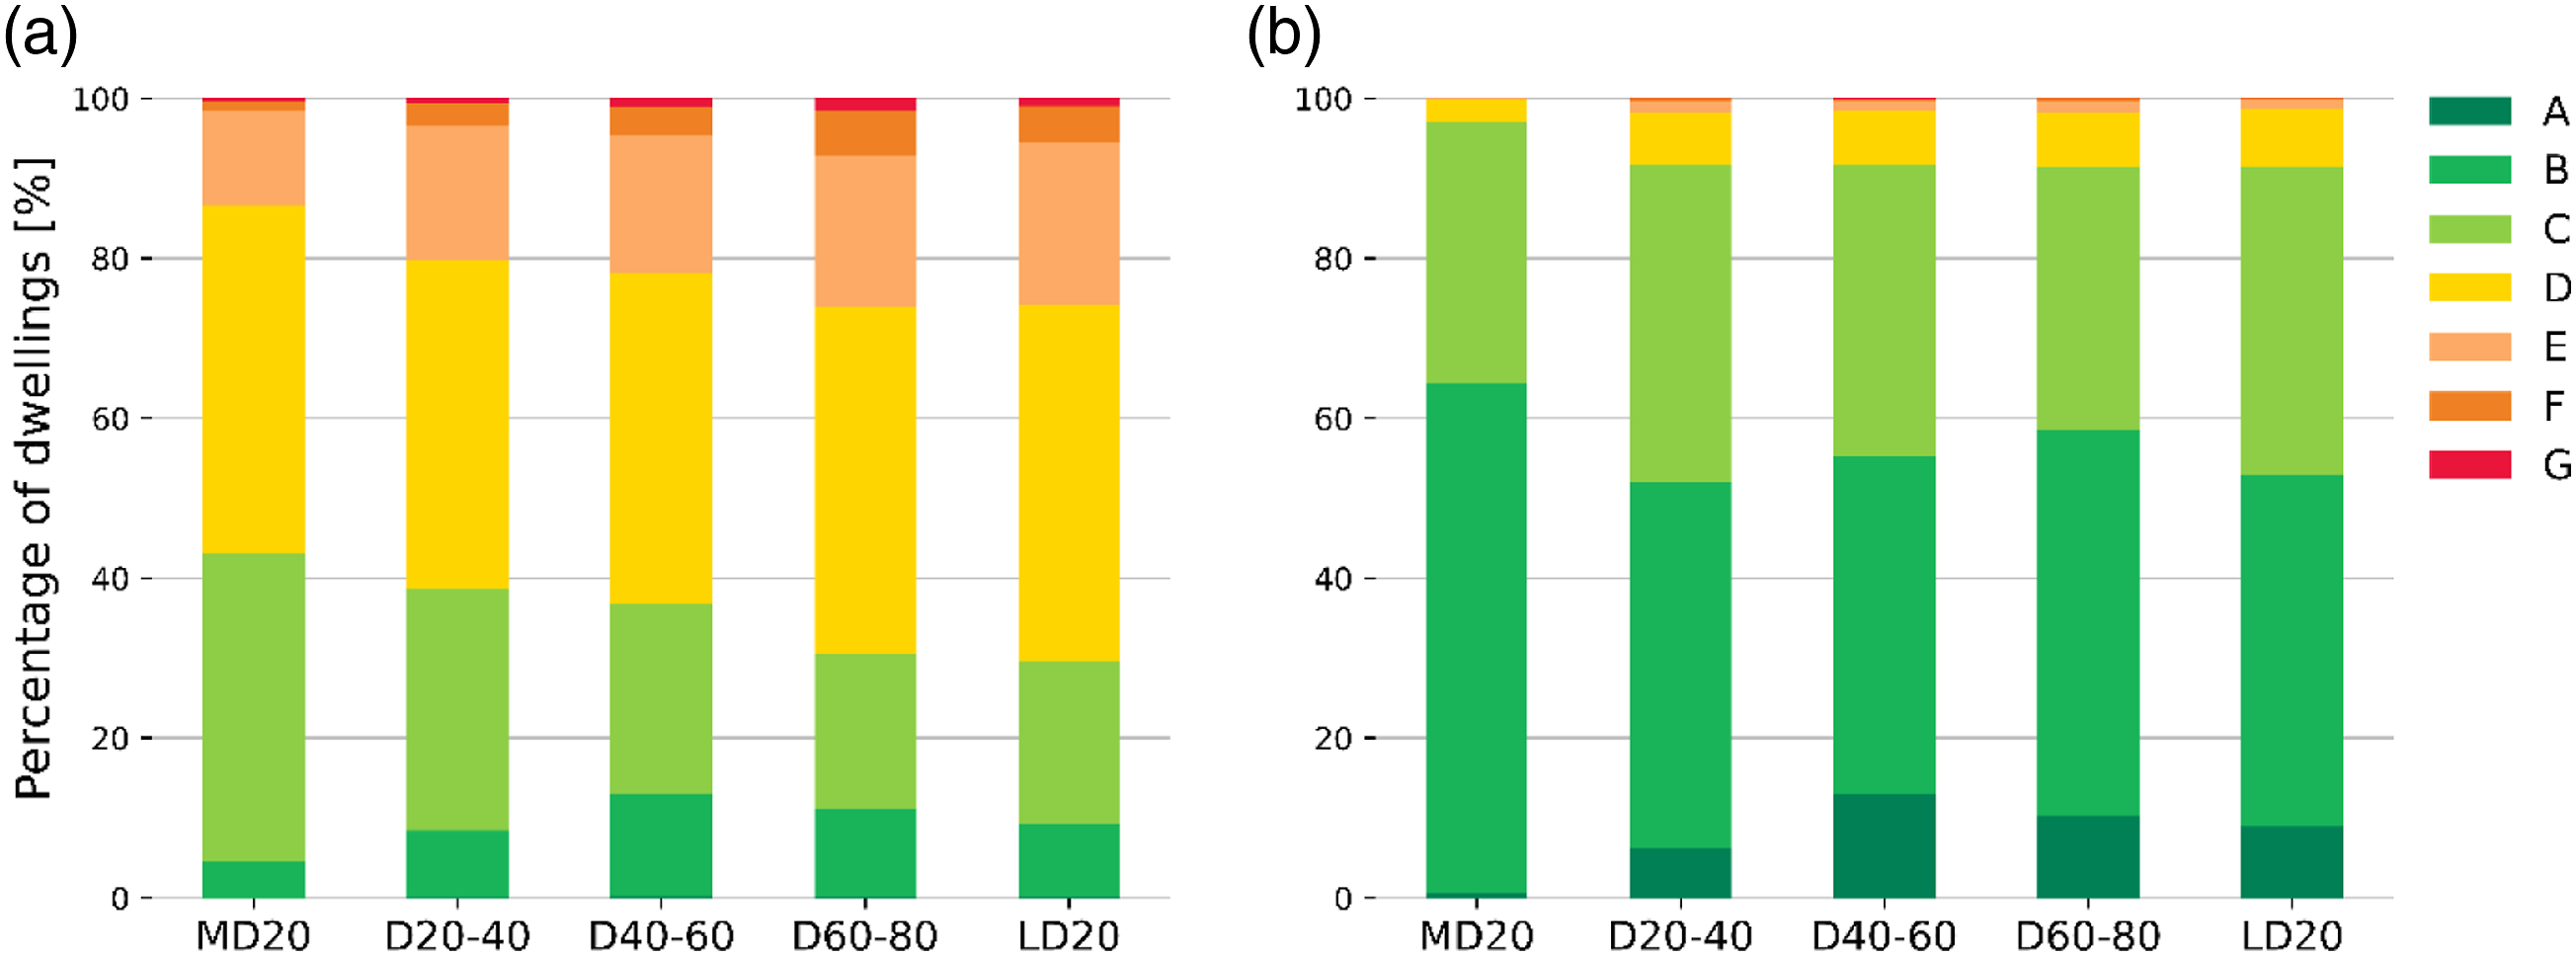
Figure 6 shows the breakdown of current and potential energy ratings based on property type. Regarding potential energy ratings (Figure 6(b)), most of bungalows, semi-detached, mid-terrace and end-terrace houses have a potential energy rating of band B, with mid-terraces exhibiting the highest proportion (65%). Flats and maisonettes are predominantly recommended to reach up to a band C (71% and 75%, respectively), perhaps due to their inherent spatial constraints and thus a limited scope for the integration of renewables (Figure 4(a)). Current energy rating (a) and potential energy rating (b) distribution for the whole stock based on property type.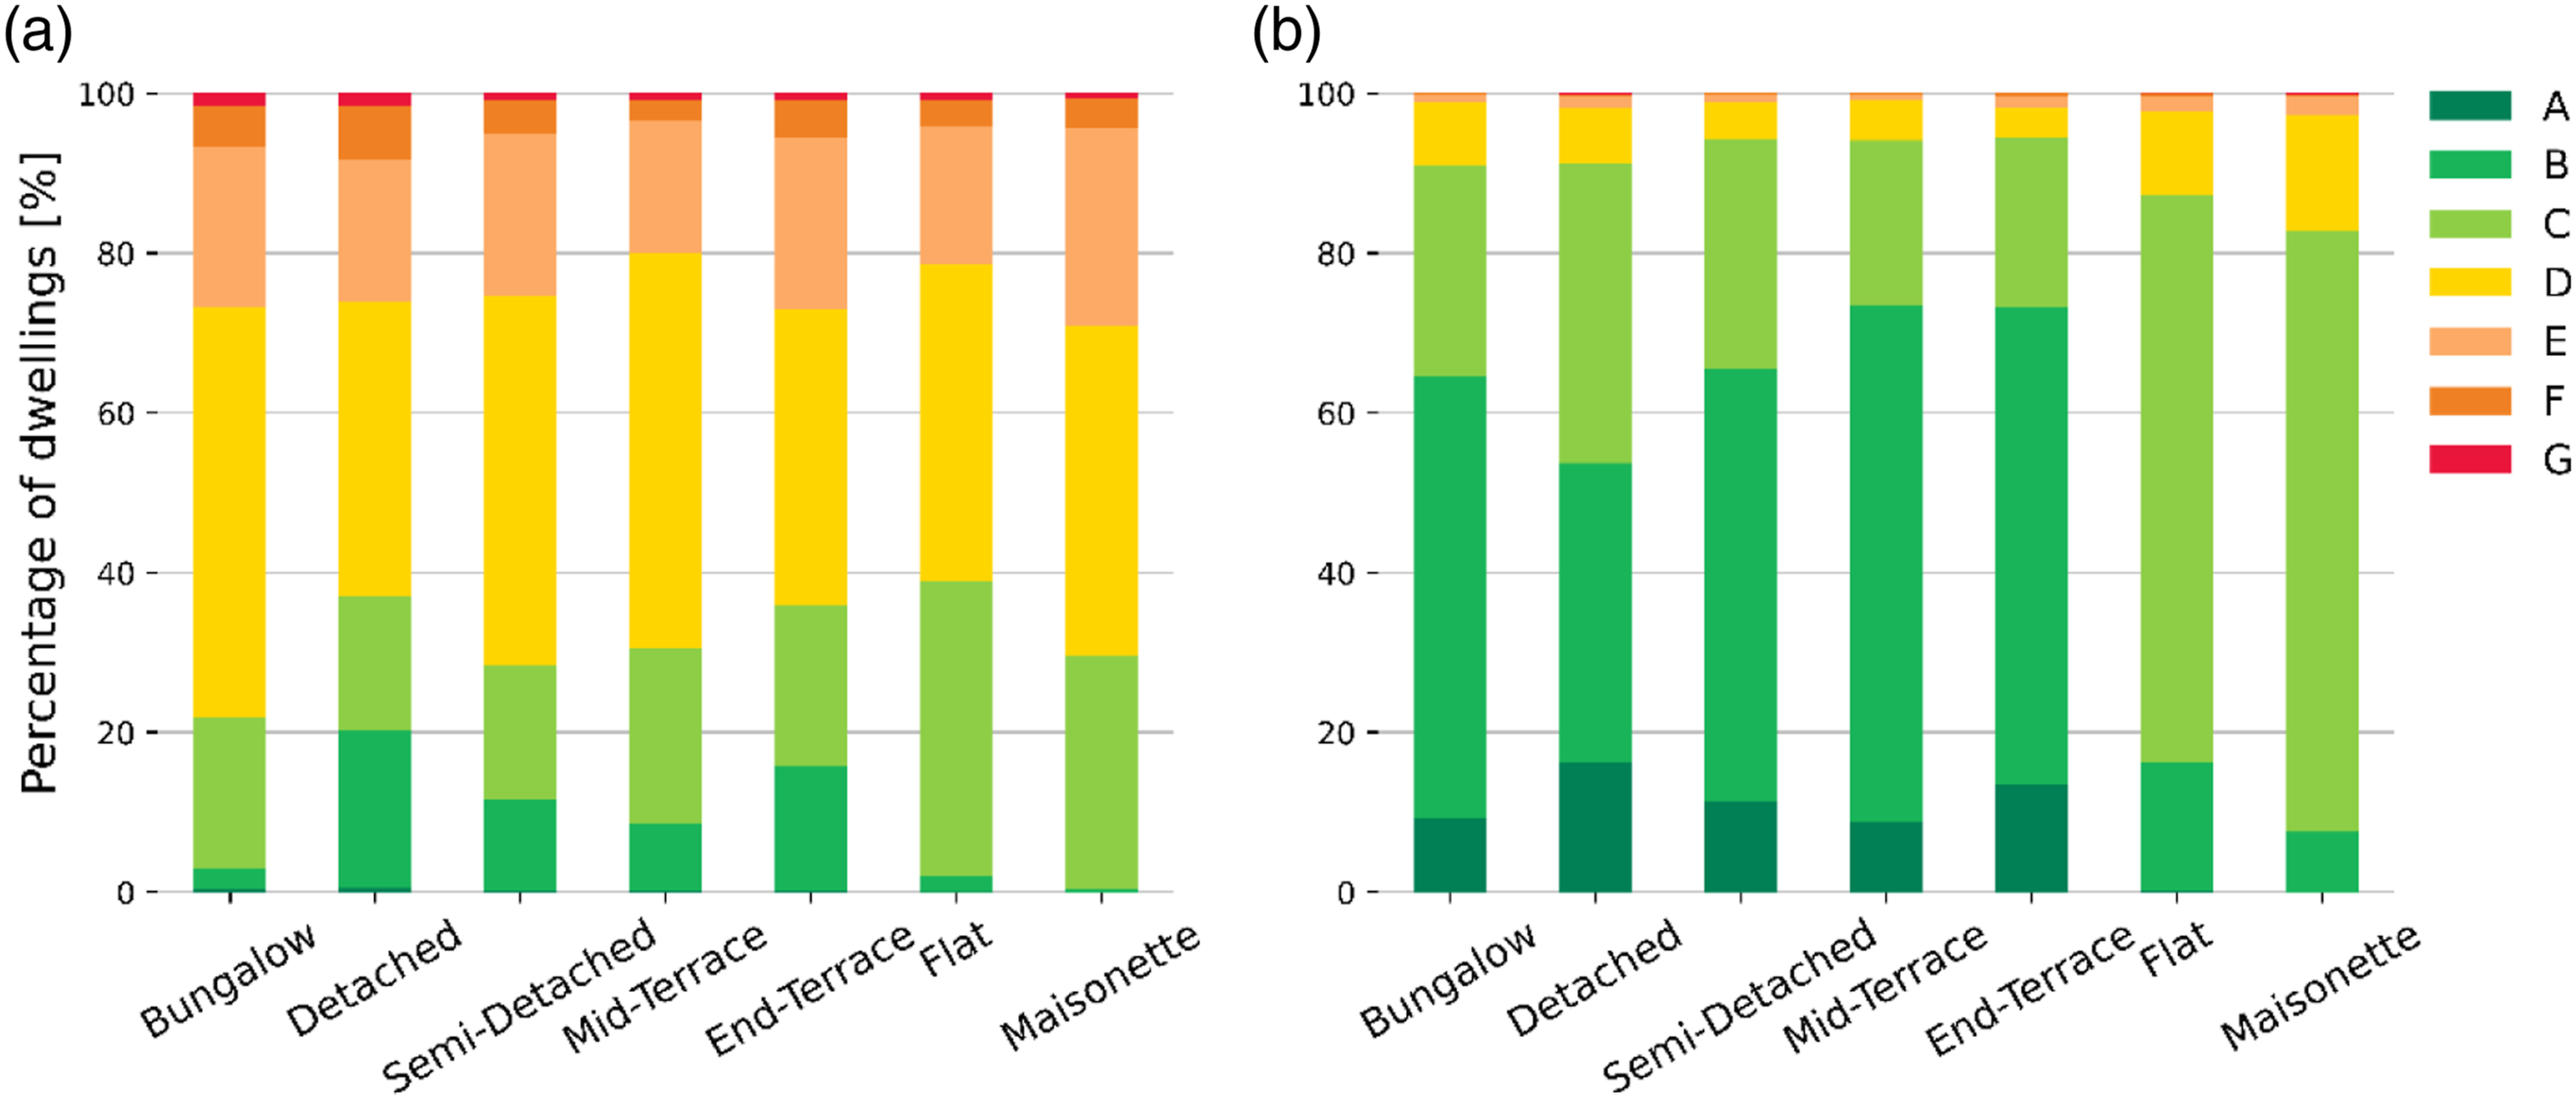
Carbon saving potential
Analysis of the whole EPC dataset’s carbon saving potential (68,209 dwellings) demonstrates that 81% of dwellings could reduce their CO2 output by between 0.1 and 5 tonnes per year. For the entire stock, the total saving potential is 121,102 tCO2 per year if all retrofit recommendations were implemented immediately and had the effect stated on the EPCs. As a hypothetical, if implemented immediately, this would cumulatively save 3,391,000 tCO2 in total between 2023–2050, which exceeds targets identified in current carbon zero models for the region during the same period. 52 However, many countries have committed to reaching net zero by 2030 and only 46% of the target CO2 savings for Bath would be achieved through retrofitting by this time based on immediate implementation.
The following analysis focuses on the matched dataset, i.e., 44,288 dwellings. Figure 7 shows the distribution of CO2 saving potential against current EPC ratings. It is observed that variation tends to increase with a decreasing rating. Properties in bands F and G offer individual dwelling opportunities to find considerable CO2 savings, with median values of 5.7 and 6.7 tonnes per year, respectively. However, if only one rating band implemented the recommendations, the largest cumulative impact would be for band D. Bands D and E together account for 70% of the total potential CO2 saving across the stock. This demonstrates that strategies targeting lower EPC groupings at scale are a viable route to facilitating impactful change. Insulation and DIY recommendations dominate in these bands (Figure 4(c)), highlighting that interventions where there is an ease of implementation (e.g. installing heating controls compared with a disruptive renewables installation) remain core to achieving carbon targets. CO2 saving potential per property (tonnes/year) across current EPC ratings. In the parentheses, the corresponding number of dwellings and total carbon saving potential is shown.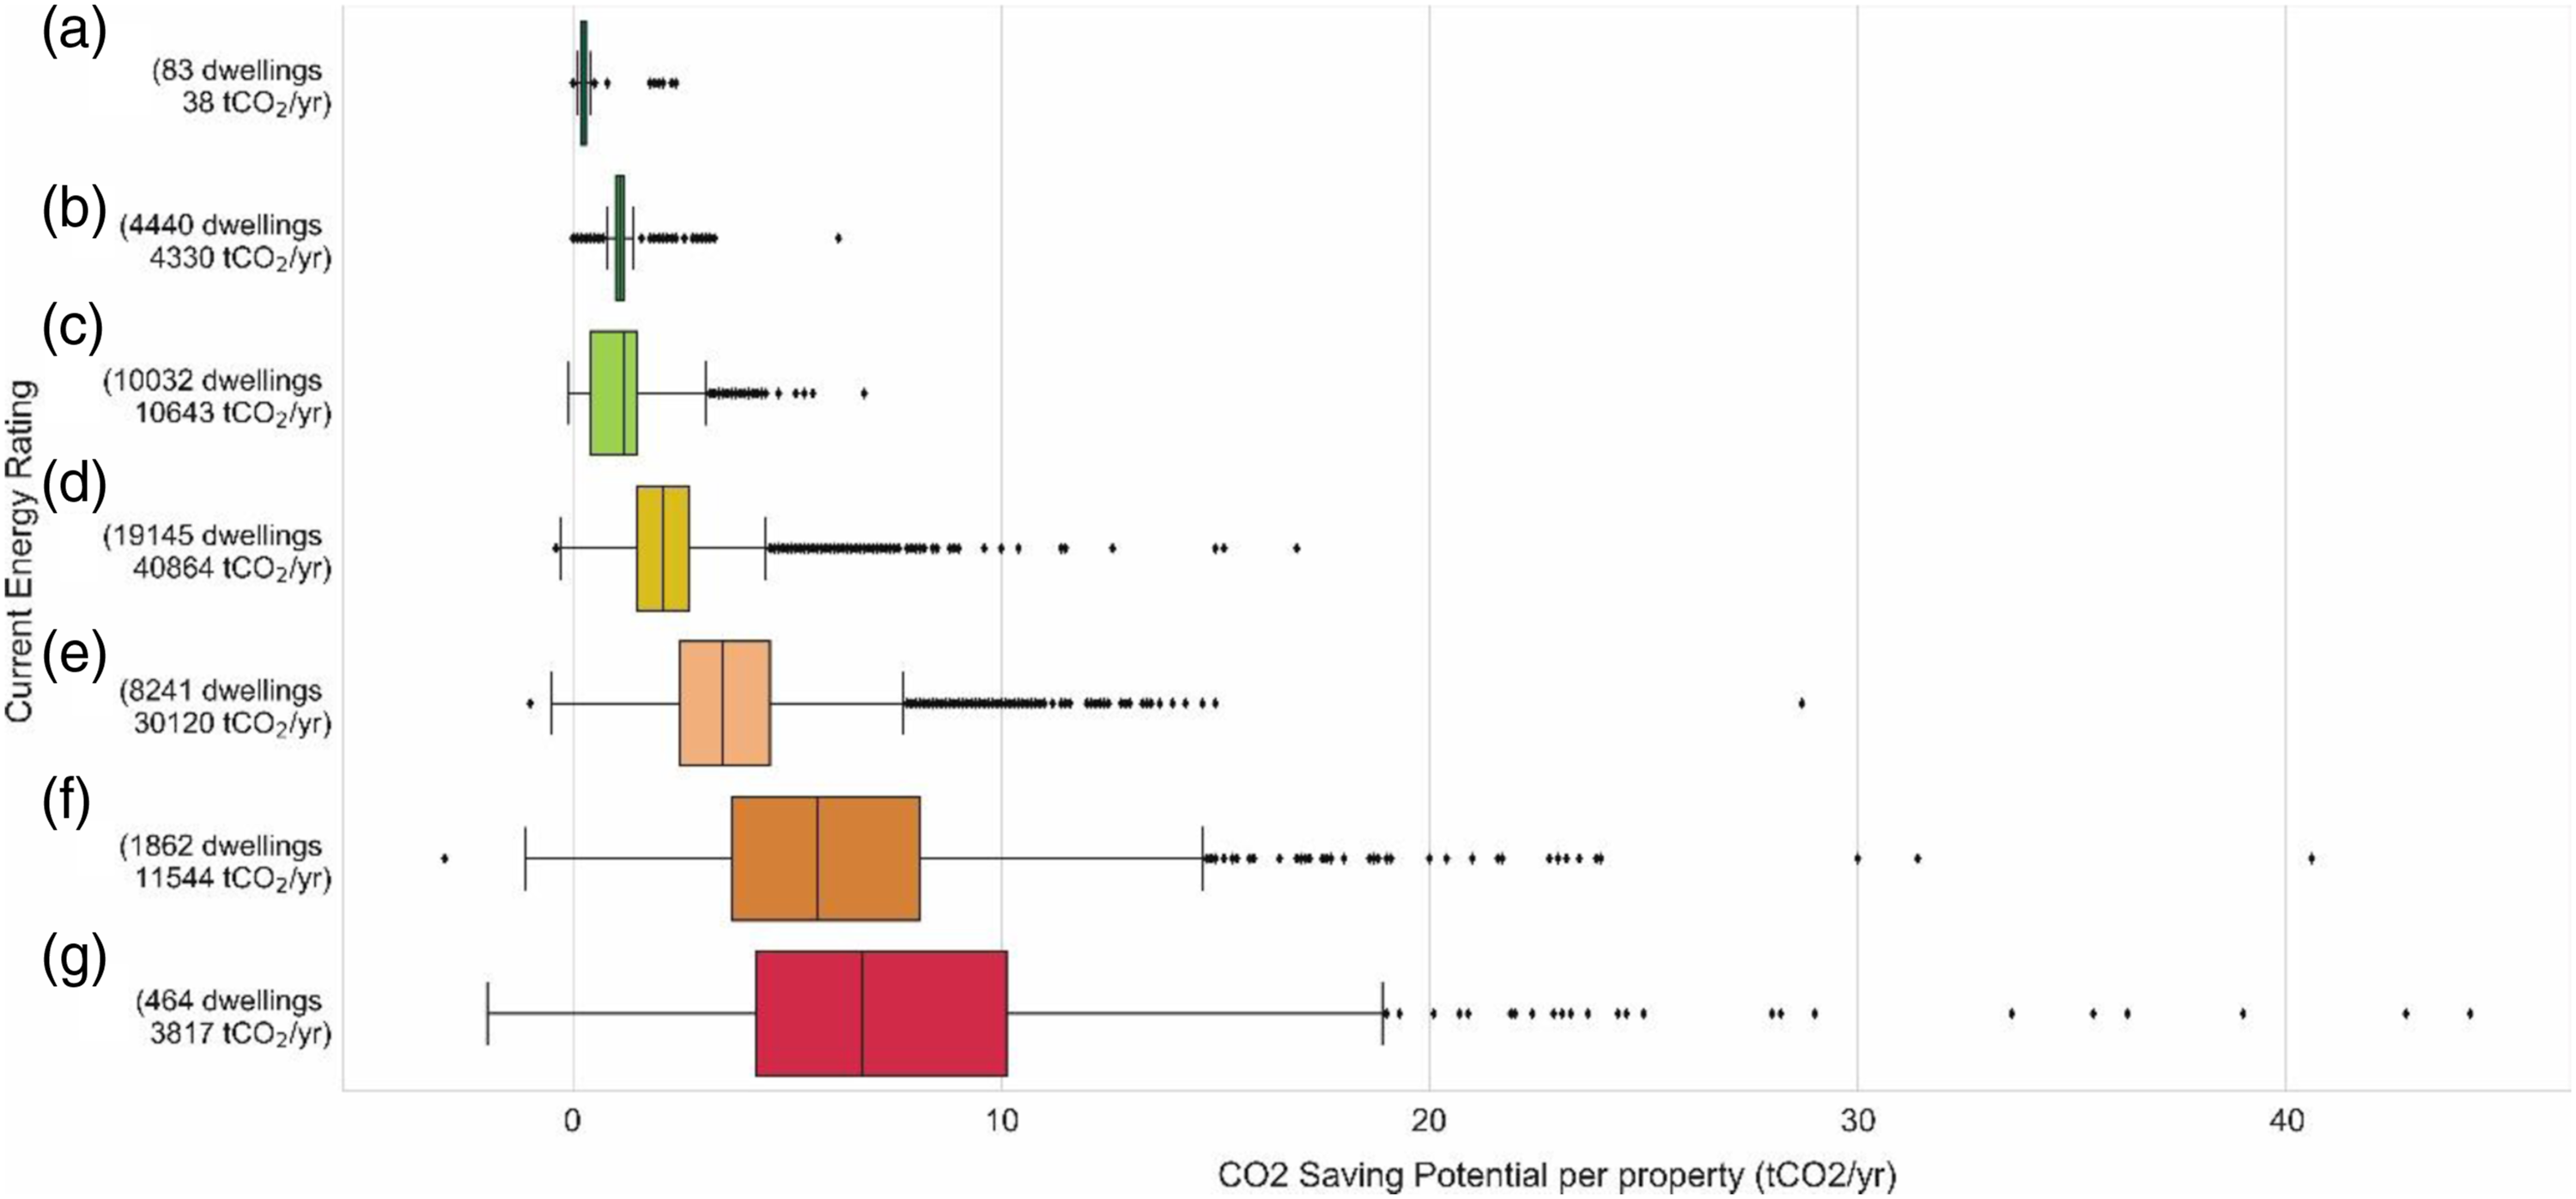
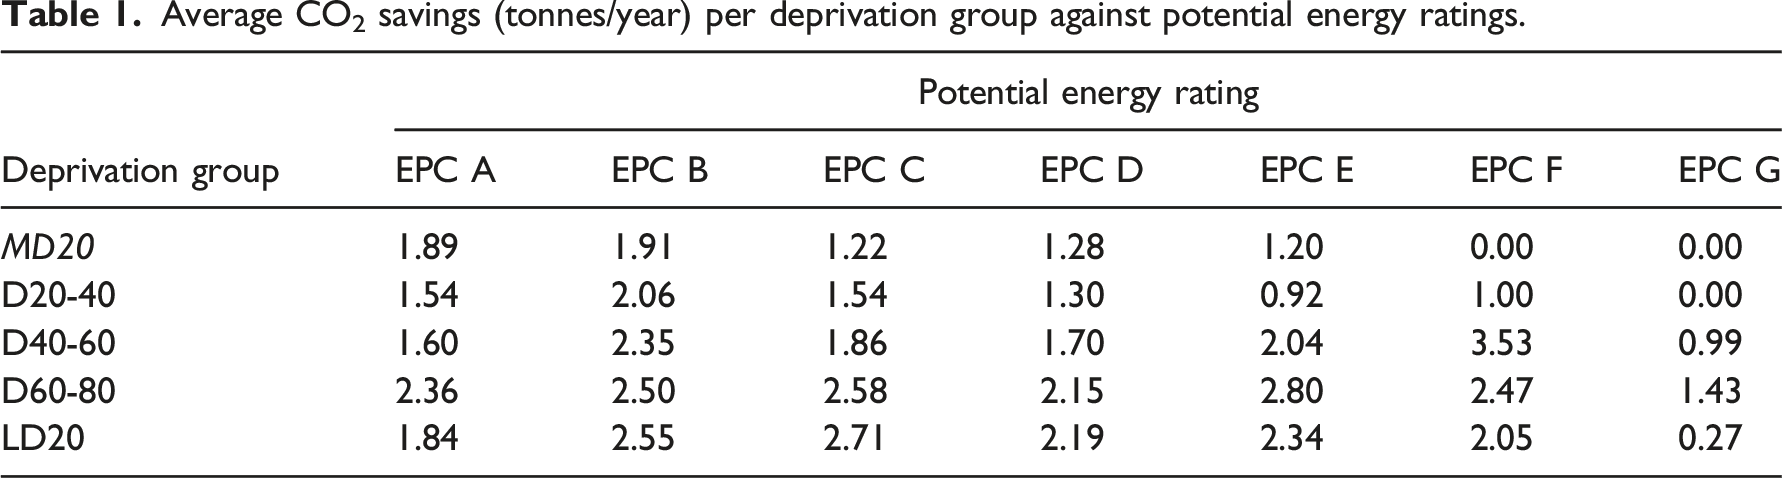
With EPC improvements via retrofit as core to many countries’ plans for meeting net zero targets, it is worth examining carbon savings by considering the potential EPC band for each dwelling after implementing all the retrofit recommendations. Focusing on the parts of the building stock with the potential to reach band C, it is estimated that houses could save about 27,000 tCO2/yr, while flats and maisonettes only 7,000 tCO2/yr and 1,400 tCO2/yr, respectively. In Figure 8, average carbon savings per dwelling and floor area against potential energy ratings are shown. On average, detached dwellings offer the greatest saving potential (3.7 tCO2 Average CO2 savings per dwelling (a) and floor area (b) against potential energy ratings for different property types.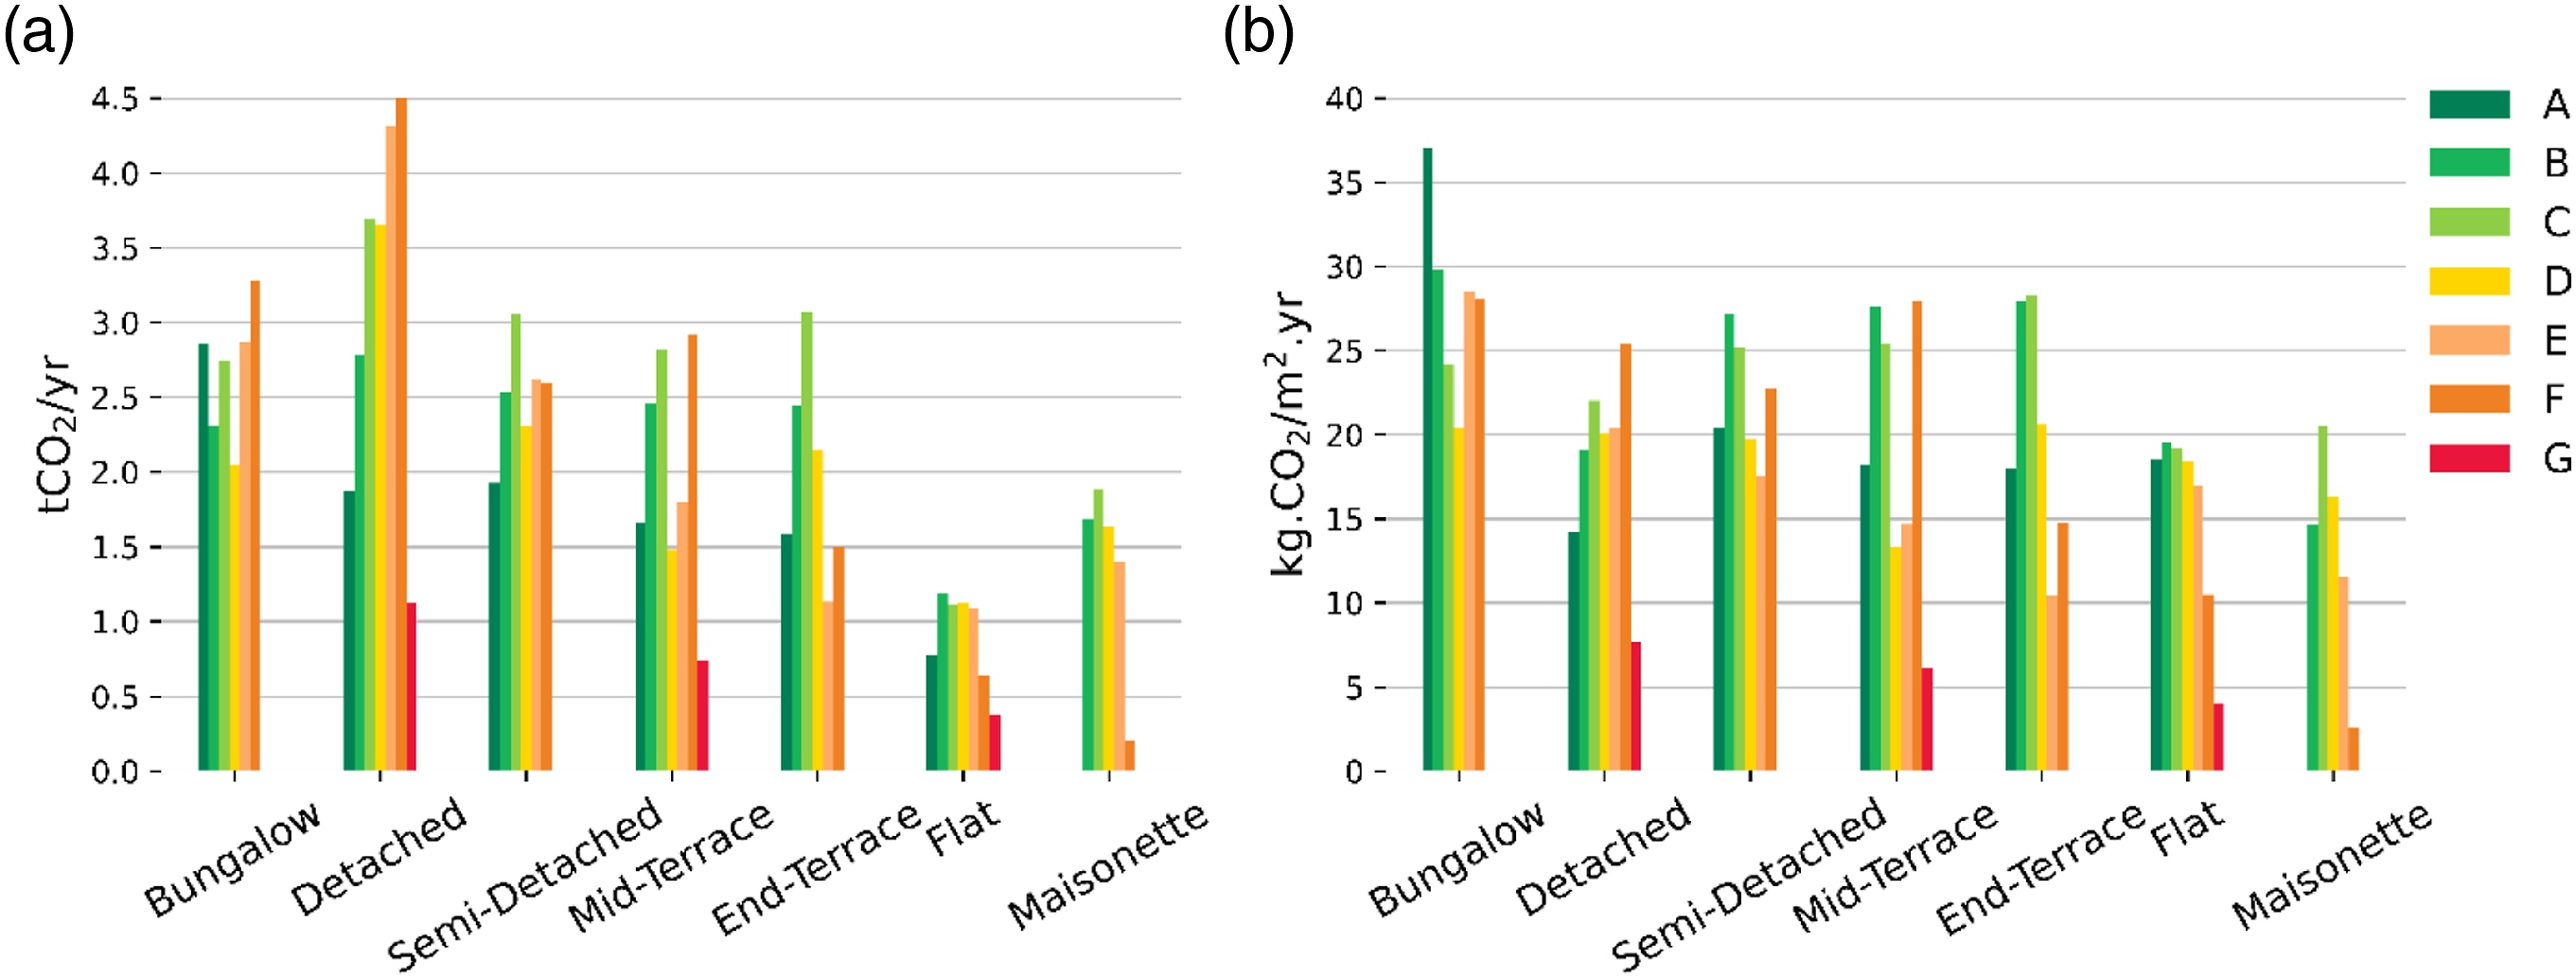
Average CO2 savings (tonnes/year) per deprivation group against potential energy ratings.
Cost implications
The analysis has shown that, based on the combined dataset of 44,288 dwellings, the total cost for upgrading dwellings with the potential to reach band C is £250 million. Upgrading dwellings with the potential to reach bands B and D would need a total of £382 million and £58 million, respectively. The average cost per property to reach band C is approximately £15,300, nearly double the £7,737 figure suggested in the most recent English Housing Survey 39. One reason for this discrepancy might be that about 63% of the uninsulated buildings in our working sample comprise solid walls, which are notably harder to treat and, thus, increasing insulation costs.
Figure 9 shows the average cost per dwelling and floor area against potential energy ratings and property type. On average, it costs less than half the amount to upgrade a flat or maisonette to band C (£9,000 and £10,000, respectively) compared to retrofitting a house (average value of £21,000). This is because the latter are usually less energy efficient (Figure 6) and have more windows and exposed surfaces that might need insulation. In addition, houses and bungalows are shown to be more often recommended renewables, leading to increased overall retrofit costs (Figure 4(a)). Average costs per dwelling (a) and cost per floor area (b) against potential energy ratings and different property types.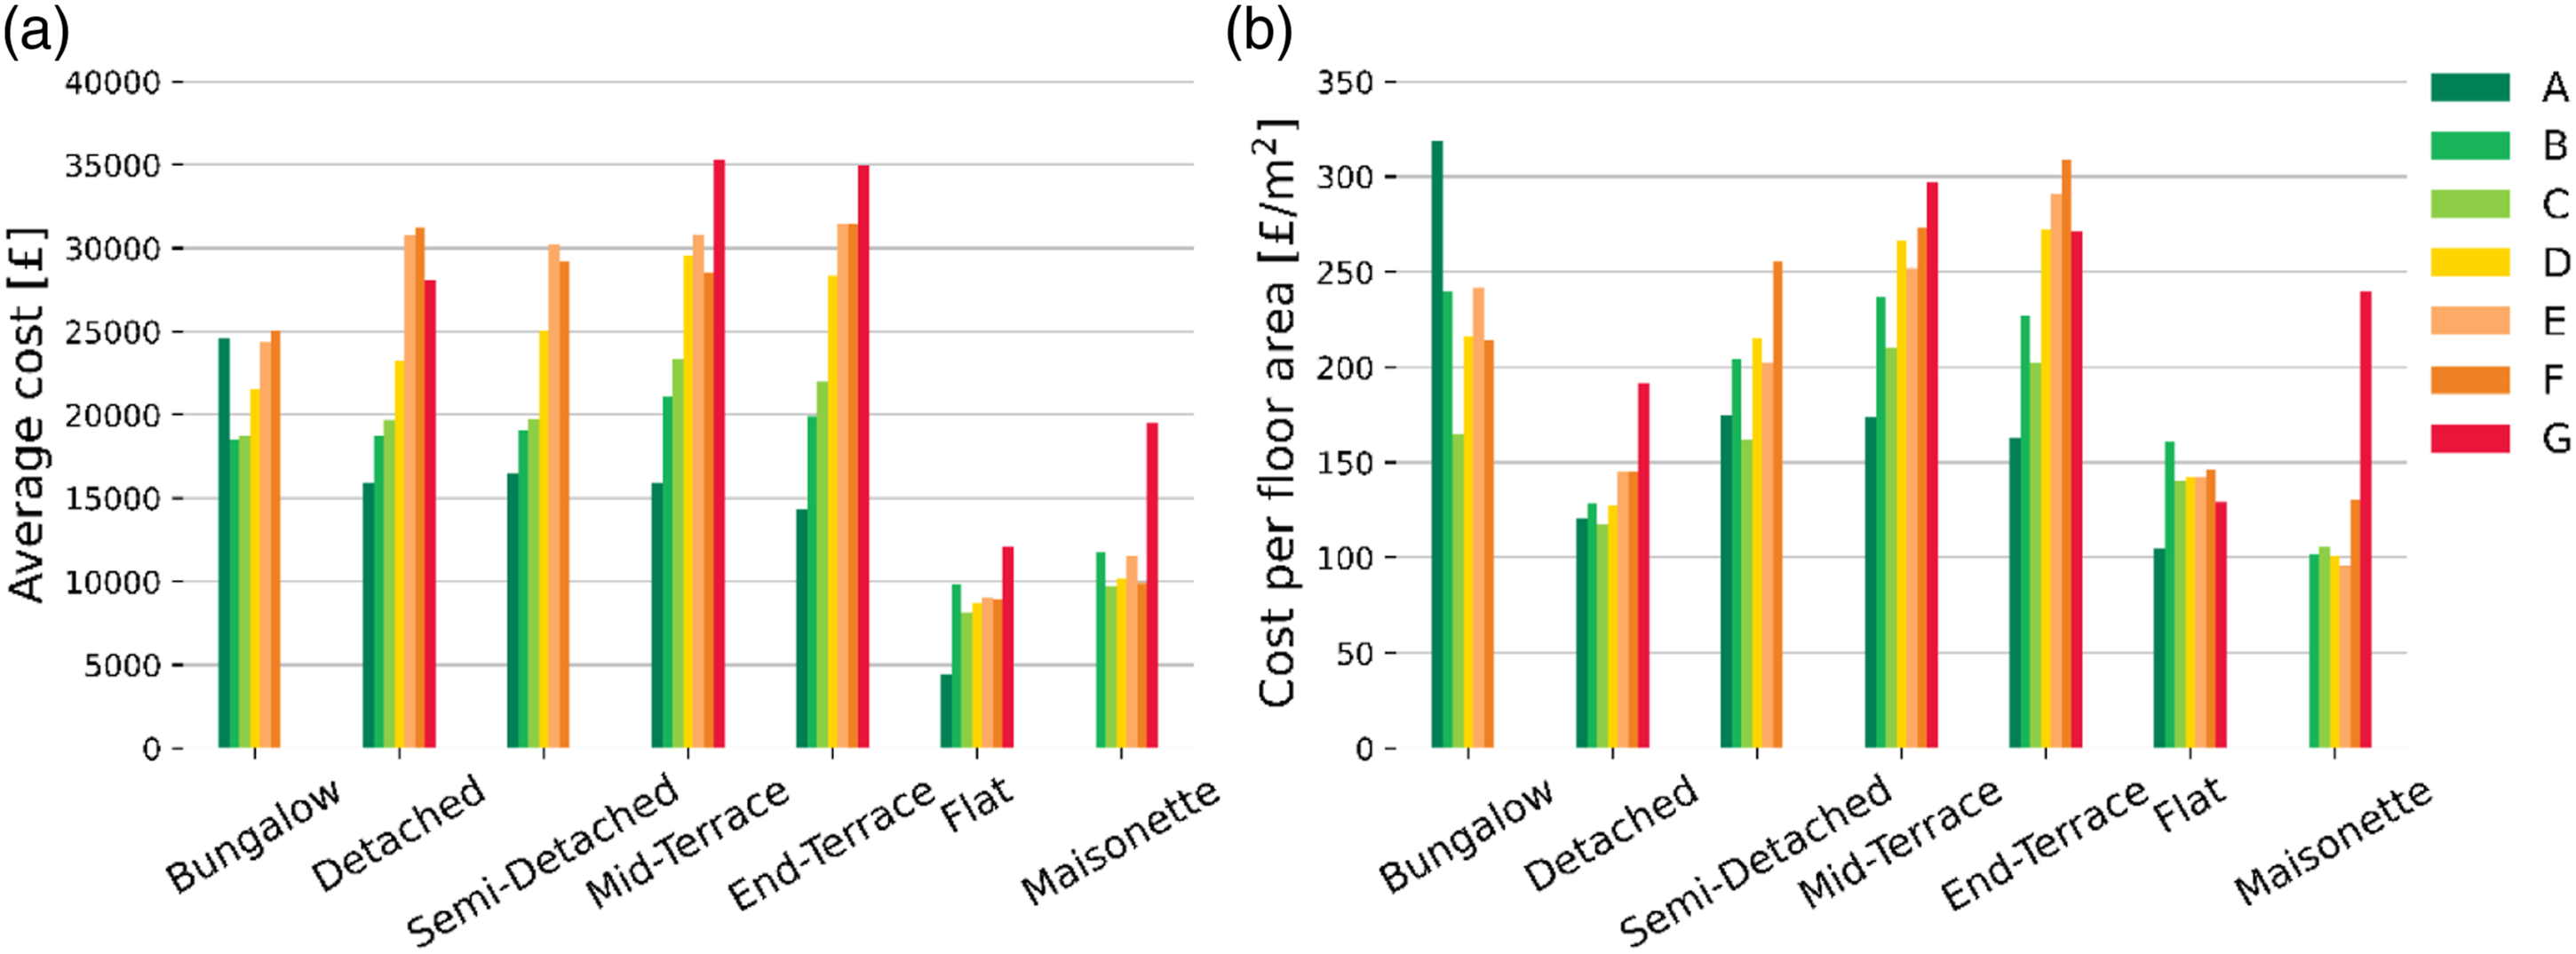
From a cost-per-floor-area perspective, flats and maisonettes remain the least expensive properties to upgrade, £140 and £106 per square metre for those with the potential to reach band C, respectively, whilst the average cost for houses and bungalows is £173 and £165 per square metre, respectively. Detached houses appear to be the most cost-efficient dwellings, with about £117 per square metre respectively for those upgrading to band C, whereas mid-terraces are the most expensive (£210/m2). This can be attributed to the large proportion of detached houses with cavity walls that are generally cheaper to insulate.
Overall, the dwellings with the potential to be rated C have the lowest associated cost per floor area, indicating that it is the most viable energy efficiency upgrade strategy. The higher cost for lower bands is likely because the least energy-efficient properties require a significant initial investment to move to higher bands, e.g. installing a boiler for the first time, external insulation, single-glazed windows replacement etc. On the other hand, the higher associated costs to reach bands B or A are probably linked to installing renewables, which usually require a large initial investment. This can be verified by looking at Figure 4(c), where the higher the current energy rating, the higher the chance a property is recommended to install renewables, again demonstrating that the fabric-first approach is more cost-effective.
Figure 10(a) shows the average cost per household to reach its potential rating for each deprivation group. Interestingly, the cheaper upgrades are, on average, for the dwellings able to reach band C regardless of the deprivation group. MD20 needs about £12,000 to reach band C, whilst the cost for the LD20 is, on average, £16,200. The D60-80 deprivation group would pay the most for an upgrade regardless of the potential band. Overall, the results in Figure 10(a) suggest that it is less expensive for the more deprived population to improve their homes’ energy efficiency. However, this trend reverses when converted to a cost per tonne of carbon savings, as depicted in Figure 10(b). Less deprived households, where CO2 saving potentials are highest (Table 1), are shown to offer the best return on money spent implementing the recommendations. For instance, the cost per tonne of CO2 savings for a property that can reach band C for MD20 is about £9,700, while for LD20 is only £6,000. Although upgrading a property that can reach band D can be less expensive for some deprivation groups, it offers the worst return on carbon savings. In addition, those properties that could be upgraded to band C offer similar returns on CO2 savings compared to band B, except for LD20 and D60-80, where it is more cost-efficient. (a) Average cost per property and (b) average cost per tonne of CO2 saving potential across the five deprivation groups for reaching EPC bands B, C and D.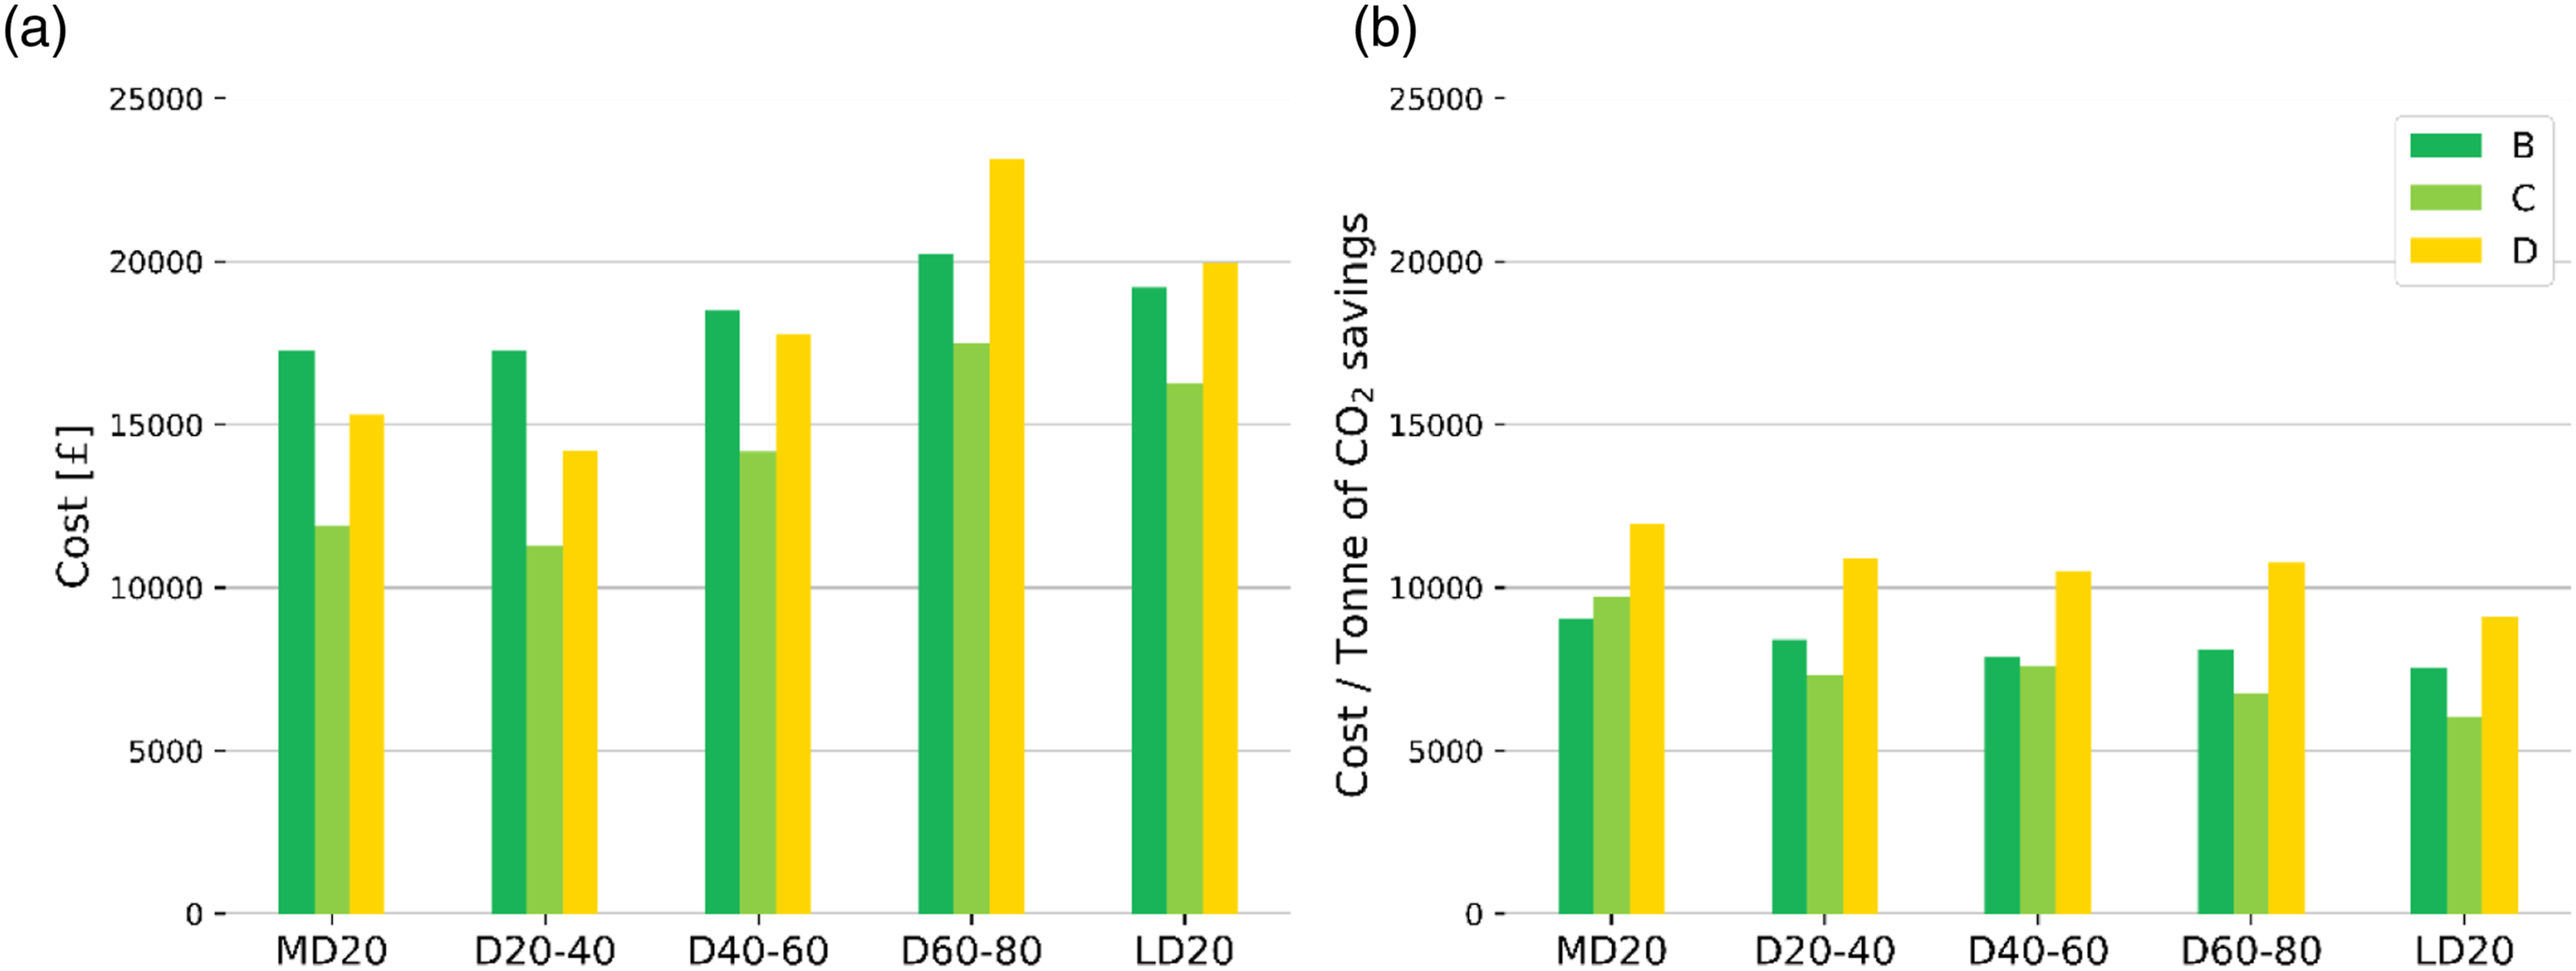
Focusing on upgrading stock with the potential to be band C, Figure 11 depicts the average cost per floor area against the five deprivation groups for different property types and only for dwellings with a potential band C. For bungalows and houses, retrofitting is more expensive in the most deprived households compared to the least deprived ones. The high peak of the MD20 bungalows is due to the small number of entries in the dataset. By contrast, improving the energy efficiency of flats and maisonettes costs less for the more deprived population. For example, for a flat in MD20, the cost is £93 per square metre, while for D60-80 and LD20 goes up to £127 and £137 per square metre, respectively. Maisonettes are even cheaper, with a maisonette in MD20 and LD20 costing about £36 and £113 per square metre, respectively. Figures in terms of total numbers can be found in Appendix A. Average cost per floor area (£/m2) for reaching EPC band C against the five deprivation groups and for different property types.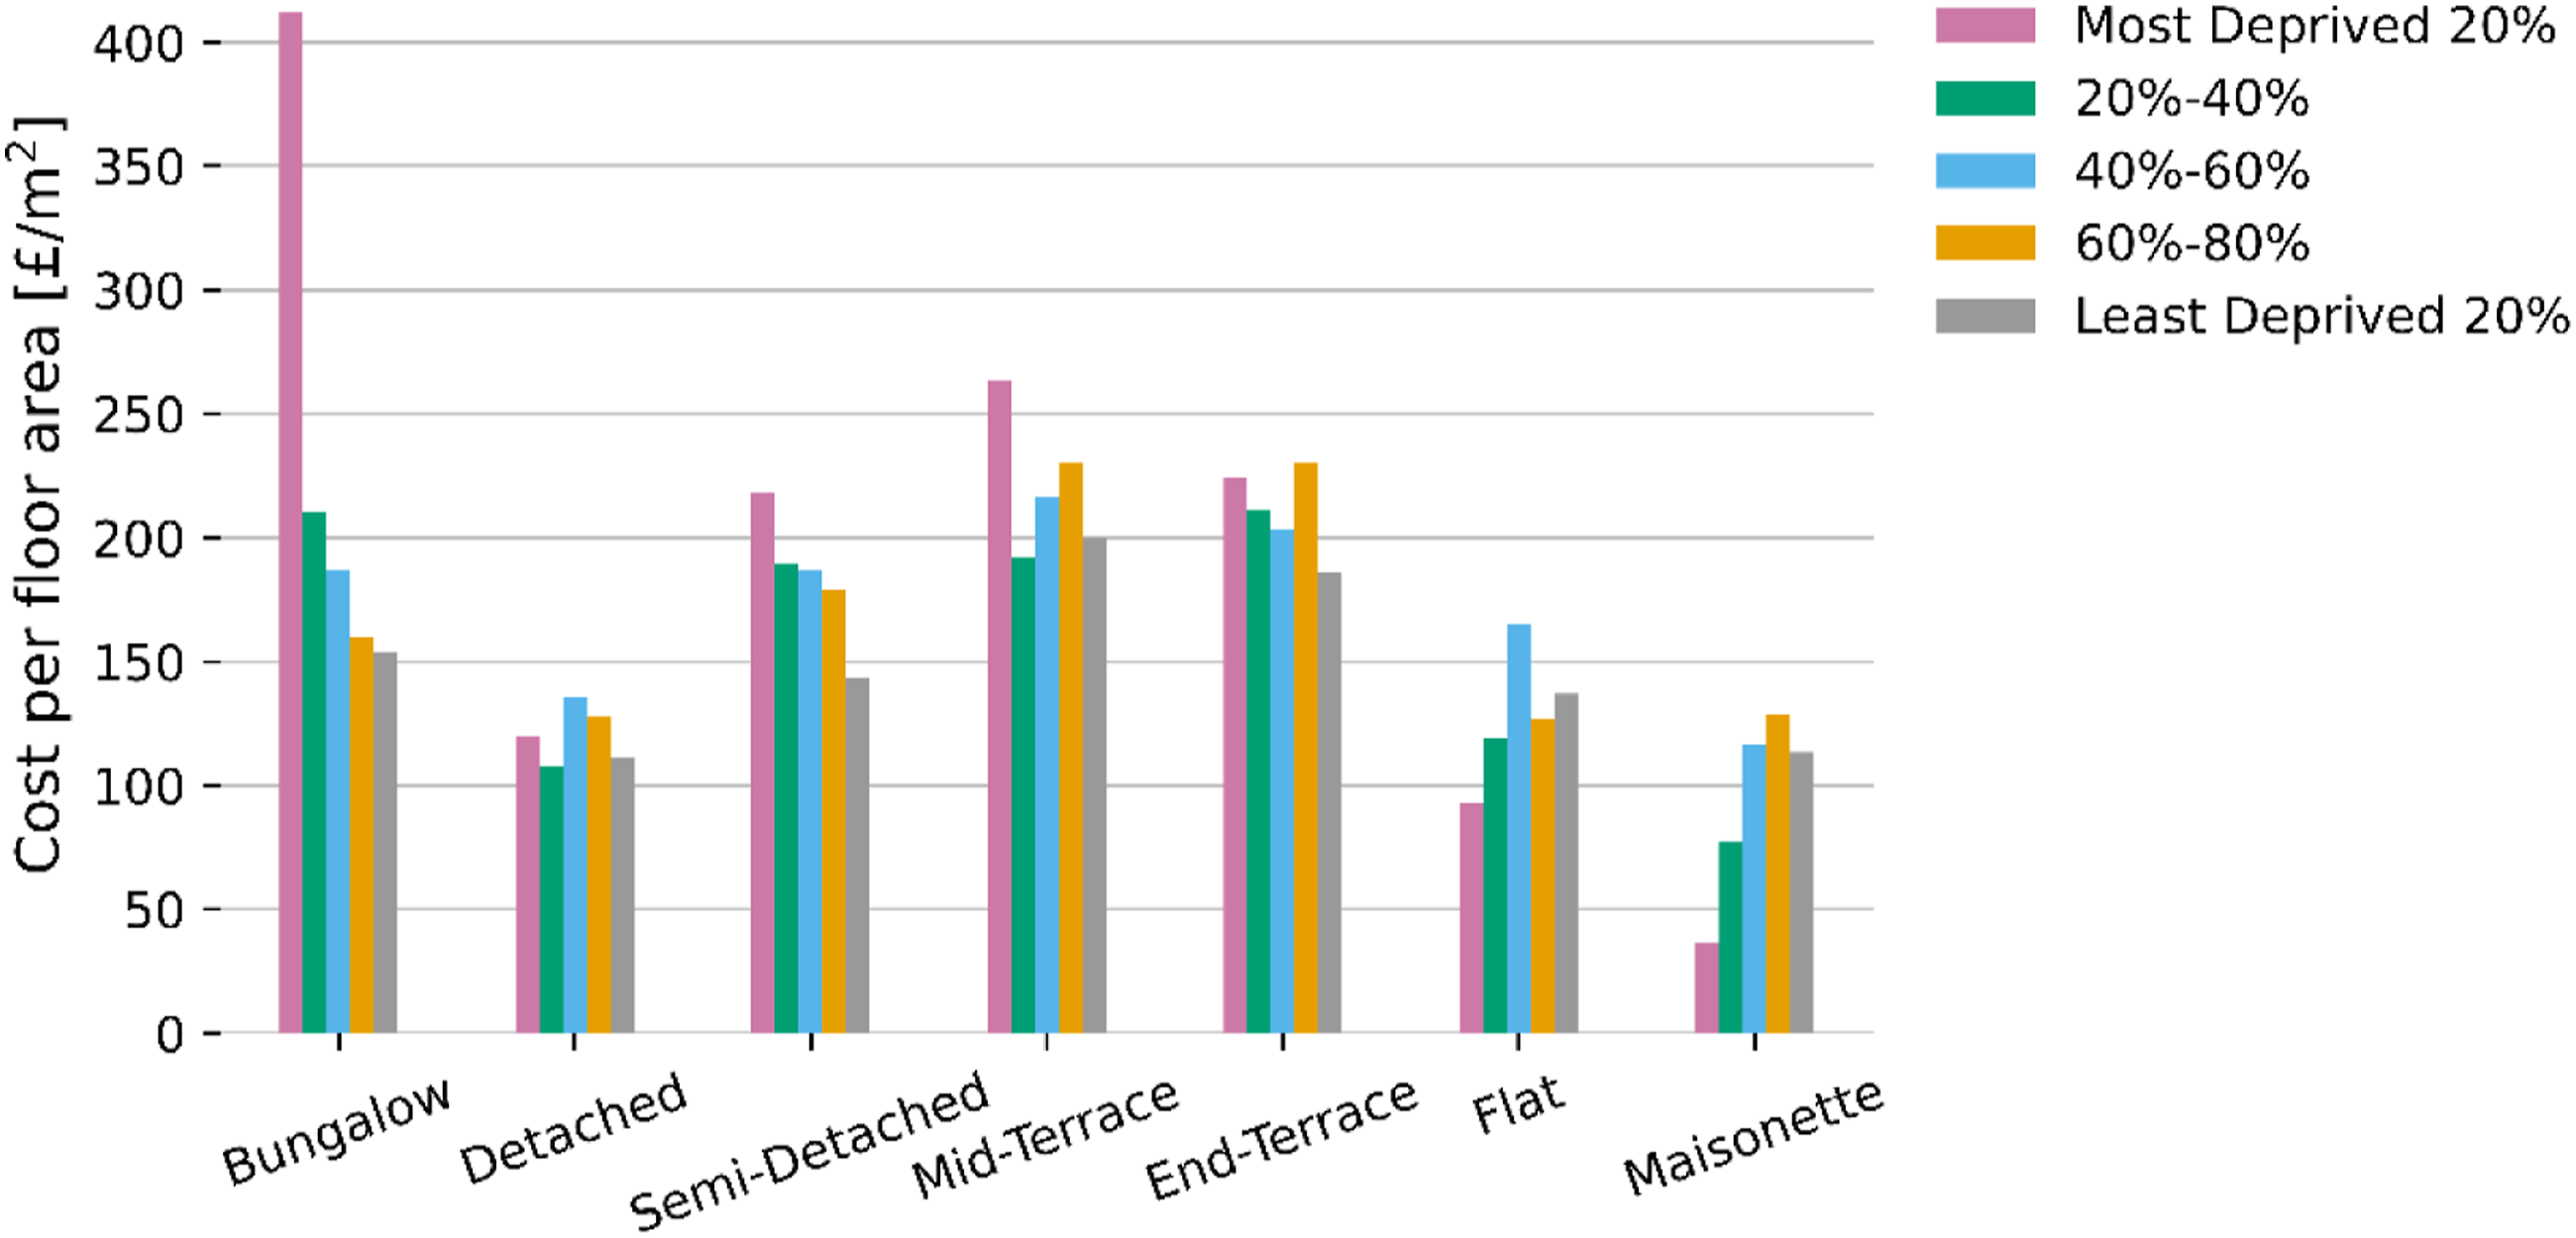
These results strengthen the argument for supporting the implementation of simple, cost-effective retrofitting via strategic action. More specifically, bringing properties to band C through a fabric-first approach and focusing on the least deprived is the most efficient strategy in terms of return in carbon savings on money spent. A growing number of studies attempt to explore policy implications of a just transition to net zero.53,54 Arguments around the relationship between eradicating fuel poverty and the impact on carbon emissions vary depending on the country and the efficiency of current practise.55,56 This study does not contradict the existing range of studies; it simply argues that from a carbon reduction perspective, attacking fuel poverty and reducing carbon emissions is not always optimal. Only through adopting a methodological approach similar to the one we propose here, one can develop policies that are tuned to the demographics of the stock.
Limitations and future work
The proposed method is directly applicable to the entire stock given the generalisable nature of EPCs to account for all building typologies. However, the study area is slightly distinct due to its higher proportion of less deprived households and its higher proportion of heritage stock, and hence the fraction of buildings with solid walls. Although the results are correct qualitatively and quantitively, EPCs are known to contain errors in various degrees depending on the region or the type of dwelling57,58 and hence it is difficult to know the precision of some of our estimates. For instance, it has been shown that in the UK, some homes may have been erroneously assigned to the wrong EPC band. 57 Other studies have demonstrated, and as mentioned above, that EPCs tend to overestimate energy use, particularly in the case of lower-rated homes. 42 Treatment of these errors via machine learning techniques as proposed by Hardy and Glew 57 would be an interesting avenue for future research. In addition, the recently updated SAP methodology (SAP 10.2) has seen a reduction in the carbon emissions associated with electricity use.
Conclusions and policy implications
Decarbonising the built environment is at the heart of many nations' pathways to achieving net zero, including EPC band updating via retrofit as a core initiative. There is a need to address the conflict between the setting of net-zero strategies and the reality of delivering EPC band upgrades by producing policy responsive research. This study seeks to majorly advance activity in this area by introducing a new statistical approach for leveraging EPC data to extract useful information and offer more targeted retrofit strategies for governments. The main aim was to interrogate EPC data from a new perspective and explicitly consider and link carbon and deprivation indices as essential factors for improving building energy efficiency. This data analysis is based on a large sample of 44,300 dwellings for the UK city of Bath and its neighbours.
Our analysis suggests that a more successful retrofit strategy can be produced with more focus on the least deprived areas of the region, as they present more than double the carbon saving potential compared to the most deprived, but also offer the best return in carbon savings on money spent implementing the recommendations. The key message is that if carbon reduction is the urgent need, rather than addressing fuel poverty, the targeted population needs to vary depending on the demographics of the region, and the traditional approach of automatically targeting the less well-off potentially can be misplaced. This information can be used by governments to target retrofitting initiatives and fully comprehend the varying cost impacts the retrofits signify for different households.
Footnotes
Acknowledgments
The authors express their gratitude to B&NES Council for their collaboration and feedback on this research. In particular, we would like to thank Chris Mordaunt, Housing Services Team Manager, and Natalia Urry, Business Intelligence Officer, for their valuable contributions.
Declaration of conflicting interests
The author(s) declared no potential conflicts of interest with respect to the research, authorship, and/or publication of this article.
Funding
The author(s) disclosed receipt of the following financial support for the research, authorship, and/or publication of this article: This study is supported by Research England SPF 20/21 ‘Socio-Technological Routes to Building Stock Decarbonisation across B&NES’ and PSF 21/22 ‘Net-zero Buildings via EPC Upgrading: Deriving Innovation to Ensure Local Impact’.
Appendix
The following tables present the total costs associated with bringing properties to bands B, C and D for each deprivation group but also the average cost per property for reaching band C as per current UK plans.
Cost associated with different deprivation groups to reach EPC bands B, C and D.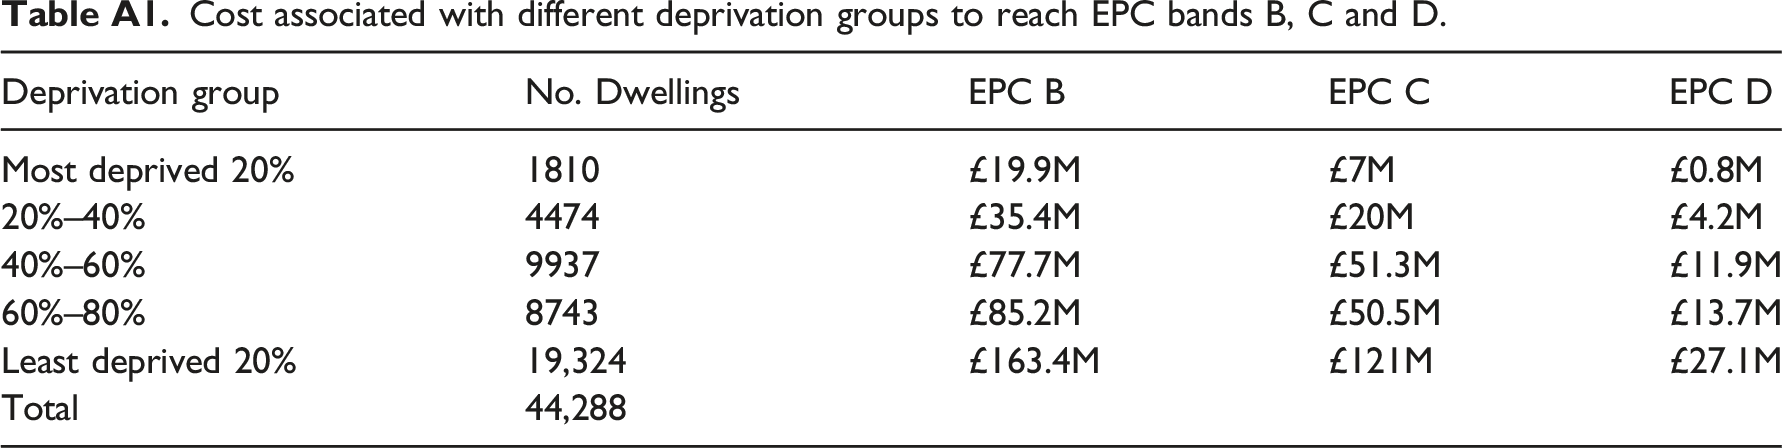
Deprivation group
No. Dwellings
EPC B
EPC C
EPC D
Most deprived 20%
1810
£19.9M
£7M
£0.8M
20%–40%
4474
£35.4M
£20M
£4.2M
40%–60%
9937
£77.7M
£51.3M
£11.9M
60%–80%
8743
£85.2M
£50.5M
£13.7M
Least deprived 20%
19,324
£163.4M
£121M
£27.1M
Total
44,288
Average cost per property for reaching band C across different deprivation groups and property types.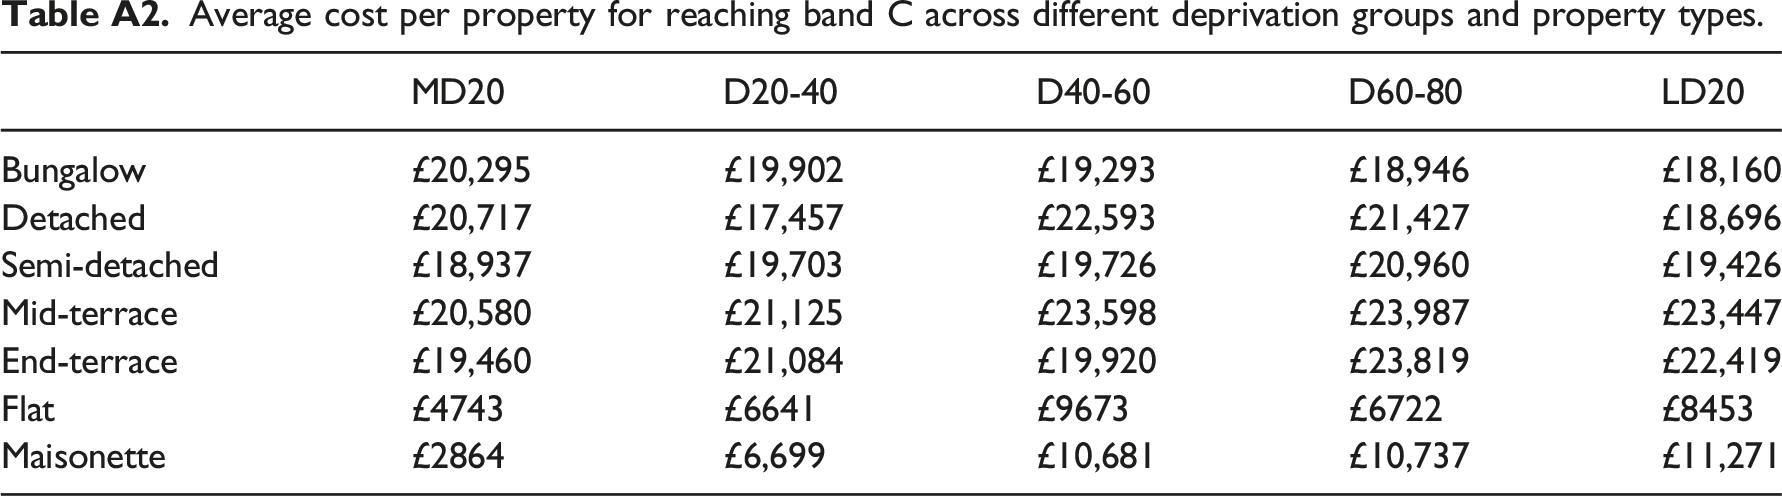
MD20
D20-40
D40-60
D60-80
LD20
Bungalow
£20,295
£19,902
£19,293
£18,946
£18,160
Detached
£20,717
£17,457
£22,593
£21,427
£18,696
Semi-detached
£18,937
£19,703
£19,726
£20,960
£19,426
Mid-terrace
£20,580
£21,125
£23,598
£23,987
£23,447
End-terrace
£19,460
£21,084
£19,920
£23,819
£22,419
Flat
£4743
£6641
£9673
£6722
£8453
Maisonette
£2864
£6,699
£10,681
£10,737
£11,271