
Abstract
Energy Performance Certificates (EPC) are used across Europe to communicate the energy performance of buildings to a range of different end users. However, as new approaches are introduced and guided at the European level via the Energy Performance Buildings Directive (EPBD), the ability of assessment methodologies and assessors to accommodate these new forms is likely to differ due to the significantly different frameworks in each country. The Horizon-funded crossCert project investigates this by identifying how EPC methodologies differ across countries, highlighting the implications of these differences on the performance gap and what that means for future innovations. Results indicate that methodologies vary considerably regarding general approaches, from highly standardised to highly tailored and assessor qualifications. This paper will look at such differences and investigate how these differences can affect future efforts towards improving EPCs.
Keywords
Introduction
Energy Performance Certificates (EPCs) are essential sources of information regarding the energy performance of the building stock. Although EPCs were initially introduced for compliance purposes, they are now used for various purposes with regulatory implications and are crucial in implementing governments’ policies on energy efficiency in the building sector. Across the European Union (EU), the Energy Performance of Buildings Directive (EPBD) is the primary legislative tool setting the general outlines of regulations concerning EPCs. 1 In the 2024 recast of the EPBD, 1 the European Commission has emphasised the need for improved EPC schemes to ensure the best possible evaluation of the actual energy performance of buildings in terms of their construction and operation. In addition, the recent recast of the EPBD has implemented a harmonised template for EPC scales and an EU-wide minimum energy performance requirement. These new regulations have encouraged significant research efforts focused on harmonised next-generation EPCs to address the limitations of current approaches and support the transition to a low-carbon building stock. Some of the key features of next-generation EPCs include attempts to understand the smart readiness of buildings, 2 occupant comfort, 3 and indoor air quality. 4
Several Horizon 2020 projects have been launched addressing concepts related to the next generation of EPCs. A few example projects include UCERT, 5 D2EPC, 6 QualDEPC 7 and crossCert. 8 The “crossCert” project aims to explore differences between EPC methodologies across Europe and the impacts of these differences on the integration of next-generation EPCs in different countries and the harmonisation efforts. The methodologies studied in this project include Austria, 9 Bulgaria, 10 Denmark, 11 Greece, 12 Malta, 13 Poland, 14 Slovenia, 15 Spain, 16 and the UK.17,18
One of the main issues reported about the EPCs is that they don’t reflect the actual building.4,19,20 The difference between measured and modelled energy consumption is referred to as the performance gap. Despite their original purpose of being compliance and comparative tools, the increasing reliance on EPCs as the basis for new regulations around energy consumption in the building stock has increased attention to the performance gap issue. Investigating the performance gap in different methodologies is not only helpful in highlighting accuracy issues, but it can also inform the harmonisation efforts, where the consistency of EPC frameworks is central.
Some next-generation EPC initiatives proposed to address the issue of the performance gap in EPCs include using dynamic simulation 21 and empirical data-based indicators. 22 While some countries have already implemented these measures in their national methodology, most use other approaches. This paper discusses the differences in details of calculation methodologies that could contribute to the performance gap.
Various aspects of a model can contribute to larger performance gaps. Due to the original purpose of EPCs, standardisation has been applied to various model parameters in most methodologies. More standardised methodologies benefit from using default values and schedules for multiple inputs to the model, such as building envelope parameters, ventilation and infiltration rates, HVAC system specifications and operation times, and occupant-related inputs (including occupancy and lighting/appliance usage), making modelling more straightforward for assessors. However, other methodologies aim to create a more accurate model of the building by mainly using tailored inputs and realistic schedules. In addition to the details of calculation inputs, when studying the performance gap, attention must be paid to the energy consumption categories considered by each country for the indicators they provide on their EPC certificates.
Another aspect of the methodologies compared here is the assessors’ training and education background requirements. While most countries expect a particular educational background prior to training to become an EPC assessor, the level of this background varies from country to country. This variation is expected due to differences in country methodologies, affecting how each country adapts to the next generation EPC methodologies. In order to provide a better picture of the comparisons, a quantitative study has also been performed on the performance gap of a sample of buildings across the crossCert partner countries, and the relationship between the standardisation level and assessor background to the performance gap have been explored.
Additionally, the challenges of integrating next-generation EPC innovations with current methodologies, designed to reduce the performance gap (including dynamic simulations and operational ratings), are explored.
Methodology
This study is based on some of the results of the crossCert 8 project. The methodology includes several steps, which can be summarised as collecting information about country methodologies, qualitative comparison of various aspects of the collected information, collecting energy consumption and EPC data for 65 case study buildings from the project partners, calculating the performance gaps, and analysing the results.
The first step in the methodology was gathering information about EPC methodologies in crossCert partner countries. This was achieved using desk research and using a questionnaire. Due to language barriers and limited access to some methodology manuals, a questionnaire was used to complement the findings from desk research. The questionnaire included questions covering general methodology approaches such as the approach to zoning, calibration, energy categories, and rating types, as well as the details regarding occupant behaviour, building envelope parameters and the use of databases within the software. The questionnaire document was sent to all partners via email. Due to the nature of the questions, most answers were descriptive and allowed for a qualitative comparison, except for the information provided regarding temperature setpoints. The results of the comparison are then used to categorise the methodologies based on the general approach and assessor education requirements.
In the next step, the partners were asked to provide data about their case study buildings for the performance gap analysis. The provided data included EPC certificates and measured annual energy consumption values for 65 buildings across nine partner countries (all crossCert countries except for Austria, for which enough data was not available). The performance gap values were then calculated using equation (1). The relationship between the performance gap and the methodology categories is then explored.

The performance gap
The performance gap is an intrinsic issue of every building model23,24 and EPCs are no exception, particularly as EPCs were initially meant to benchmark the energy performance of buildings across countries and measure compliance with regulations. However, EPCs are used for other purposes, which has led to considerable attention towards improving the performance gap and creating next-generation EPCs that reflect the building operation more accurately. 19 In an EPC model, there are numerous variables and inputs that can impact the performance gap. The crossCert project examines how each partner country deals with these details in their methodology and whether any differences result in varying magnitudes of the performance gap. In this section, a review of these approaches is presented. It is worth mentioning that in regard to the UK, whilst there are differences between the EPC methodologies for non-residential buildings in England, Wales 25 and Scotland, 18 the details studied in this paper are similar across all these methodologies (unless mentioned) and therefore referred to as the UK methodology.
U-values and infiltration rates
In most target countries, thermal transmittance of materials (i.e. U-values) is either calculated by the EPC software using a library of commonly used materials or taken from national databases of default values for common structure types in a country. The assessor collects the necessary information about the construction material during a site visit, using building drawings or other documents such as wall construction certificates (in the case of Denmark) and uses the software library for calculating the U-values. For most countries, a database of common construction types is also implemented in the EPC calculation software. Exceptions are Bulgaria and the methodology for residential buildings in Malta. The assessors using these methodologies must calculate U-values separately using information from other official resources and enter the results into the software. Some countries also allow the estimation of building envelope parameters, including U-values and G-values, using general characteristics about the building, such as building age or use type. Spain and the UK use such a feature for existing buildings, inferring values based on the building sector, climate zone and the building regulations that were in use at the time of construction.
Infiltration rates are treated similarly. EPC methodologies of most studied countries require the assessors to perform a pressure test to measure the infiltration rate. Where testing is not possible, some methodologies provide default values based on various building characteristics. The default infiltration rates in Austria depend on building type, in Denmark on the level of weatherproofing of the building, 26 and in Poland, Greece, Malta, Spain and the UK on the construction year. For the UK, this only applies to existing buildings, and it is mandatory for the assessor to measure the infiltration rate on-site for new buildings.17,18 In the Bulgarian methodology, if testing is not possible, assessors use infiltration rate values based on their experience and adjust them during the mandatory calibration step against measured energy consumption data.
Heating, ventilation and cooling
In most of the studied methodologies, the assessors must collect the specifications of the system details using manufacturer documents or equipment nameplates during a site visit. The level of detail required in this stage varies across countries. While most countries require a combination of overall system efficiency parameters such as the Coefficient of Performance (COP), EER (Energy Efficiency Ratio), and SEER (Seasonal Energy Efficiency Ratio), others require more data. An example is defining boilers in the Slovenian methodology, which requires the heating power and efficiency at 30% operation and the heat loss in the standby mode.
When the required data is not available, Austria, Denmark, Greece, Malta (only for non-residential buildings), Poland, Slovenia, and the UK methodologies provide default values in the software or in a separate database, which can be used in the calculations instead of the actual values. These values are selected based on characteristics such as system type, range of system power, device manufacturing date, etc. In Bulgaria, the assessor must measure device performance on-site if they don’t have access to the system details. Spain also doesn’t allow the use of default values for HVAC systems. The only exception is cases where the installed HVAC system doesn’t meet the necessary setpoint temperatures, for example, in older buildings with no installed heating systems.
For ventilation rates, most countries provide databases of minimum default values based on activity types in their software. Bulgaria is an exception, where in the absence of design data, the assessor must measure ventilation rates on-site. In practice, however, this is usually not the case. Due to the low cost of EPC assessments, ventilation rates are usually adjusted in the model during the calibration step.
In all of the crossCert partner countries, except for Bulgaria (for certain building types), default temperature setpoints are used in EPC calculations. These default values are not similar across countries and reflect country-specific norms of temperature settings in buildings. To illustrate these differences Figure 1 shows a comparison of temperature setpoints used in residential building assessments for the countries included in this study. It is worth noting that in the Croatian methodology, two different temperature setpoints for the cooling season are defined, one for coastal Croatia (24°C) and one for continental Croatia (22°C).
27
Temperature setpoints for residential buildings.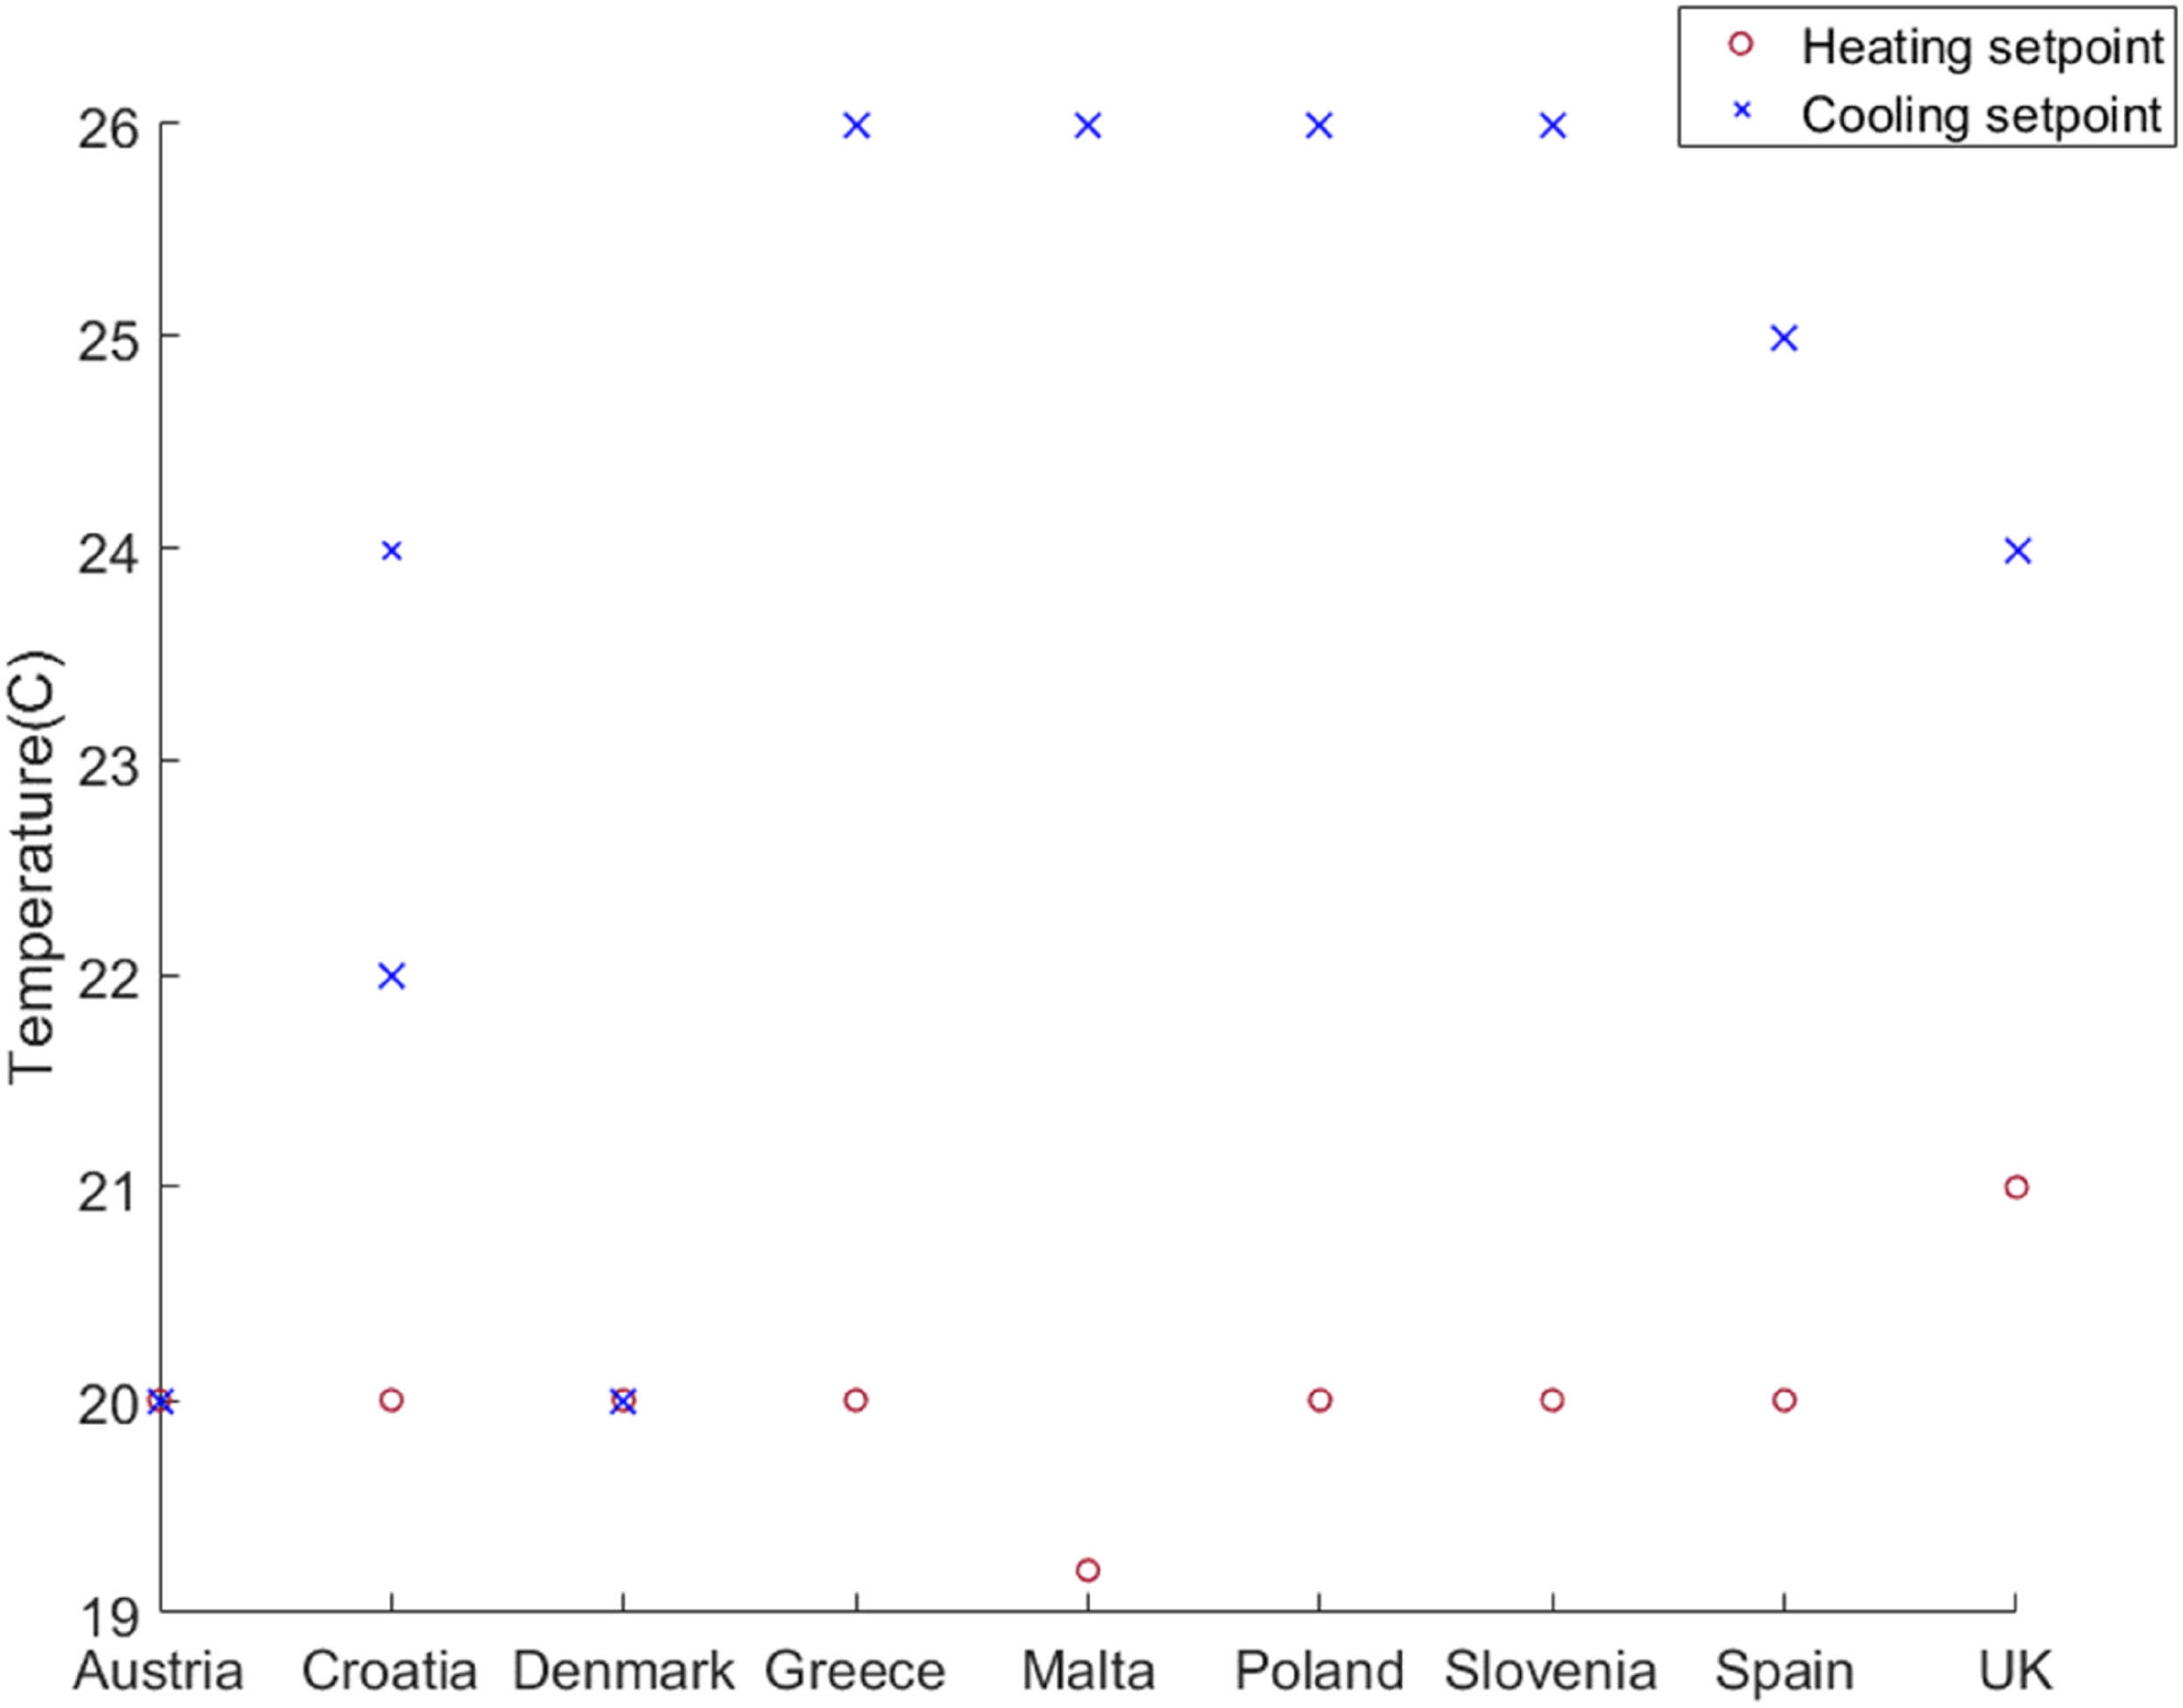
Non-residential building methodologies often set temperature setpoints based on activity types. Different countries have different approaches to this. In Greece, default values are based on the overall building use types, whereas in Slovenia, Malta, and the UK, setpoints are linked to zone activity types, for example office, circulation area, etc. Poland sets temperature setpoints based on the level of physical activity (seated, standing, walking) and clothing type. Denmark uses a different approach, where temperature setpoints are linked to building control type instead of activity. Austria and Spain, on the other hand, use fixed setpoints regardless of activity or building type.
Schedules
In most of the studied countries, it is mandatory for the assessors to use pre-defined schedules in EPC calculations in order to standardise and facilitate better comparisons between buildings. Exceptions to this approach are Bulgaria, Poland and Slovenia. Bulgaria and Poland leave it up to the assessor to collect the necessary information during site visits or use their professional judgment. Slovenia provides default schedules for various activities but allows the assessor to override these and use customised profiles based on the actual building activity. Spain also allows the use of actual schedules for HVAC operation for non-residential building assessments.
Energy categories and EPC indicators
When studying the performance gap and comparing EPC information to measured energy data, it is crucial to note the differences in indicators and energy categories countries use in their EPC assessments.
Some countries only provide primary energy consumption, while others offer more detailed information including total final energy consumption as well as values for energy consumption of various building services such as heating, cooling, domestic hot water and lighting.
Annex I of the EPBD 1 requires countries to use “a numeric indicator of primary energy use in kWh/(m2. y)” to express building energy performance. While all of the crossCert countries comply with this requirement and include a form of primary energy use on their certificates, there are still variations which can impact how the performance gap is defined. For example, in some countries such as Denmark, Austria, Slovenia and Croatia, the EPC indicator is based on heating energy consumption, making it possible to calculate the performance gap solely for the heating energy where heating is supplied and measured externally (such as using district heating). Or EPCs for non-residential buildings in England and Wales 25 only include the carbon emissions indicator, which is based on the primary energy value, making it impossible to calculate the performance gap based on final energy values for buildings using two or more energy carriers.
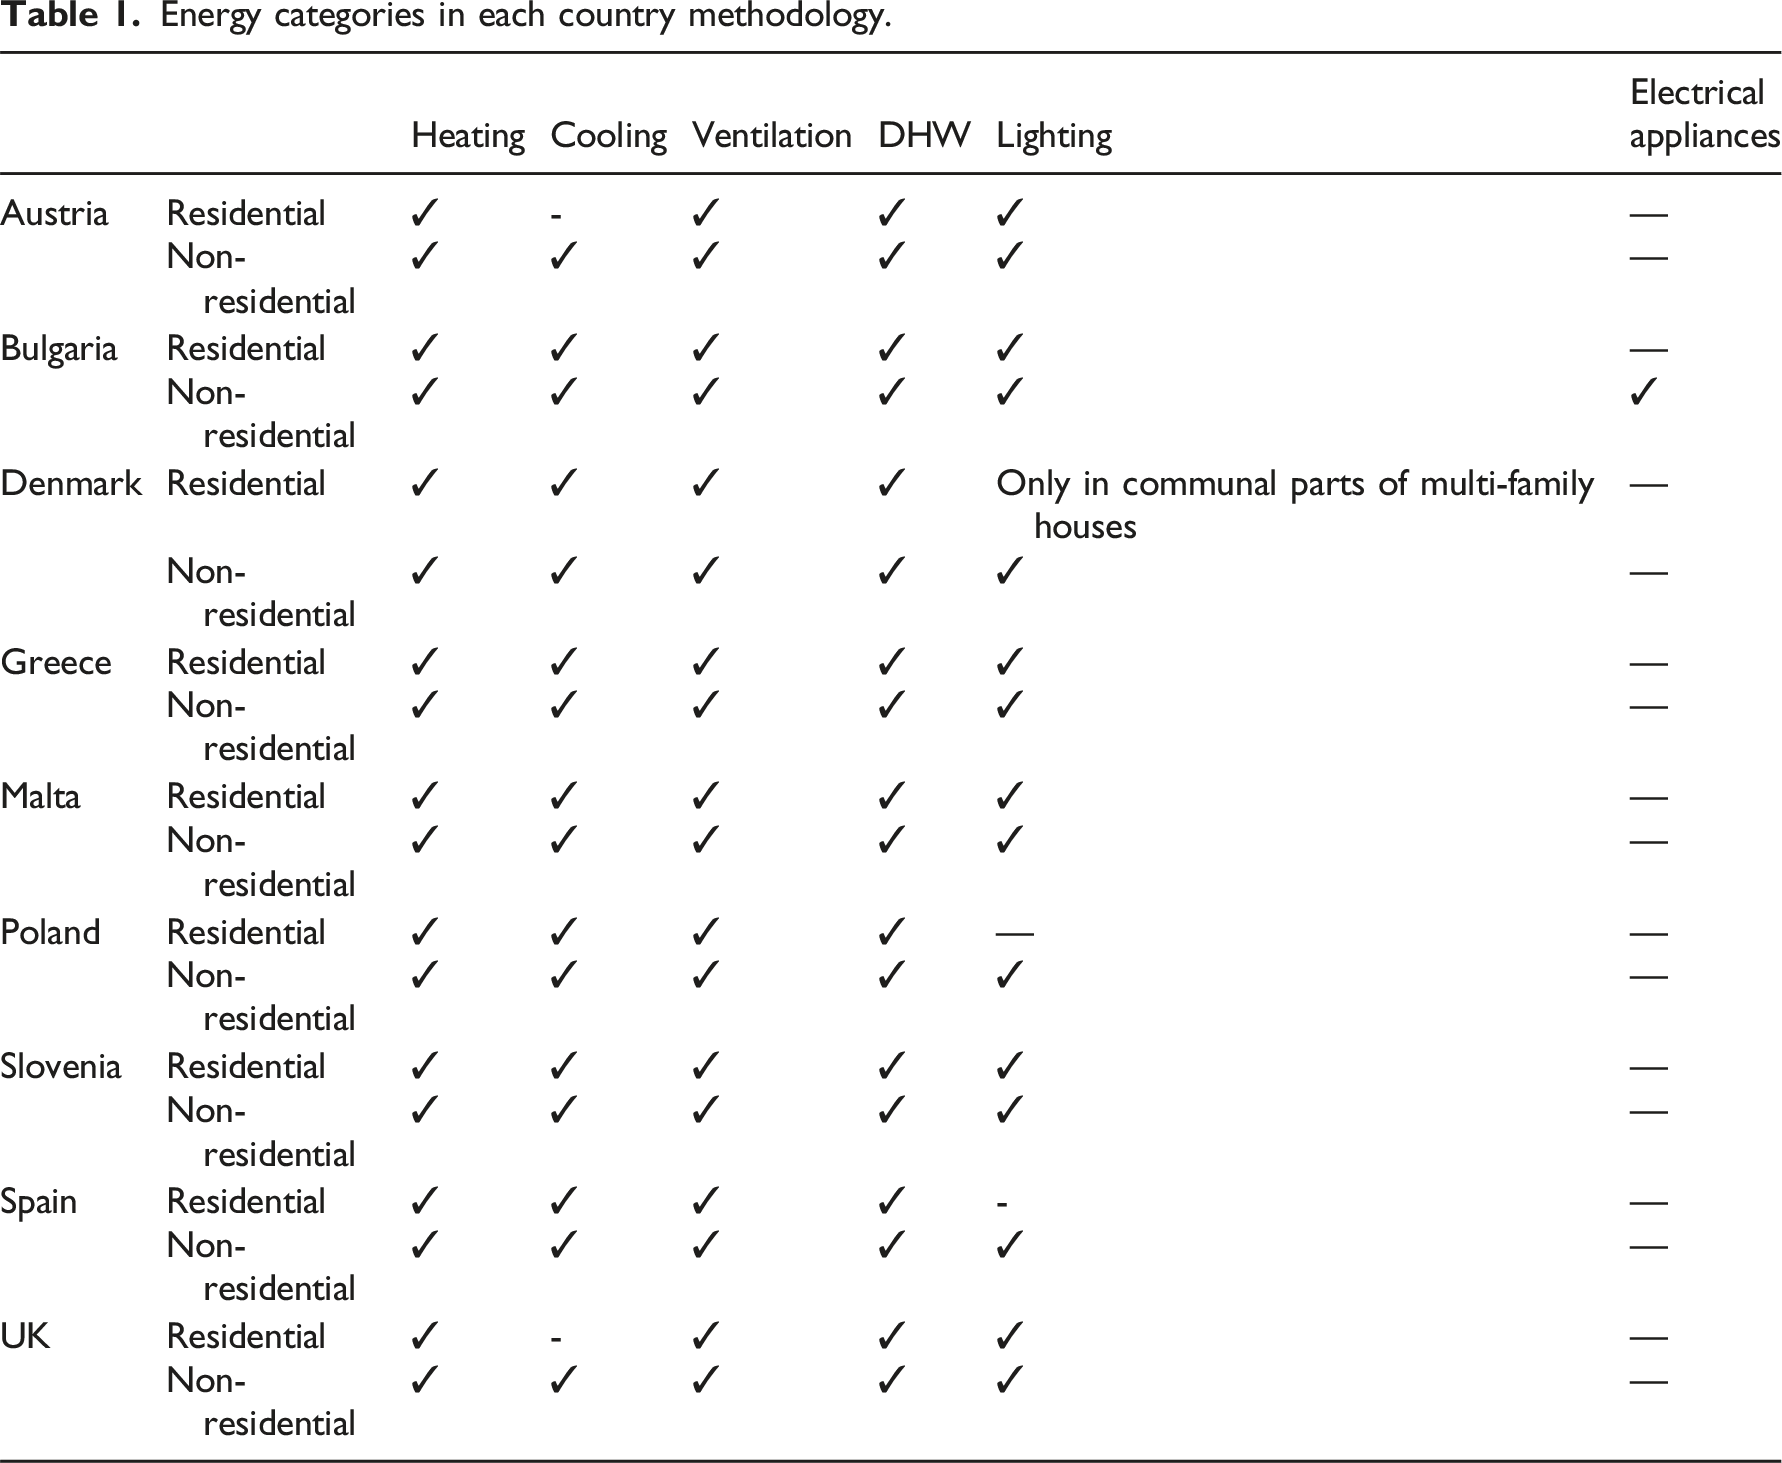
In addition, the EPBD 2 states that the energy performance of a building “shall reflect typical energy use for space heating, space cooling, domestic hot water, ventilation, built-in lighting and other technical building systems”, where “technical building systems” refers to any technical equipment used for the purposes of space heating, space cooling, ventilation, domestic hot water, built-in lighting, building automation and control, or on-site electricity generation. Despite this definition, variations were observed in crossCert partner countries’ approaches. While all the studied countries include heating, domestic hot water (DHW) and ventilation in their EPC calculation, the inclusion of cooling, lighting and electrical appliances energy consumption tends to vary, leading to inaccuracies when comparing measured energy consumption to EPC information.
Energy categories in each country methodology.
Assessor background education and training
Summary of training requirements for EPC assessors in chosen European countries.
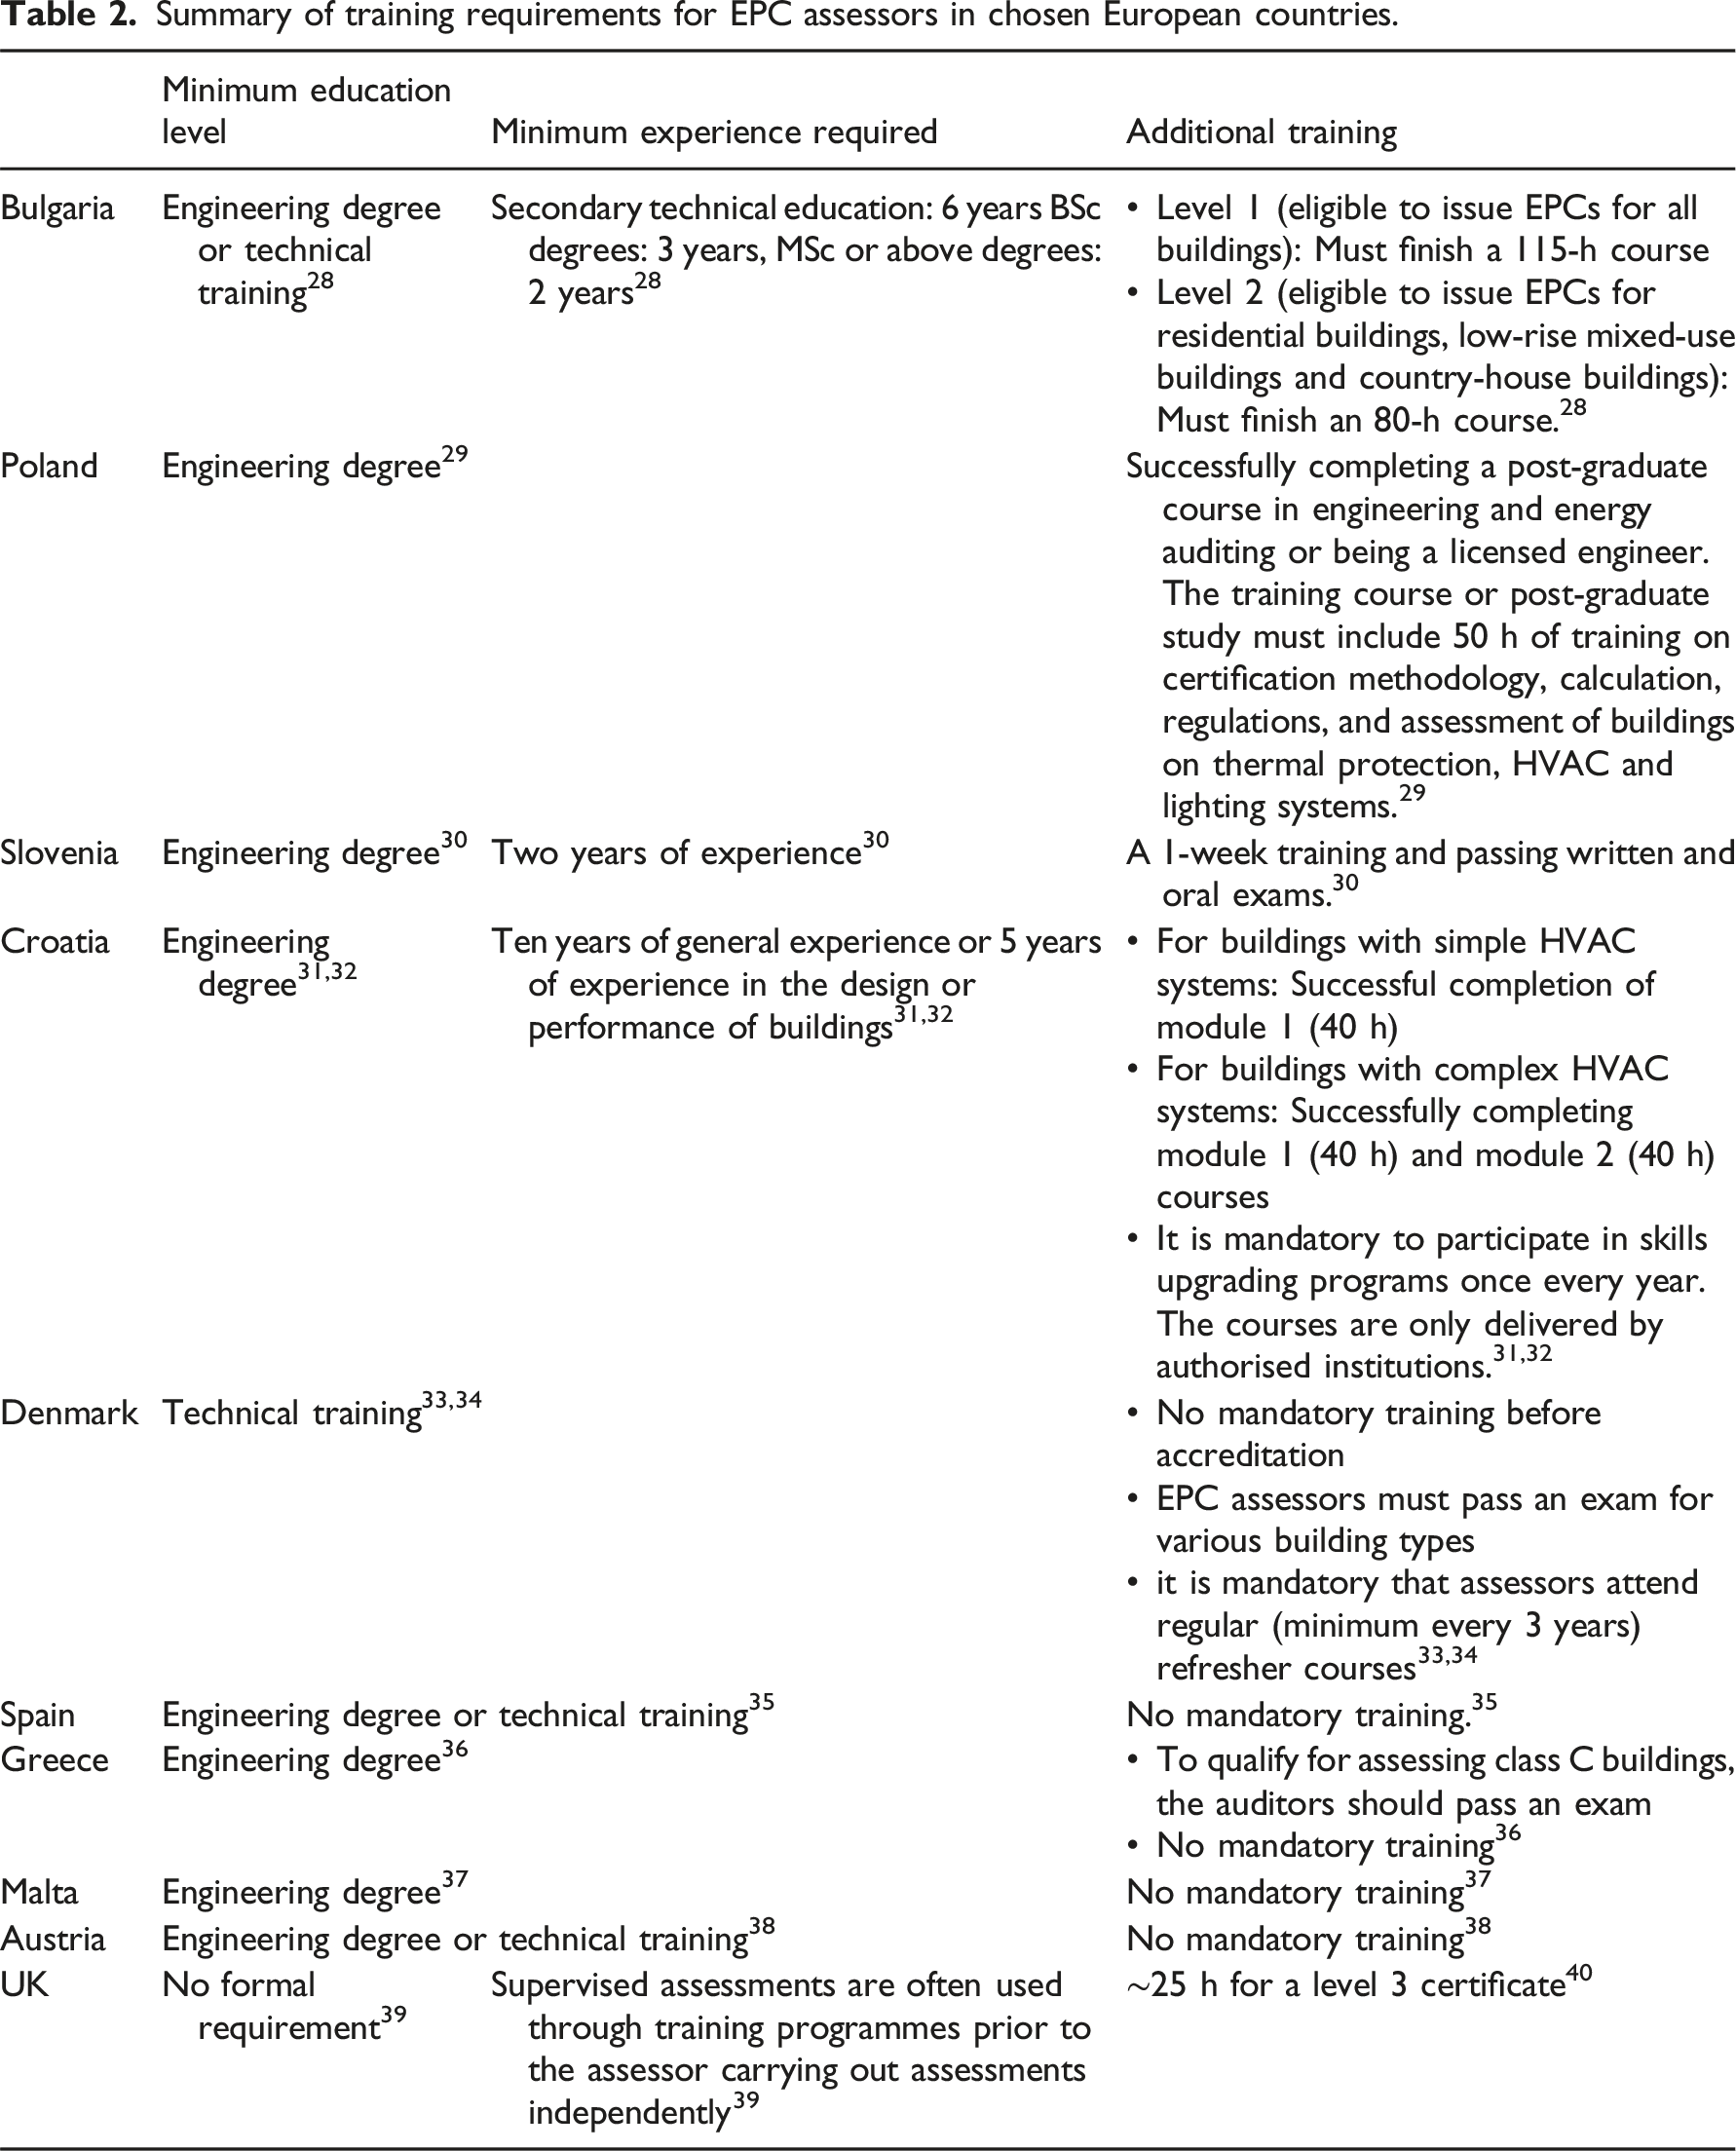
Some countries, including Bulgaria, Croatia, Greece, Poland, Malta and Slovenia, only allow qualified engineers to become EPC assessors. In Spain, in addition to engineers, individuals with technical vocational education can also become EPC assessors. 35 In Denmark, technical education is required at a minimum European Qualification Framework (EQF) level 4 or higher, with a minimum of 3 years’ duration. 33
In Austria, a wider range of technical backgrounds are eligible for issuing EPC certificates, ranging from engineers to timber constructors, chimney sweepers (only for existing residential buildings, with the exception of new buildings and refurbishments requiring a building permit), and stove fitters (only for detached and semi-detached houses).38,41 The UK has fewer formal requirements for educational background for EPC assessors compared to other studied countries, and the assessors don’t need prior experience or education to train as an energy assessor. 39 This is particularly true for residential EPC assessments, as there is a considerable difference in the complexity levels of residential assessments compared to those of non-residential buildings.
As emphasised in other publications, 42 it is difficult to compare the different programmes across the studied countries directly. However, based on Table 2 and it can be seen that Bulgaria, Croatia, Poland and Slovenia, despite having high requirements regarding background education levels, have the longest minimum mandatory training programs (40-80 h) compared to the UK (with around 25 h 40 ) and other countries, where there is no mandatory training in place.
Relationship between methodologies and the performance gap
In this section, the link between the performance gap of the studied methods and the differences highlighted in the last section is explored.
Based on the results (explained in more detail in project reports
43
), the performance gap values of these buildings range from 0.77% to 859%, showing a wide range of variation. Figure 2 clearly shows the variations of the performance gap for the case study buildings. Performance gap variations.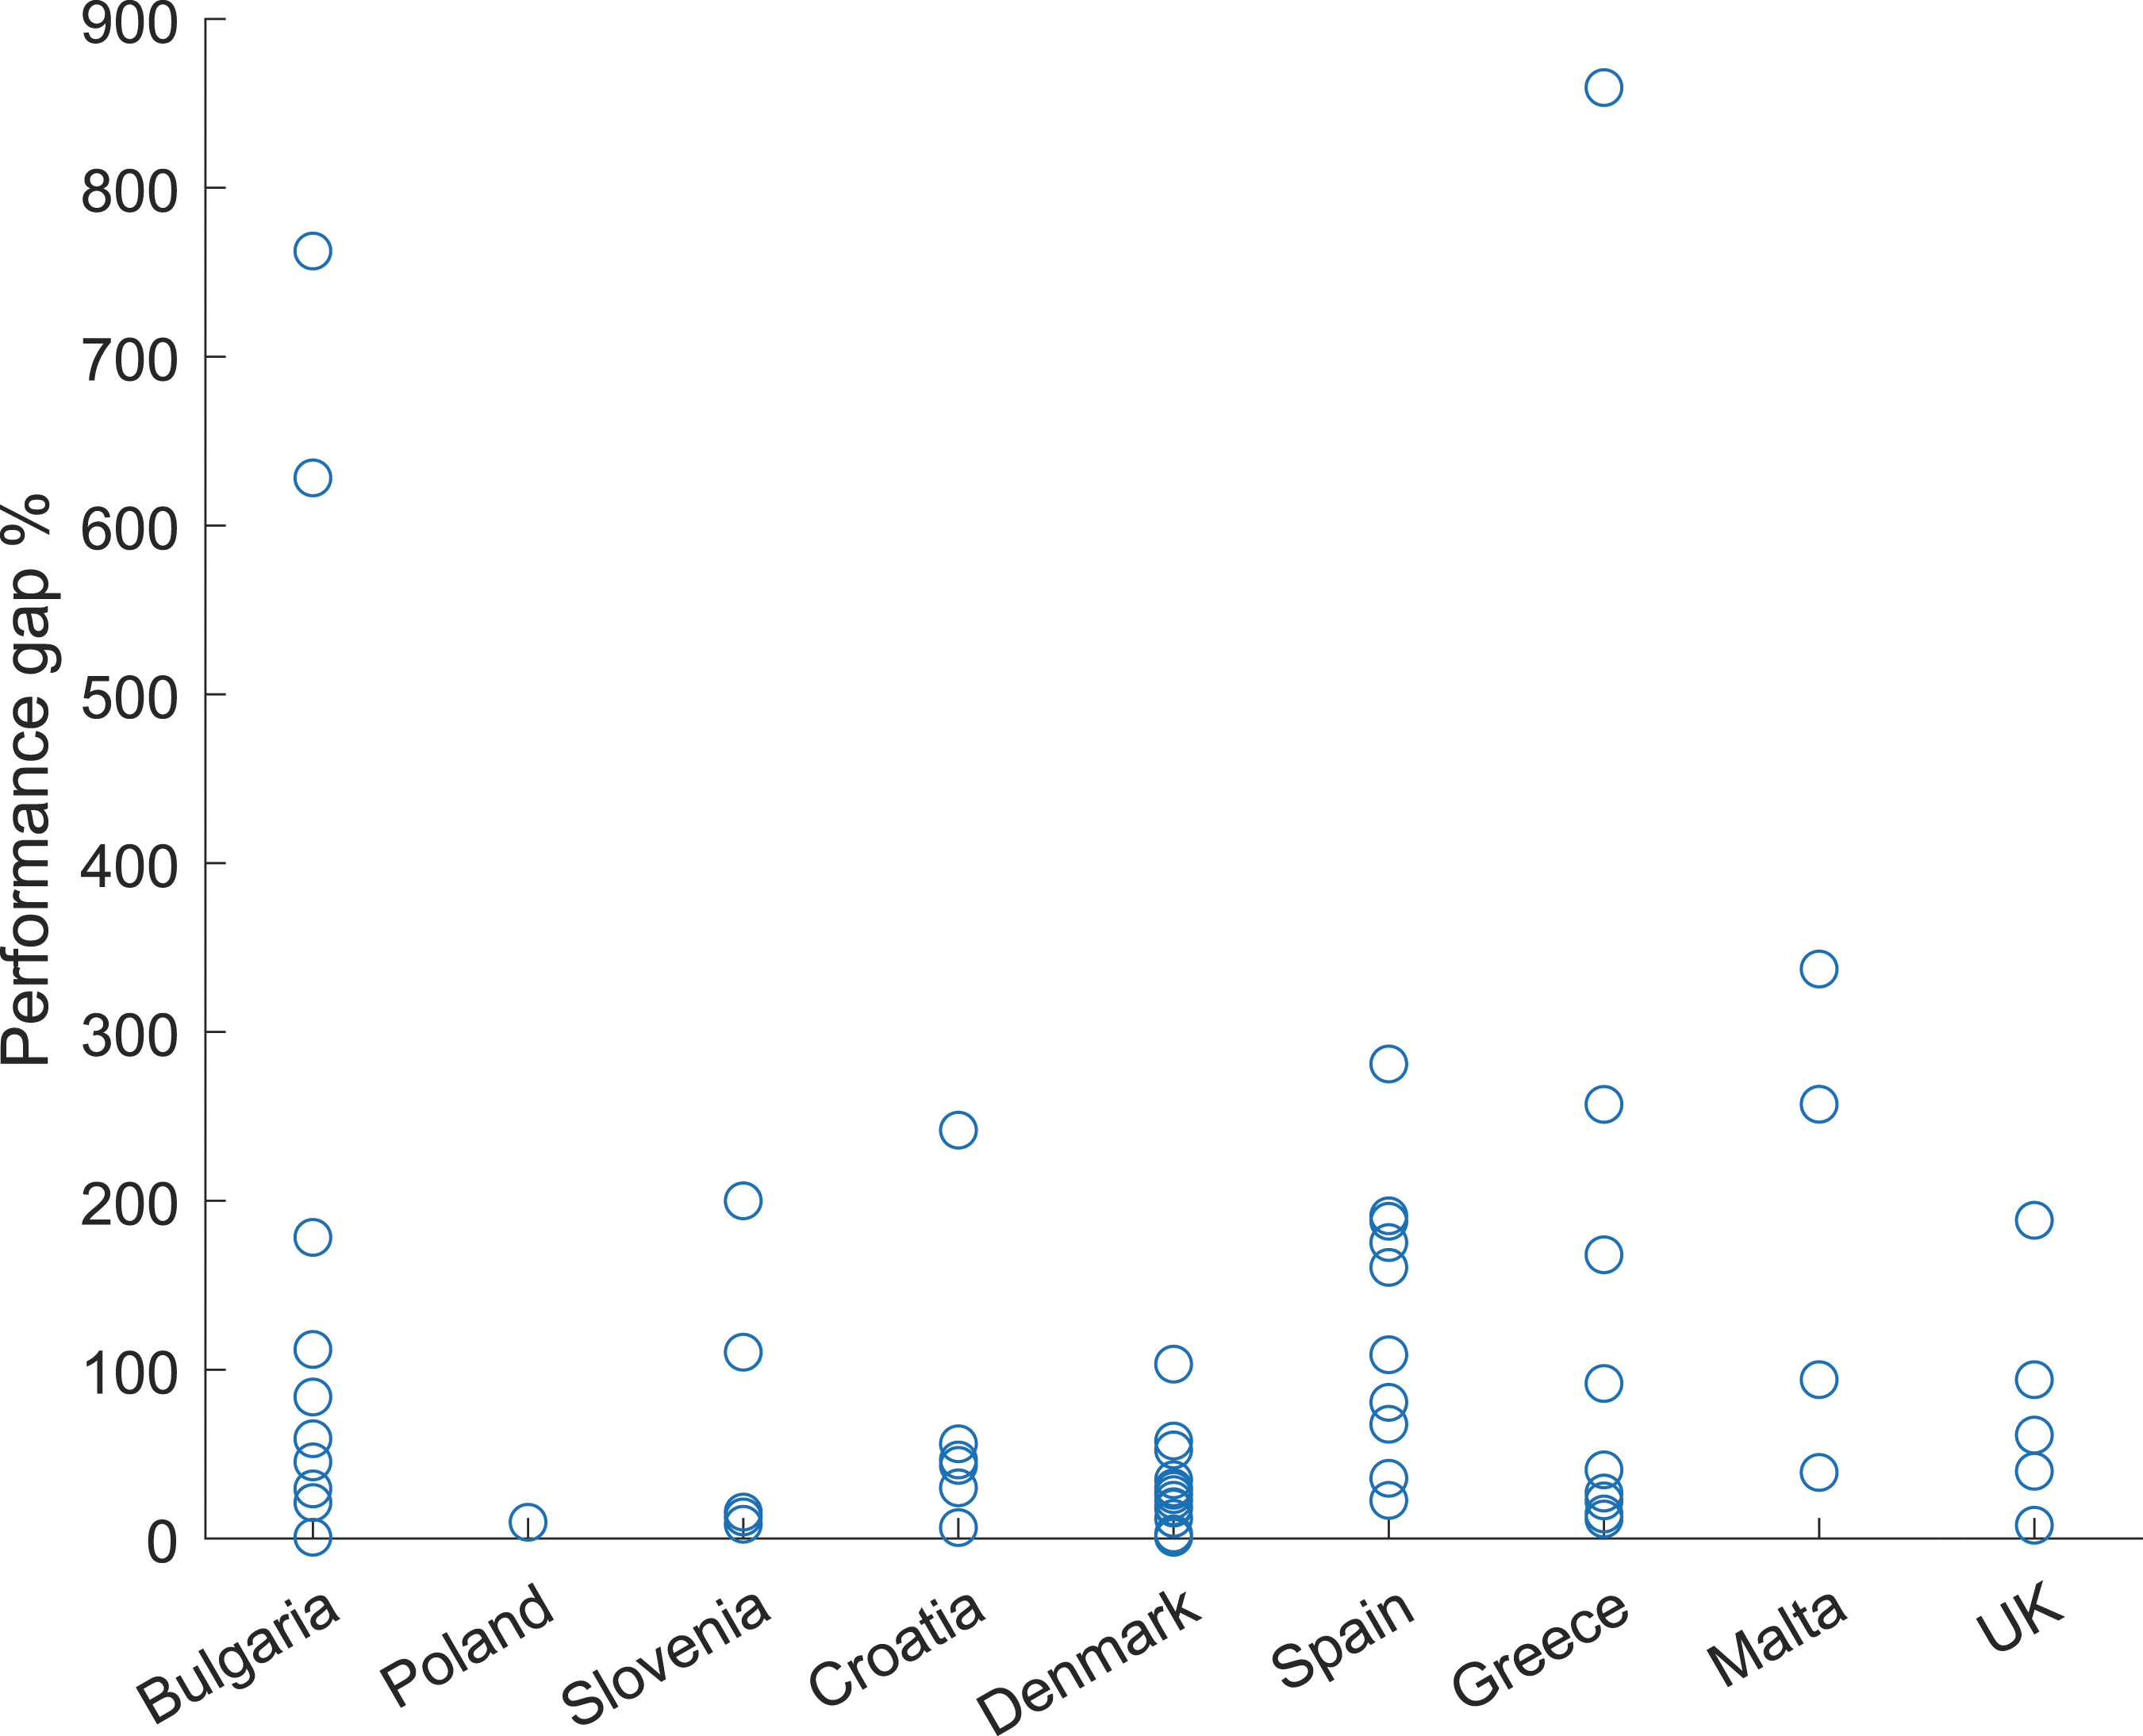
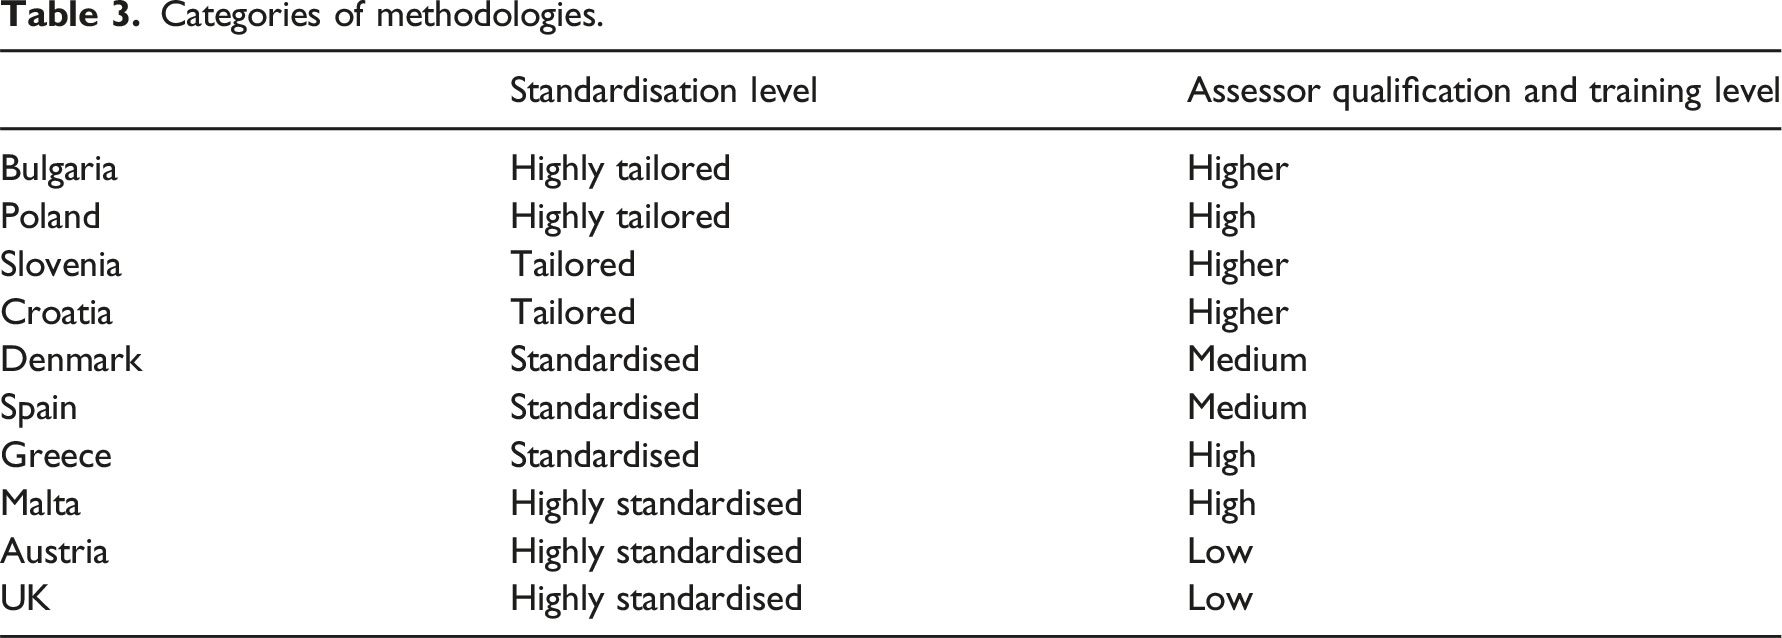
Categories of methodologies.
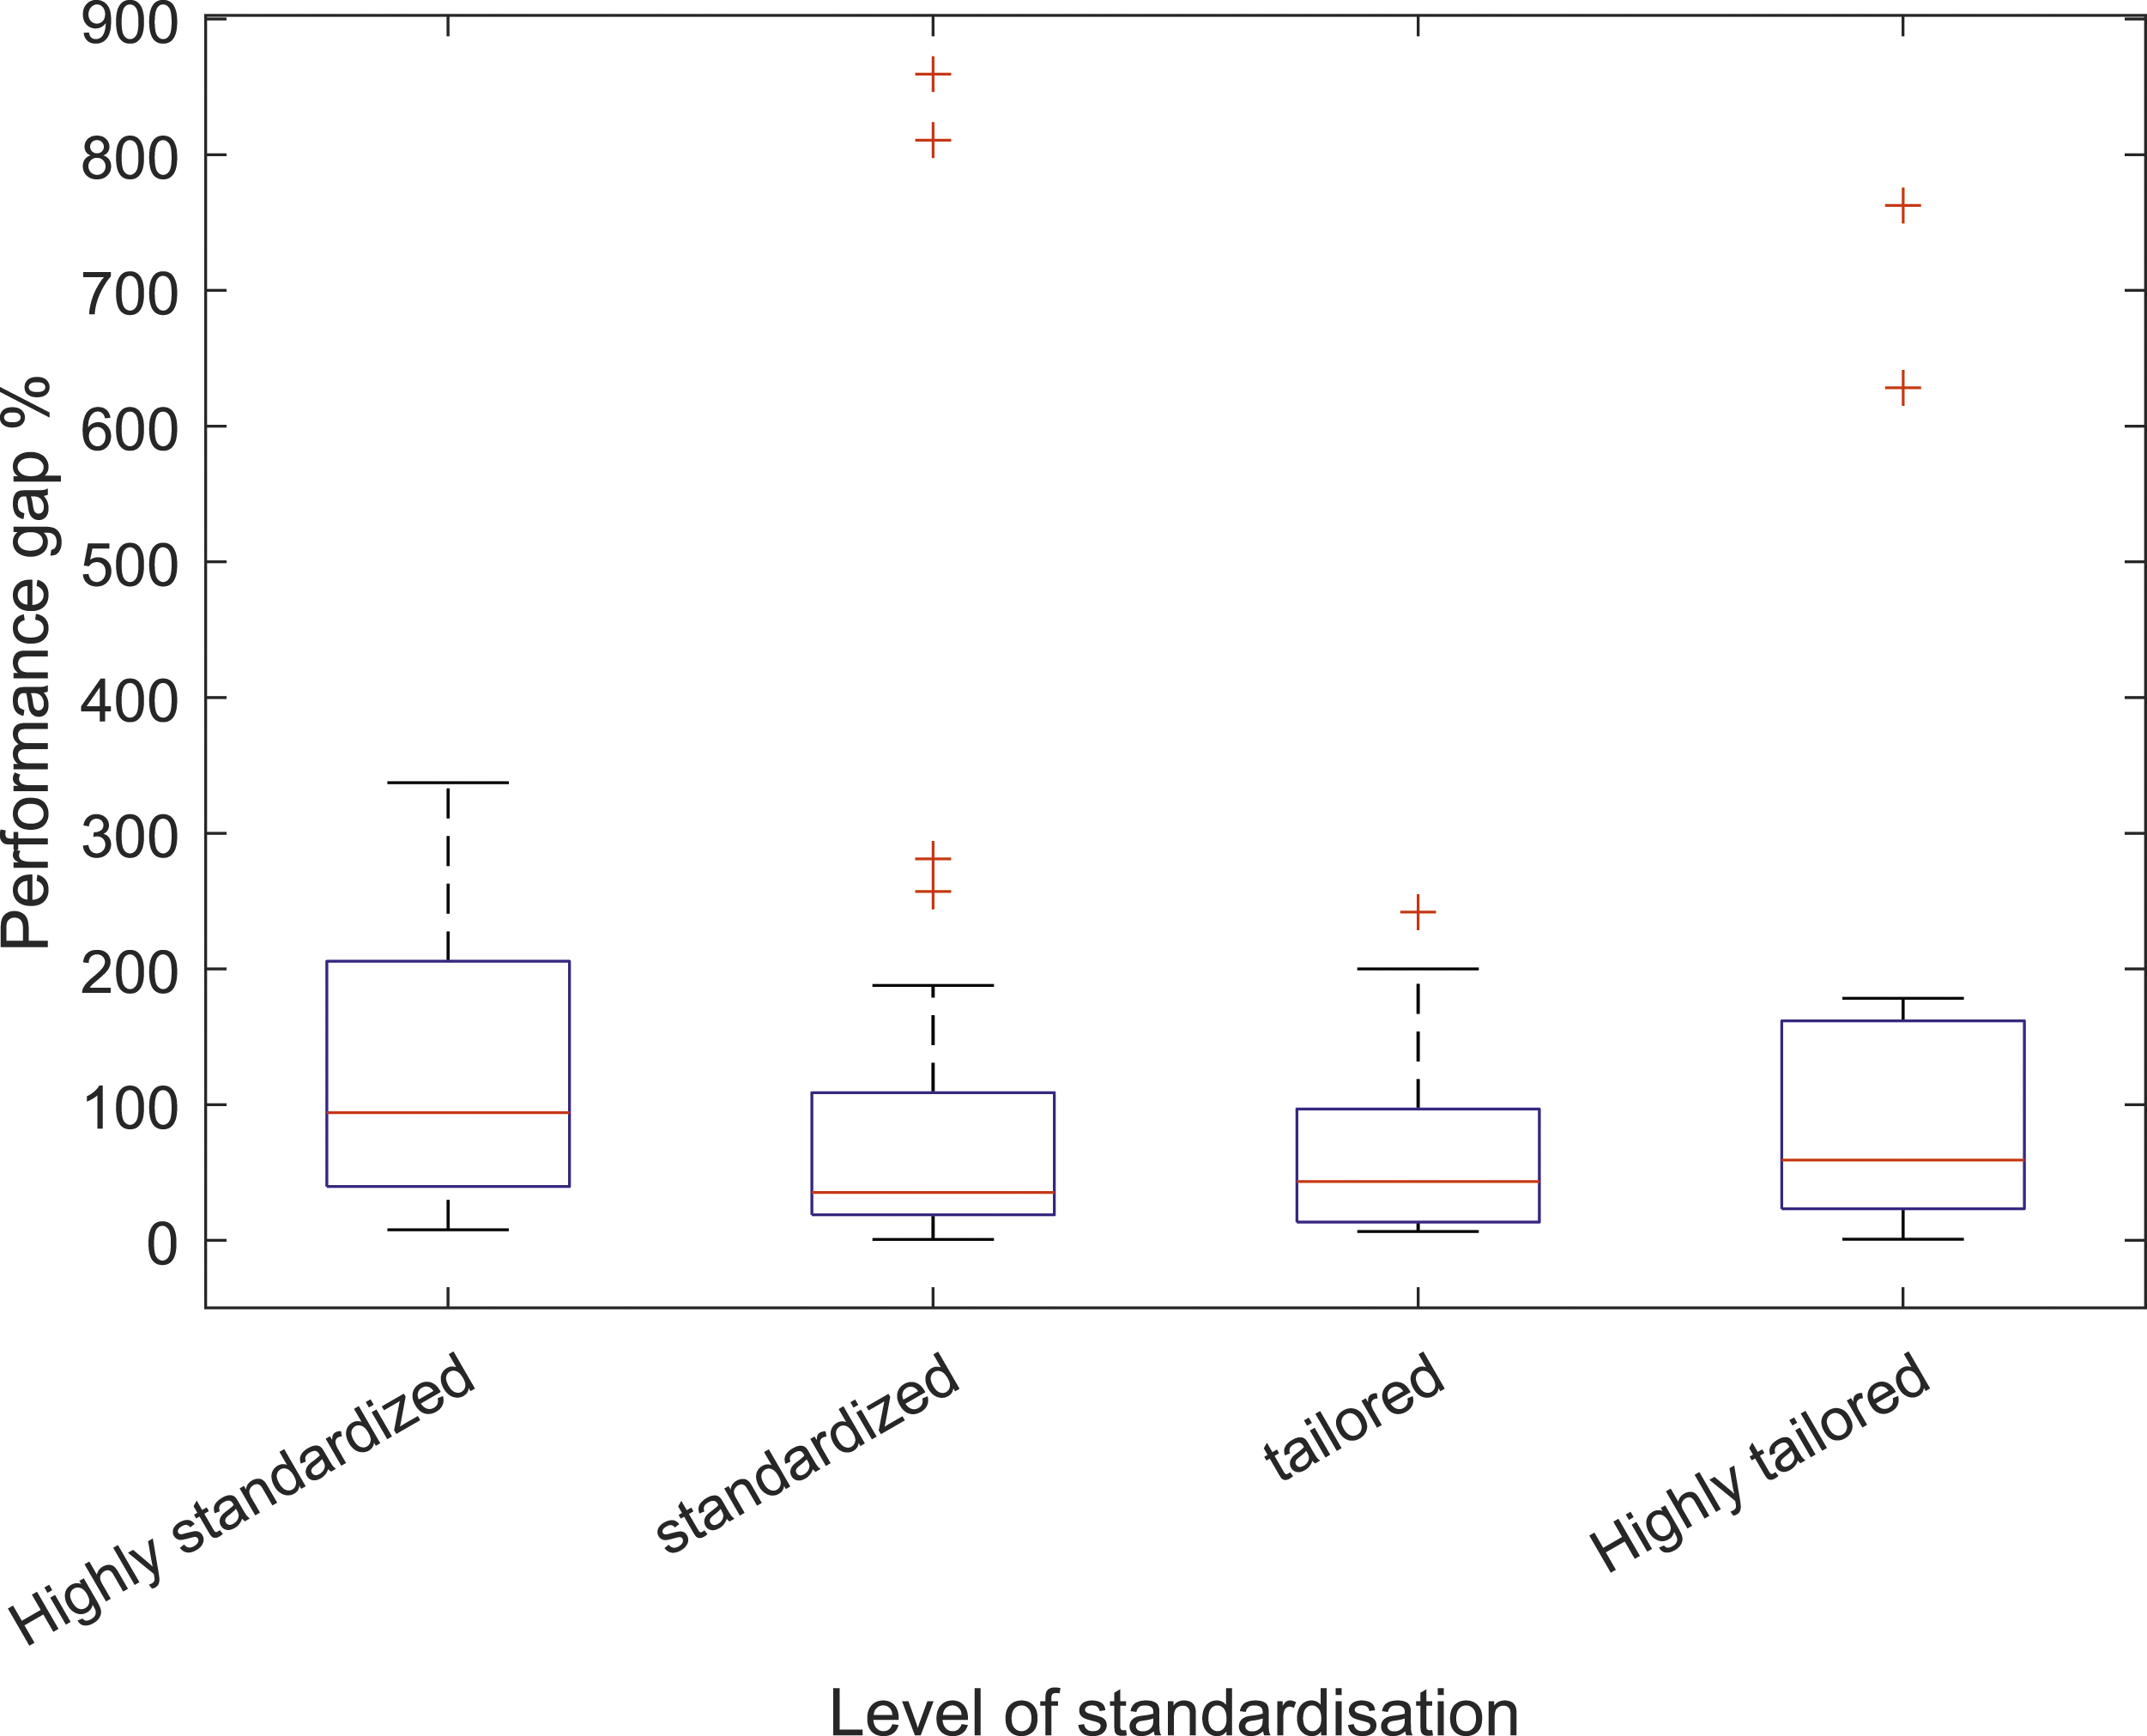
The relationship between the performance gap and the level of standardisation.
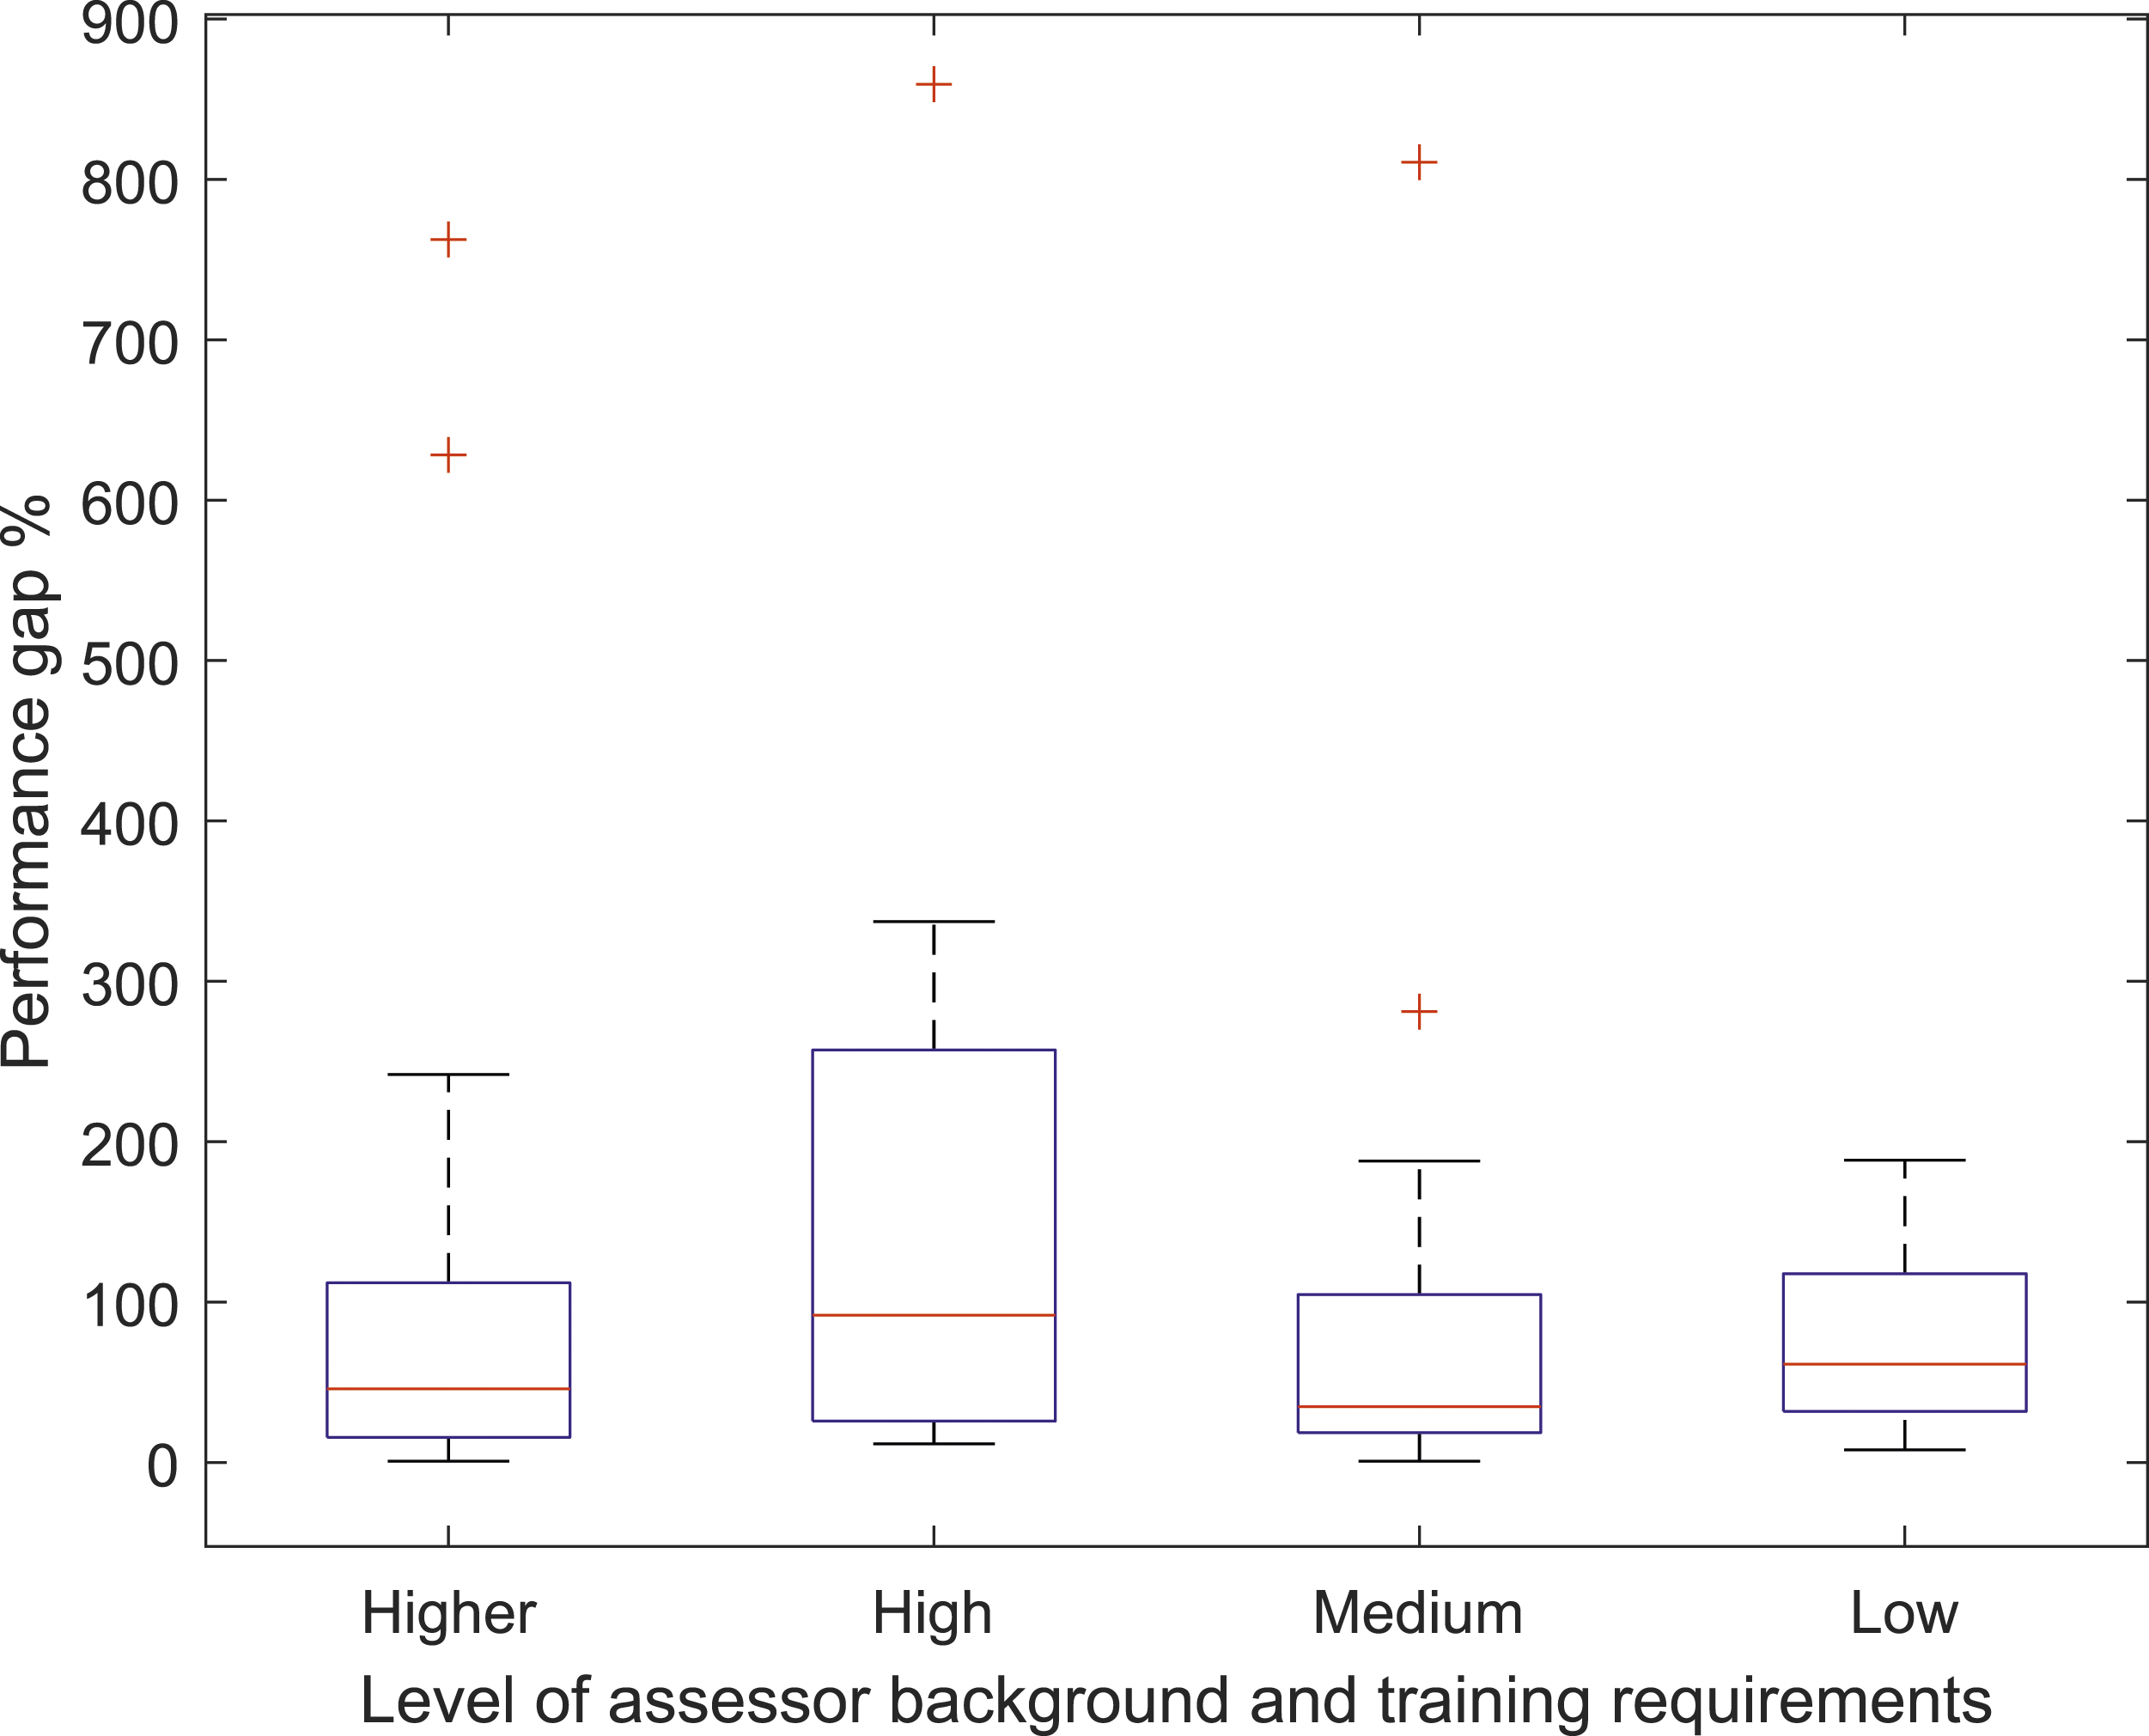
The relationship between the performance gap and the assessor’s background requirements.
It is important to note that categorising methodologies based on factors such as standardisation level does not completely reflect the varying levels of complexity across different input parameters within an approach. Different methodologies may handle various parameters differently. e.g., Malta is standardised in many aspects but does not have default values for U-values for residential buildings. Likewise, in the UK, where there is considerable standardisation of inputs, it is still mandatory to measure the infiltration rate for new buildings.17,18 However, to explore possible links between the performance gap and the general type of the EPC methodology, methodologies were assigned to the roughly defined categories mentioned above.
Based on the results illustrated in Figure 3, it seems that, for the studied sample, the median performance gap is lower for more tailored methodologies compared to standardised ones. However, this conclusion cannot be applied to all buildings assessed by different methodologies as clearly shown in Figure 2. Also, it is worth noting that the sample sizes in this study are small, and the number of buildings varies across different countries and different methodology categories. Therefore, it is advisable to perform similar analyses across larger numbers of buildings to draw general conclusions.
The same conclusion cannot be made about the assessor’s qualifications and training levels. Figure 4 shows that methodologies requiring a high level of qualification have the highest median value of performance gap for their case study buildings. However, similar to the level of standardisation, the study is limited by the number of case study buildings, and the results only apply to this sample.
Next-generation EPCs and improving the performance gap
As discussed in the previous section, a wide performance gap exists in most EPC methodologies, regardless of the levels of training provided to assessors or the level of tailored information required in a methodology. New EPC approaches have been suggested in recent years to address the issue of performance gap, including implementing dynamic simulation, operational ratings (e.g. the D2EPC project, which uses an asset rating based on dynamic simulations and an operational rating based on actual data 6 ) or a combination of both through using dynamic simulations calibrated against measured data (e.g. the ePANACEA 44 and EDYCE projects 45 ). Creating categories of methodologies based on the differences discussed in this study (similar to the categories mentioned in the previous section) can facilitate the process of integrating these new EPCs in different countries. Roadmaps can be prescribed for categories of methodologies instead of an individual country approach or an entirely top-down approach through regulations such as the EPBD.
Using dynamic models for EPC calculation is permitted in the EPBD, 2 but most countries prefer to use steady-state models as the primary method of assessment. Among the crossCert partner countries, all countries use steady-state models for EPC calculation with two exceptions: the UK and Spain. In the UK, the assessors are required to use certified dynamic simulation software for assessing non-domestic buildings with complex HVAC systems or architectural features (e.g., atrium, demand-controlled ventilation, automatic blind control). 46 In Spain, official software tools, including HULC, SG SAVE, CYPE THERM HE PLUS, and TEXTON3D TK-CEEP, use DOE-2 or EnergyPlus calculation engines, which perform dynamic simulation.
Considering the differences amongst current EPC methodologies highlighted in this study, integrating dynamic simulation poses various challenges, depending on which category each methodology fits into. One of the main issues is the use of default inputs in steady-state methodologies, such as schedules for occupancy, lighting and equipment and HVAC operation. These inputs are designed for steady-state models and, therefore, are in the form of the number of hours per day, number of days per year, or similar formats. In order to implement dynamic simulation in such methodologies, new hourly default schedules for different seasons would need to be defined. In the Spanish and UK non-residential methodologies, where dynamic simulation is already used, the default schedules are in an hourly format and well-suited for such simulations, making integration less challenging.
On the other hand, the methodologies that fall within the highly standardised category as described in Table 3 (such as the UK and Spain) have a high dependence on default values and schedules, which in itself raises questions about whether dynamic simulation can effectively address the performance gap issues in these methodologies or whether increasing the level of tailored inputs should also be considered.
Another challenge depends on the categories of assessor qualification and training level. In order to integrate these more advanced dynamic simulation methodologies into current EPC assessments, additional training would be required. As shown in Table 2, there are significant differences in the assessor training and background requirements between partner countries, highlighting the difficulties of employing dynamic simulations in some of these methodologies. In certain countries, the assessors must have higher qualifications and more extensive training, making the possible integration of complex approaches into their EPC assessments easier. In contrast, countries with lower qualification requirements could face more challenges in providing assessors with the knowledge and skills necessary to use complex software across their building stock.
Similar to next-generation EPCs that use dynamic simulations, the use of operational ratings (using measured energy consumption for EPC assessments) is also suggested in the EPBD, 2 and some countries have already integrated that approach into their methodology. Among the crossCert partner countries, Denmark, Poland and Slovenia use this approach. In Denmark, an operational EPC can be issued if at least 1 year of monthly energy consumption data is available for a building (regardless of building type). In Poland, the minimum required data for issuing an operational EPC is 36 continuous months of utility bills. Slovenia only allows operational EPCs for existing non-residential buildings. In the UK, even though EPC is considered an asset rating, a separate certificate called the Display Energy Certificate (DEC), which is a rating based on measured energy consumption, should be issued for certain building types. 47 In Bulgaria, even though the EPC is based on calculation, actual energy consumption is still required for calibrating the EPC model. Other countries only allow using calculations for EPC assessment, posing a challenge for integrating operational EPCs into their methodology. In particular, the differences in EPC indicators already in use across different countries should be considered. Classifying methodologies based on the categories of energy consumption included in EPC ratings as well as the basis of EPC indicators (e.g. primary energy, cost, final energy, etc.), as mentioned in section 1.2, can be a helpful exercise to facilitate integrating operational ratings into methodologies.
Overall, it is essential to understand the differences in EPC approaches before implementing harmonised changes, such as minimum energy performance requirements or aspects of next generation EPCs. Studying such differences and categorising methodologies based on details in their approaches can be a valuable tool on the road to harmonisation across Europe. In this way, a road map for implementing next-generation EPCs can be designed for each category of assessment, rather than developing country-specific plans or a Europe-wide blanket approach. Such an approach will highlight the specific challenges of adopting next-generation EPCs for each category and help devise a tailored route to achieve optimum results.
Conclusion
This study emphasised the differences in EPC assessment methodologies across several European countries and how those differences might impact the performance gap of EPCs. It is essential to note that various factors involved in EPC calculations can vary between methodologies and significantly impact the outcomes. However, the categories listed in this study were chosen as examples to showcase the varied approaches in EU countries.
The comparison of EPC methodologies shows considerable differences between European countries, which is notable given these methodologies are all based on the same governing directive, the EPBD. To facilitate comparison, a single metric of the level of standardisation was defined and based on the details of each methodology, each country was assigned to a level between highly standardised and highly tailored. This factor and the level of training and background qualifications of assessors were then used as variables that could impact the EPC performance gap. The performance gap for a sample of buildings across the crossCert partner countries was used for analysing this. The results showed the median value of the performance gap was higher for highly standardised methodologies compared to highly tailored methodologies. However, comparing individual methodologies didn’t return the same conclusion. For the level of assessment qualification and training, the results did not show any clear relationship to the performance gap – though it was noted that the sample size and influence of other factors make this relationship very difficult to quantify.
It is important to note that while tailored approaches aim to provide a more accurate model of the building when assessing its energy performance, they can also result in inconsistent assessment outcomes when used by different assessors or at different times, potentially contradicting the original purpose of EPCs: enabling comparisons between buildings of a similar type.
It should also be emphasised that comparing EPC information to actual energy consumption data is not an accurate reflection of the value of EPCs. EPC methodologies are primarily designed to allow for comparison and to provide information for compliance purposes. Hence, by design, they do not take into account the impact of occupant behaviour on energy consumption, nor do they cover all categories of energy consumption that occur within buildings. As a result, the performance gap of an EPC does not necessarily reflect the success of the methodology, since it was not originally intended to serve that purpose.
New approaches to tackle the issue of the performance gap in EPCs, such as dynamic simulation and operational energy ratings, should consider the differences that exist in methodologies as well as the variations in local workforce qualifications and skills. With regards to recommendations for next-generation EPCs, the shaping of this cannot be carried out solely at a top-down, European level; the significant differences highlighted in this paper, across the chosen sample of European countries, demonstrate that it is vital to understand methodological detail and assessor workforce when designing future assessment of buildings. Using a categorisation approach can help devise tailored roadmaps for groups of methodologies, which can facilitate the integration of these next-generation EPCs across Europe.
Footnotes
Acknowledgments
This paper reports findings from the Horizon 2020 funded project crossCert.
Declaration of conflicting interests
The author(s) declared no potential conflicts of interest with respect to the research, authorship, and/or publication of this article.
Funding
The author(s) disclosed receipt of the following financial support for the research, authorship, and/or publication of this article: This work was supported by the European Climate, Infrastructure and Environment Executive Agency’s (CINEA) grant [grant number 101033778 — crossCert].