
Abstract
Energy poverty – which has also been recognised via terms such as ‘fuel poverty’ and ‘energy vulnerability’ – occurs when a household experiences inadequate levels of energy services in the home. Measuring energy poverty is challenging, as it is a culturally sensitive and private condition, which is temporally and spatially dynamic. This is compounded by the limited availability of appropriate data and indicators, and lack of consensus on how energy poverty should be conceptualised and measured. Statistical indicators of energy poverty are an important and necessary part of the research and policy landscape. They carry great political weight, and are often used to guide the targeting of energy poverty measures – due to their perceived objectivity – with important consequences for both the indoor and built environment of housing. Focussing on the European Union specifically, this paper critically assesses the available statistical options for monitoring energy poverty, whilst also presenting options for improving existing data. This is examined through the lens of vulnerability thinking, by considering the ways in which policies and institutions, the built fabric and everyday practices shape energy use, alongside the manner in which energy poor households experience and address the issue on a day-to-day basis.
Introduction
Energy poverty occurs when a household experiences inadequate levels of essential energy services in the home, such as heating, cooling, lighting and use of appliances. 1 There is a broad consensus that energy poverty in Europe is predicated upon high energy prices, low household incomes, inefficient buildings and appliances,2,3 and specific household energy needs and practices, 4 perhaps relating to chronic illness 5 or family characteristics. Living in energy poverty is associated with a range of adverse consequences for people’s physical health. 6 A relationship between poor mental health – and well-being more generally – on the one hand, and cold housing and living in energy poverty on the other, is now evident.7– 9 Energy poverty has also been associated with excess winter deaths in most European countries.10,11
Theorisation of energy poverty
Summary of energy vulnerability factors and driving forces.
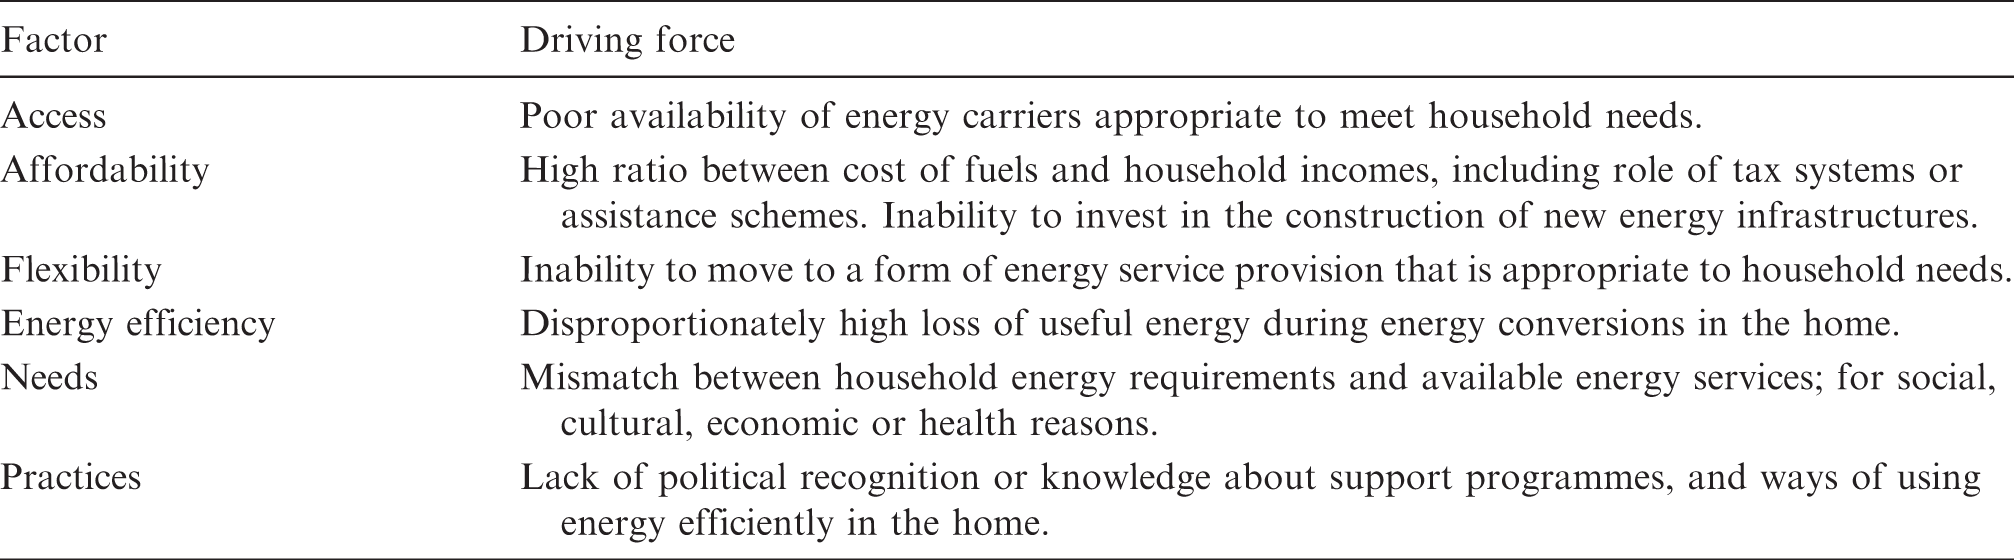
Adapted from Bouzarovski and Petrova, 1 p.37.
Demand for statistical estimates of energy poverty prevalence
Energy poverty is an issue that is growing in both recognition and prevalence across Europe, as evidenced by the fact that addressing energy poverty has been identified as a key European Union (EU) policy priority. 12 Strong policy mandates for harmonised statistics and estimates of energy poverty have been issued by several institutions of the EU, including the European Parliament, 15 European Economic and Social Committee, 16 and the Committee of the Regions. 17 Despite overall resistance to defining energy poverty, the European Commission has suggested that energy poverty could be measured using consensual indicators from existing pan-EU surveys.12,18 The existing academic literature has reinforced this standpoint, stressing the need for additional research in order to generate knowledge about energy poverty in Europe.13,19
The production of robust statistics on energy poverty rates across the EU is important for understanding the nature of energy poverty in detail, developing evidence-based alleviation policy, and for benchmarking and comparing Member States. The measurement of energy poverty also has wider implications for other areas of policy, enabling researchers and decision makers to capture the impacts of external events and policy decisions – such as financial recessions, and low carbon transition policy – on energy poverty. Measurement and benchmarking is particularly pertinent in the context of on-going implementation of the 2009 internal gas and electricity market Directives – which require Member States to define the concept of a vulnerable customer, possibly in relation to energy poverty – as well as the European Commission’s new flagship Clean Energy Package. As a consequence, Member States are beginning to pay greater attention to the issue of energy poverty (see Pye et al. 20 for a review), resulting in a new definition of energy poverty in Slovakia. 21 It should be noted that the focus of this paper is on macro-level measurement of energy poverty at the pan-European, national and regional scale for monitoring and benchmarking purposes, rather than local-level household identification for specific policy implementation, which would require detailed micro-data at the lowest geographical level.
Existing applications of statistical indicators and gaps in knowledge
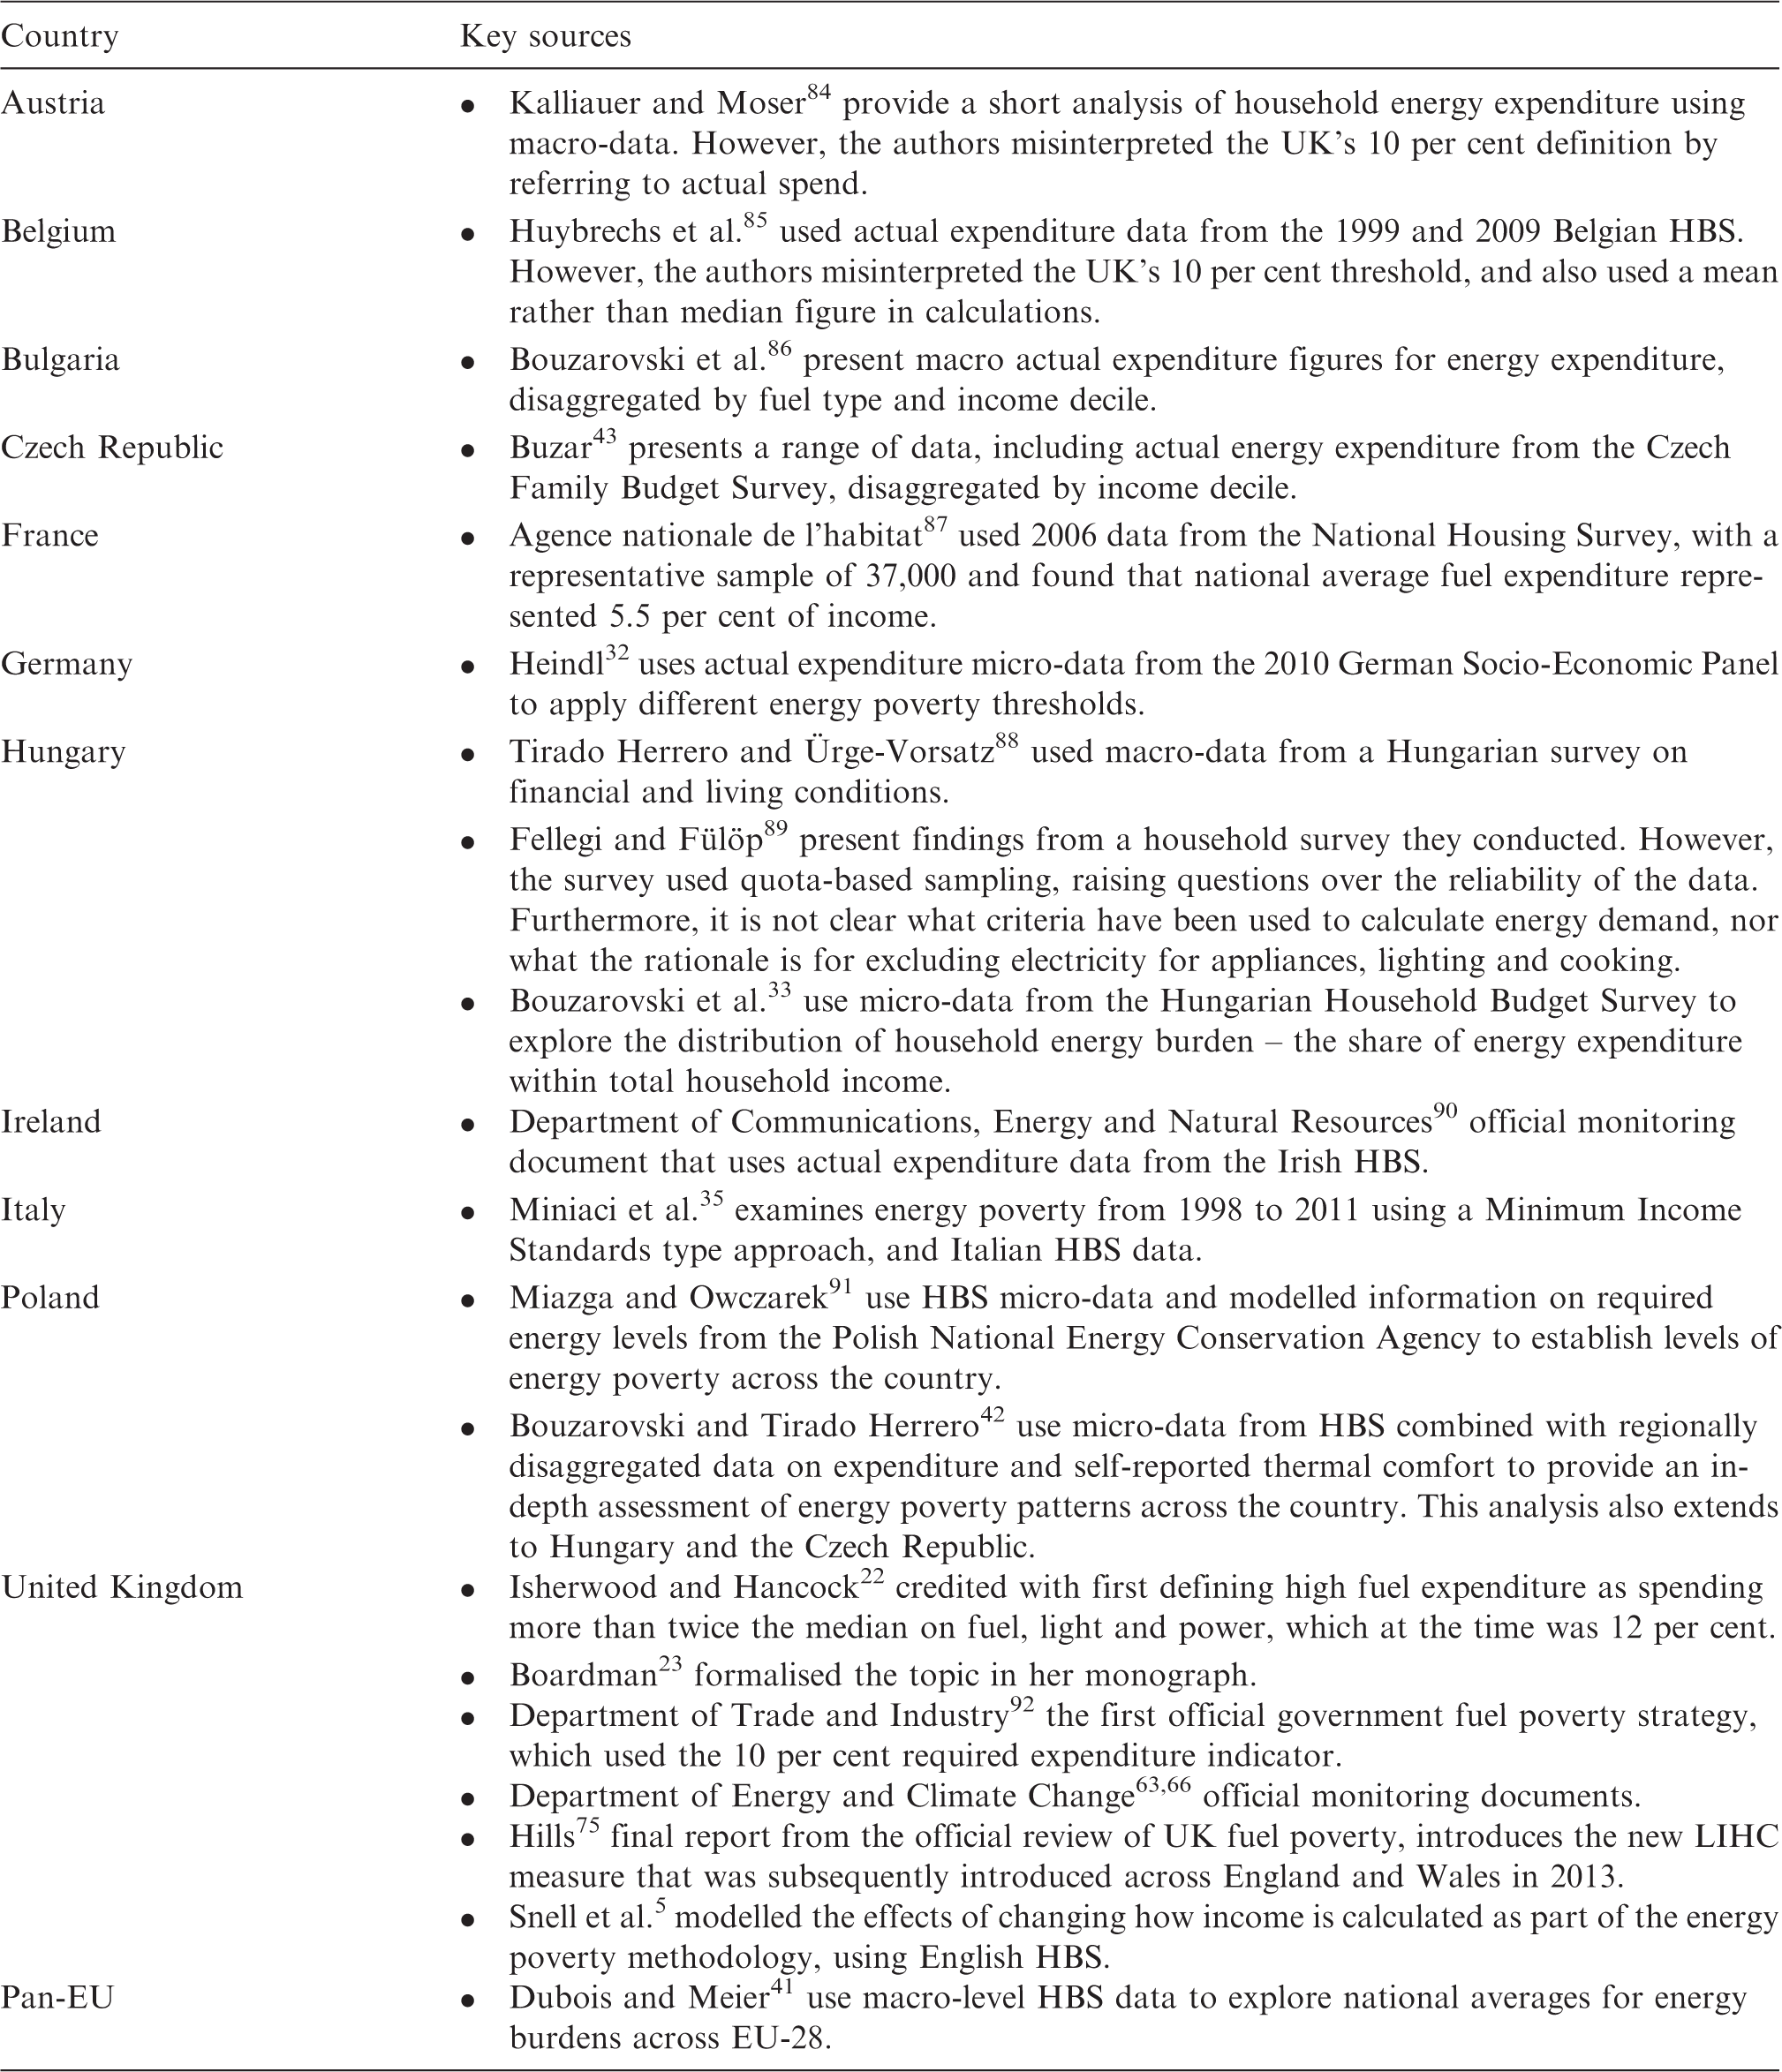
Knowledge about energy poverty and related concepts is primarily centred on the UK and Ireland, which have a long tradition of academic scholarship, practice-based responses and policy frameworks to address the issue. Isherwood and Hancock 22 are credited with being among the first to draw attention to the issue of energy poverty, followed by Boardman’s seminal monograph, 23 which provided the foundations for the present day measurement of energy poverty. Since then a substantial number of British studies have been conducted that examine the phenomenon among specific sub-groups.24– 26
Energy poverty knowledge in the rest of Europe is less developed, even if a wider range of approaches has been used. Single country studies have been conducted in, inter alia, Ireland, 27 France,28,29 Greece,30,31 Germany, 32 Hungary, 33 Austria, 7 Spain, 34 Italy, 35 and Denmark. 36 There is also an established body of comparative research, focusing on the EU specifically,19,20,37– 41 and on Central and Eastern Europe and Central Asia.42– 45
However, available data have often been applied in an incomplete or uncritical manner – most notably in relation to the partial transfer of the UK’s methodology – and the limitations of the indicators and overarching measurement approaches are not always fully acknowledged within the existing literature base. Furthermore, it has been at the exclusion of potential alternatives such as Eurobarometer surveys and the European Quality of Life Surveys (EQLS). Given that different indicators may present the European energy poverty situation in very different ways, both in terms of prevalence and the populations identified as energy poor, a critical review is long overdue. Within this context, the paper aims to (i) outline the current state-of-play regarding available data and indicators; (ii) assess the limitations of existing data instruments by drawing on an energy vulnerability framework; and (iii) consider the type and range of indicators we would like to see embedded within both existing survey instruments and within a new dedicated survey of energy poverty. To achieve these aims we review academic literature, grey literature, and survey methodology, and present statistics produced from a range of pan-European datasets.
Data and methods
The evidence analysed in our paper is derived from a comparative study of energy poverty across the EU. This geo-political focus was motivated by the EU’s position as one of the most important agents of change in contemporary Europe, which exerts considerable impact on policymaking across a range of policy domains, including energy efficiency 46 and indoor and outdoor air quality. 47 Many of the drivers and exacerbators of energy poverty transcend national boundaries, or are strongly influenced by global pressures. For instance, energy price rises at the national level are influenced, to varying degrees, by volatile global oil prices, EU-mandated climate change levies and obligations, and European-wide energy market liberalisation. Yet, as Bouzarovski and Petrova 48 note, energy poverty is rarely seen as a European issue.
To address the stated aims of our paper, we primarily use documentary evidence from academic and grey secondary literature, including survey methodology documents. Our documentary evidence is supplemented by descriptive statistics produced using a range of pan-European micro- and macro-datasets, which were sourced on the basis of existing knowledge on this topic as well as data catalogue searches on the UK Data Service, Eurostat, and GESIS – Leibniz-Institut für Sozialwissenschaften websites. Our analysis has been guided by the following three research questions:
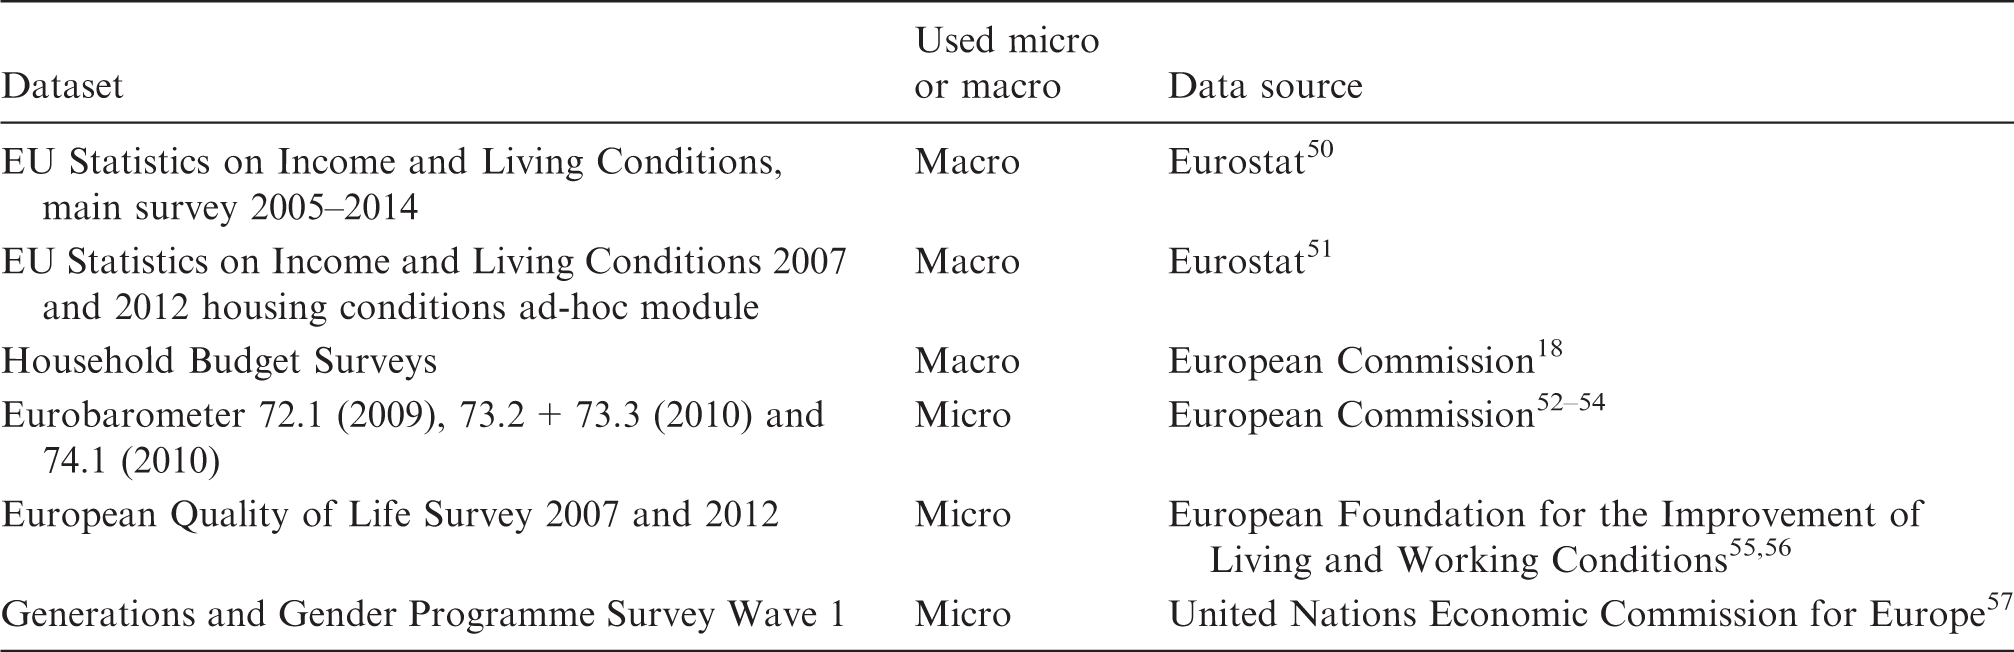
What data exist that could potentially be used to quantify energy poverty issues across the EU? Are these data, and the indicators contained within, sufficiently robust? How could the indicators be improved in order to adequately capture energy poverty issues? Summary of secondary data access.
Table 2 summarises the secondary data sources used in this paper, while later tables outline the datasets in terms of country coverage, sample size and relevant energy poverty variables. As can be seen in Table 2, micro-data from the EQLS, Eurobarometer surveys, and the Generations and Gender Programme Survey has been used. By comparison, macro-data has been used for EU Statistics on Income and Living Conditions (EU-SILC) and the Household Budget Surveys (HBS). Macro-data is data that has been derived from micro-data by aggregating household variable results into averages and frequencies (see United Nations Statistical Commission and Economic Commission for Europe
49
), which restricts the range of statistical analyses that can be performed.
Overview of approaches for measuring energy poverty
Measuring energy poverty is a difficult task. It is a private condition, being confined to the home, it varies over time and by place, and it is a multi-dimensional concept that is culturally sensitive. 58 The choice of measurement approach is also contingent on whether energy poverty incidence is to be measured at the pan-European, national or regional level for monitoring and benchmarking purposes, or whether a finer grained dataset is needed to identify energy poor households at the local scale for policy delivery. It is further shaped by the availability of data and resources to undertake additional empirical research, and prevailing policy priorities in terms of social groups considered most in need/deserving of support.
Arrangement of measurable drivers and outcomes by energy vulnerability factors.
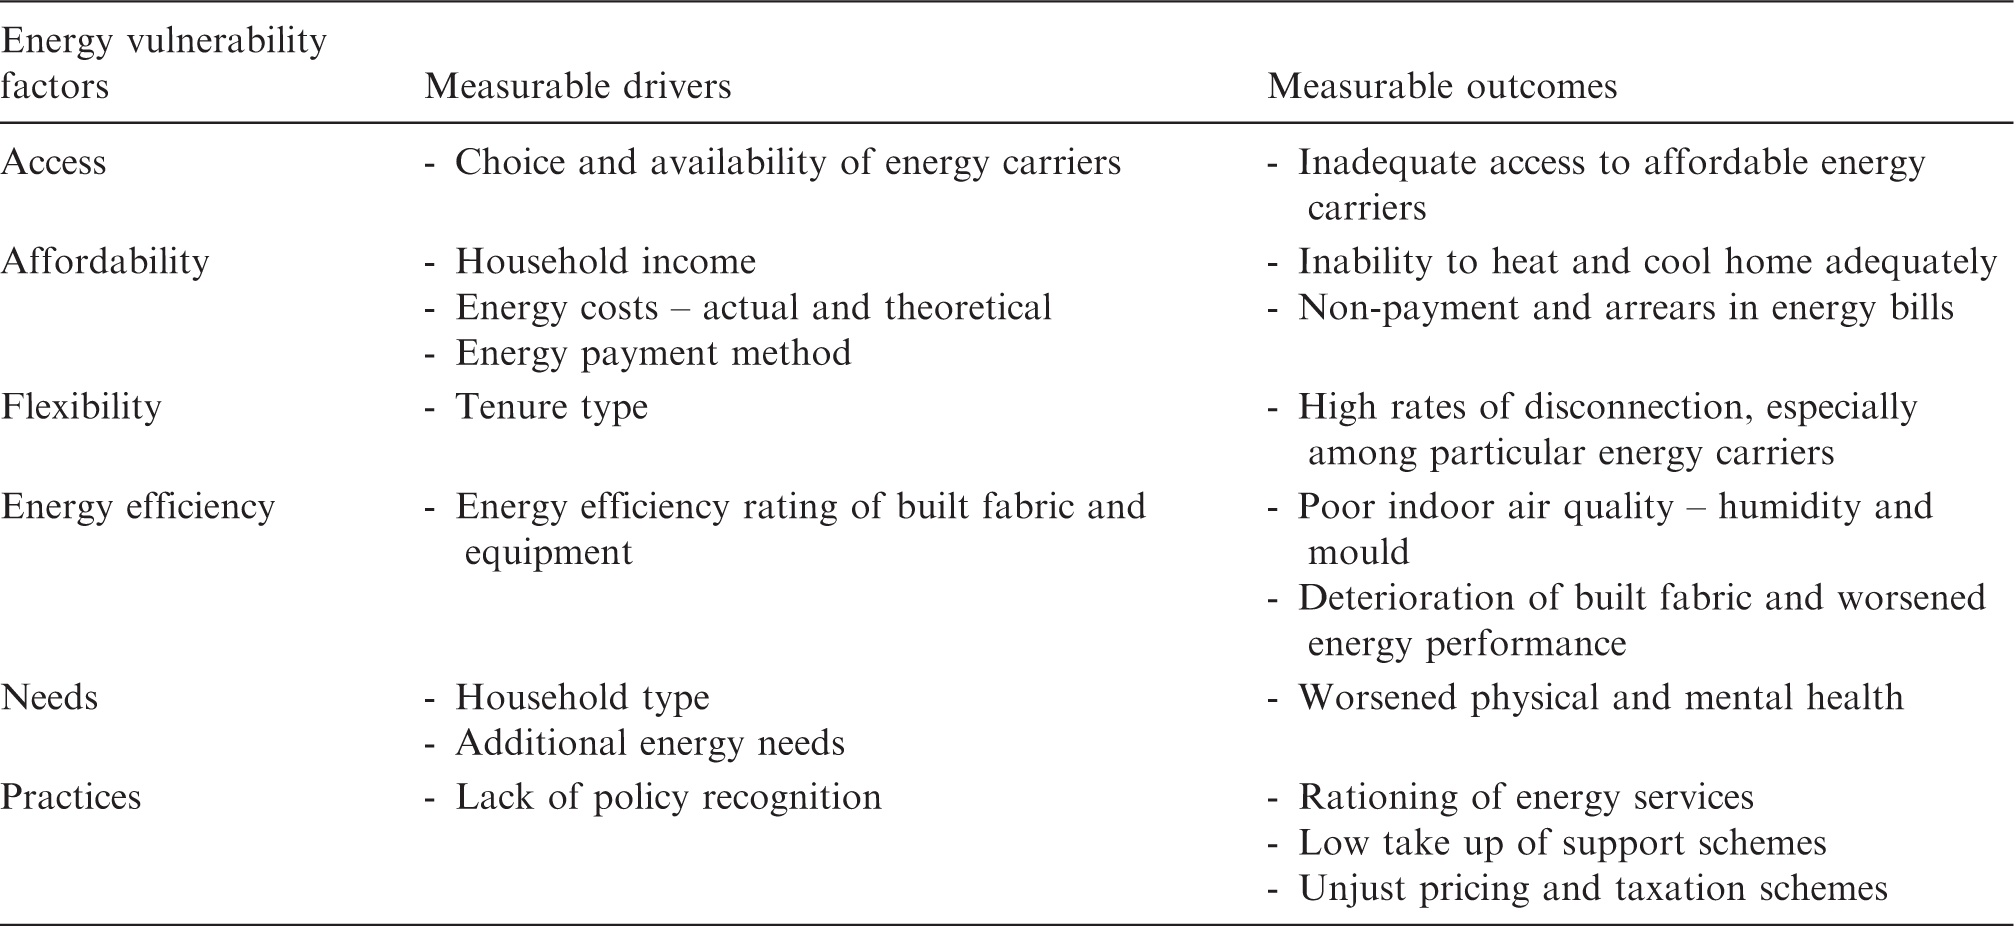
In contrast to existing fuel poverty or energy poverty approaches, this framework demonstrates that domestic energy deprivation is not easily captured by a single metric (see also literature28,59). In deciding how to combine the different vulnerability factors of energy poverty, one approach might be to capture the causes of the condition. This can be achieved, for example, by measuring the energy efficiency of a house and the equipment contained within to see if a household would have to pay more than average energy costs to achieve adequate energy services. Alternatively, the outcomes of energy poverty could be captured by determining if a household is rationing energy services, and/or has mould and damp in their home. However, as energy poverty is multi-dimensional, the most desirable approach would be the widest possible combination of indicators of drivers and outcomes to build a detailed picture of the situation.
These general approaches translate into three main methods of measurement:
Expenditure approach – where examinations of the energy costs faced by households against absolute or relative thresholds provide a proxy for estimating the extent of domestic energy deprivation; Consensual approach – based on self-reported assessments of indoor housing conditions, and the ability to attain certain basic necessities relative to the society in which a household resides; Direct measurement – where the level of energy services (such as heating) achieved in the home is compared to a set standard.
The subsequent section is arranged thematically according to the main approaches that can be used to measure energy poverty: expenditure, consensual, and direct measurement. For each approach the key features and requirements are outlined, followed by a discussion of how the approach can be applied at the EU level, ending with a presentation of key studies.
Expenditure approach
Key features, requirements and approaches
One of the most commonly used energy poverty measures is the expenditure approach, which explores the ratio of household income to energy expenditure. The number of energy poor households and the profile of those found to be energy poor at any one time is primarily dependent upon the definition of an energy poverty line. Among the most enduring energy poverty thresholds are the 10% and twice-national median thresholds.
Within this approach, there are a number of important considerations to be made. These include whether to use an absolute or relative expenditure threshold; how to quantify energy needs and spending; and how to measure household income. Given the variety of ways in which expenditure based measures can be applied there are limitations associated with each approach.
Absolute versus relative measures
There are a variety of assumptions that underlie expenditure thresholds, each with particular strengths and weaknesses. Under an absolute measure of energy poverty, a household is considered to be energy poor if they spend more than a fixed X per cent of their income on energy, 39 for instance, in the UK the threshold was previously 10 per cent, and energy poverty rates increase in line with rising fuel prices. Given their construction they make the eradication of energy poverty a possibility. 60
By comparison, energy costs under a relative threshold are typically calculated on a median cost to income ratio (see Moore 61 , p.21). The use of the median value is preferable to the mean value as fuel expenditure is asymmetrically distributed, thus the use of the mean can be misleading as it gives weight to ‘atypically’ high values.61,62 Given that unlike incomes, energy prices do not remain static, relative measures may be subject to substantial fluctuations, 61 providing a more complex account of energy poverty and the difficulty of a ‘moving target’, 60 but potentially one that represents relative hardship more accurately (see Boardman, 2 p.231).
Both approaches have been used by different EU countries at various points in time. The most well documented and copied measure of energy poverty has been the UK’s 10 per cent threshold, which was established in 1991 on the basis of ‘required’ expenditure. More recently, England and Wales have moved from an absolute to relative mode of measurement, with the new Low Income High Costs (LIHC) definition of energy poverty, which defines a household as energy poor if they (a) have high (required) energy costs above the national median, adjusted for household composition, and (b) low household income, which is defined as income below the sixty per cent median poverty line, adjusted for household size and composition,
The design of the relative energy costs component of the British LIHC has been heavily criticised by numerous academics and consumer organisations, including Walker et al., 64 Consumer Focus, 65 and Boardman, 60 for its failure to provide an accurate picture of the extent to which households can or cannot afford their energy costs. Walker et al. 64 note that the new energy costs threshold means that households in smaller properties, which typically have lower fuel costs and subsequently need a lower income to cover these costs, are less likely to be classified as energy poor. They argue that vulnerable, lower income households tend to be the occupants of smaller dwellings (see Walker et al., 64 p.90). Furthermore, in response to the Hills review, Consumer Focus noted that the adoption of the new definition would make it impossible to hold the Government to account for achieving its statutory duty to eradicate fuel poverty (see Consumer Focus, 65 p.7). In addition, it is argued that the LIHC measure has little value as an indicator since ‘it barely changes over time, even when there are significant changes in fuel prices and/or energy efficiency or tariff interventions’ (see Consumer Focus, 65 p.8).
Energy needs and spending
For an expenditure based measure of energy poverty some quantification of energy costs is required. Two main approaches exist, required theoretical spend and actual spend. In the UK, modelled required energy consumption takes into account the energy required for space heating, water heating, lights and appliances, and cooking. 66 The model takes into consideration required internal temperatures based on World Health Organisation guidelines, 67 occupancy rates (hours spent in the home and under occupancy), energy efficiency, and types of fuel available to the household. 66 The approach used in the United Kingdom relies on detailed information to be collected about all aspects of the dwelling. 66
Required fuel expenditure is considered to be more meaningful than actual spend, particularly as it is unaffected by the priorities and decisions households actually make. 68 However, the modelling framework makes certain assumptions concerning standard occupancy, lighting patterns and heating patterns, aspects which are likely to have the largest impact on whether a household is vulnerable to energy poverty. The growing literature on household energy needs has problematized many of the implicit expectations that operate in this context, highlighting the multiple ways in which the constitution of ‘essential’ energy use is politically- and culturally-contingent.58,69,70 Previous work has found that standard assumptions embedded in energy models are insensitive to cultural differences in the use of rooms, leading to incorrect estimates of required energy consumption. 71 Furthermore, the housing data required to do so is almost unique to the UK 61 and consequently no other European country conducts in depth modelling. As such, the majority of non-UK based studies have used actual expenditure.
Actual fuel expenditure is easier to calculate, but is widely regarded as a poor indication of energy poverty,61,72 especially as low income households often spend significantly less on fuel than would be required to maintain a warm home.61,73 Indeed, a comprehensive study of household fuel expenditure in the UK by Hirsch et al., 68 found that on average, households consume only around two thirds of their theoretical ‘need’, with people on low incomes most likely to be under-consumers of fuel. Furthermore, the use of actual fuel expenditure may be problematic in states where meter readings may be as infrequent as every two years. 74
Household Income and social transfers
The final consideration necessary for both required and actual fuel expenditure models is how to accurately assess household income. However, the definition of income is contentious in three key ways: firstly, whether to use a before housing costs or after housing costs measure, secondly, which social transfers/welfare payments, if any, should be included within this calculation, and lastly, whether income should be equivalised to reflect household size.2,75,76
Advantages and criticisms
Among the main reasons for the popularity of the expenditure approach are its perceived objectivity and the quantifiable nature of the approach. However, there are numerous criticisms that can be levied on the approach. Firstly, the (mis)interpretation of the UK’s expenditure method in other countries has shown that the underlying methodology is complex and not easily transferred. By using a 10 per cent actual expenditure threshold that is not grounded in the specific context of the country under study, researchers risk producing invalid results. Indeed, the confusing nature of the expenditure approach has been highlighted by Healy and Clinch77 who state ‘it can be misleading, as several formulae now exist for calculating fuel poverty, some with housing costs included in net household income…while other calculations analyse gross household income as opposed to net’ (see Healy and Clinch, 77 p.5).
Secondly, Harrington et al. 78 condemn the methodology for calculating required fuel expenditure, stating: ‘a formula-based fixed model of acceptable heating, perhaps driven by the ‘tyranny of numbers’, may give a misleading picture of household need’ (see Harrington et al., 78 p.266). This point corresponds with that made by Bouzarovski et al.,13 who assert that the delimitation of the causes of energy poverty to ‘low income, inadequate building quality and high energy prices’ ignores the importance of energy needs and socio-demographic circumstances at the household scale (see Bouzarovski et al., 13 p.78). Healy and Clinch 77 also further criticise the method for its inability to ‘capture the deprivation and social-exclusion elements of fuel poverty’.
Recent research conducted by Snell et al. 5 highlights how both the calculation of income and characterisation of energy needs can be problematic in the English expenditure based measures (10 per cent and LIHC). The authors find that under the current measures of energy poverty, disability related benefits such as Disability Living Allowance (DLA) are treated as disposable income that could (in theory) be spent on energy bills. This decision is controversial given that such welfare benefits are intended to compensate for the additional costs associated with a specific impairment or condition. Critics argue that including such benefits as disposable income within energy poverty calculations is likely to result in energy poverty rates amongst benefit recipients being under-reported.5,75,79,80. Furthermore, Snell et al. 5 also argue that the use of a ‘one size fits all’ approach to modelled energy requirements is problematic. There is a substantial evidence base that suggests that people with particular impairments or conditions may have elevated energy needs as a result of (amongst other things) higher indoor temperatures; longer periods of warmth; the use of air conditioners and other energy intensive equipment; and additional washing and drying facilities.81,82 However, these needs are not considered within the current measurement of energy poverty in England, and arguably, as a result, this is likely to underestimate the energy needs, and potentially expenditure, of a highly vulnerable group. Given the rigid treatment of energy needs and inclusion of disability related benefits as disposable income, it is likely that the existing English definition under-estimates energy poverty rates amongst one of the groups considered by policy makers most vulnerable to its effects.
Emerging literature shows that in developing a pan-European approach to measuring energy poverty, country specific contexts must be acknowledged. For example, Tirado Herrero and Ürge-Vorsatz 83 demonstrate that particular attention needs to be paid to the characteristics of district heating systems, which are widespread in Central and Eastern European countries, as many do not allow individual dwellings to regulate the temperature or timings. The most pertinent critique of the expenditure approach, however, is that it is not easily applied at the European scale. As stated previously, the UK is almost unique in its production of a series of large national housing condition surveys. Without the replication of this model in other member states, a required fuel expenditure approach cannot be applied on a European basis, necessitating the use of less favourable actual fuel expenditure data.
Key studies
Summary of expenditure based assessments of energy poverty across the EU.
Consensual approach
Key features, requirements and approaches
Given the criticisms and difficulties associated with the expenditure approach, particularly in a European context, some academics19,39,77,93 have proposed the use of self-reported ‘consensual’ indicators to quantify energy poverty. The consensual energy poverty method is grounded in Townsend’s 94 relative poverty approach, and the consensual poverty measurement research pioneered by Mack and Lansley 95 and later Gordon et al. 96 At its core, this relative approach is based on the inability ‘to afford items that the majority of the general public considered to be basic necessities of life’ (see Gordon et al., 96 p.7). Typically, this has involved asking households whether they can afford to heat their home, pay their utility bills on time, and live in a damp and rot free home.
Advantages and criticisms
The consensual approach to measuring energy poverty has numerous strengths. Firstly, it can be less complex to collect consensual data than expenditure data, particularly required modelled expenditure data, thus it may be suitable as an interim measure of energy poverty in countries that lack a comprehensive house condition survey. In a study of thermal comfort and housing quality in Ukraine, Petrova et al. 93 demonstrate the benefits of using self-reported consensual indicators to assess energy poverty. A key result from their analysis was the importance of energy efficiency in driving energy poverty, which they argue lends credence to the use of consensual measures (see Petrova et al., 93 p.1254). Secondly, at the European level there are no standardised micro-data concerning household fuel expenditure or house conditions,19,77 and so by employing consensual indicators from the EU-SILC survey researchers have been able to circumvent data issues and quantify EU energy poverty. A third strength, and arguably the most important, is that a consensual approach to energy poverty has the potential to ‘capture the wider elements of fuel poverty, such as social exclusion and material deprivation’ (see Healy and Clinch, 77 p.10). By using consensual indicators that require value judgements, researchers can gauge an individual’s experience of energy poverty and their perceived burden. Some researchers argue an additional benefit is that the consensual approach is a bottom-up process, with assessments of adequate warmth and thermal comfort made by the respondents themselves. 93
Conversely, there are a number of inherent limitations associated with the consensual approach. Most notably, the subjectivity of the indicators used in the consensual approach have been criticised for their error of exclusion, whereby households may not identify themselves as energy poor even though they may be characterised as energy poor under other measures. 28 For instance, Boardman 97 states that the energy poor may deny the reality of their situation, and so will say they are warm enough even if they are cold. In addition, the concept of ‘adequate warmth’ is subjective and culturally specific, meaning that a ‘home normally considered well-lit and warm in one geographical context may not be seen as such in another’ (see Bouzarovski, 98 p.3).
Furthermore, the degree to which consensual measures overlap with expenditure measures is a concern. For example, using English House Condition Survey data from 2005, Palmer et al. 99 found that very little overlap exists between energy poverty using a consensual measure and energy poverty using the UK’s 10 per cent expenditure threshold. Indeed, just 6% of households in energy poverty by the standard expenditure definition said that their living rooms were not warm in winter because of the cost it took to do so (see Palmer et al., 99 p.16). Additionally, Palmer et al. 99 found that a third of households that declared they were unable to keep their living rooms warm in winter had average or above-average incomes.
McKay et al. 100 is also critical of consensual deprivation indicators, stating they ‘assume that there is a broad consensus on what goods/services families should be able to afford, and that an inability to afford those items can measure deprivation’. Consequently, if the underlying assumptions are incorrect, a person may appear poor due to their consumption preferences rather than lacking resources. 100 Indeed, with regard to air conditioning, Sampson et al. 101 found that some participants actively opted not to use air conditioning by preference. This highlights the importance of gathering public opinion on what items are necessary, and reveals a weakness of previous pan-European consensual energy poverty work – the indicators have not been tested with the general public prior to analysis, thus consensus is assumed to exist across 28 diverse countries.
Key studies
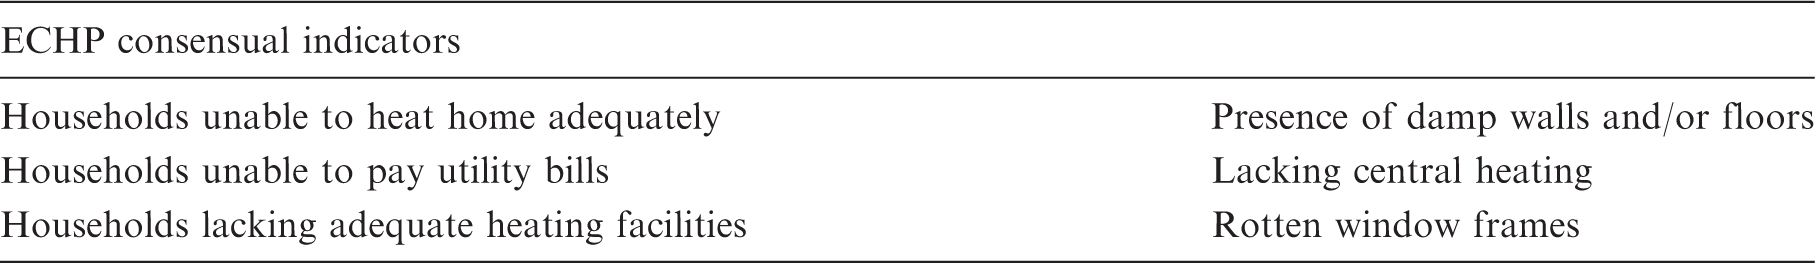
However, in 2001, the ECHP survey was discontinued and replaced with the EU-SILC survey. Several variable changes occurred during the transition from ECHP to EU-SILC which has made it more difficult to model EU energy poverty, including the loss of a variable asking if a dwelling has central heating, and the merger of two separate housing condition variables (presence of damp walls and/or floors, rotten window frames) to form a single variable in EU-SILC.
To date, there have only been two key studies that have used EU-SILC micro-data.19,38 The first study by the EPEE project was co-financed by the European Commission and analysed energy poverty in the United Kingdom, Spain, Italy, Belgium and France using EU-SILC data from 2005.38 Later, Thomson and Snell 19 quantified energy poverty across 25 EU member states. Both studies employed just three proxy indicators to measure energy poverty, compared with the six available to earlier researchers. Macro-EU-SILC data has also been used on a national scale to explore energy poverty in Belgium 85 and in Hungary, 88 as well as at the pan-EU level.41,98,103
Direct measurement approach
Key features, requirements and approaches
The direct approach attempts to measure if sufficient levels of energy services are being achieved in the home, such as heating and lighting. To date, this has mainly involved taking internal temperature readings to determine if households are attaining ‘adequate’ levels of warmth that promote good health and well-being. However, this approach is rarely used to measure energy poverty and has never been employed at the European scale. 104 This is due to the technical issues involved with measuring energy services, determining adequate standards, and ethical concerns about entering homes and monitoring households.
As Healy 39 explains, whilst the temperature approach seems simple in theory it is problematic for a number of reasons, ‘chiefly because of the inadequacy and unreliability of data on household temperatures, while intermittent occupancy may also distort results using this approach’. A central issue when using a temperature approach is deciding on what temperature thresholds to use. Boardman 2 states that the temperatures needed to provide adequate warmth are ‘21℃ in the living room and 18℃ elsewhere, when these rooms are occupied’. This temperature range is used in the English, Welsh and Northern Irish energy poverty models, and originates from standards established by the World Health Organization. 67 By comparison, Scotland uses a slightly higher threshold of 23℃ in the living room for disabled, infirm and elderly households, 2 reflecting the additional heating requirements that these households may require. However, the 18℃ to 21℃ range is not accepted by all as the correct range, with some level of debate as to what constitutes a comfortable internal temperature. As Healy131 states ‘many physiological, psychological and environmental variables play a part in humans’ perception of thermal comfort’, whilst Critchley et al. 105 found that some householders preferred temperatures lower than the prescribed limits due to various reasons other than financial constraints.
However, Healy 39 is critical of using living room temperatures as an indicator of thermal comfort and energy poverty, arguing that social desirability bias may cause households to heat the living room to a higher level than normal in anticipation of the interview. Furthermore, in countries where many dwellings are served by district heating systems that do not allow individuals to control their heat consumption, such as in Central and Eastern Europe, temperatures are not a good indicator of energy poverty as the internal temperatures are ‘typically adequate, or in cases even too high’. 83
Consequently, large scale empirical temperature data are scarce at the national level – for example, in England the English House Condition Survey (EHCS) stopped recording spot living room temperatures in 1996 2 – and non-existent at the pan-European level. However, the move towards ‘smart homes’, as well as the smart meter rollout across the EU, hints at future potential for utilising the direct measurement approach in a more widespread manner.
Key studies
Due to the inherent difficulties associated with the direct measurement approach only a limited number of studies have been conducted using this method. Oreszczyn et al. 106 conducted a comprehensive study of internal living room and bedroom temperatures in 1604 English houses, taking half-hourly readings for two to four weeks across two winters. These measurements were collected from low-income households that were receiving energy efficiency improvements to their property through the Warm Front scheme. In this study around one thousand data points per dwelling were collected, 106 compared with the EHCS’s single data points.2
Healy and Clinch 27 have also conducted research into internal room temperatures via their national household survey of energy poverty and thermal comfort in the Republic of Ireland. In total, 1500 households were recruited by random probability-based sampling, and were questioned about their ability to heat their home adequately and had their living-room temperature measurements taken. Healy 39 found that 29.4% of energy poor households had a living-room temperature of 18℃ or less, compared with just 8.8% of other households. However, they also discovered that a mismatch exists between households classified as energy poor and those that are enduring thermal discomfort, stating ‘not all those who are defined in the study as fuel-poor can be classified as enduring thermal discomfort’ (see Healy, 39 p.135).
An extensive review of studies that have used direct measurement of indoor thermal conditions among low income households in Europe is provided by Kolokotsa and Santamouris. 107 While not explicitly focused on energy poverty, the paper provides important insights into the usefulness of this measurement method in establishing energy poverty patterns. It is notable that very little research has been done to establish deprivation beyond energy services such as space heating and cooling.
Currently available pan-EU data and indicators
Expenditure data and indicators
Available data
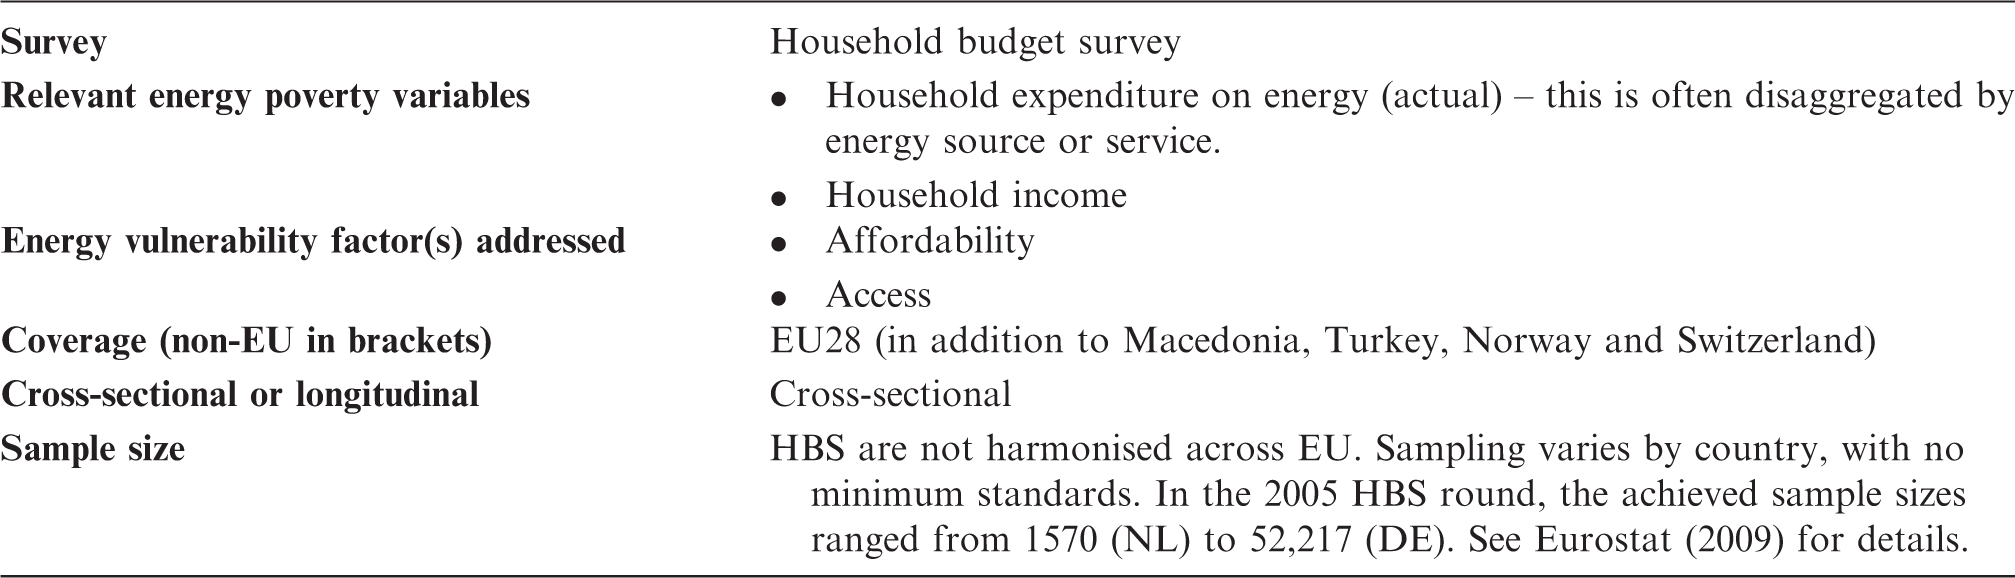
For expenditure-based assessments of energy poverty, the only available option is to use HBS data. The HBS are conducted in all EU countries and contain data on household expenditure on goods and services, including household energy. The main purpose of HBS is to compile weights for Consumer Price Indices and national accounts. 108 However, at present the HBS datasets are not harmonised across the EU and there is significant variation in sampling methods, variable design and how often Member States conduct HBS, ranging from annually to every five years. 108 Given the lack of standardisation, Eurostat do not release a pan-EU public version of HBS, instead researchers are reliant on accessing micro-data on an individual country basis, or using aggregated macro-data on specific indicators, compiled by European Commission staff.
Summary of available expenditure data.
Available indicators
Energy burden
The main use for the HBS is to calculate household energy burdens or ‘affordability ratios’. It is thought that high energy burdens signify increased levels of material deprivation in the home, as they point to the prioritization of energy over less essential costs, such as food, clothing, or medicine.
Using macro-data provided by the European Commission (EC),
18
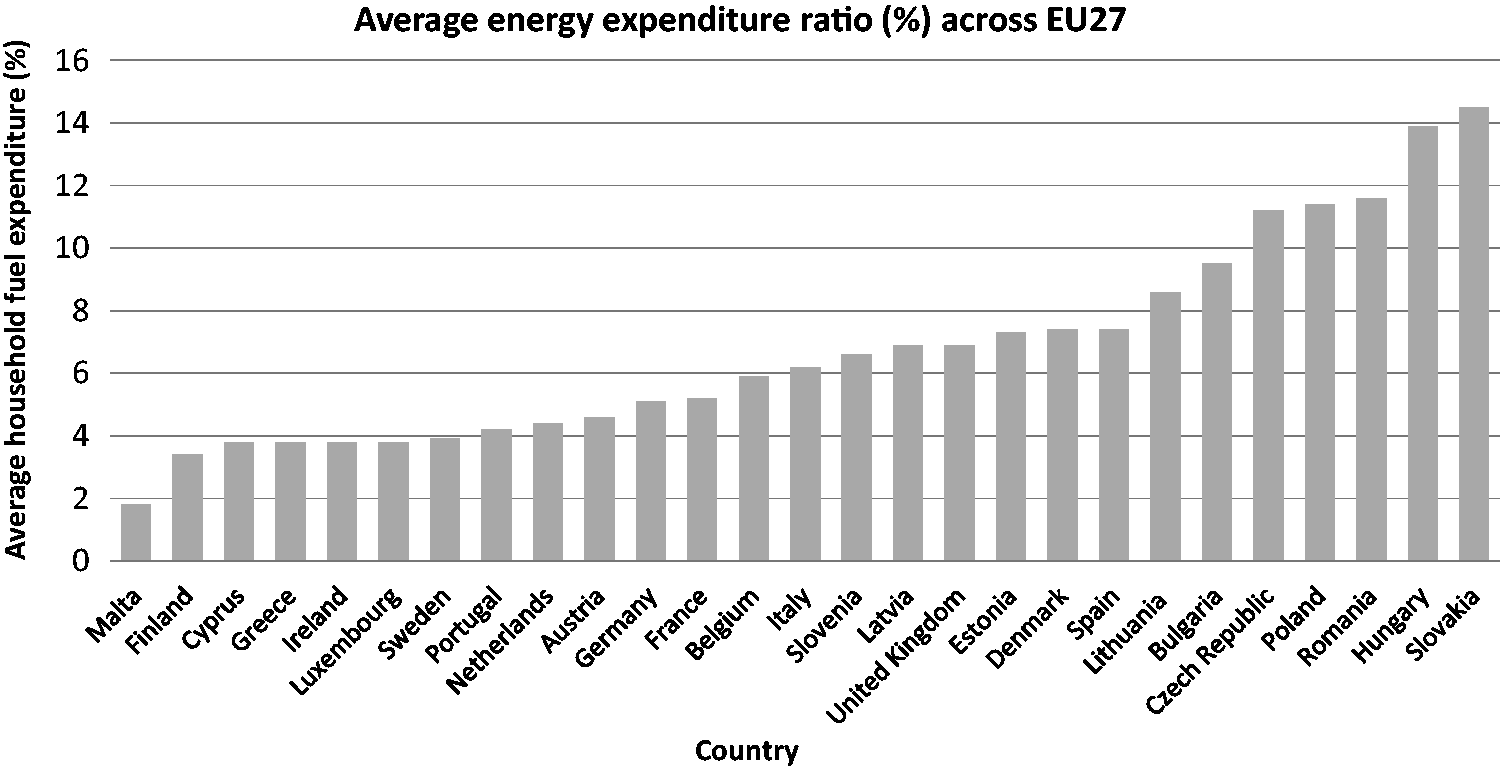
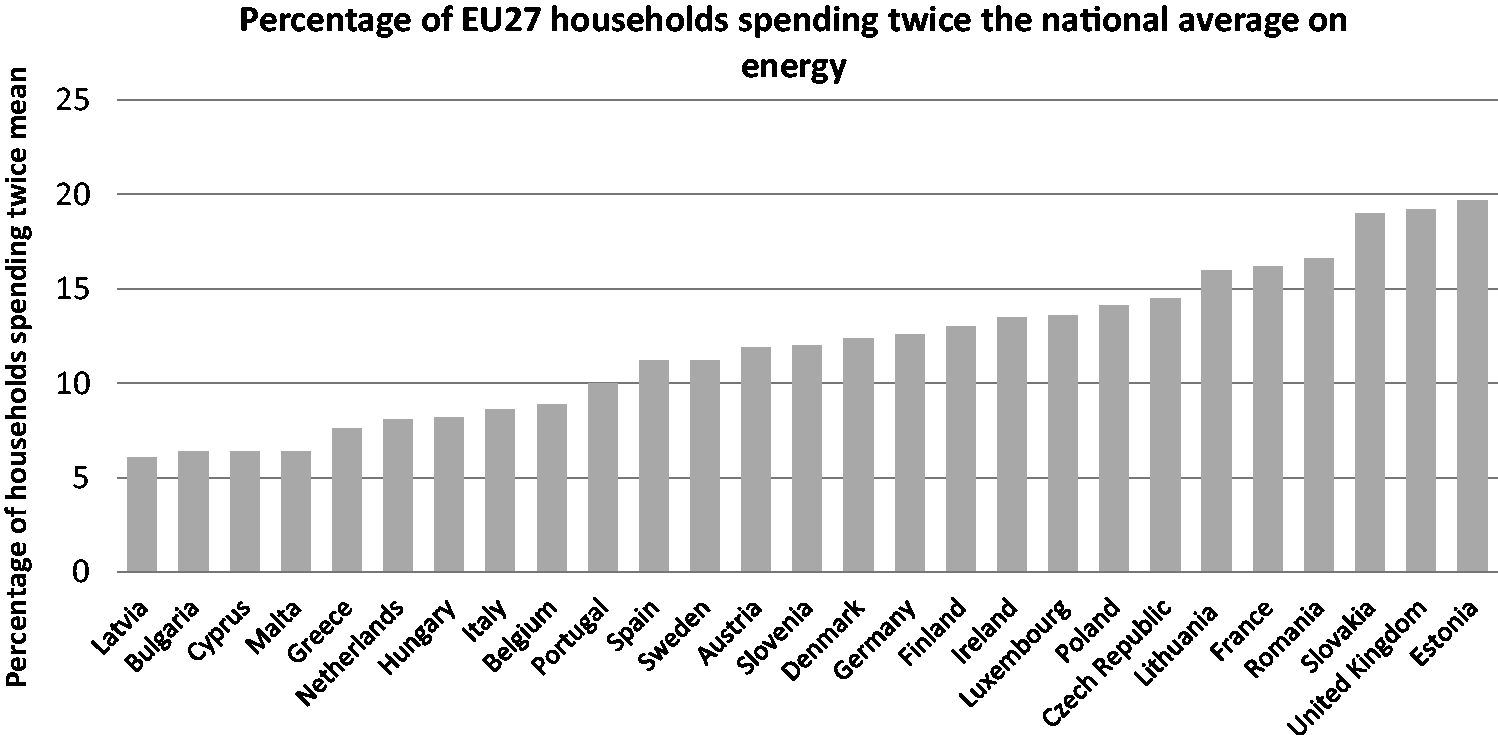
Figure 1 depicts the average (mean) ratio of actual household income that is dedicated to energy expenditure across EU27, while Figure 2 displays the percentage of households across EU27 that spend twice the national average on energy. The data reference year varies from 2005 to 2008 depending on the country. Overall the indicators show that on average households in Malta and Finland spend the least amount of income on energy (1.8% and 3.4% of income respectively), whilst Hungary and Slovakia spend the most (13.9% and 14.5%). The percentage of households across EU27 that spend twice the national average on energy ranges from 6.1% of households in Latvia, through to 19.7% in Estonia.
Average energy expenditure ratio; data reference year varies from 2005 to 2008 depending on country. Data source: European Commission.
18
Percentage of households spending twice the national mean on energy; data reference year varies from 2005 to 2008 depending on country. Data source: European Commission.
18
Consensual data and indicators
Available data
Summary of available consensual data.
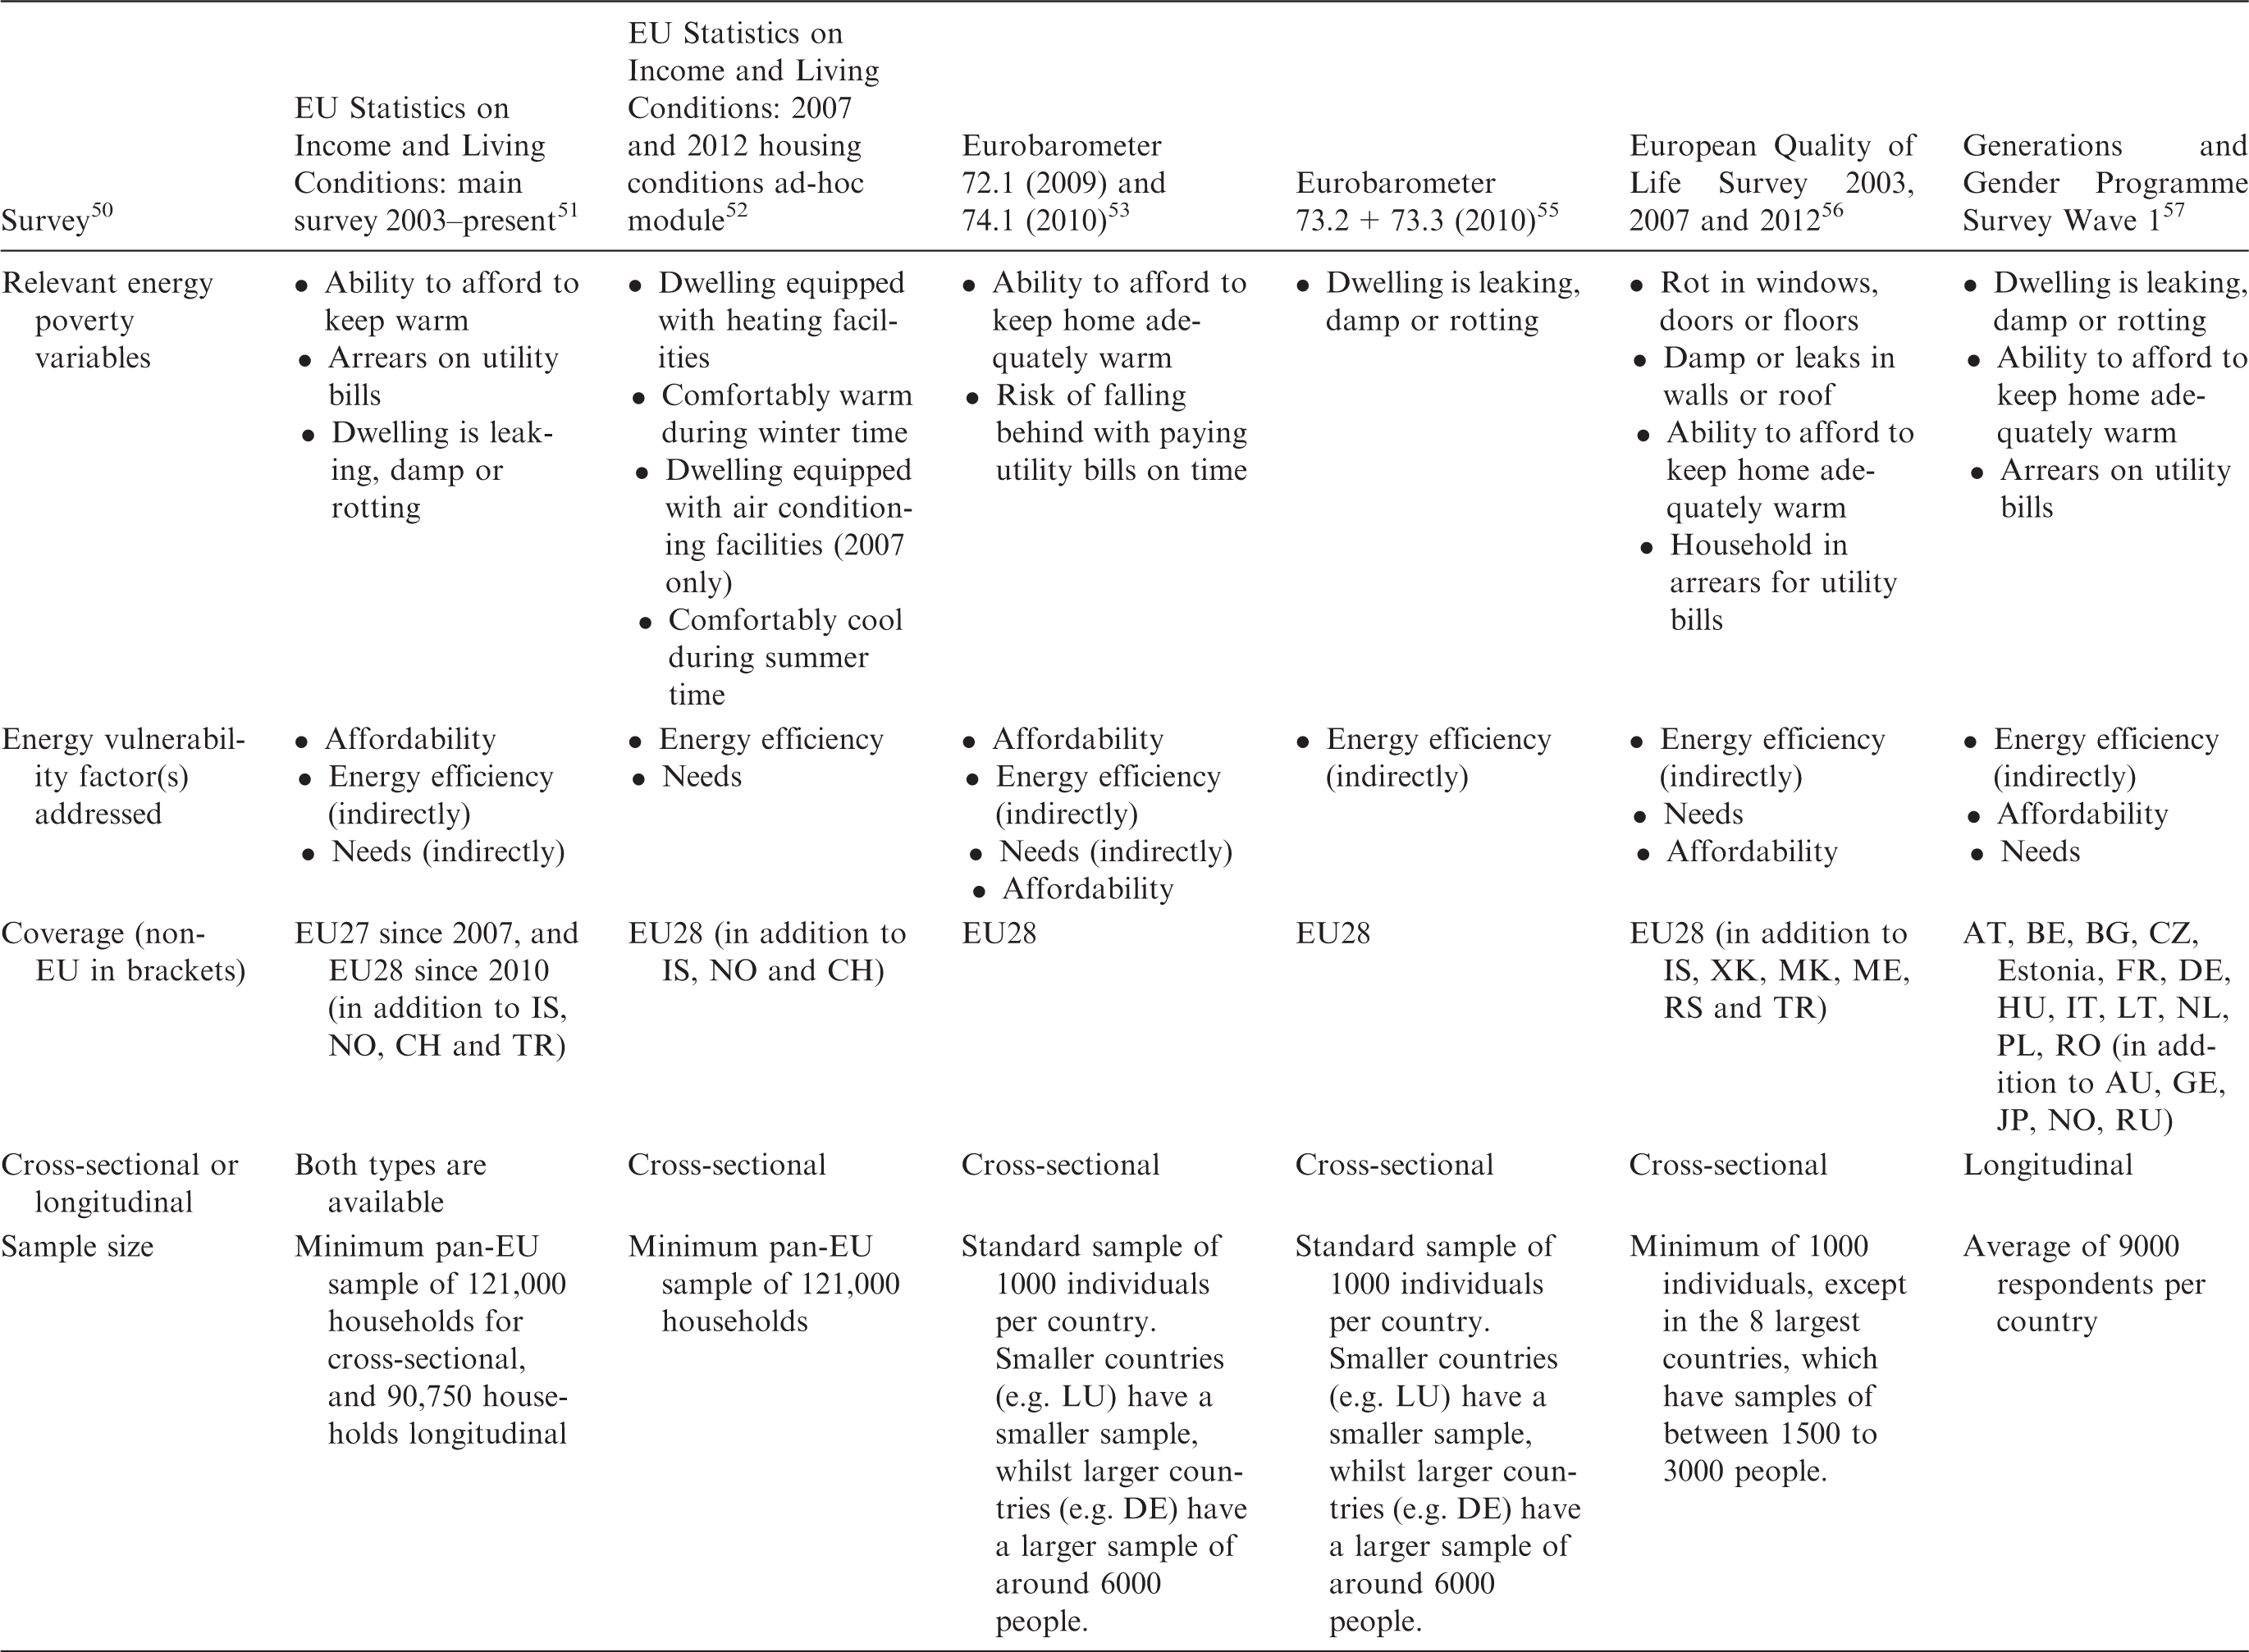
The Eurobarometer is a series of public opinion surveys that have been conducted since 1973 on behalf of the EC. 111 The surveys are designed to provide regular monitoring of public attitudes across the EU via specific trend questions. By comparison, the EQLS has been conducted three times by the European Foundation for the Improvement of Living and Working Conditions, in 2003, 2007 and most recently in 2012. As the name implies, the aim of the EQLS is to explore the quality of life throughout Europe. The survey focuses on living conditions, attitudes, health and wellbeing. 112
The Generations and Gender Programme survey (GGP) is conducted across 19 countries worldwide, with an average sample of 9000 per country. The main goal of the GGP is to improve understanding of demographic and social development, with a particular focus on the relationships between children and parents, and the relationships between partners. 113 Data from this survey have only been used once to date for energy poverty purposes by Bartiaux et al. 114 in their research project focussing on Belgium. However, due to the significant levels of missing and incomplete data that we encountered for the three core indicators in Wave 1, it was not possible to estimate the prevalence of energy poverty related issues in the 13 EU countries in the GGP. Indeed across four of the EU countries, all three indicators are missing entirely. Unfortunately, for these reasons, we would advise against using this data source in its current form.
Whilst these datasets enable a slightly broader examination of energy vulnerability factors than the HBS, it is notable that access, flexibility and practices are entirely missing, whilst energy efficiency and needs are only indirectly measured.
Available indicators
Affordability and arrears
Within this sub-section are variables relating to householder ability to afford to keep their home warm, and arrears on utility bills. The ability to pay to keep the home adequately warm encompasses the standard definition of an energy poor household, 77 and is therefore a key consensual indicator of energy poverty. Being in arrears on utility bills is a good proxy for energy poverty as experiencing financial difficulties with utility bills may indicate a household is struggling to afford adequate energy services. 19 Furthermore, people unable to keep up to date on utility bills may suffer from disconnection of supply. 77
The EU-SILC main survey contains both of these variables, However, these are both framed as dichotomous variables in the pan-EU datasets (although within some national-level files a scale is used instead), with respondents only able to answer ‘yes’ or ‘no’, which fails to capture variation in experiences. It also fails to determine why people are unable to heat their home as no follow up question is asked. A key flaw with the utility arrears indicator is that it refers to all household bills, including water, which may create an overestimation of energy poverty based on this indicator alone.
Figure 3 displays the average figures for the EU-SILC ‘inability to keep warm’ and ‘utility bill arrears’ indicators from 2005 through to 2014, across the 27 EU Member States (EU27). It should be noted that the results for 2005 and 2006 predate the accession of Romania and Bulgaria to the EU in 2007. For inability to keep warm the situation was worst in 2005, with 12.3% of the EU27 population unable to attain adequate warmth, whereas 2013 was the worst year for utility bill arrears, with 10.0% of the EU population reporting utility debt. However, from existing work on this topic we know there is a highly uneven spatial distribution across Europe.19,37 These studies have indicated that parts of Southern, Eastern and Central Europe are worst affected.
EU27 averages for EU-SILC affordability indicators 2005–2012. Analysis of Eurostat macro-data.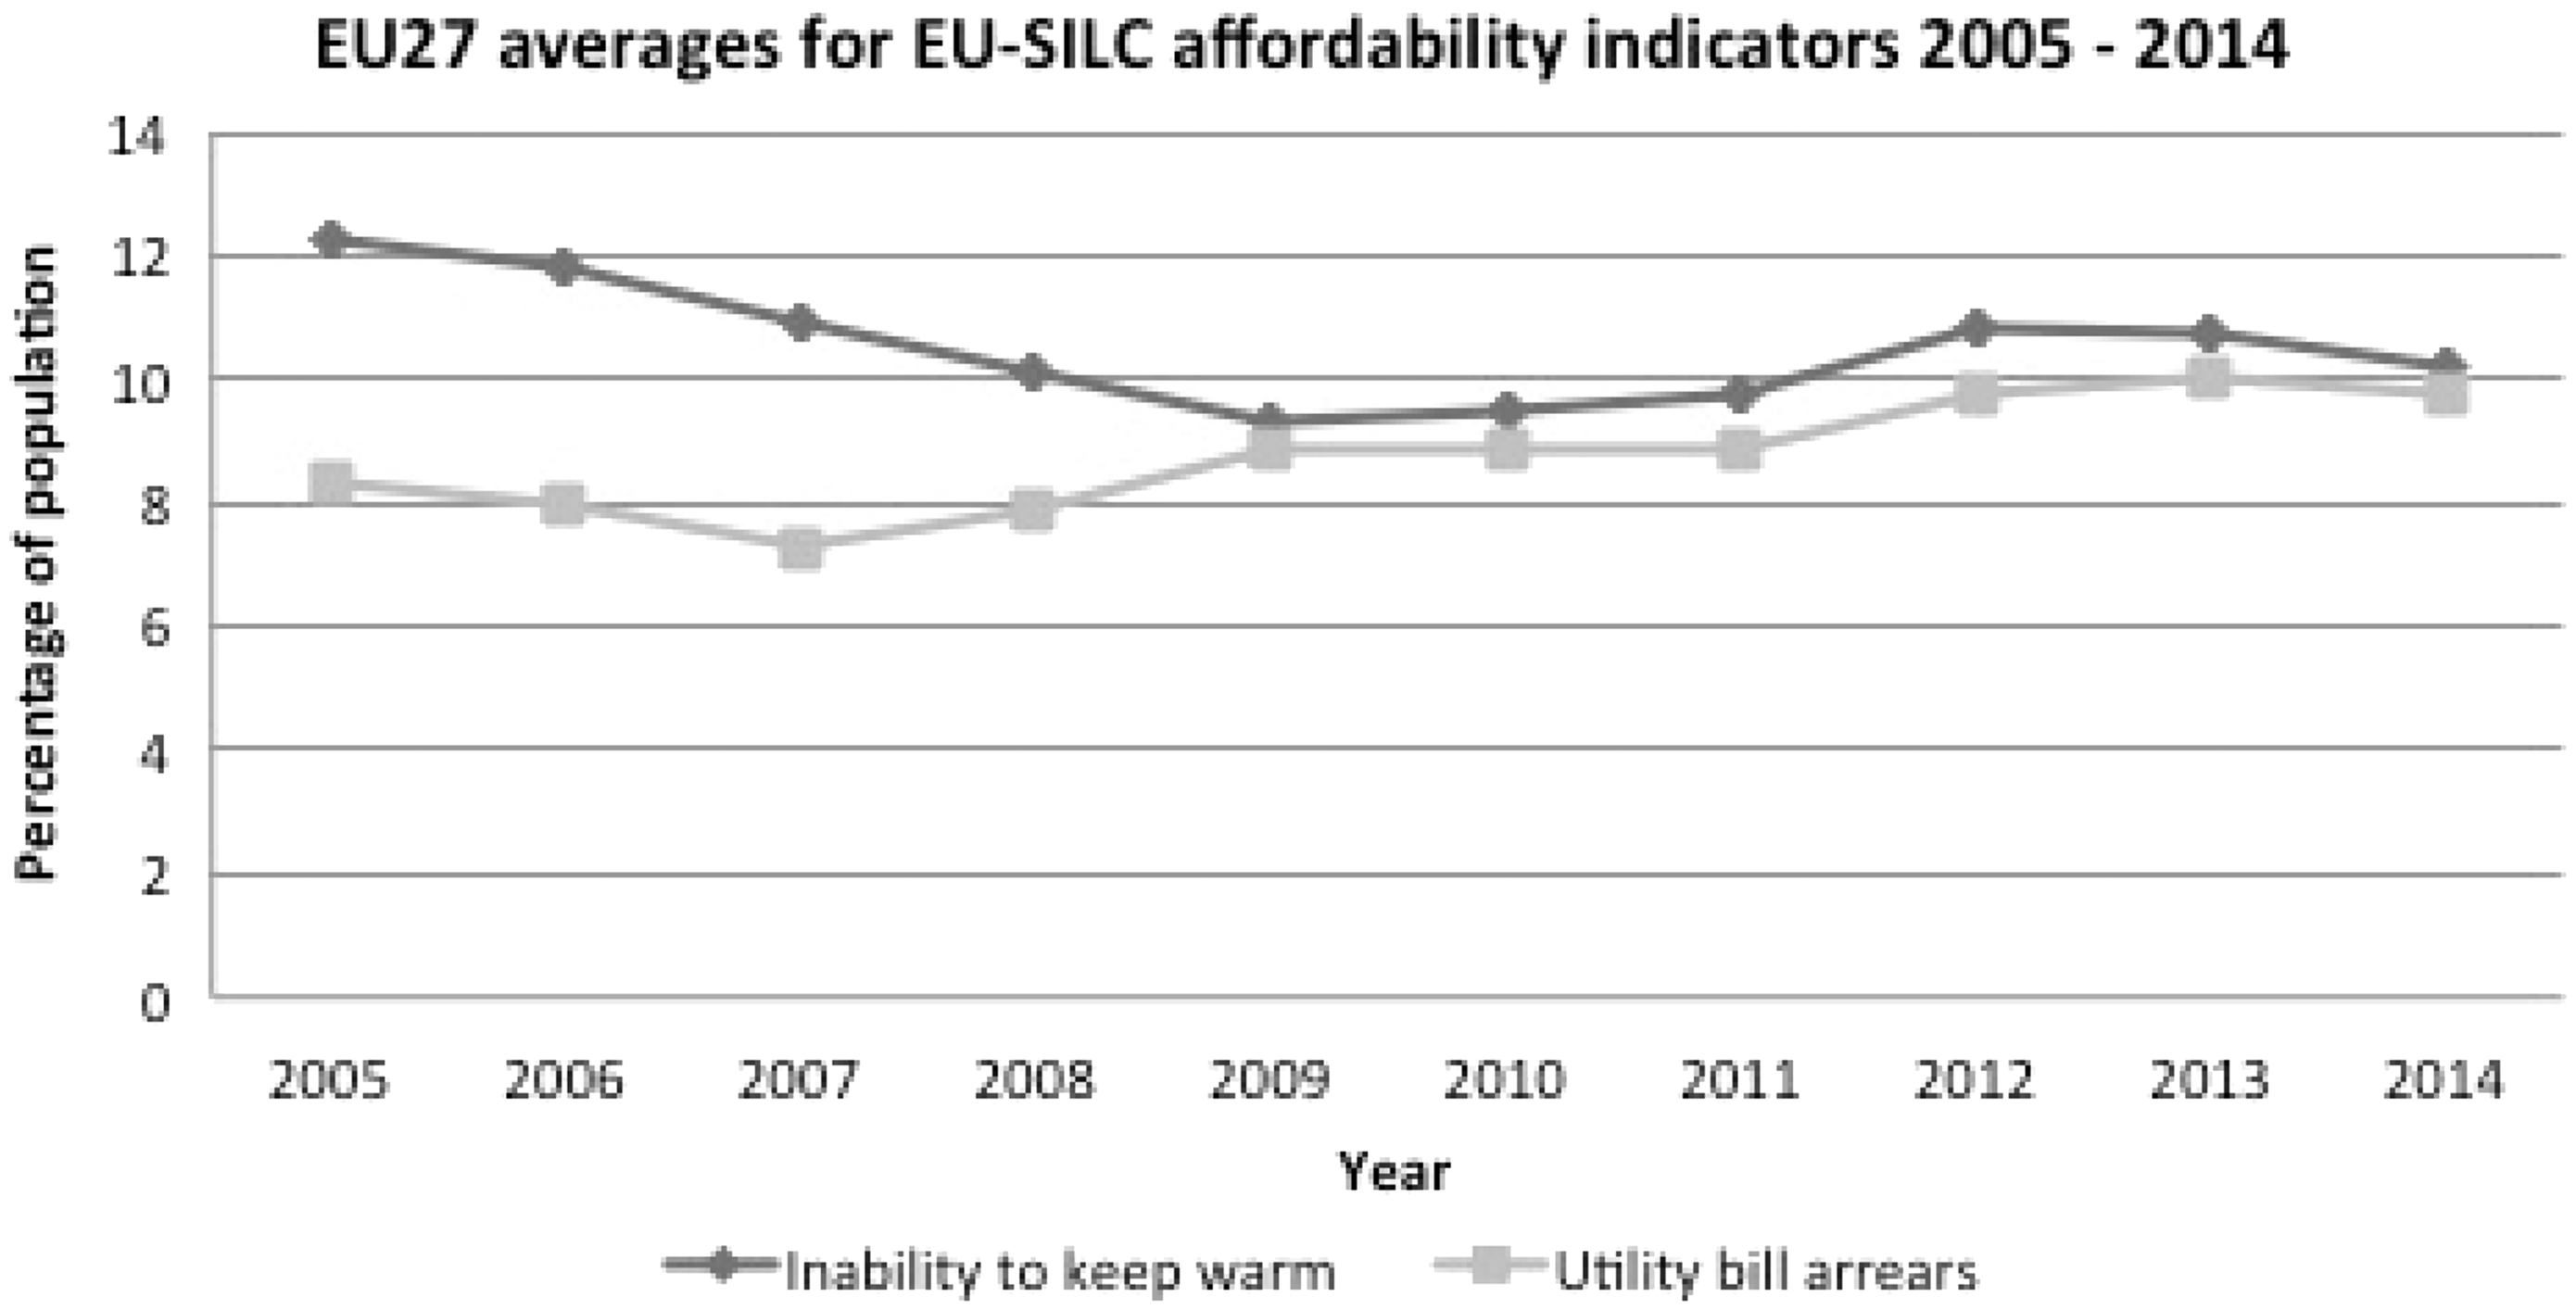
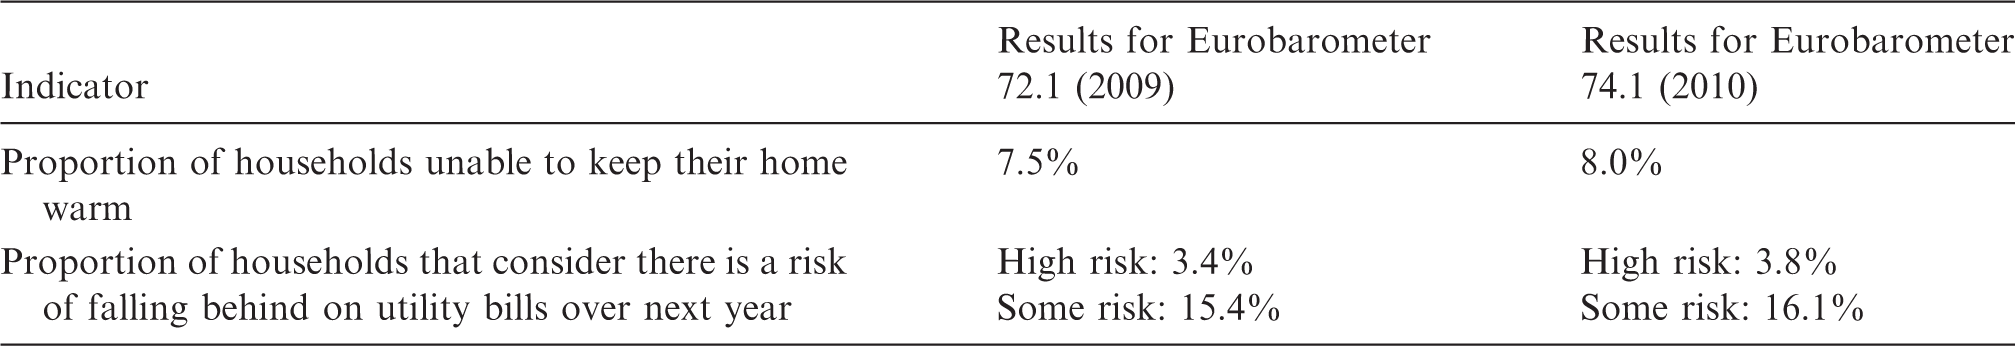
The Eurobarometer 72.1 (2009) and 74.1 (2010) surveys also contain an ‘ability to afford to keep home adequately warm’ variable. In addition these surveys contain a variable focussed on arrears, however it deviates from the EU-SILC survey by asking for an assessment of the ‘risk of falling behind on paying utility bills over next 12 months’, and thus relates to the future risk of falling behind, rather than currently accrued arrears on utility bills. Furthermore, the Eurobarometer arrears variable uses a scale response (high risk, some risk, etc.) rather than a yes/no binary format, which offers additional information on the severity of risk.
Summary statistics for two affordability and arrears indicators from Eurobarometer 72.1 and 74.1.
Source: Analysis of Eurobarometer micro-data.
What is particularly interesting about the results in Table 8 is the self-assessed future risk of falling behind on utility bills over the next 12 months. The EU-SILC figure for people currently in arrears is 8.9% across both years, which is significantly lower than the percentage of people who consider there to be some future risk of them falling behind (15.4% and 16.1%), but also around twice as high as the percentage of people who consider there to be a high risk (3.4% and 3.8%). The format of the arrears indicator used in Eurobarometer is interesting as it represents an individual’s assessment of their future vulnerability to unaffordable energy costs, whilst also helping to distinguish between people in a moderately disadvantaged situation and those in a very deprived situation.
Summary statistics for the EQLS affordability indicators in 2007 and 2012.
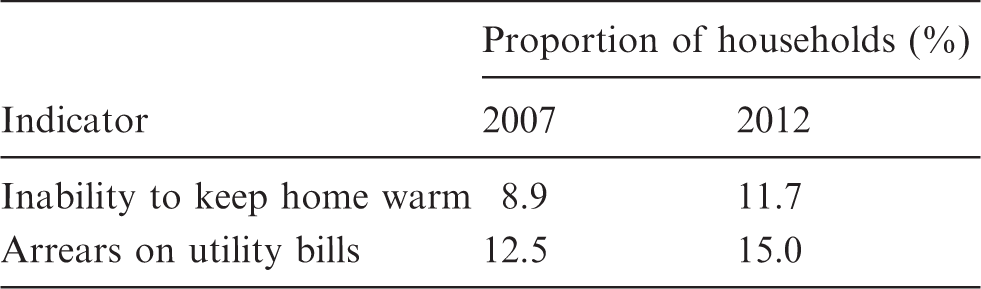
Source: Analysis of EQLS micro-data.
Across both years the EQLS figures for arrears on utility bills are higher than the EU-SILC figures. In addition, the EQLS reports inability to attain adequate warmth to be lower in 2007, at 8.9%, whereas the EU-SILC figure is 10.7%, but in 2012, the EQLS figure increases to 11.7% whilst the EU-SIC remains stable at 10.8%. This difference in figures can be partly attributable to potential sampling errors in the EQLS, which has a much smaller sample than EU-SILC, however, it does also suggest the need to further examine the differences between surveys.
Energy efficiency and housing condition
This next sub-section looks at indicators that can be loosely classified as concerning energy efficiency and housing conditions. The first variable ‘leaking roof, damp walls/floors/foundation, or rot in window frames or floor’, or ‘leak/damp/rot’ in shortened form, is a prevailing proxy indicator of energy poverty. The presence of damp walls or rotten windows may indicate a property is being continuously unheated or ineffectively heated, 77 which is a possible consequence of energy poverty. In addition, the presence of leaks/damp/rot can cause the deterioration of built fabric, leading to increased difficulties with achieving adequate warmth and coolth, and an increase in energy consumption. 38
The leak/damp/rot indicator features in the main survey of EU-SILC, with Figure 4 displaying the average EU27 figures from 2005 through to 2014. This shows that the situation was worst in 2005, with 19.3% of the population living in a home that was damp, rotten or leaking. However, the EU-SILC survey does not ask about severity, nor distinguish between a leaking roof, damp walls, or rotten windows. A further issue with this indicator is that Eurostat proposed to remove it from the main annual survey and instead include it in the ad-hoc Housing Conditions module,
51
which is only deployed every five years.
EU27 averages for EU-SILC housing condition indicator 2005–2012. Analysis of Eurostat macro-data.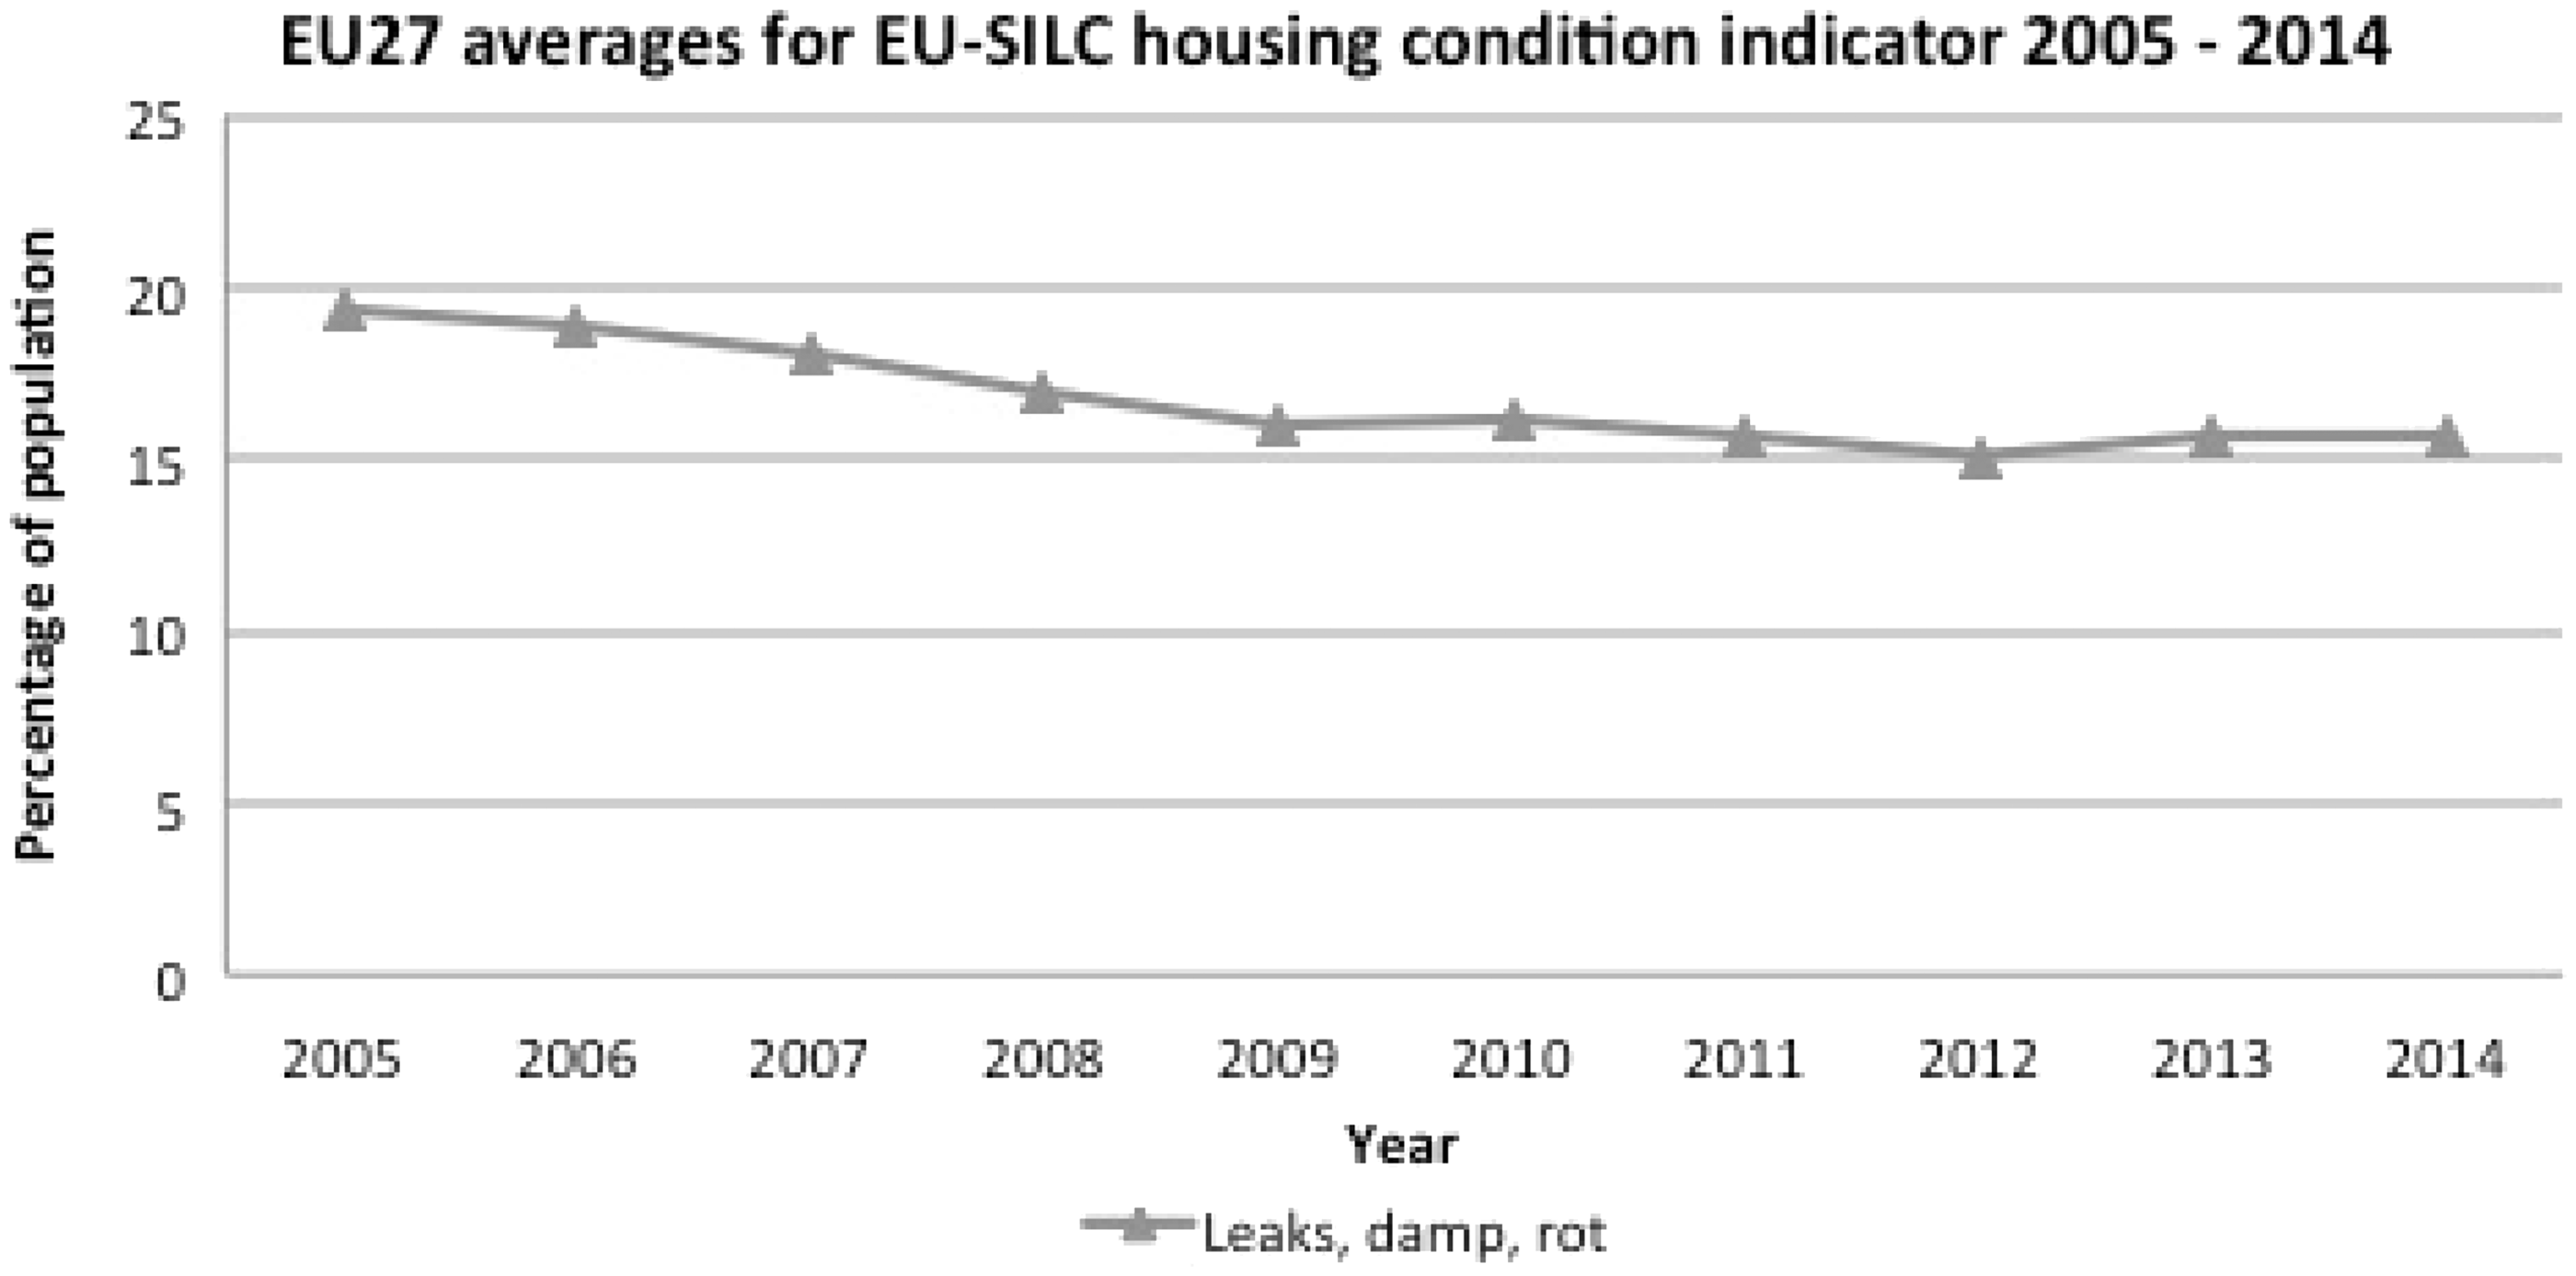
Summary statistics from Eurobarometer 73.2 + 73.3.
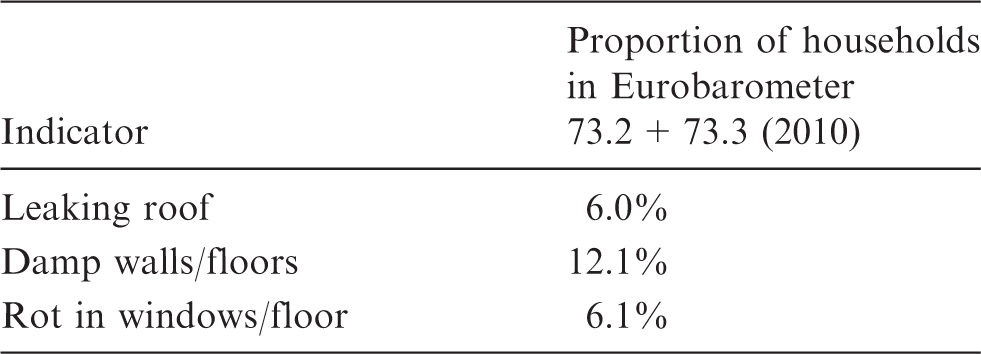
Source: Analysis of Eurobarometer micro-data.
Summary statistics of EQLS housing conditions indicators 2007 and 2012.
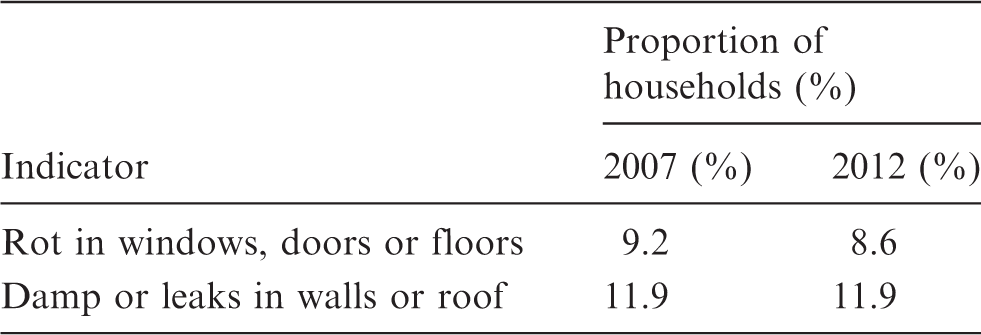
Source: Analysis of EQLS micro-data.
Moving beyond the leak/damp/rot variable, the 2007 EU-SILC ad-hoc housing conditions module contains four additional variables that are useful for energy poverty measurement and broadly concern energy efficiency and housing conditions:
Dwelling comfortably warm during winter time Dwelling equipped with heating facilities Dwelling comfortably cool during summer time Dwelling equipped with air conditioning facilities
The interesting unifying characteristic of these variables is that they are concerned with the equipment present in the dwelling and the technical capabilities of the property. Unlike the adequate warmth question in the main EU-SILC survey, which asks about ability to pay, the two thermal comfort questions in this ad-hoc module are trying to determine if the household feels they are unable to achieve adequate warmth or coolth as a result of their central heating or air conditioning system being inefficient and/or because the property is insufficiently insulated. 115
Summary results from the 2007 and 2012 EU-SILC ad-hoc modules (share of total population).
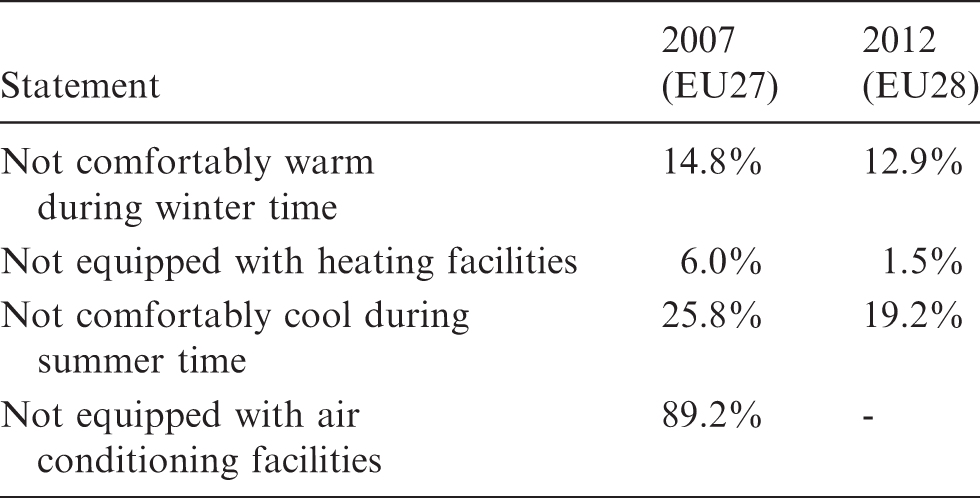
Source: Analysis of Eurostat macro-data.
Pushing the state-of-the-art forward in energy poverty measurement
This paper set out to detail the current state-of-play concerning available statistical data and indicators that could be used to measure energy poverty across the EU and at the national level. In doing so, it aimed to assess if the available data is sufficiently robust and fit for purpose, with assessment made via a vulnerability lens. Our final aim was to consider the type and range of indicators we would like to see embedded within existing survey instruments, and to consider the potential for a new dedicated survey of energy poverty.
In terms of data availability, there is a complete lack of direct measurement data on a pan-EU basis, and scarcity of resources at the national level. For expenditure-based measures, researchers are restricted to HBS data, based on actual energy expenditure. By comparison, there are a variety of data sources that contain consensual indicators, including less widely used surveys such as the EQLS and Eurobarometer. Of the six data sources reviewed overall, only one, the GGP, was found to be entirely unsuitable, whilst the remaining five sources were considered usable to varying degrees, although they would all benefit from some modification.
With regard to the energy vulnerability framework, the only energy vulnerability factors that the HBS can be used to interrogate are affordability, by calculating if there is a high ratio between the cost of energy and household incomes, and access, given that energy expenditure is disaggregated by energy carrier within the micro-data. Although it should be noted that HBS offers no insight into whether the energy carriers used in the home are appropriate to meet household needs. However, within some national HBS micro-datasets, the energy affordability ratio (otherwise termed the energy burden) can be examined at the regional (NUTS 2) level, thus allowing for spatial considerations to be incorporated within analyses. By comparison the range of consensual datasets available enable a slightly broader examination of energy vulnerability factors than the HBS. However, it is notable that access, flexibility and practices are entirely missing – perhaps because they are relatively less known and researched energy poverty dimensions – whilst energy efficiency and needs are only indirectly measured.
Additional weakness of prevailing indicators and measurement approaches include the dominance of top-down measurement that ignores the individualisation of thermal comfort and resilience, the lack of longitudinal temporal focus, and the dichotomous variable formats used in many pan-EU and some national consensual survey files, which are incapable of capturing intermittent versus persistent thermal comfort and housing condition issues. As already mentioned, there is an absence of information on specific household energy practices, as well as their particular coping strategies. There is also a dominance of focus on heating, at the expense of other energy services in the home, such as lighting, cooling, and cooking.
Practical amendments to existing survey infrastructure
A key issue across all of the datasets and indicators listed in this paper is that they were not designed for the purpose of energy poverty monitoring. Nevertheless, there are a number of ways in which existing survey infrastructure could be amended in order to improve the fitness for purpose (see Thomson and Snell 116 for a comprehensive account), many of which are relatively simple variable changes.
Expenditure data and indicators
Currently, HBS data has only been used in a minor way to quantify pan-EU energy poverty, yet efforts to harmonise the HBS, in terms of question wording, sampling methods and frequency, could produce valuable pan-EU micro-data concerning actual domestic energy expenditure. Indeed Eurostat 117 has already started exploring how comparability could be achieved. Whilst the use of actual energy expenditure has its limitations for measuring energy poverty (as discussed above) and the specific limitations of this data need to be fully understood before use, a harmonised dataset of this form would be useful for monitoring basic trends and expenditure by different household types, especially if the data were available at annual intervals. In the interim, we recommend further exploratory work to determine if currently available HBS data could be partially harmonised by uprating the income and energy expenditure data to the same reference year, using micro-simulation modelling that incorporates changes to inflation, poverty and energy prices.
Consensual data and indicators
EU-SILC is the largest survey currently available, and is the prevailing source of data on energy poverty issues, but it could be improved further with the following variable changes:
Disaggregate variable ‘leaking roof, damp walls/floors/foundation, or rot in window frames or floor’ to distinguish between problems. Energy expenditure is collected for EU-SILC, however, it is combined with rent/mortgage payments and other housing costs to create a ‘total housing cost’ variable. We recommend disaggregating this to create a dedicated energy expenditure variable. Amend ‘ability to pay to keep home adequately warm’ so instead of a dichotomous variable format, it uses a Likert type scale response format to detect frequency of the problems.
The EU-SILC ad-hoc modules improve the richness of data concerning energy poverty issues, particularly as they go beyond financial factors. However, the utility of these variables is constrained by the infrequency of the housing conditions ad-hoc module, which prevents annual trends to emerge. Among our key recommendations therefore are:
Include the heating and cooling variables within the main annual EU-SILC survey. Supplement the heating and air conditioning facilities variables with additional energy efficiency questions concerning forms of insulation, window glazing type, draught proofing, and external door material. Combine the two adequate warmth variables from the main and ad-hoc EU-SILC surveys to ask households if they are able to keep their home adequately warm during winter, and if not, if this is due to the affordability of energy, the energy efficiency features of the home, or a combination of these issues?
The Eurobarometer survey is one of the smallest examined in this paper in terms of sample size. Whilst the sampling framework used ensures it is nationally representative, the potential for sampling error exists, particularly compared to larger surveys such as EU-SILC. The broader issue for energy poverty measurement is how often the relevant indicators will be asked in Eurobarometer surveys. Given the transient nature of the Eurobarometer series, it cannot be relied on for regular monitoring, nor would it be appropriate to recommend that energy poverty variables be asked at regular intervals. However, the Eurobarometer data should not be disregarded as it offers unique data on perceived future risk of falling behind on utility bills, as well as the opportunity to conduct a more detailed examination of housing condition due to the use of three separate questions on leaks, damp and rot in the home.
The EQLS is similar in size to Eurobarometer, and so for the annual monitoring of pan-EU energy poverty using a consensual approach, it would currently be more appropriate to use the EU-SILC survey as it is conducted more frequently, and with a much larger sample. However, a key advantage of EQLS data is the ease of micro-data access in comparison to EU-SILC micro-data, which can take several months to obtain. In order to improve the usability of the EQLS, we recommend:
Conducting the EQLS at more frequent intervals, ideally on an annual basis. Amending ‘ability to afford keeping the home adequately warm’ so instead of a binary variable format, it uses a Likert type scale response format to detect frequency of the problems.
Promoting a paradigm shift in energy poverty measurement
Given the limitations of existing data, and the difficulties associated with amending current surveys, we argue that a more ambitious strategy is required, principally via the creation of a new dedicated pan-EU household survey of energy poverty for monitoring energy poverty at the pan-European, national and regional-levels, using multiple indicators. The key advantage of this approach is that it would allow stakeholders to develop an evidence-based dataset that is relevant and appropriate for developing public policies, and assessing and monitoring energy poverty trends. This would progress efforts to address energy poverty, which has been identified as a key priority by numerous EU institutions.16,118 The main drawback is that this would be an enormous undertaking, with significant financial and resource implications. However, if a dedicated survey increased awareness of energy poverty as a policy problem, and led to better policy frameworks across Europe, it could lead to a reduction in the significant external societal costs associated with energy poverty, potentially outweighing the survey expenses in the long term.
Selection of the proposed new topics and indicators.
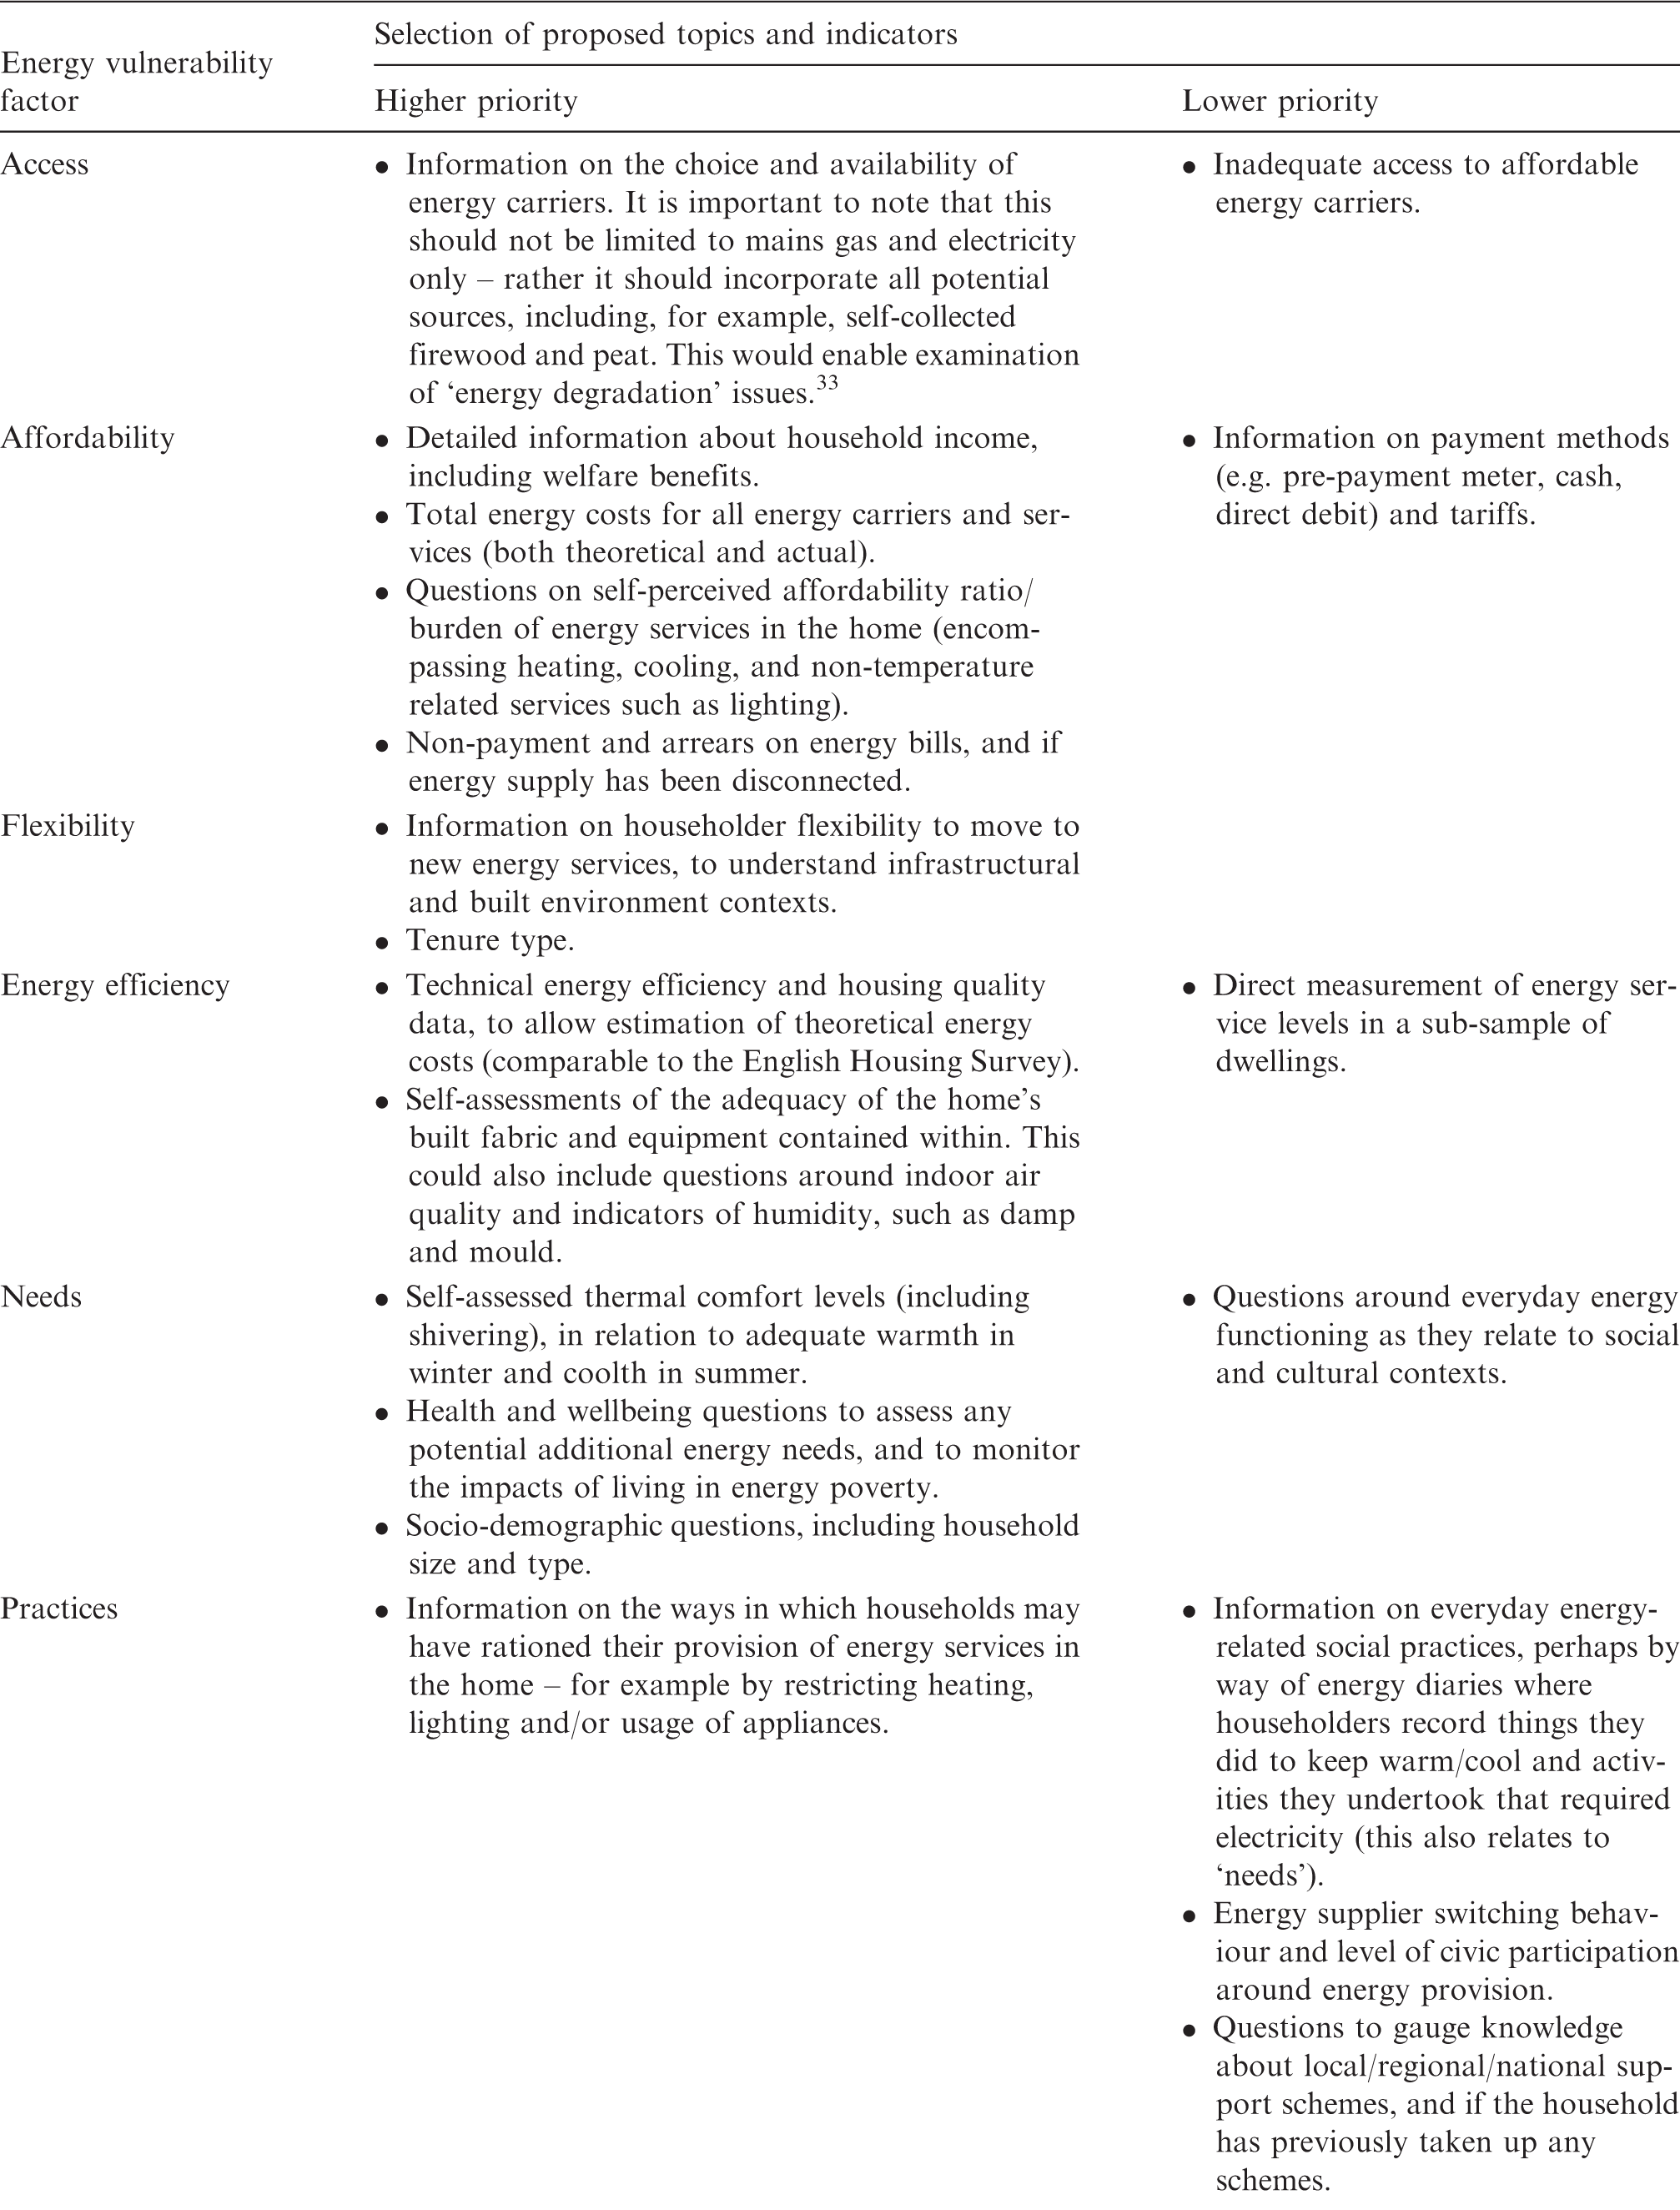
One of the key benefits of moving towards a wider conceptualisation of the external and internal stressors of energy poverty is the ability to build a more detailed picture of the situation within particular countries and capture the significant variations that occur at different geographical scales due to differences in built environment, climate, everyday practices, and institutional structures. However, it should be noted that the approach we advocate does not result in a single figure for the proportion of energy poor households within any given location, rather it produces a series of figures based on a suite of diverse indicators. This is important for capturing the diverse populations experiencing energy poverty, who may be captured slightly differently by particular individual indicators. 59 In this regard, the new paradigm would lend itself well to a multidimensional composite index format.
Beyond the list of topics and indicators, consideration should be given to the frequency of any new survey. An annual format would be ideal, as it would allow regular monitoring of the issue, whilst keeping pace with external factors. Surveys that are conducted more infrequently, such as the EQLS, risk the data becoming obsolete. Indeed, within France the housing survey is only conducted approximately every 7 years, which meant that until recently the analysis of energy poverty in France relied heavily on data that was a decade old, which raises questions of present day relevance. Balancing the frequency of a survey with the number of questions contained within is a difficult decision as both are important for the quality and relevance of the data; we would tentatively suggest that any new survey should be conducted no more infrequently than every two years.
Conclusions
Although the use of EU-SILC has become an accepted method of measuring energy poverty in Europe, a review of alternative survey data is long overdue, especially as different data may present the energy poverty situation in very different ways across Europe, both in terms of prevalence, and the populations identified as energy poor, which has direct policy relevance for the design of pan-European and national anti-energy poverty policies and programmes of assistance. Given the extensive societal costs associated with energy poverty, accurate evidence-based policy is essential.
It is evident that a paucity of suitable data at the EU level is limiting the measures that can be applied universally as well as preventing rigorous assessment of energy poverty across the EU. There is no dedicated survey of energy poverty, and no standardised household micro-data on energy expenditure, energy consumption, or energy efficiency. As a result, researchers are mainly reliant on consensual data concerning the consequences of energy poverty, such as arrears on utility bills and the presence of damp in the home. Where data is available on the causes of energy poverty, namely in terms of actual energy expenditure data, it tends to present an inaccurate picture of energy poverty amongst certain groups as households often prioritise other essential products and services over achieving adequate levels of energy services in the home. Furthermore, factors such as built environment flexibility, household needs and everyday practices, have rarely come into the energy poverty debate, and remain largely absent from existing data sources.
In order to advance the measurement of energy poverty at the European scale, data quality has to improve. As a starting point, this could involve amending existing variables so that they are more useful indicators, for instance changing from a binary response format to a Likert type scale to detect frequency of the problems. Harmonising the HBS to create a pan-EU dataset of actual energy expenditure across Europe would also be a useful first step, enabling analysis of seasonal and annual variations in energy expenditure, and for investigating differences in expenditure between different household groups.
However, to comprehensively understand the phenomenon of energy poverty across Europe, we argue that a more ambitious strategy is required, by way of a new dedicated household survey of energy poverty. Not only would this lead to increased recognition of the problem, it could also lead to advantageous synergies with other areas of policy and study, such as energy efficiency, climate change mitigation and utility market reform. Whilst we identified poor energy efficiency, low household income, and high energy bills as core contributory factors, it is evident that energy poverty can also be exacerbated by environmental and energy policy design if the social and distributional impacts of policy are not acknowledged.120,121 At a time of rapid environmental change and a drive for decarbonisation, it is increasingly important that policymakers have the appropriate tools and data available to conduct impact assessments, which this paper strives to advance in relation to energy poverty.
Authors’ contribution
HT and CS designed the study and developed the methodology. HT collected the secondary data and performed the analysis. SB contributed to the theoretical framing of the paper and interpretation of data. HT, CS and SB jointly produced the manuscript text, and HT and SB performed later revisions.
Footnotes
Acknowledgements
Micro-data access is gratefully acknowledged for the 2007 and 2012 European Quality of Life Survey,55,56 Eurobarometer 72.1, 73.2 + 73.3, and 74.1,52– 54 and Wave 1 of the Generations and Gender Programme Survey. 57 We thank the reviewers for their helpful and insightful comments, which significantly improved the quality of this paper.
Declaration of conflicting interests
The author(s) declared no potential conflicts of interest with respect to the research, authorship, and/or publication of this article.
Funding
The research leading to this paper has received funding from the European Research Council under the European Union’s Seventh Framework Programme (FP7/2007–2013)/ERC grant agreement number 313478, the Economic and Social Research Council (White Rose PhD Studentship), and Eaga Charitable Trust.