
Abstract
The world’s icy and snowy regions—the cryosphere—are where the most profound changes will occur as the globe continues warming. In many areas, the levels of cryospheric change today are surpassing any seen in the past hundreds to thousands of years. This amplified response has a simple explanation: Most of the cryosphere is, on average, near the freezing point. Small shifts in temperature push large regions to a different physical state. However, while the processes leading to the loss of ice are quickly started, they do not quickly stop. We are on the verge of committing ourselves to sizable increases in sea level. The 2007 Intergovernmental Panel on Climate Change (IPCC) report estimated sea level rise in this century at just 20 to 60 centimeters, but that total did not include contributions from the break-up and flow of ice sheets. The melting of mountain glaciers and ice in Greenland and Antarctica could add an additional meter of sea level rise. An equally important effect may be the feedback that changes in ice—especially the ice-covered ocean—have on climate in both the polar and the temperate regions of the world. The author describes the processes that are rapidly eroding polar ice.
Keywords
Twenty years ago, the field of glaciology was still something of an extreme sport, dominated by scientists inspired by two things: physics and mountains. They would backpack survey equipment to impossible heights, or trek to remote snowfields, proud of their small camps and long stays in the wilderness. They used surveying instruments called theodolites to measure topography and ice deformation. Trenches and hand-drilled ice cores revealed the nature of the snow. Their research was largely focused on the goal of understanding the mechanical properties of natural ice (a remarkably complex substance). 1 New findings in how it flowed and fractured, and how forces balanced in a glacier, were material for top publications. The tremendous ability of ice to erode and reshape continents, and then disappear, was fascinating.
But with the advent of two paradigm shifts—one in measurement, and the other in environment—the focus of glaciology changed from force balance to mass balance; that is, how much ice flowed or melted versus how much snow replaced it. New monitoring technologies placed even the farthest Antarctic landscape within reach of detailed study. Climate change placed these quiet, bookish adventurers and their field of study in a global spotlight. The central question became how, and by how much, the ice was changing. While most of the world has warmed slowly—almost imperceptibly—the polar and mountainous regions of the world have been utterly transformed. And so has the community of people working in these regions. The field has attracted a large new group of scientists, skilled in climate science and measurement engineering, and as apt to find adventure in computer analysis as in setting up camp on an unnamed Greenlandic fjord. Often they do both in the same day.
Rapid ice loss
In part, the attraction of the field is that the pace of the science and the pace of change in the world’s ice are both so rapid. Over the past 15 years, the ice sheets of both Greenland and Antarctica have changed from a nearly balanced mass flux (in other words, snowfall kept pace with glacial outflow and melting) to losing 100 to 200 gigatons per year from each ice sheet to the oceans. 2 (It takes about 360 gigatons of ice to raise global sea level one millimeter.) The rate of mass loss appears to be increasing yearly, 3 and it is important to remember that we are only at the beginning of the climate warming period.
Ongoing studies using GPS and other satellites confirm that the Greenland ice sheet is now losing mass at a rapid rate, allowing the Earth’s crust beneath the shrinking ice sheet to spring upward. 4 Since the end of the past ice age, Greenland’s ice sheet has advanced and retreated a few times, but the scale and pace of those changes pales in comparison to the present trend toward loss. Along Greenland’s entire western coast, as well as the southeast coast facing Iceland, the flow of hundreds of glaciers in fjords where the ice reaches the sea is now accelerating, and the ice sheet just inland of these areas is thinning rapidly. The key common attribute of the most rapidly changing glaciers is a deep fjord with strong ocean circulation. Nor is it just faster glacial flow that is causing the problem; nearly half of the mass lost by Greenland each year is from surface melting and run-off. The summer of 2010 set yet another record for melt extent and intensity for the island. 5
Mountain glaciers are a more complex story, with many areas shrinking in the past two centuries, and some areas expanding even as late as the 1990s. But all glaciated regions are retreating today, and for all regions where records are good enough to discern rates of change, those rates have accelerated in recent years (Dyurgerov and Meier, 2005; Oerlemans, 2005). The issue is complicated by many factors, including deforestation or land-use changes near the glaciers. These lead to increasing amounts of dust and soot on the mountain ice, resulting in additional absorption of heat from the sun, and thus faster melting. Moreover, the pace of retreat for a given glacier is not constant; as conditions change, the most vulnerable parts melt first. The remaining icy alcoves are in the more shadowed areas, or the areas of coolest conditions and greatest snowfall, slowing the changes even if the underlying causes intensify. 6 Shrinking mountain glaciers will contribute significantly to sea level, certainly, but at a rate that will be hard to forecast in detail. Estimates range from 10 to 25 centimeters—which may sound small but in fact will lead to problems in flat low-lying areas. On the bright side, the total risk from these ice masses is far smaller than the risk posed by the Antarctic and Greenland ice sheets. Mountain ice is estimated to be equal to about 60 centimeters of sea level rise in total. The mass of ice at risk in the next few centuries from these two large ice sheets is probably 10 times this amount, or six meters (Bamber et al., 2009; Meier et al., 2007; Overpeck et al., 2006). (The total amount of water contained in the two ice sheets is equal to nearly 70 meters of sea level rise.)
Antarctic surprises
In Antarctica, two large regions dominate in the story of changes to the ice sheet, both located in the areas south of the eastern Pacific. The Antarctic Peninsula, an ice-covered rocky spike pointing toward South America’s southern tip, is the fastest-warming region in the Southern Hemisphere (Vaughan et al., 2003). Since it is so far north, this warming has pushed summer conditions toward greatly increased melting. In 2002 a large ice shelf on the eastern Peninsula, hundreds of meters thick and nearly the size of Connecticut, disintegrated after decades of warming and years of seasonal lakes—born of melted ice—forming on its surface. Still, the process by which the break-up happened astounded glaciologists. At the peak of melting in the warmest summer on record to date, the plate shattered into thousands of pieces within just a few weeks—most of it within a few days. A model of hydro-fracturing has been put forward in which melt-water infiltrates shallow cracks in the shelf surface and deepens them, in particular when ocean swells reach the ice front and cause the ice to flex, bending it up and down just slightly. 7 In the years following the 2002 event, research vessels probed the newly formed bay and recovered sedimentary evidence that the ice plate had been continuously present for 10,000 years prior to the break-up (Domack et al., 2005). In other words, the ice loss observed in the Peninsula in the past decade is unprecedented since the dawn of civilization.
The melting of floating ice, such as the Peninsula ice shelf, has almost zero effect on sea level. The change in this ice shelf is mostly significant because of the tremendous effect it had on inflowing glaciers in the region. Without the buttress of the shelf’s presence, the flow rates of the glaciers that drain the grounded ice sheet in the region increased by two to six times, compared to the rates before the break-up. 8 This, too, surprised glaciologists, because it implied that the anchoring of the ice to the underlying fjord valley was far looser than had been suspected. While the ice sheet on the Peninsula by itself does not present a significant long-term sea level threat (perhaps a meter in total over the next several centuries), events there indicate that much larger masses of flowing ice throughout Antarctica are rather precariously held in check.
The second region of significant change in Antarctica is Pine Island Bay, which is much farther south, and colder. Surface melting is not a factor here; instead, a key cause of rapid changes in the ice appears to be deep contact with the ocean, as in Greenland. A group of four huge glaciers drain into the bay, each of them tens of kilometers across. Over the past 30 years, the largest glacier—also called Pine Island—has nearly doubled in speed, and the bay is responsible for nearly 10 percent of current global sea level rise (about 120 gigatons, or roughly 0.3 millimeters of an estimated 3 millimeters annual rate of rise during the past decade). 9 The significant change in the system appears to be melting and retreating at the zone where the glacier first goes afloat, roughly 1,000 meters below the ice surface.
The far north
For Arctic sea ice, the story of recent change is even more profound. At the end of this past summer, the remaining ice-covered extent was roughly 60 percent of what it was in 1970, or smaller by an area equal to the lower US states west of the Mississippi. 10 Comparing Cold War-era submarine profiles of ice thickness—measured from beneath the ice—to modern submarine and satellite measurements suggests we have perhaps one-third of the sea ice volume now as then; this recent rate of decline is alarming. 11 This is largely due to a huge decline in the thick multi-year ice (sea ice that has survived at least one summer) within the Arctic Ocean. In the early 1990s, sea ice that was five years old or older covered more than 1 million square kilometers of the Arctic basin; by late 2010, that area was just 60,000 square kilometers. A picture from a 1950s Arctic ice station shows a parka-clad man dangling his feet over the edge of an old, thick sea ice floe. The ocean surface was still five feet below his boots. Today, it is more likely that his boots would be wet. Arctic trekkers crossing the icepack today are prepared to be immersed at any moment, with sleds that double as kayaks.
Here too, as with the ice sheets, the evidence points to a change that has no equal in thousands of years. In 1906, the explorer Robert Peary discovered a huge plate of consolidated sea ice fixed to the north coast of Ellesmere Island in Canada (Peary, 1907). The plate covered an estimated 7,500 square kilometers and was 30 meters or more thick. It owed its existence to centuries of build-up of sea ice and snow, and relentless pressure from the free-drifting ice farther out to sea. Today, only a few fragments remain, nestled in fjords and totaling less than 800 square kilometers. Nearly every summer season sees further break-up and loss. On the shore behind this ice, driftwood and narwhal tusks rest on the strand line. They are carbon-dated at between 3,000 and 5,000 years old (England et al., 2008; Jeffries, 2002). Driftwood cannot reach a permanently ice-bound coast, and for as much as five millennia it didn’t. Soon, bits of Siberian and Alaskan pine will again be carried by drifting floes to the beaches, re-exposed for the first time since the pharaohs.
Improved measurement techniques
Our ability to measure and monitor all these changes has surged with the advent of new and powerful remote sensing techniques, in particular from satellites. 12 In the 1990s, two transformative methods for measuring ice flow emerged: the repeated imaging of the same ice features to track their changes; and detection of ice flow from radar imagery. Using these techniques, large expanses of the ice sheets and glaciers—in some cases areas that had not yet been visited by humans—were mapped in detail and could be monitored sensitively for change. Radar-based and laser-based altimeters mounted on satellites began to map the shape of the ice sheets with precision and over time could detect changes in elevation of a few tenths of a meter. At present, a refined radar altimeter is mapping Arctic and Antarctic sea ice, permitting careful monitoring of its shrinking volume. 13 Simple improvements in the digital processing of images also led to major advances. As recently as 1993, a huge slow-moving ice stream was discovered in the interior of northeastern Greenland, mostly by digitally processing satellite data (Fahnestock et al., 1993); and in 2007, large lakes three kilometers beneath the East Antarctic ice sheet were discovered by a new satellite mosaic of the continent (Bell et al., 2007). Ongoing projects now seek to map every glacier on Earth continuously for extent, rate of flow, and thickness change. 14 Similar projects for the ice sheets aim to measure the net movement of ice from the entirety of Antarctica or Greenland by summing the outflow from every glacier on their perimeters, spanning tens of thousands of kilometers. Another major advance has been the advent of satellite gravimetry—a technology that detects subtle changes in gravitational pull of ice masses—providing an ability to independently confirm the measurements of glacier-by-glacier mass balance by reporting an encompassing summary of mass change.
The underlying cause of the profound changes in Earth’s ice is clear, and here again convincing evidence comes from ice-related research. Records of carbon dioxide and methane trapped from the atmosphere in ice cores spanning nearly 800,000 years show remarkable consistency. In all past periods between ice ages (including this one, until recently), carbon dioxide and methane levels remained relatively steady, at between 260 and 300 parts per million for carbon dioxide, and between 600 and 700 parts per billion for methane (a scarcer but far more potent greenhouse gas). 15 The dramatic rise in these gases seen in the past few decades— from 315 parts per million in 1958 to 388 parts per million today for carbon dioxide 16 —is unprecedented in the core record; and this rapid rise is now occurring exactly when rapid changes in ice and climate have been seen. The fact that a clear, physically-based model of the greenhouse effect exists—that is, the entrapment of long-wave upwelling radiation (heat) by carbon dioxide and methane—and no other purported cause (solar changes, ocean upwelling of ancient heat, changes in volcanic activity, soot, or land-use change) can explain the magnitude, duration, and global extent of the current warming makes it a virtual certainty that greenhouse gases are to blame. Isotopic characterization of carbon dioxide from the ice cores and the present atmosphere indicates that the atmosphere is now awash in emissions from fossil fuel burning. The source of the warming gases is clear. 17
Some observers question whether the seemingly miniscule changes in greenhouse gas concentrations can possibly have such a significant effect. Supporting evidence comes again from ice core analysis. Studies of the timing of ice ages have shown that they are initiated by celestial mechanics—that is, slight alterations of the tilt of Earth’s axis and eccentricities in its orbit. 18 All major ice ages began when the northern hemisphere saw less summer solar energy, and ended as summer solar heat returned. But the Earth goes through ice ages two poles at a time: Both Antarctica and the Arctic experience the increased freeze. If nothing but celestial mechanics were involved, the net effect would be opposite for the poles—northern cooling would be southern warming and vice versa. Another factor is involved: greenhouse gases. What we observe is that, as the ecosystems change in the northern hemisphere, greenhouse gases change along with them. These gases, of course, disperse in the entire atmosphere. For example, cooling conditions and ice in the north reduce greenhouse gases as the ecosystems there begin to shut down. This gradually drags the southern hemisphere into an ice age, 19 even though the solar energy level there favors warmer conditions. In other words, greenhouse gases are shown in the ice record to be an amplifier, and a globalizer, of small changes to climate initially caused by celestial mechanics. The present situation is that we have loaded our atmosphere with a lot more of this amplifier, at a time when the world is already in a warm period between ice ages.
With climate change inevitably continuing, what will the coming decade see in terms of changes in Earth’s ice? What does our present knowledge— albeit freshly built—tell us about the current processes underlying the polar ice responses, and what happens next?
The role of shifting winds
In both hemispheres, the consistent culprits behind the rapid pace of today’s ice changes are the combination of warmer temperatures and shifting winds that are changing ice drift patterns and carrying warmer water into areas that it previously did not reach. It is not that the ocean has become that much warmer: that would take more time, and more energy. (It is happening, but very slowly.) Instead, the heat from the middle ocean is now impinging on ice-bound areas that cannot tolerate it, and it is being driven there by changing winds.
In the Arctic, since around 2002, a recurrent summer air circulation pattern is emerging in which high pressure forms just to the north of Alaska, and low pressure hovers on the opposite side of the Pole along the Siberian north coast. Acting together, these patterns cause much of the ice to move in a large clockwise gyre, from the cold central Arctic to the Alaskan and eastern Siberian coast. (The pattern has become known as the “dipole anomaly,” because of the dipole of positive and negative air pressure).
20
(See lower image in Figure 1.) This pattern is not completely new, but is more persistent now. For example, in 2010, the pattern dominated in May, June, and August; in the record low ice season of 2007, it was present throughout the summer. In the past, the pattern was not a problem. The difference now is that the region between the high and low pressure, just west of the Bering Strait, is a blast furnace of warmer temperatures and southerly winds, leading to significantly greater melt and warmer ocean temperatures. As the pattern unfolds, old and thick Arctic ice, which formerly could circulate for years in the central Arctic without melting, is pushed into regions that are now too warm for it to survive. As a means of storing sea ice, the gyre is broken. Instead, the drift pattern effectively marches old Arctic sea ice into oblivion.
21
Major changes in Earth’s polar ice appear to be driven by emerging trends in high-latitude air circulation and strong climate warming. Ocean heat from mid-ocean layers, pushed to the ice sheet coastlines by the shifting winds, has led to rapid glacier retreat and acceleration. Source: The Author, NASA Goddard Science Visualization Center, and National Snow and Ice Data Center.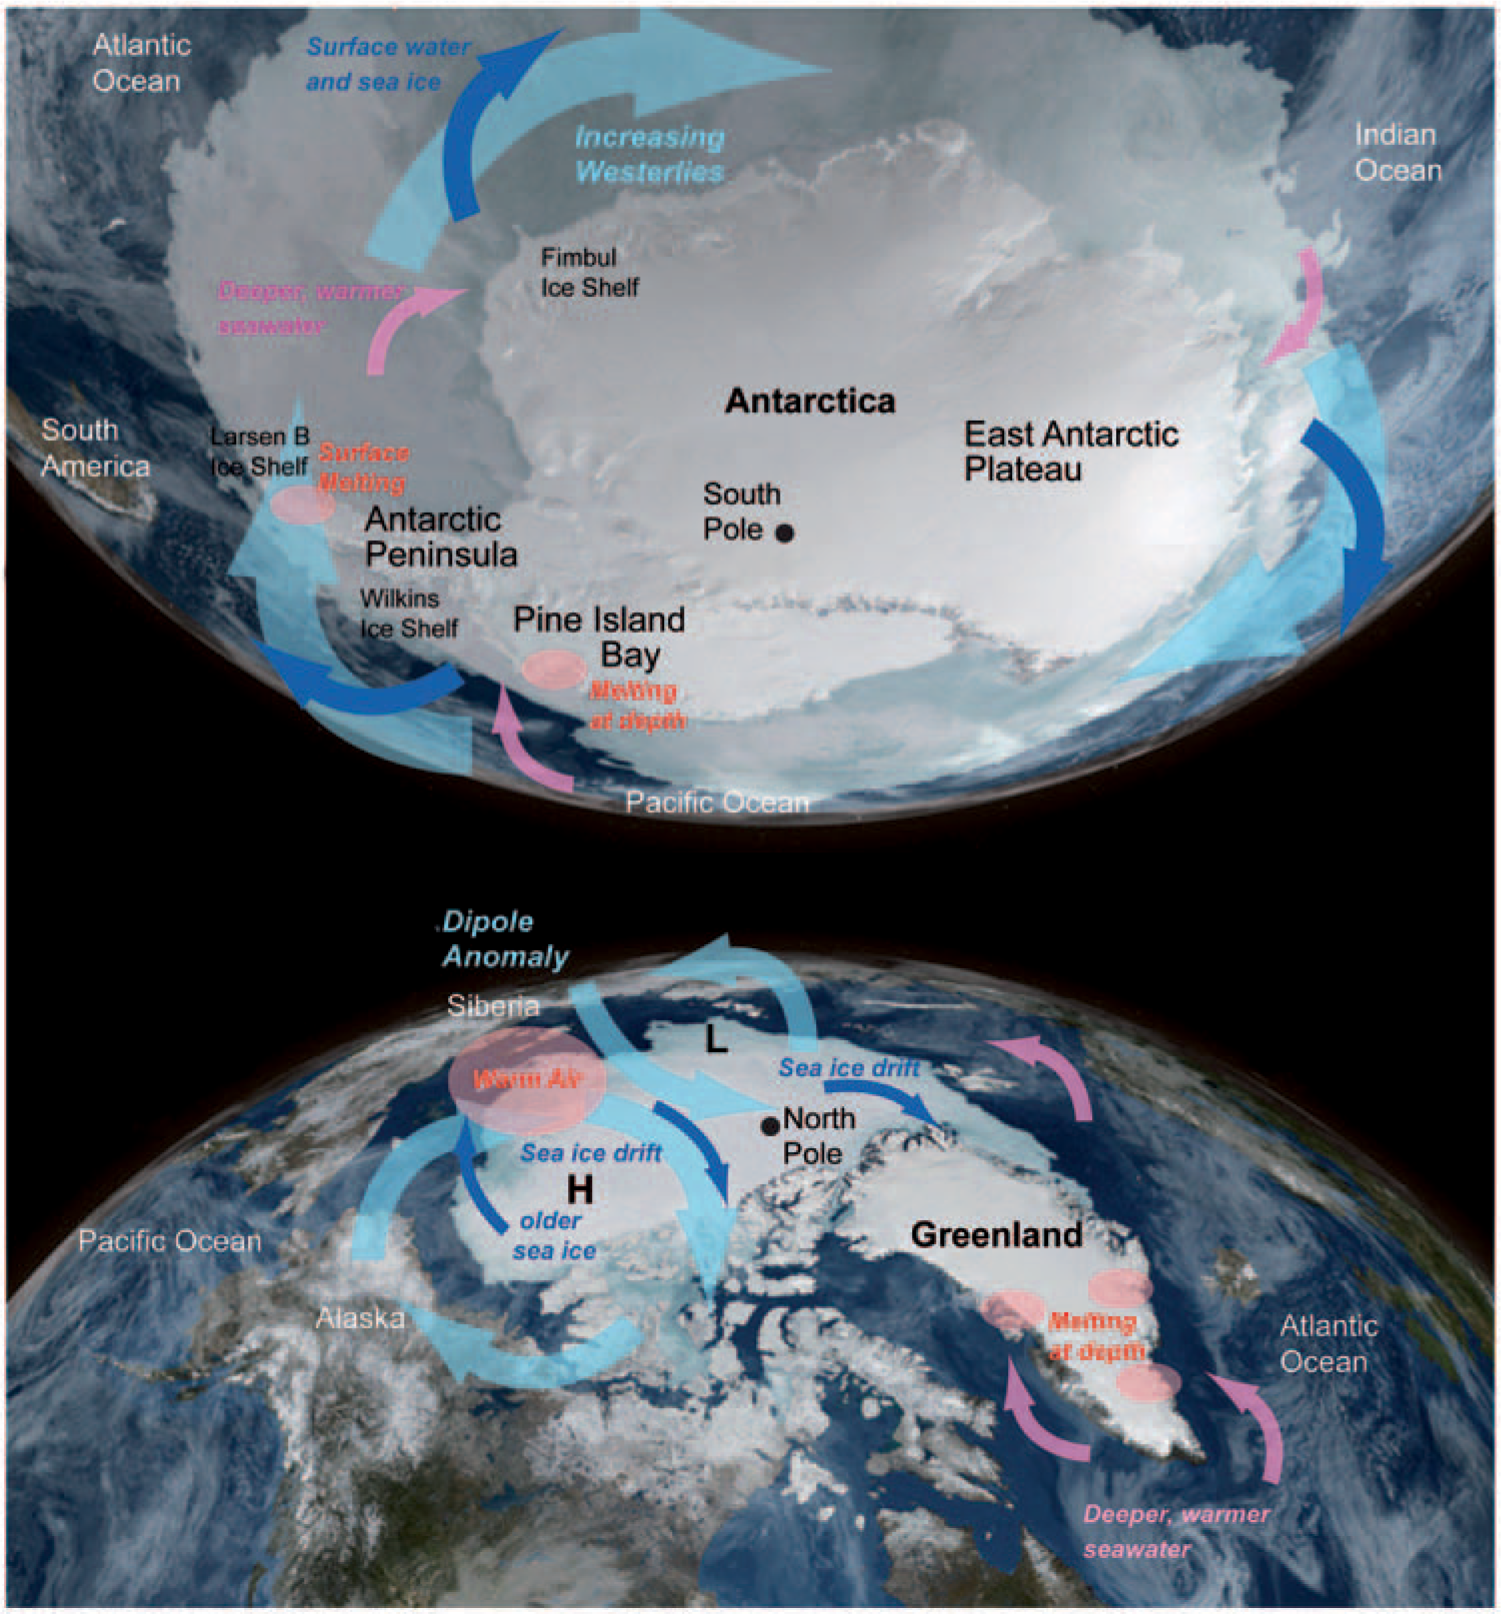
The result is a far thinner Arctic cover, prone to overreact to a climate or wind pattern that is increasingly unfavorable to its survival anyway. Thinner ice is moved more easily by the winds— for example, it can be more easily pushed out of the Arctic into the Atlantic (the more typical endgame for the ice). It is less of a cap on ocean heat and humidity, leading to milder Arctic winters and less winter ice thickening.
In the coming years, the expectation will be for large further reductions in Arctic ice cover. It may not set a record every summer, but on a three- to five-year average, the decline trend will probably be unbroken. It is likely that the rate of decline will not be linear, but accelerating, particularly because the more durable ice is now gone, and feedbacks in the system that tend to increase ice loss are strengthening (Serreze et al., 2009). Since the ice cover is so thin, some unusual patterns of ice cover may emerge; for example, large openings within the pack cover (the size of a large US state) may appear, as has already occurred in 2006. 22 In winter, the ice will likely be nearly as extensive as ever, since the air in the Arctic will still become quite cold, and will still freeze the surface ocean. But the cover will be thin, and will melt quickly with the onset of spring and summer. Before the end of the decade, it is likely that we will see a summer in which the remaining ice is a ragged patch, centered not at the North Pole, but north of the Canadian Archipelago, where the ice is pushed by the dipole anomaly. For the first time in human memory, the North Pole will be navigable water.
For Greenland, the situation will become increasingly alarming, with almost the entire coastline (all but the northernmost icebound section) affected by warmth, melting, and rapid ice outflow. Any area in contact with the ocean will be retreating inward, following fjord valleys deep into the ice sheet. 23 What’s more, relatively warm ocean water at depths below a few hundred meters is increasingly being routed along both the eastern and western sides of Greenland, and into the far northern Arctic as well. Everywhere this warm water touches ice in the depths of fjords, the ice melts back rapidly, causing glacier flow to accelerate. Some studies indicate that the pace of increase of mass loss from Greenland is such that it alone will be contributing a millimeter of sea level rise each year by the end of the coming decade (Kerr, 2009; Velicogna, 2009). This is a significant change. At the start of the past decade, the ice sheet was contributing little or no net ice to the oceans.
Antarctica and westerly winds
Antarctica’s changes have an elegant explanation that points squarely back to warming caused by greenhouse gases. Here again, shifting wind patterns are causing large changes in ice stability, more rapidly than had been expected. The wind pattern in the far southern ocean is dominated by a circumpolar westerly wind, surrounding the continent. Like everything in climate, it varies; but for the past 40 years, the running average intensity of the westerly winds has steadily climbed. 24
This wind pattern drives everything in the far south: climate, weather, sea ice drift, and ocean currents. Moreover, a gradual increase in westerly wind speed is exactly what models predict will happen as global warming increases, and as a result of ozone loss (also caused by mankind). 25 Warming leads to a general shift poleward of the major circulation patterns, resulting in an intensification of the westerly wind pattern as this shift impinges on the immovable climate bulwark that is the Antarctic Continent. Ozone loss in the austral spring (the ‘ozone hole’) results in a sharp cooling of the stratosphere, since ozone is not there to absorb ultraviolet light and warm it. A cooler stratosphere intensifies the circumpolar circulation, or polar vortex, at high altitude. (See upper image in Figure 1.)
As the wind pattern intensifies, it does several things at once. The Antarctic Peninsula, which reaches northward into this wind field like a weatherman’s finger, sees an increasing frequency of winds from the northwest, the direction for warm weather. This leads to the decline of sea ice just to the west of the Peninsula as it melts back (or never forms) in the relatively balmy breezes. Moreover, as this wind field crests the Peninsula and pushes over it, the downslope run produces warm, dry chinook winds. This leads to the extensive snowmelt and ponding that precede ice shelf disintegration. 26
A further effect of the stronger westerlies is a net drift northward of the upper ocean layer around Antarctica. 27 At the coast, the departing surface water has to be replaced by deeper, warmer ocean layers. In this area, the replacement flow is from a region of water at middle depths (several hundred to a few thousand meters) that rarely reached Pine Island Bay in past decades. Now, increasingly, it does, and it carries a huge amount of heat—as much as 2 degrees Celsius above freezing point, enough to melt many tens of meters of ice at the base of the glaciers each year. 28 To date, Pine Island Bay is the region most affected by the pattern, but other areas around the coast may be beginning to show signs of a similar process.
What the future holds for Antarctica is further ice shelf loss, as warming temperatures in the Peninsula melt the surface snow, and periods of sea-ice-free conditions in late summer and fall allow ocean swells to shake the ice plates like a table of standing dominoes. There are two areas in the southern parts of the most recently active ice shelves (the Larsen-B and Wilkins) that will likely disintegrate further in this decade, triggering further glacier accelerations. What would be more interesting, and sobering, would be to see the beginnings of the surface-melt disintegration pattern in a new region, such as the Fimbul Ice Shelf south of Africa, that taps deeper into the main Antarctic ice mass.
Antarctica’s Pine Island Bay glaciers will also accelerate further in the coming 10 years, but there is some debate about how rapid the ice flow increase will be, and how far along the Pacific-facing coast of Antarctica the pattern of melting and ice flow speed-up will extend (Pfeffer et al., 2008). Other Antarctic glaciers will come to the fore in the scientific discussion, that are now showing the beginnings of increased ice flow, particularly along the Australia-facing coastline. There will also be a continued debate on whether increased snowfall on the high, cold Antarctic Plateau will offset some of the sea level rise. But the point is moot. The geologic record and common sense agree: when the world is warmer, ice shrinks and sea level rises.
The next decade
The task of predicting sea level rise rates from ice and climate change is a major new focus of the field, and it is still daunting. Unfortunately, the massive “natural experiment” of the past few decades of global warming has revealed a far more responsive cryosphere than earlier glaciologists dreamed of. It is exciting, it is challenging our physical models, and it is crucial to get an encompassing understanding of it as quickly as possible.
At the same time, a basic message is clear: The current level of climate change, pushed largely by human activity, is having a serious effect on the world’s ice. We have every reason to expect that it will lead to unwanted changes in climate, impacting agriculture and water resources, and will eventually result in expensive changes to the coastlines. If we make no special effort to reduce our impact on climate in the coming century, ice will likely contribute as much as a meter to sea level rise (Pfeffer et al., 2008). But perhaps the most serious aspect of the upcoming cryospheric changes is their longevity. We are setting in motion changes in the Earth’s polar oceans and ice sheets that will not turn around quickly, even after a leveling or reduction of greenhouse gas emissions occurs. We may choose to adapt to some level of warming, rather than bear a harsh impact economically; but we need to be aware that the Earth’s ice will continue disappearing for many years in response to a given level of warming. Therefore, even though the current level of threat seems small, a discussion of how to manage our planet for the long term needs to begin in this crucial decade.
Footnotes
1
For example, ice has a highly non-linear and strongly temperature-dependent stress-strain relationship. Its mechanical and optical properties are very anisotropic as a result of its crystal structure, and it forms fabrics of oriented crystals easily under typical glacier flow conditions. Fracture properties, the effect of salt on ice, its expansion upon freezing, and the fact that most terrestrial ice is near the melting point make it a very complex material in an earth science context. See Paterson (1994); Kamb (1972); Lliboutry and Duval (1985); Azuma and Higashi (1985); and ![]() .
.
2
For a range of estimates from various compilation methods, see Rignot and Kanagaratnam (2006); Luthcke et al. (2006); Shepherd and Wingham (2007); Pfeffer et al. (2008); and ![]() .
.
3
For the Greenland ice sheet as a whole, the rate of ice mass loss appears to be increasing at about 30 Gt per year (Kerr, 2009; Velicogna, 2009). For Antarctica, the areas of greatest concern (described later in the text) also appear to be losing mass at an increasing rate, but the pace of change is unsteady (Kerr, 2009; Joughin et al., 2003; Rignot, 2009).
4
8
Discussed in Scambos et al. (2004); for a recent update, see Rott et al. (2010) at ![]() .
.
10
11
Data for the submarine traverses was released under the Clinton administration in a region known as the “Gore Box”, after Al Gore; a summary of both remote sensing and submarine evidence is available in Kwok and Rothrock (2009); see also http://www.nasa.gov/topics/earth/features/icesat- 20090707.html for a summary of the recent dramatic losses, and ![]() for a combined observation-model estimate of ice volume decline.
for a combined observation-model estimate of ice volume decline.
12
See the overview provided by Bindschadler (1998) and the detailed compendium in ![]() .
.
15
Lüthi et al. (2008) report on the earliest part of this range; reports by Hansen et al. (2007) and ![]() cover the later period.
cover the later period.
17
E.g., references in Alley et al. (2007) and ![]() : see their Figure 2).
: see their Figure 2).
18
See the discussion at http://www.ncdc.noaa.gov/paleo/milankovitch.html; also Martinson et al. (1987) and ![]() .
.
19
20
A synopsis is available at the website for the “Arctic Report Card”, http://www. arctic.noaa.gov/reportcard/seaice.html, and the NSIDC Sea Ice News and Analysis http://nsidc.org/arcticseaicenews/2010/110210.html. See also ![]() .
.
21
Maslanik et al. (2007) demonstrate this by tracking ice flow continuously using satellite data over the past three decades. A detailed analysis of where multi-year ice has been lost in recent years is given by ![]() .
.
23
24
Data are available online at http://www.antarctica.ac.uk/met/gjma/sam.html and ![]() .
.
25
Arblaster and Meehl (2006); also Chapter 5 of ![]() .
.
27
This is a consequence of Ekman Drift, which results from the coriolis effect caused by the rotation of the Earth.
28
For the modeled case, see Thoma et al. (2008); observations supporting the model are given in Jenkins et al. (2010); a good overview of the Pine Island Bay glacier and ocean system is given by ![]() .
.
Author biography