
Abstract
Activated carbon is a versatile material with a wide range of applications due to its porous structure and large surface area. In this study, activated carbon was manufactured from cellulose using zinc chloride and phosphoric acid activation agents, and it was characterized using Brunauer-Emmett-Teller (BET), Field-Emission Scanning Electron Microscopes (FE-SEM), Energy Distribution Spectroscopy (EDS), mapping, and Fourier Transform Infrared Spectrophotometer (FTIR). Two different types of activated carbon utilized as a filler in Nitrile Butadiene Rubber (NBR)/Natural Rubber (NR) blends at different proportions (%0, %5, %10, %15 and 20%), and compared its properties to those of carbon black. The results showed that the addition of activated carbon improved the mechanical properties of the rubber blends, including hardness, tensile strength, and unit elongation. Furthermore, the experimental data obtained were used to examine the effects of carbon black, activated carbon salt, and activated carbon acid values on density, hardness, tensile strength, and percentage elongation variables using Multiple Linear Regressions (MLR). These models provided successful results in predicting the data with fewer experiments. The results have the potential to contribute to the promotion of the use of environmentally friendly materials in future research and to be an important step towards a sustainable industry.
Introduction
Rubber has become one of the most important products in today’s world due to its qualities such as flexibility, long life, and wide range of uses. 1 Rubbers are used in the production of many materials such as waterproof clothing, shoes, gloves, sanitary ware, floor material, vehicle tires, toys, and inflatable beds.2,3
Since rubbers show poor performance on their own, blending of rubbers is a very attractive and useful method for developing new materials. Blending has attracted great attention because materials with synergistic properties can be produced with it due to the fact that it is the mixing of two or more rubbers and does not involve the synthesis of new materials.4,5 In addition, rubbers produced by blending two or more rubbers have better properties compared to materials obtained by using them alone. 6 Many rubbers are used in the rubber industry, and natural rubber (NR) is one of them. In addition to having good mechanical properties such as high tensile and tear strength, natural rubber (NR) also has excellent flexibility and dynamic properties. On the other hand NR is very vulnerable to heat aging and degradation by atmospheric air because to the presence of a significant number of reactive double bonds on the molecule backbone. Furthermore, NR has a lower oil resistance than some polar synthetic rubbers, such as nitrile butadiene rubber (NBR). To overcome such shortcomings, NR is often mixed with synthetic rubbers such as NBR. 7 With the development of the automotive, oil, and medical industries, the consumption of NBR in the world has been increasing steadily. In 2022, the total consumption of NBR was about 1.72 million tons in the world. 8 Despite the increasing demand for NR and NBR-based compounds, the materials produced from these rubbers have shortcomings in terms of physical and mechanical properties and need to be improved. Rubbers are raw materials that exhibit low strength when used alone. Usually, rubber doughs with higher strength are prepared by mixing with reinforcing fillings. This situation makes it important to carefully select the filler used and to conduct additional studies to improve the properties of the fillers.9,10 Carbon black obtained from fossil fuel sources is commonly used as a filling material in rubber production. With carbon black, both the production cost is reduced and the mechanical properties are improved. However, the production of carbon black is largely dependent on fossil fuels, 11 and it causes various contaminations both in its production and in the case of its use in the material. Currently, because carbon black is categorized as a Group 2B agent that is carcinogenic to humans, its use in the rubber industry has been restricted.12,13 Besides, since fossil fuel reserves have been decreasing in recent years, it is necessary to find alternative filling materials due to the rapid increase in energy demand. 14 Therefore, it is important to use environmentally friendly and sustainable filling materials, such as activated carbon, in the rubber industry.
Activated carbon is a smooth and uniform amorphous material that is produced through chemical or physical methods by increasing the internal surface areas and pore volumes of organic and inorganic substances with high carbon content. 3 Nowadays, activated carbon is produced from orange peel, 15 peanut shell, 16 rubber tree, 17 pomegranate peel, 18 and cellulose. 19 Although the physical and chemical properties of activated carbon are determined by raw materials, they are also based on the activation process used. Activated carbon is created using both physical and chemical activation processes. The precursor material is carbonized in an inert atmosphere before being activated at high temperatures by the of oxidizing gases during the physical activation process. 20 The chemical activation is conducted via an activation agent such as H3PO4, 21 ZnCl2, 22 K2CO3, and KOH. 23
Activated carbon is commonly utilized in energy storage, the food industry, water treatment, and more recently in the production of composite materials. The composite materials were produced from TiO2/activated carbon for the purpose of treating textile wastewater. 24 In another study, it was stated that composites with high electrical conductivity were produced by adding activated carbon to metal organic frames. 25 It was stated that composites produced from activated carbon modified with silicon were resistant to fire. 26
The amounts of polymers used in the production of rubber components have a great effect on the physical, chemical, and mechanical properties of the produced material. However, determining the impact of each parameter can be expensive and time-consuming. Therefore, it is important to use a sufficient number of experimental results to be able to estimate output values based on different levels of variables. 27 Finding the ideal circumstances without losing products or raw materials is beneficial from an industrial perspective. For this purpose, many mixed recipes, which result in high costs, may need to be tested. Therefore, it is necessary to use economical methods to determine the mechanical and physical properties of rubber materials. Some methods use technological tools such as computer-based programs. 28
Multiple linear regression (MLR) is a popular and successful regression method. MLR is an efficient algorithm in the analysis of low-dimensional data, and its advantages cannot be underestimated. MLR has been shown to outperform standard machine learning methods in some circumstances when the number of characteristics is fewer than the number of observations. Furthermore, based on the statistical validation criteria, the MLR model outperformed the four ANN models. 29 The feature division regression model was motivated by the MLR algorithm's outstanding performance at low data dimensionality. 30
The first goal of this study was to explore the usability of environmentally friendly activated carbons, produced by the chemical activation method, as fillers in NR/NBR rubber matrix compounds instead of carbon black. In this context, 5 different dough was prepared by adding these activated carbons to the ingredients at a rate of %0, %5, %10, %15, and 20%. After the curing process, the physical and mechanical properties of the components were examined. In the second stage of the study, based on the values obtained from the experimental study, a model was designed that can predict the hardness, density, tensile strength, and % unit elongation values by using the MLR method. Thus, it was aimed that more economical and safe results could be obtained without conducting comprehensive tests.
Materials and methods
LBS Composition and Laboratory Technologies Co. Ltd. (Turkey) supplied the NR/NBR rubbers and additives (plasticizing, retardant, antioxidant, homogenizing, process enabling chemicals, and crosslinking constructors) utilized in this investigation. HAF-N 330 carbon black was used as a strengthening filling material. Carbon black was obtained from PETKIM Inc. (Turkey). The cellulose used in the production of activated carbon was obtained from Europap Tezol –Paper Industry and Trade Inc. (Turkey). The density of cellulose produced using Eastern Spruce is 0.55 g/cm3. Zinc chloride (ZnCl2) and phosphoric acid (H3PO4), which were used as activation agents in the chemical activation process, hydrochloric acid (HCl) and potassium hydroxide (KOH), which were used for washing activated carbon, were of analytical purity, and they were obtained from Merk Germany) and Fluka (Switzerland) companies.
Production of activated carbon with phosphoric acid (AC-A)
1000 gr of cellulose was mixed by adding 1000 mL of phosphoric acid (50 wt%) and 1000 mL of pure water to 1000 gr of cellulose. In order to ensure the reaction of cellulose with phosphoric acid, it was treated at 110°C for two hours. Then, the mixture was kept in the oven at 80°C for 24 hours and dried. The drying cellulose was kept under argon gas (50 milliliters/minute) at 600°C for 1.5 hours for the activation process and then cooled at room temperature. It was rinsed with 0.5 M KOH first, then with hot deionized water until the pH reached 6.5-7. The activated carbon was crushed and suitable for use after being dried at 100°C for 6 hours.
Production of activated carbon with zinc chloride (AC-S)
By adding 500 g of zinc chloride and 1250 mL of pure water to 1000 g of cellulose, it was kneaded and dough was obtained. To be able to ensure that zinc chloride reacted with the raw material, it was treated for 24 hours at room temperature. Then, the mixture was left in the oven at 80°C for 24 hours and dried. The dried mixture was kept under argon gas (50 milliliters/minute) for the activation process for 1.5 hours at 600°C and then cooled at room temperature. it was washed with 0.5 M HCl, then with hot deionized water until the pH was between 6.5 to 7. The activated carbon was dried for 6 hours at 100°C before being crushed and prepared for use.
Dough mixing and vulcanization process
NR/NBR and filling materials were blended in laboratory type banbury mixer (Güncanlar brand) at a speed of 60 rpm and at 60°C for 10 minutes. After the dough was conditioned for 24 hours, it was blended in a laboratory-type two-cylinder open mixer at 80°C and 40 rpm speed for 5 minutes.
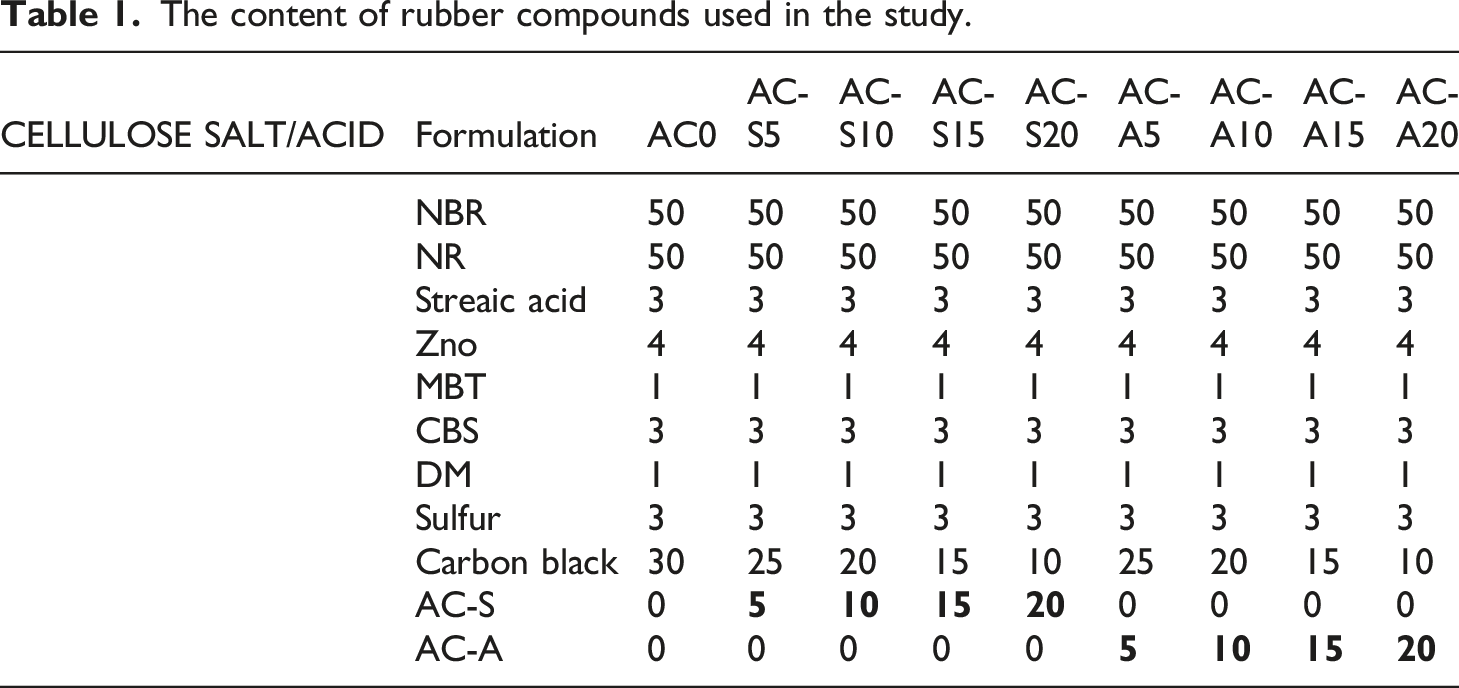
The content of rubber compounds used in the study.
Characterization
The experimental samples were prepared according to the test standards and conditioned for 1 day at 25 ± 2°C and 50% relative humidity before testing. Tensile tests were performed using a Shimadzu AGS-X Floor model tensile device at a speed of 10 mm/s, following the ISO 37 standard (Figure 1). The hardness of rubber compounds was measured using a Shore A type durometer on an AFFRI Commerciale AFFRI 3001 model device, according to the ISO 868 standard. The densities of activated carbons and rubber compounds were determined using a helium pycnometer. After fracture testing, the fracture surfaces and morphologies of activated carbons were analysed with Field emission scanning electron microscopy (FE-SEM). Energy Distribution Spectroscopy (EDS) and X-ray mapping were used to assess samples and examine filler distribution in rubber compounds. The fracture surface of compounds was coated with iridium to improve conductivity. Microstructure images were studied using a microscope operating at 2.00 kV for activated carbon and 20 kV for rubber matrix composites. FTIR shots of activated carbons were taken in the range of 400 – 4000 cm−1. BET surface area and micro-pore volume of activated carbon were determined using N2 adsorption/desorption isotherm tests. Samples were degassed at 120°C for 3 hours before measurement to remove impurities and open blocked pores. Sample images (a) after and (b) before tensile test.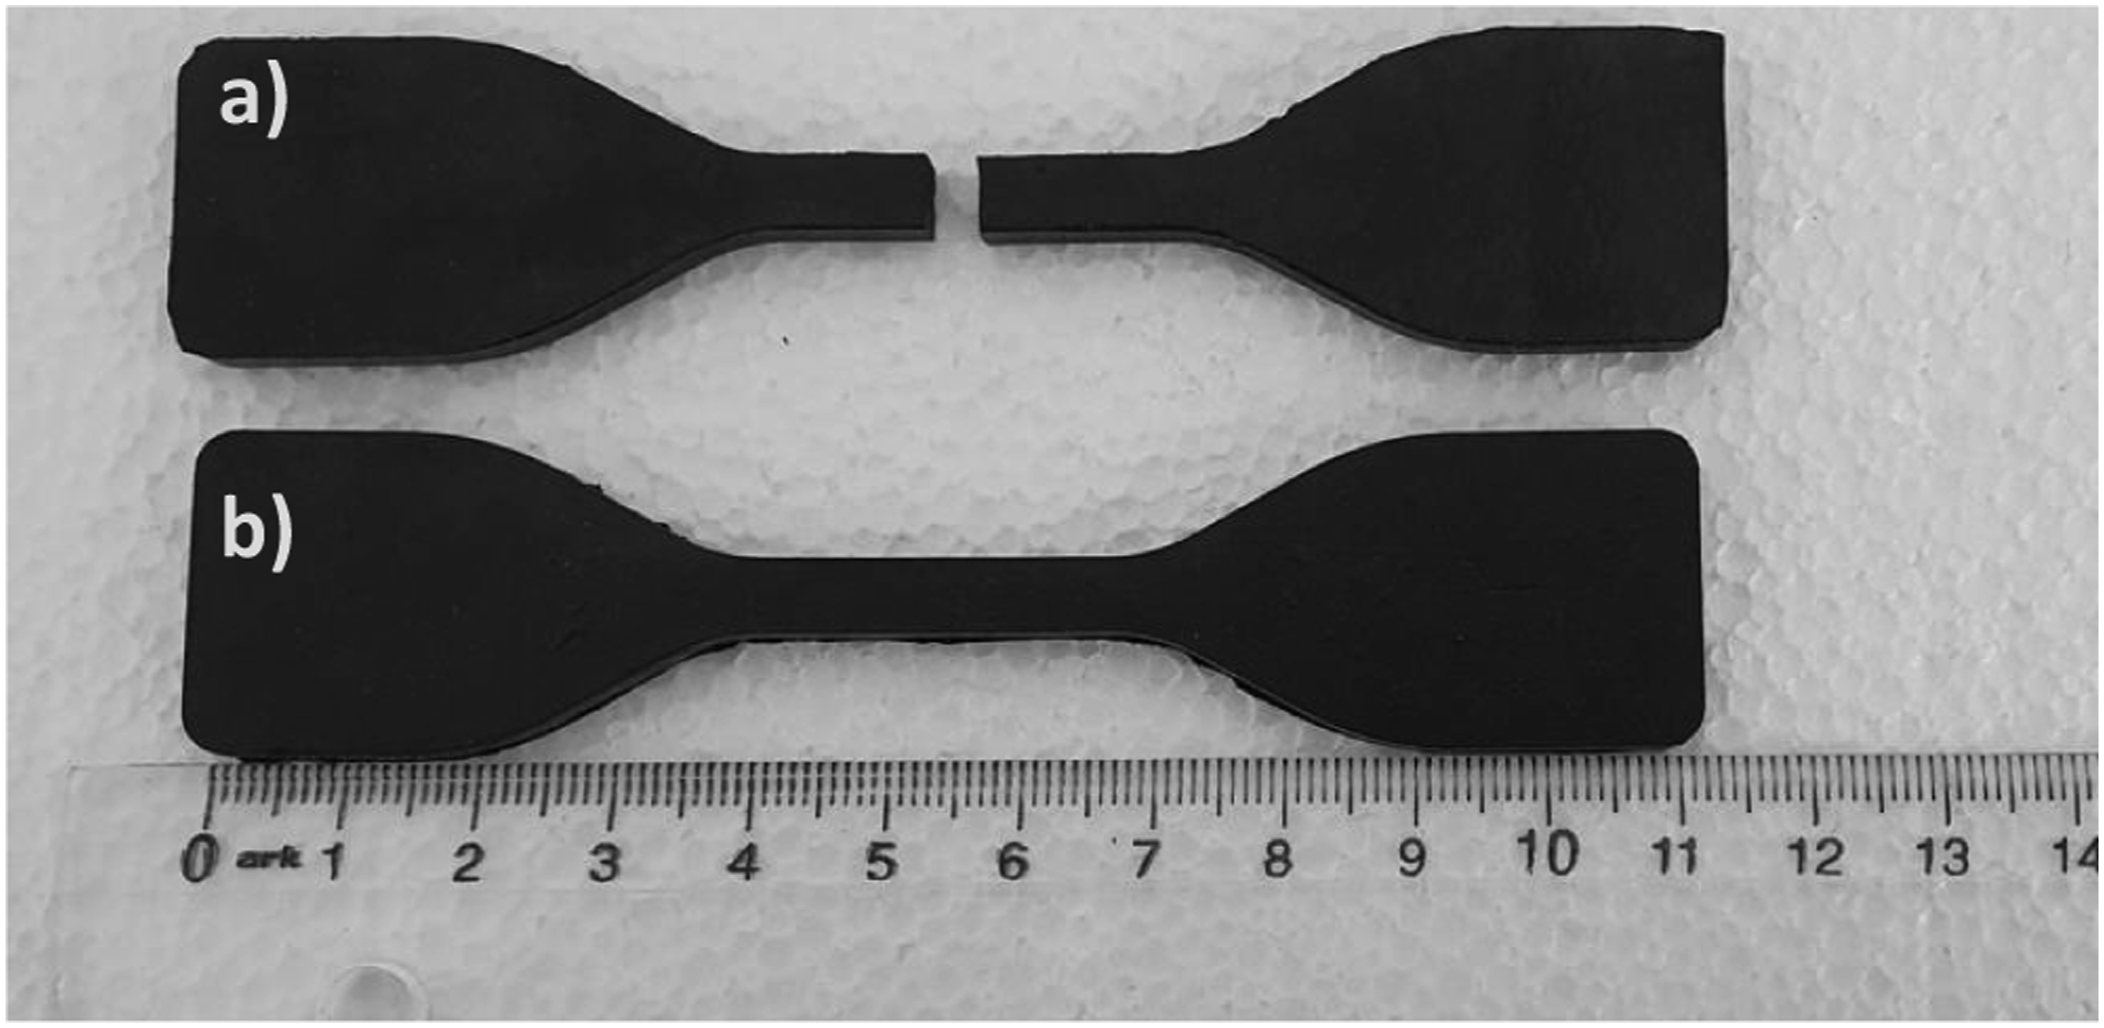
Multiple linear regression (MLR)
Multiple linear regression (MLR) is a statistical technique used to analyze the relationship between one or more independent variables and a dependent variable. This method can be used to predict future events by explaining the properties of the data and predicting the effect of these properties on a dependent variable.
In the regression method, the relationship between an output (y) and the system inputs (x1, x2, …,xn) is examined. The relationship between these independent and dependent variables can be linear or curvilinear. Independent variables are selected and a mathematical model is developed that explains their relationships with the dependent variable based on the data. This model is then used to find the estimated value of the dependent variable being considered.
The formulation of the univariate regression model (Equality 1) is as follows:

In multiple linear regression, y is the predicted value of the dependent variable, x1 through xn represent the independent variables, 𝛽0 is the value of y when all independent variables are equal to zero, 𝛽1 through 𝛽n are the estimated regression coefficients, and ε represents the error in the observed value. There are various methods for estimating the coefficients of linear models. The most commonly used method is the least squares method. This method tries to find the coefficients that minimize the sum of the square of the error term. In statistics, for the regression function to be linear, it is sufficient that the parameters are linear. As long as the parameters are linear, we can obtain curves for independent variables (Equation (3)). With linear regression, it is possible to find the polynomial that fits the data.
Interactions Linear is a linear model used to test whether the relationship between a dependent variable and independent variables changes depending on another independent variable. For example, equation (3) is an interactive linear model.
The correlation coefficient (R2) was used to evaluate the performance of the regression model. The R-squared value is a number ranging from 0 to 1 and shows to what extent the model fits with the actual data. R2 values close to 1 indicate that the model fits the real data to a high degree.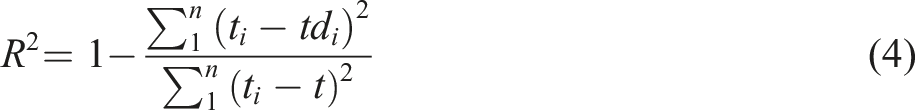
Result and discussion
Characterization of activated carbons
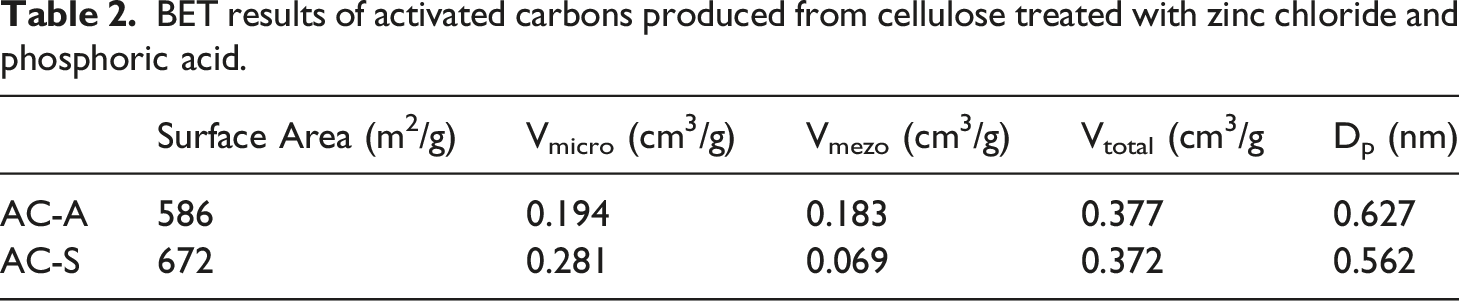
BET results of activated carbons produced from cellulose treated with zinc chloride and phosphoric acid.
The use of H3PO4 or ZnCl2 as activators during activation can promote the dehydration, redistribution and depolymerization of biopolymers, as well as support the conversion of aliphatic component into aromatic compounds, thereby enhancing the efficiency of activated carbon production.31,32 During H3PO4 activation, the presence of phosphate and polyphosphate species in the raw material's structure takes place to the formation of a cross-linked structure. Upon heating, the organic compounds formed within this structure are released as gases, leaving behind a highly porous structure. In comparison to activated carbons produced by ZnCl2 activation, those produced by H3PO4 activation have a higher volume of mesopores.
33
ZnCl2 activation induces an electrolytic effect on the molecular structure of cellulose, resulting in the fragmentation of cellulose molecules and the increased formation of intra- and interlamellar voids. As a result, the activated carbon that is produced has a greater surface area.
34
In order to allow the subsequent release of volatile substances from the activated carbon surface, ZnCl2 prevents the production of bitumen and other liquids that obstruct the carbon monoxide surface and restrict the flow of volatile substances.35,36 So, activated carbons produced from cellulose exhibit specific surface areas ranging from 586 m2/g to 672 m2/g, micro-pore volumes of 0.194-0.281 cm3/g, and meso-pore volumes of 0.069-0.183 cm3/g, as shown in Table 2. Overall, the activation of cellulose-derived activated carbons involves the conversion of cellulosic materials into carbon, the release of various volatile compounds, and the formation of a highly porous structure with significant surface area and pore volume. FE-SEM, EDS, and Mapping analyses of activated carbon obtained from cellulose with H3PO4 activation agent were given in Figure 2. FE-SEM (a) EDS (b) and Mapping analyses of activated carbon by using H3PO4 (c-f).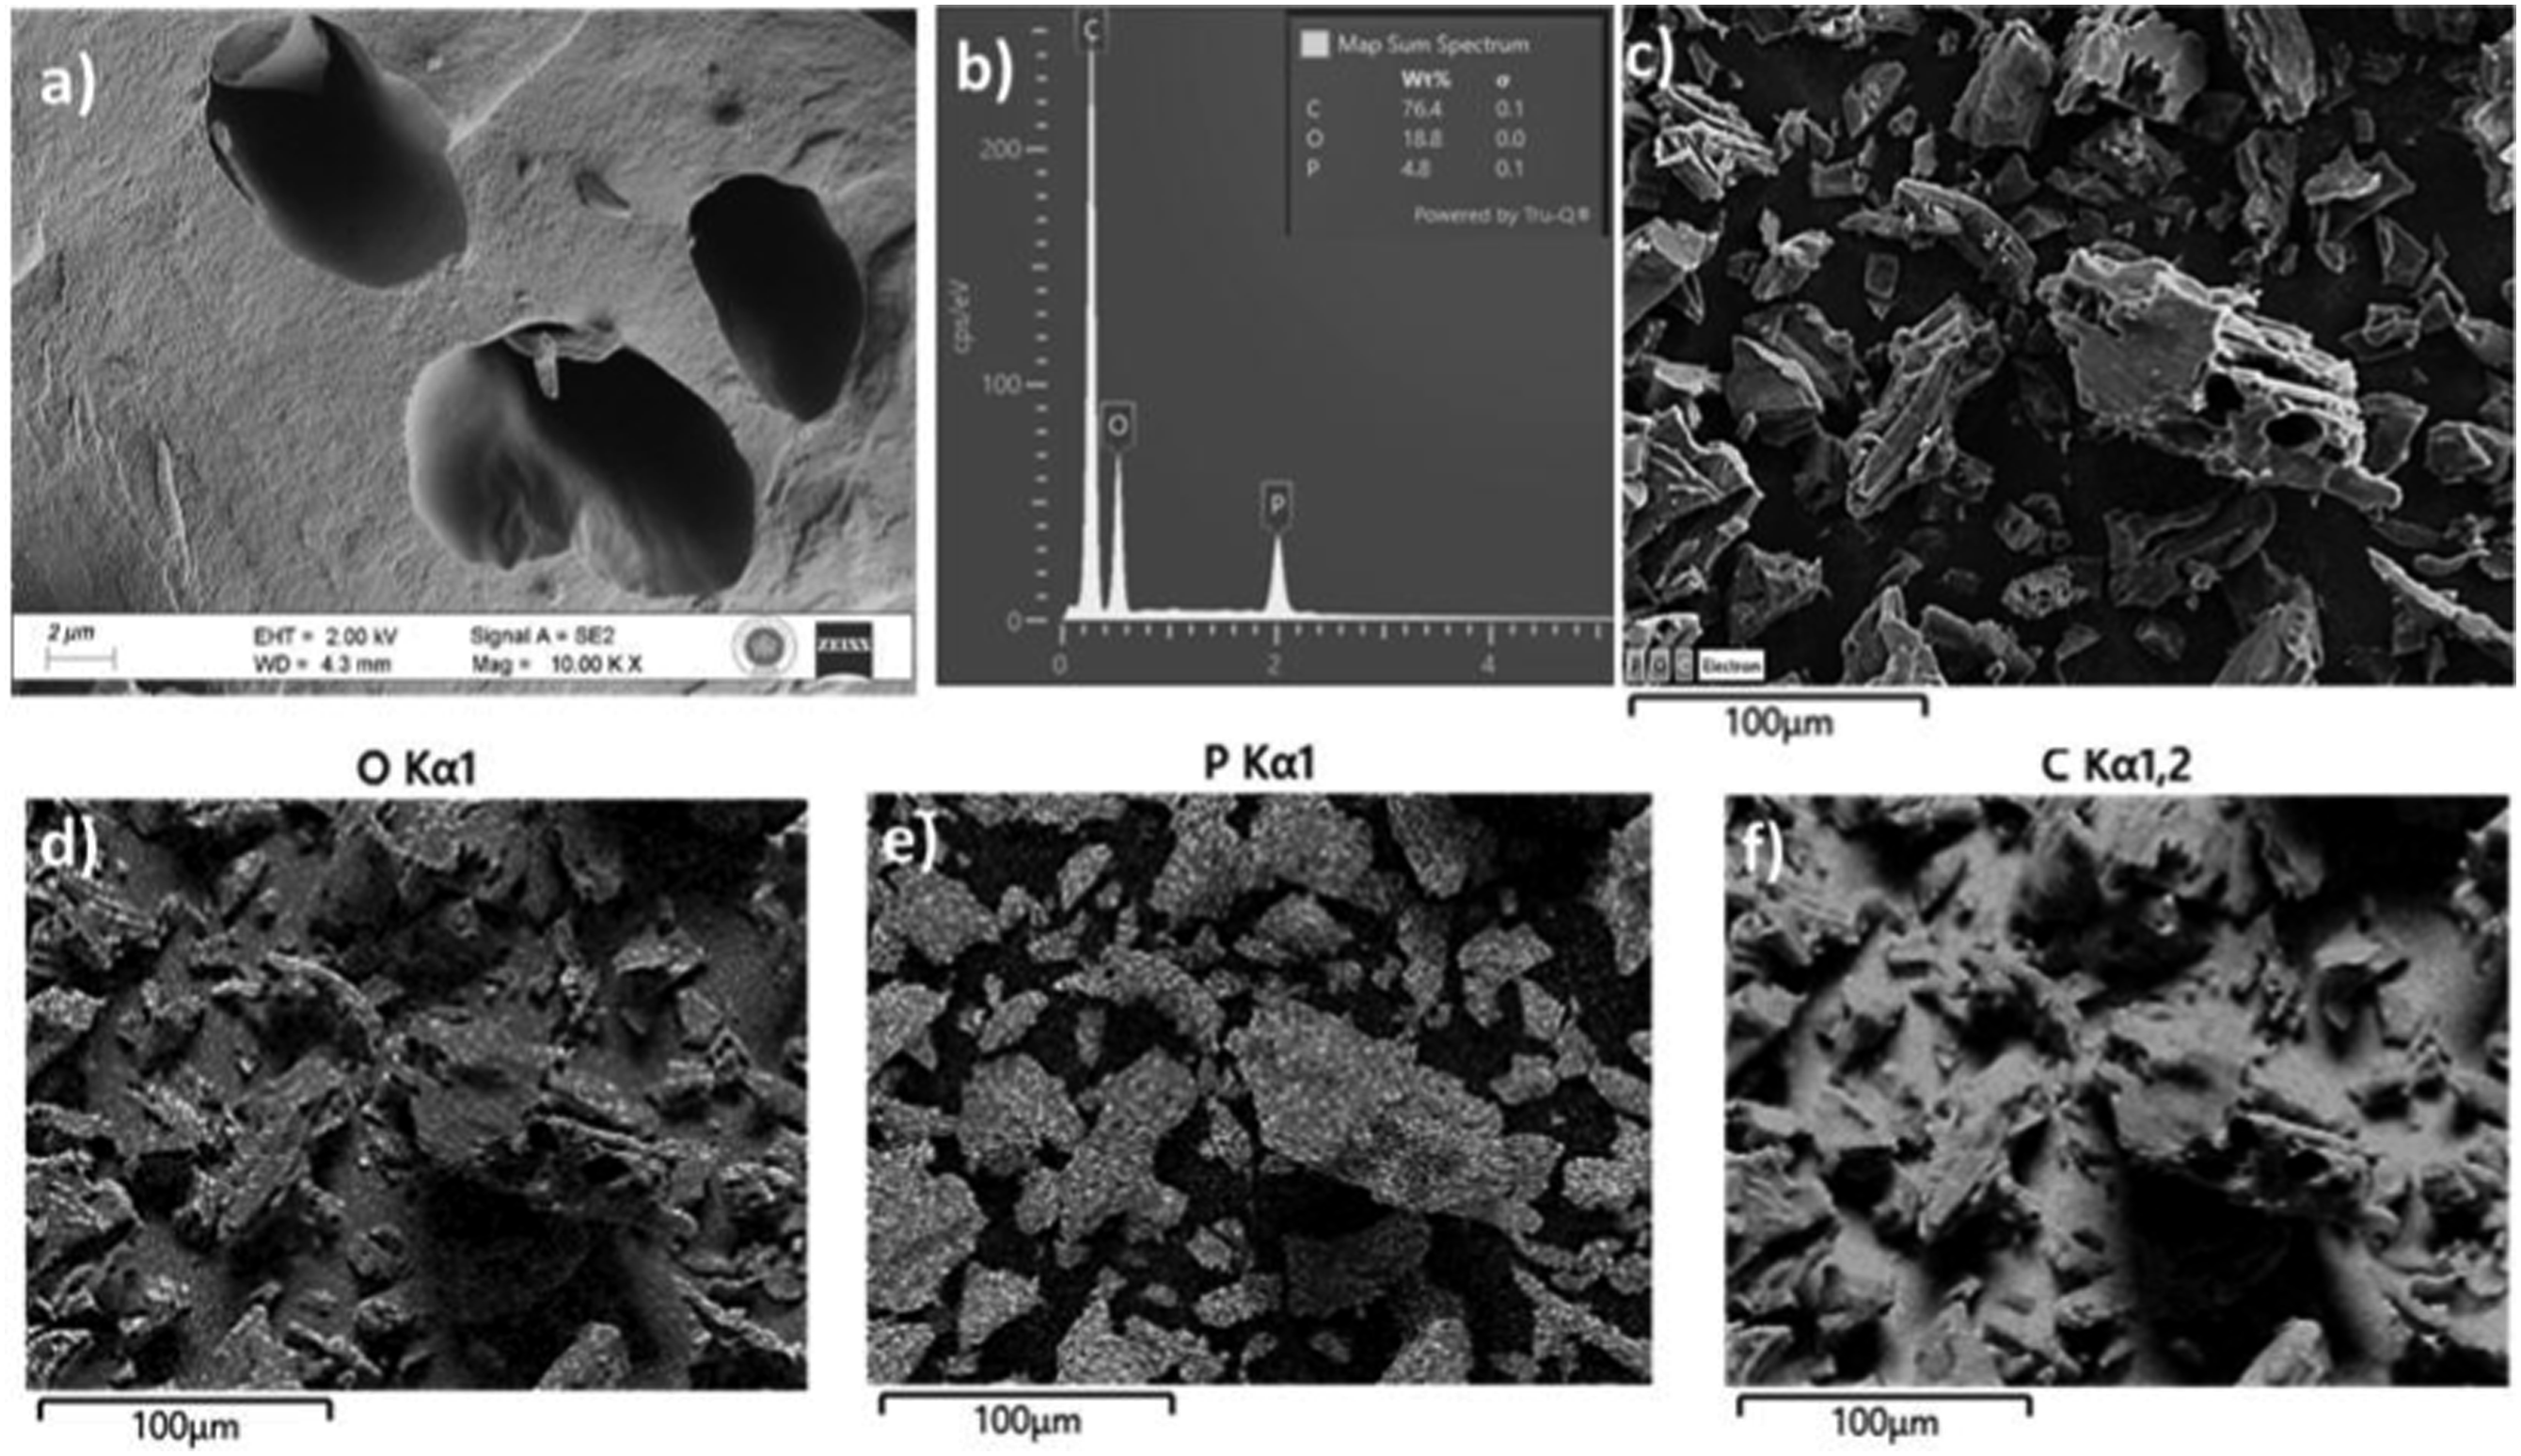
FE-SEM images of activated carbon produced using phosphoric acid of cellulose were seen the surface physical morphology (Figure 2(a)). In the images, it is clearly seen that spherical pores have been formed. Phosphoric acid reacting with cellulose induces depolymerization and leads to an increase in pore volume and, consequently, a global volume expansion. 37 Phosphoric acid can bind to cellulose to form phosphate bonds which can cause biopolymers to bind and crosslink during the activation process. These pores occur with these structures, which expand the structure of cellulose. 38
The EDS and Mapping analyses of activated carbon obtained from cellulose by using phosphoric acid activation agent are seen in Figures 2(b) and 2(c). As a result of the EDS analysis, it was found that the produced activated carbon contained 76.4% carbon (C), 18.8% oxygen (O) and 4.8% phosphorus (P) elements. On the other hand, as a result of the FE-SEM Mapping analysis, it was understood that the C and O elements were distributed homogeneously on the surface of the activated carbon after pyrolysis, and this situation is shown in Figure 2(f) and Figure 2(d), respectively. In addition, the homogeneous distribution of the P element in activated carbon with the adhesion of
FE-SEM, EDS and Mapping analyses of activated carbon obtained from cellulose by using ZnCl2 activation agent are seen in Figure 3. FE-SEM (a) EDS (b) and Mapping analyses (c-g) of activated carbon by using ZnCl2.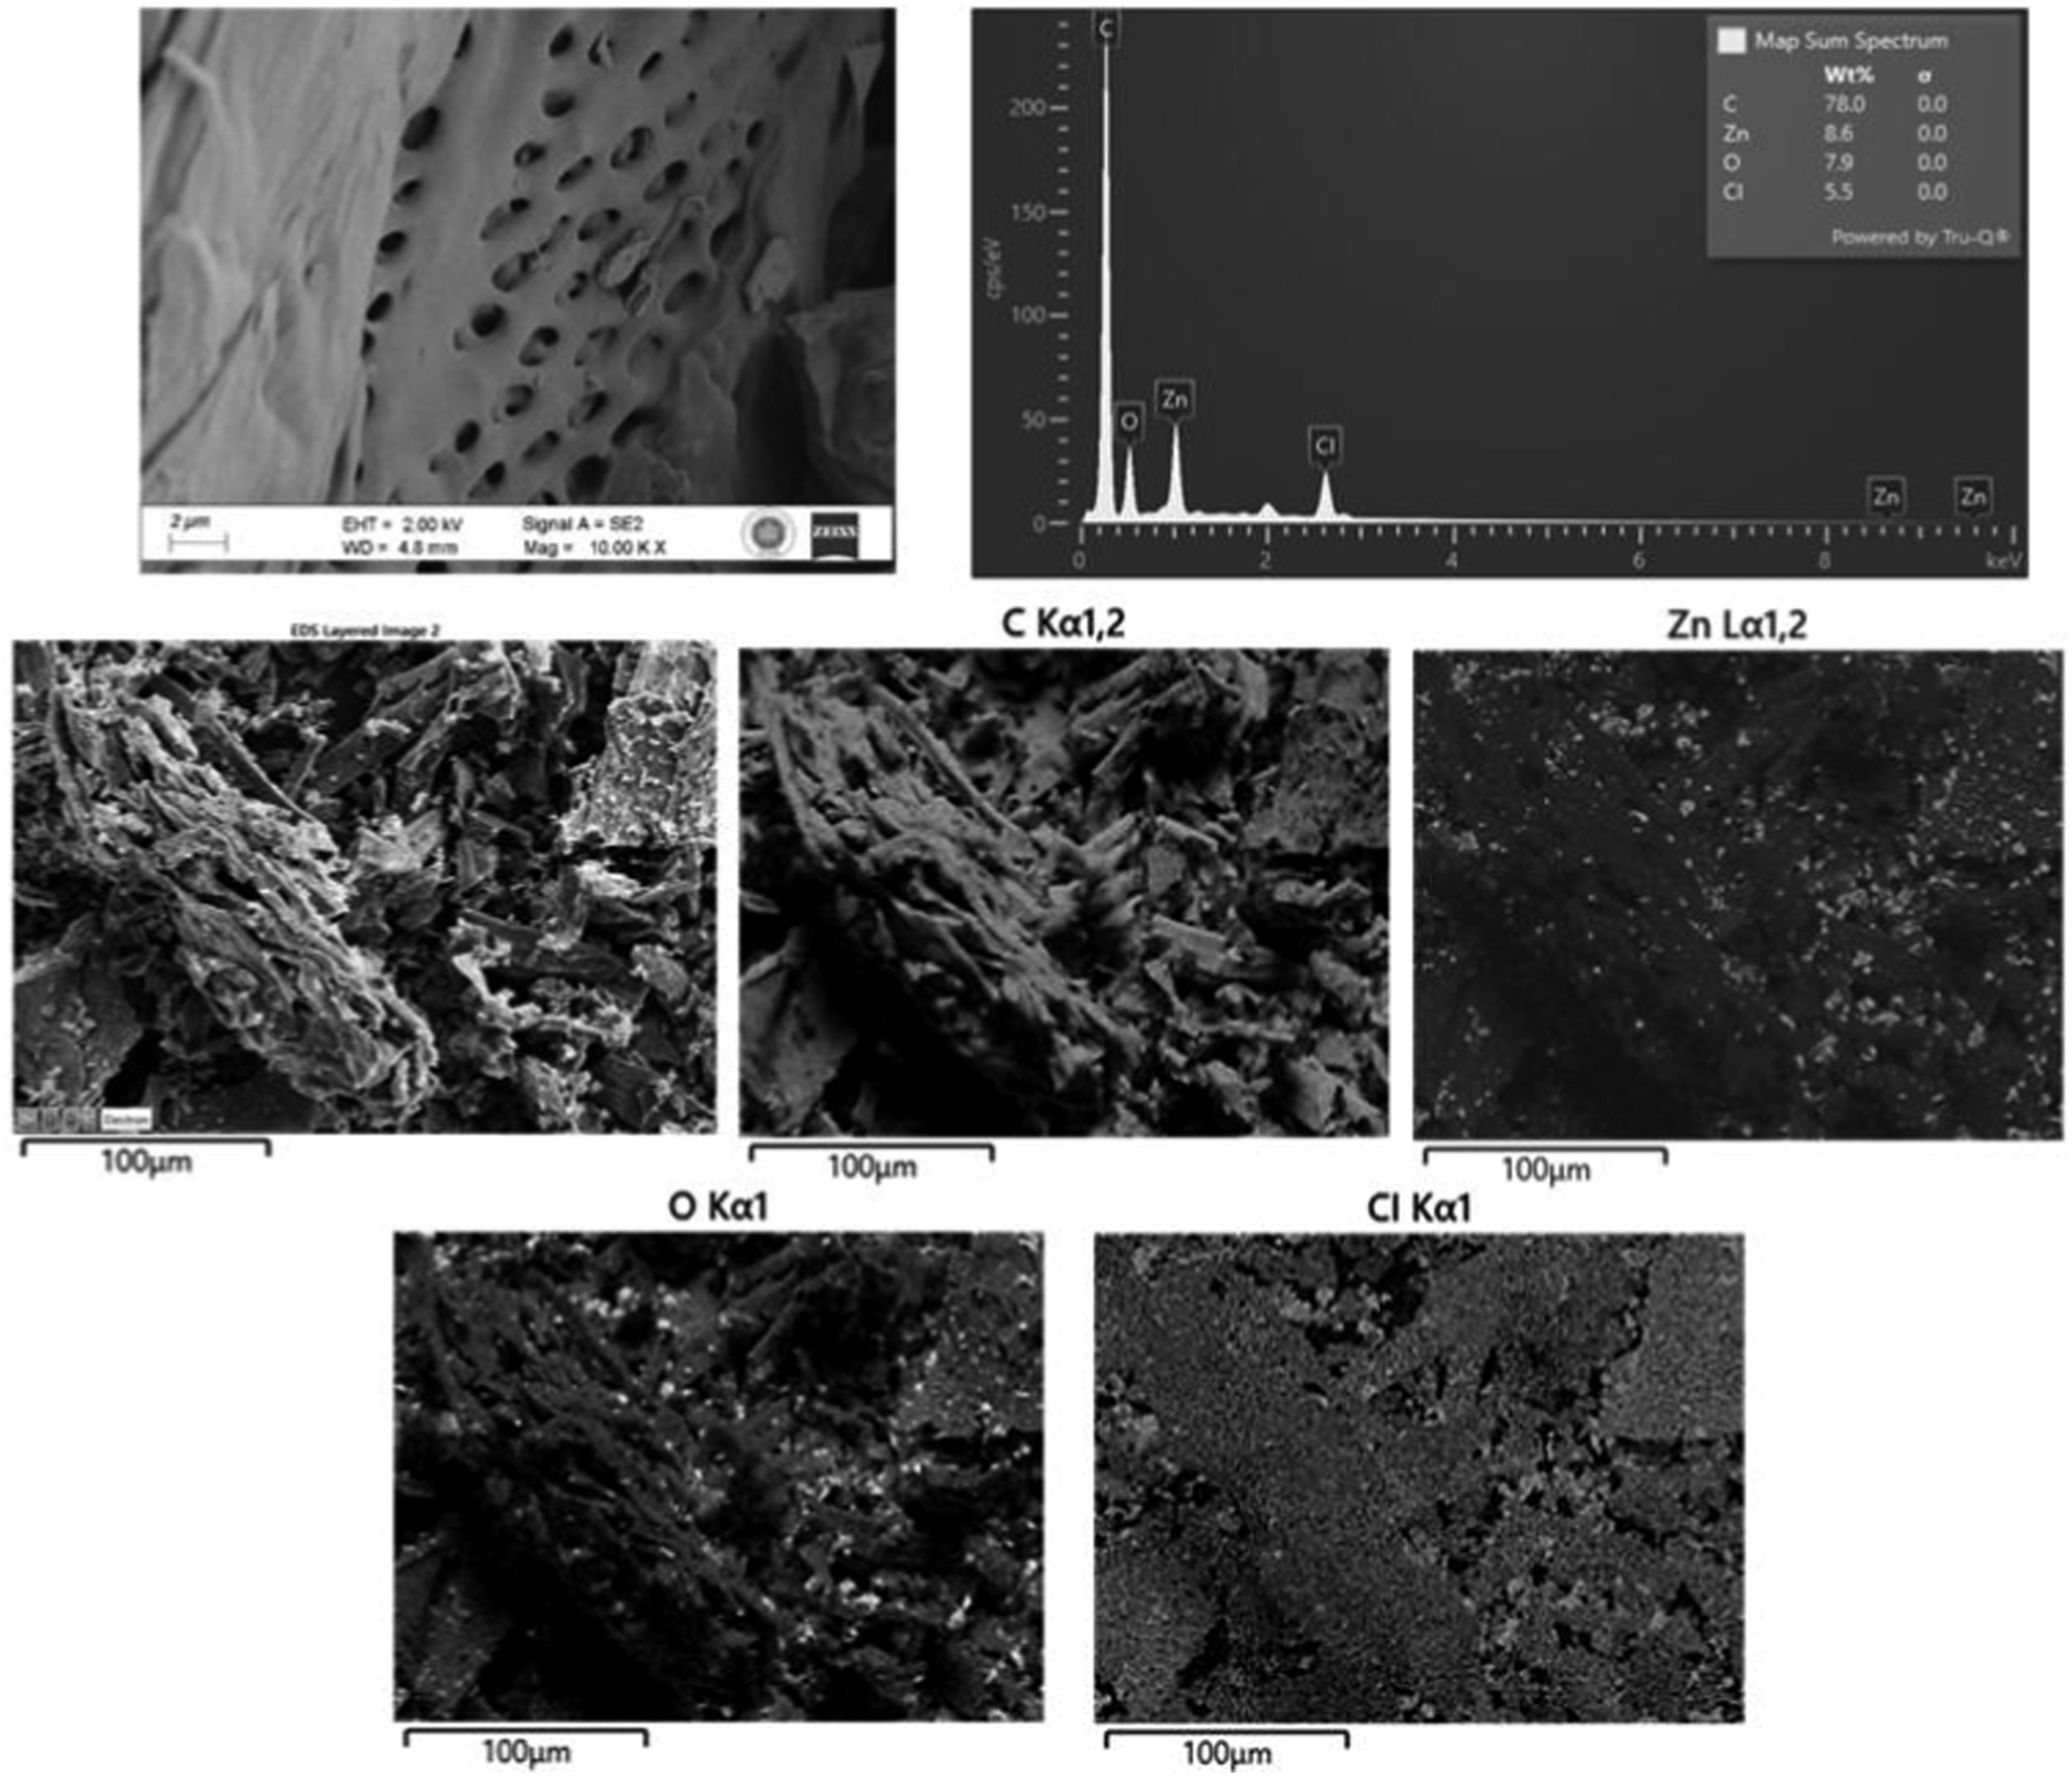
FE-SEM images of activated carbon produced using zinc chloride of cellulose were examined to observe the surface physical morphology (Figure 3(a)). It is seen that the pores in activated carbon are elliptical in shape. It is believed that the ZnCl2 chemical activation method causes carbonization of the carbon skeleton after activation by causing the decomposition of cellulose and increases the formation of pores by undergoing aromatization. On the other hand, this causes the lateral bonds in the cellulose molecules to break as a result of activation and leads to increasing the “inter” and “intra” micellar spaces. As a result of this situation, pores are formed in activated carbons. 45 Similarly, the activated carbons obtained using the activation mechanism have different pore sizes and shapes depending on the activation agents. 46
As can be seen in Figure 3(b), 78% carbon (C), 8.6% zinc (Zn), 7.9% oxygen (O), and 5.5% chlorine (Cl) elements were detected in activated carbon produced from cellulose by using ZnCl2 activation agent. When the FE-SEM Mapping image (Figure 3(c)) were examined, it was determine that all the elements are distributed homogeneously in the produced activated carbon. Additionally, Figures 3(e) and 3(g) show that the elements Zn and Cl are present in the environment as a result of the activation agent ZnCl2 being utilized. Similar outcomes can also be obtained by producing activated carbons employing ZnCl2 activation agent from various raw materials.47,48 It has been stated in previous studies that cellulose contains C element at a rate of 38% and O element at a rate of 52%. The reason for the decrease of the element O in the activated carbon structure is the removal of oxygen from the environment due to the pyrolysis of cellulose. 49 In the study conducted by Ergün and Bülbül (2022), it was reported that 79% C, 10% O, 7.5% Zn, and 3% Cl were detected as a result of the EDS analysis of the activated carbon produced by zinc chloride activation agent. 50
The densities of the activated carbons acquired by acid and salt activation agent were found to be 1.57 g/cm3 and 1.78 g/cm3, respectively. As can be understood from the microstructure of the activated carbon produced with the help of phosphoric acid, it was determined that the cell walls of activated carbons thickened, and they had a lower density due to the increase in pore diameter. Also, the EDS analysis results of activated carbons confirm this situation. Activated carbon produced with acid activation agent contains 18.8% O, while activated carbon produced with salt activation agent contains 7.9% O. Similar results were confirmed in past studies. 51
The functional groups in the structure of activated carbon obtained as a result of chemical activation of cellulose with ZnCl2 and H3PO4 agents were determined by FTIR analyses. The Figure 4 depicts the FTIR spectra of chemically activated carbons. FT-IR spectra of activated carbons produced using phosphoric acid and zinc chloride activation agent.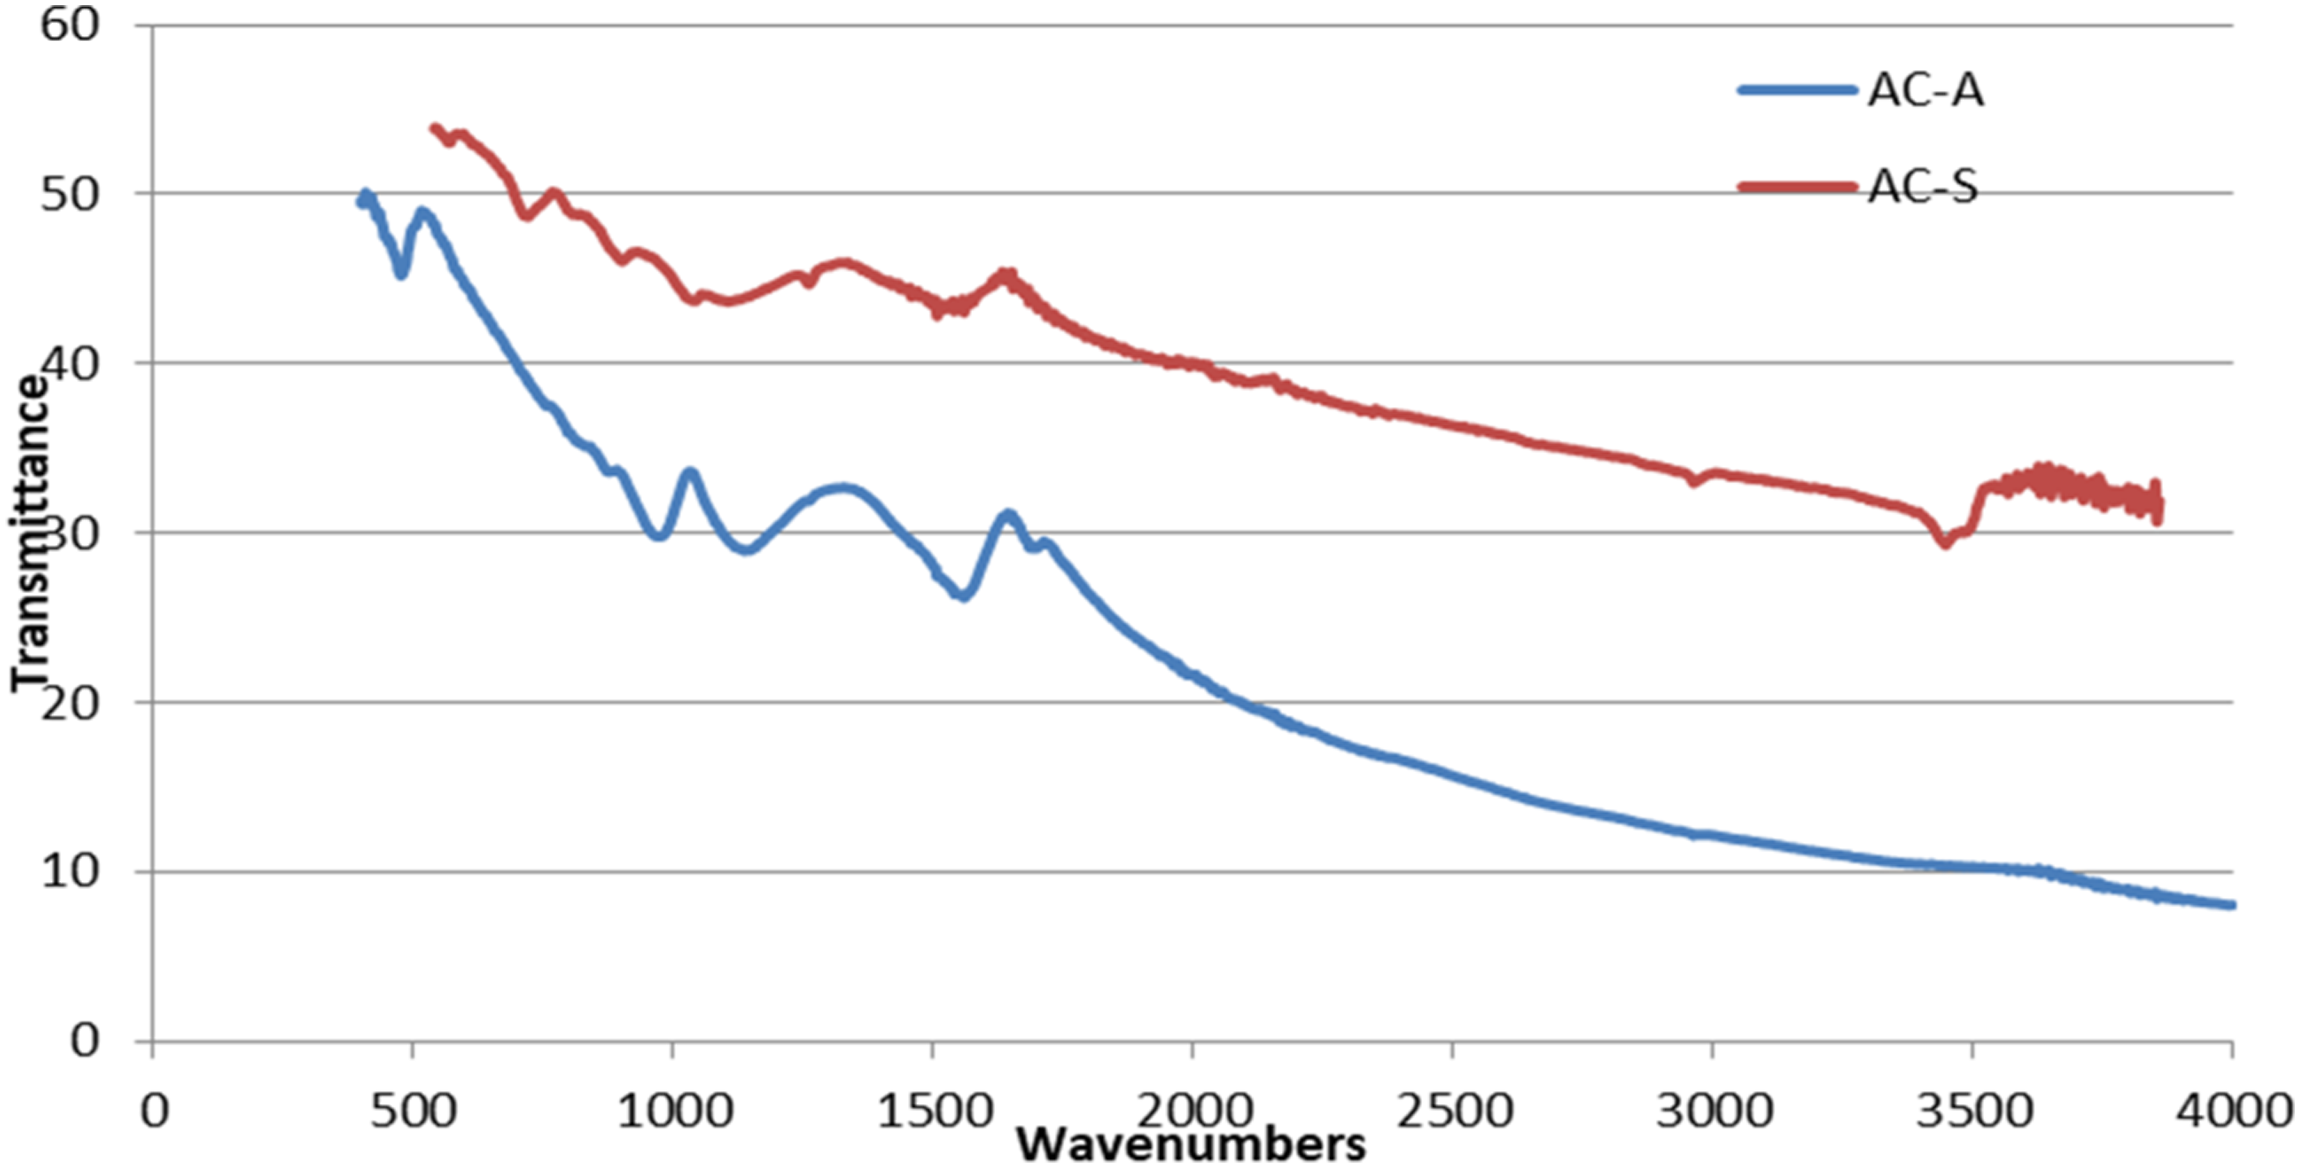
Activated carbon produced with ZnCl2 has O-H groups formed due to humidity at a peak of 3430 cm−1 and C-H groups caused by the aromatic methoxyl group at a peak of 2950 cm−1. The presence of ketones, aldehydes, lactones, or carboxyl groups (CO groups) is indicated by peaks around 1650 cm−1 in activated carbons produced with both ZnCl2 and H3PO4 agents. The intensity of this peak may vary depending on the concentration of the agent used in chemical activation. 52 Peaks between 1065 and 460 cm−1 represent a wide spectral region. The peaks in this region, ranging from 1000 to 1300 cm−1, are attributed to the C-O stretching vibrations, which are also observed in ethers, alcohols, acids, phenols and esters, as well as oxidized carbons. The presence of phosphorus compounds and phosphorus-carbonates in carbons activated by phosphoric acid can also be observed in this region. The peak at 1065 cm−1 indicates the ionized P-O bond and the symmetric vibration in the P-O-P chain. 53 Peaks between 540 and 870 cm−1 seen in AC-S are caused by the aromatic structures of aliphatic groups. 54 Peaks seen at 1000 cm−1 and below can be difficult to interpret because they overlap. The active carbon which was determined Zn and Cl with FTIR produced especially with zinc chloride were found to reduce the mechanical properties of NBR/NR matrix. It was stated that FTIR analysis provides important information about the performance of the produced materials. 55
Hardness and density test results of rubber compounds
The more activated carbon was added to the compounds, the higher their hardness values became. Similar behaviors were also observed in compounds with the addition of activated carbon produced with two different chemical agents. It was found that the highest hardness value belonged to the AC-S20 (89.67 Shore A) compound, to which 20% AC-S was added. The hardness of the AC0 compound without the addition of activated carbon was 79.76 Shore A. When compounds to which AC-S and AC-A were added are compared among themselves, it is possible to say that AC-S activated carbon increased hardening tendency of the compounds compared to AC-A activated carbon. According to one investigation, the hardness values of the compounds improve as the ratio of activated carbon added to the NR matrix increases. 56 It is believed that this increase in hardness is due to the fact that 8% Zn and 7.9% O elements contained in AC-S create the ZnO effect by coming together and cause an increase in crosslink density. There are literature studies that report that the element ZnO exhibits similar behavior in sulfur and increases the crosslink density.57,58 In a study, it was seen that there were increases in the hardness values of compounds whose crosslink density increased, as in this study. 59
When Figure 5 was examined, it was indicated that there was a diminish in the density values of activated carbon-added compounds. The highest density was found in the AC0 compound (1.145 g/cm3) without the addition of activated carbon. The density values of AC-A compounds show a change between 1.114 and 1.074 g/cm3, while the density values of AC-S -added compounds are between 1.115 and 1.088 g/cm3. SEM images of activated carbons revealed a porous structure. It is possible to say that activated carbon-added compounds add volume to raw dough and reduce density. The densities of the produced activated carbons are lower than the density of carbon black. The density of the produced AC-A is 1.57 gr/cm3, while the density of carbon black is 1.87 gr/cm3, and the density of AC-S is 1.78 gr/cm3. Therefore, the amount of activated carbon added to the compounds increases while the carbon black ratio decreases. Materials with low density also cause a decrease in the densities of the compounds in which they are used as filling materials.
60
Depending on the location and circumstances in which the material will be utilized (humidity, temperature, sunlight, etc.), the intended density and hardness values of rubber compounds may fluctuate.
3
Therefore, physical properties such as hardness and density do not have a certain standard value. While there was a boast in the hardness values of the activated carbon-added compounds, there was a decrease in their density. Density and hardness graph of compounds.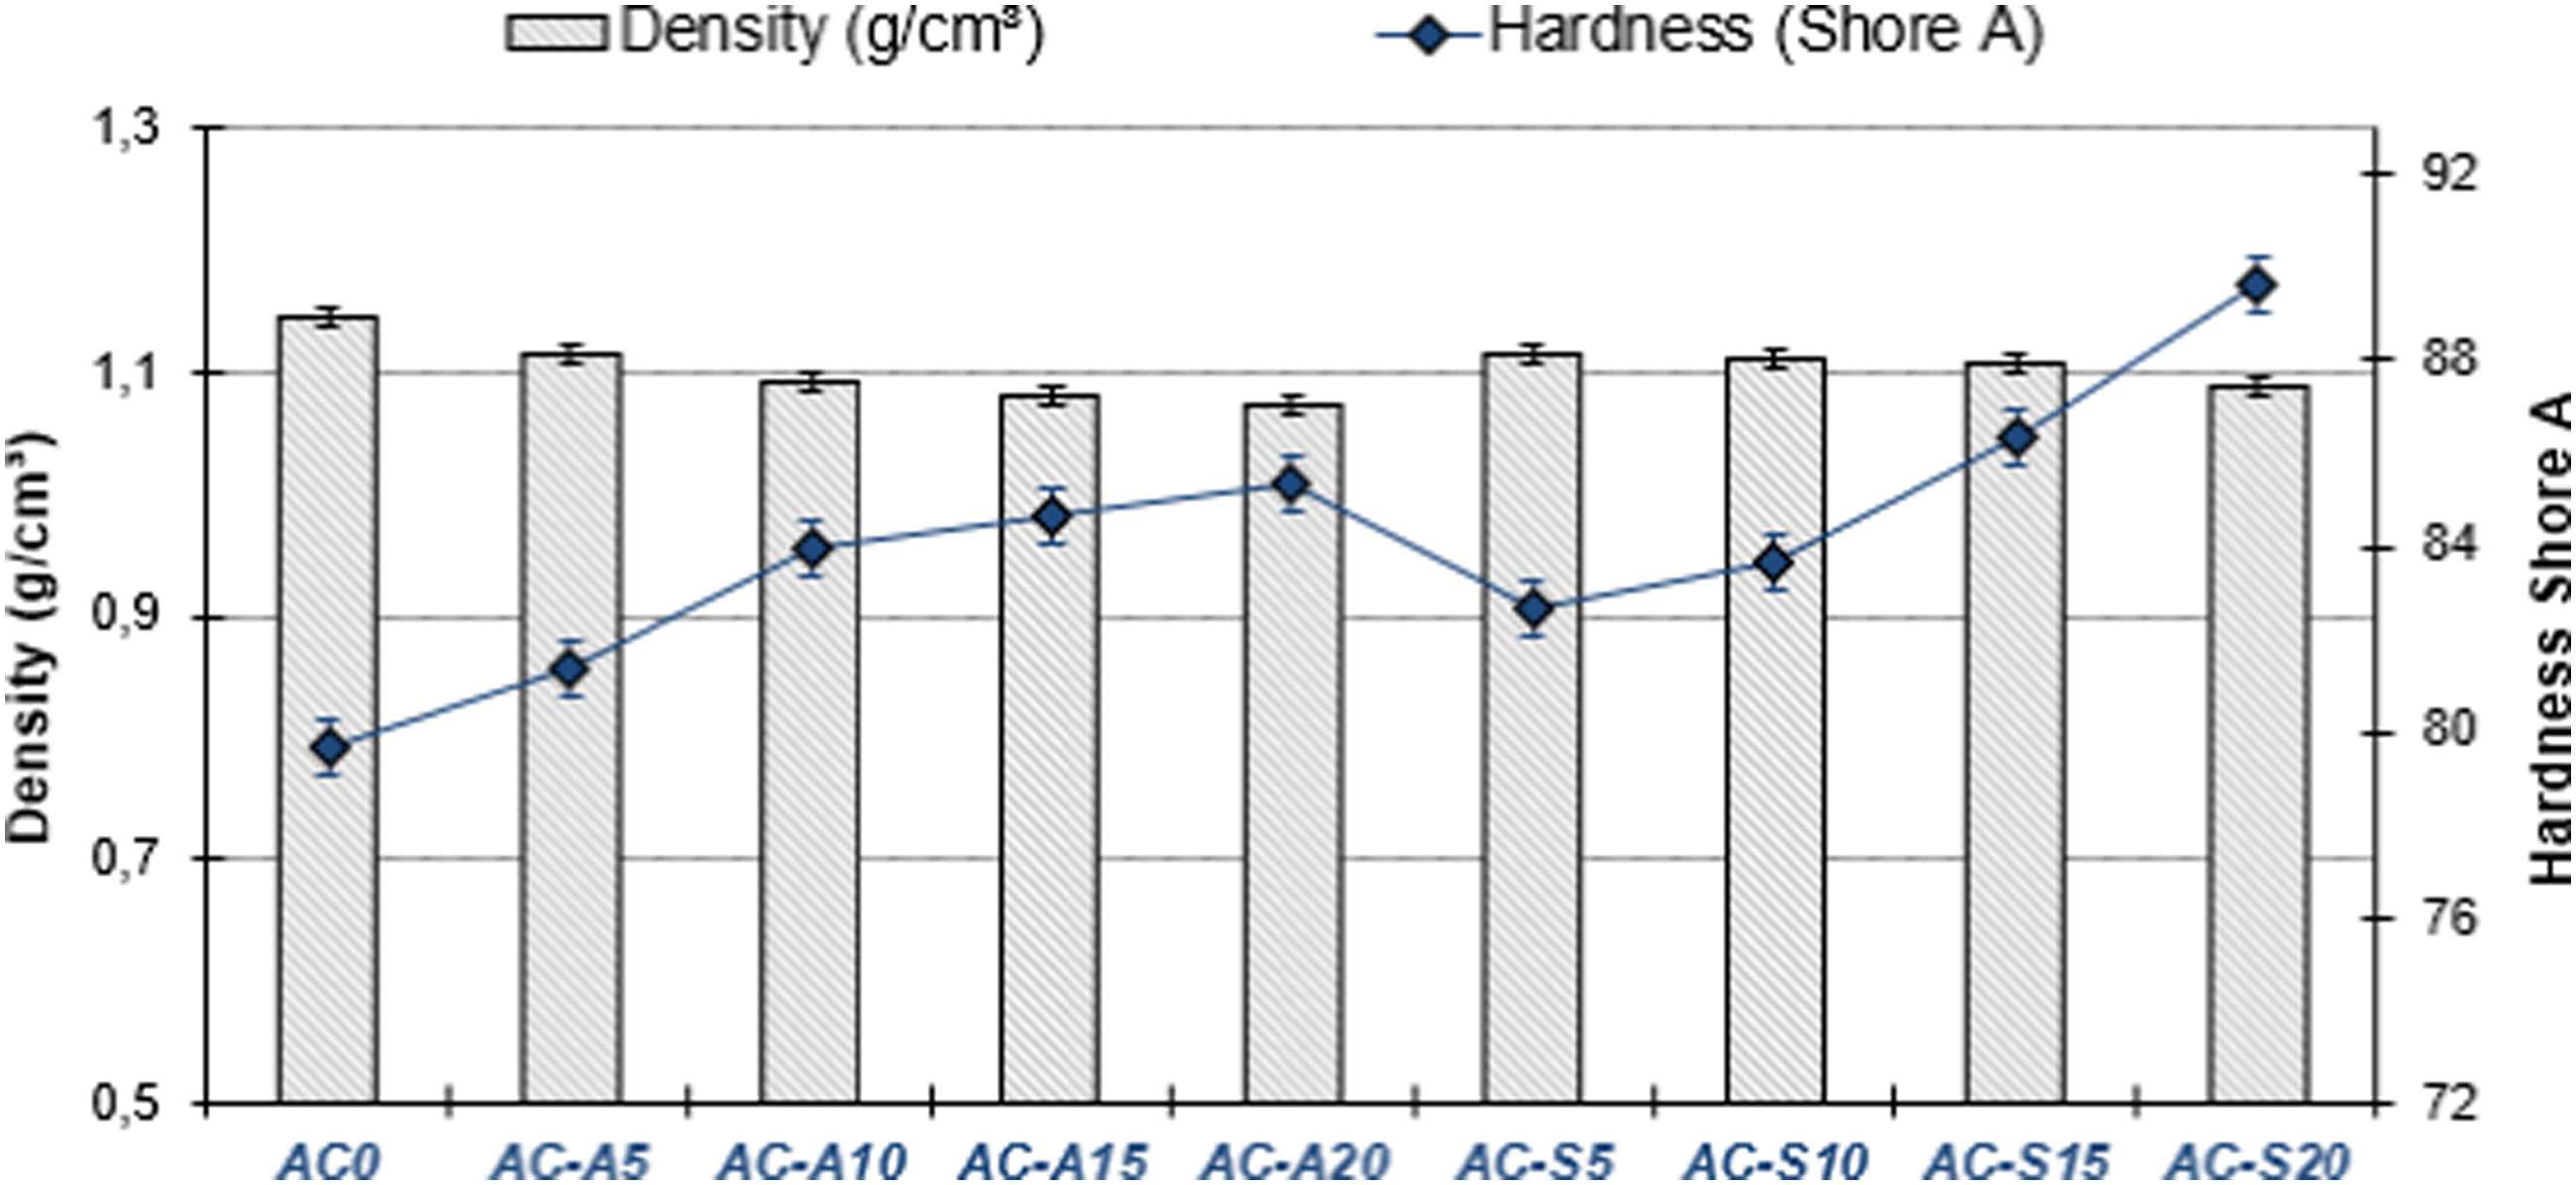
Breaking strength (tensile strength) and unit elongation experimental results of rubber compounds
The tensile strengths (breaking strength) of the compounds and their unit elongation values progressively raised as the rate of AC-A addition to the compounds increased. It was found that the compound with 20% AC-A added had a decrease both in breaking strength and in unit-elongation value. The breaking strength and unit elongation values of AC-A15 compound were determined as 12.78 MPa and 523.86%, respectively. It is seen that with these values, the compound AC-A15 has the highest toughness (tensile strength + % unit elongation). The breaking strength and % unit elongation values of the AC-S added compounds decreased as the AC-S addition rate increased (Figure 6). This situation shows that although all the production processes in the production of AC-A and AC-S are the same, activated carbons obtained with different chemical activators exhibit different characterization properties on the mechanical properties of compounds. In particular, it is possible to say that AC-A added to compounds in specified proportions improves the strength and % unit elongation properties of compounds, while AC-S does not improve the mechanical properties of compounds. However, according to ISO 37 standard, the minimum desired breaking strength for rubber soles (shoe outsoles) is 5.8 MPa. The tensile (breaking) strengths of the new compounds to which AC-S and AC-A have been added are above this value. Therefore, the activated carbons produced in our study can be used as filling material in the compounds used in the construction of outsoles. Tensile Strength and % Elongation graph of the compounds.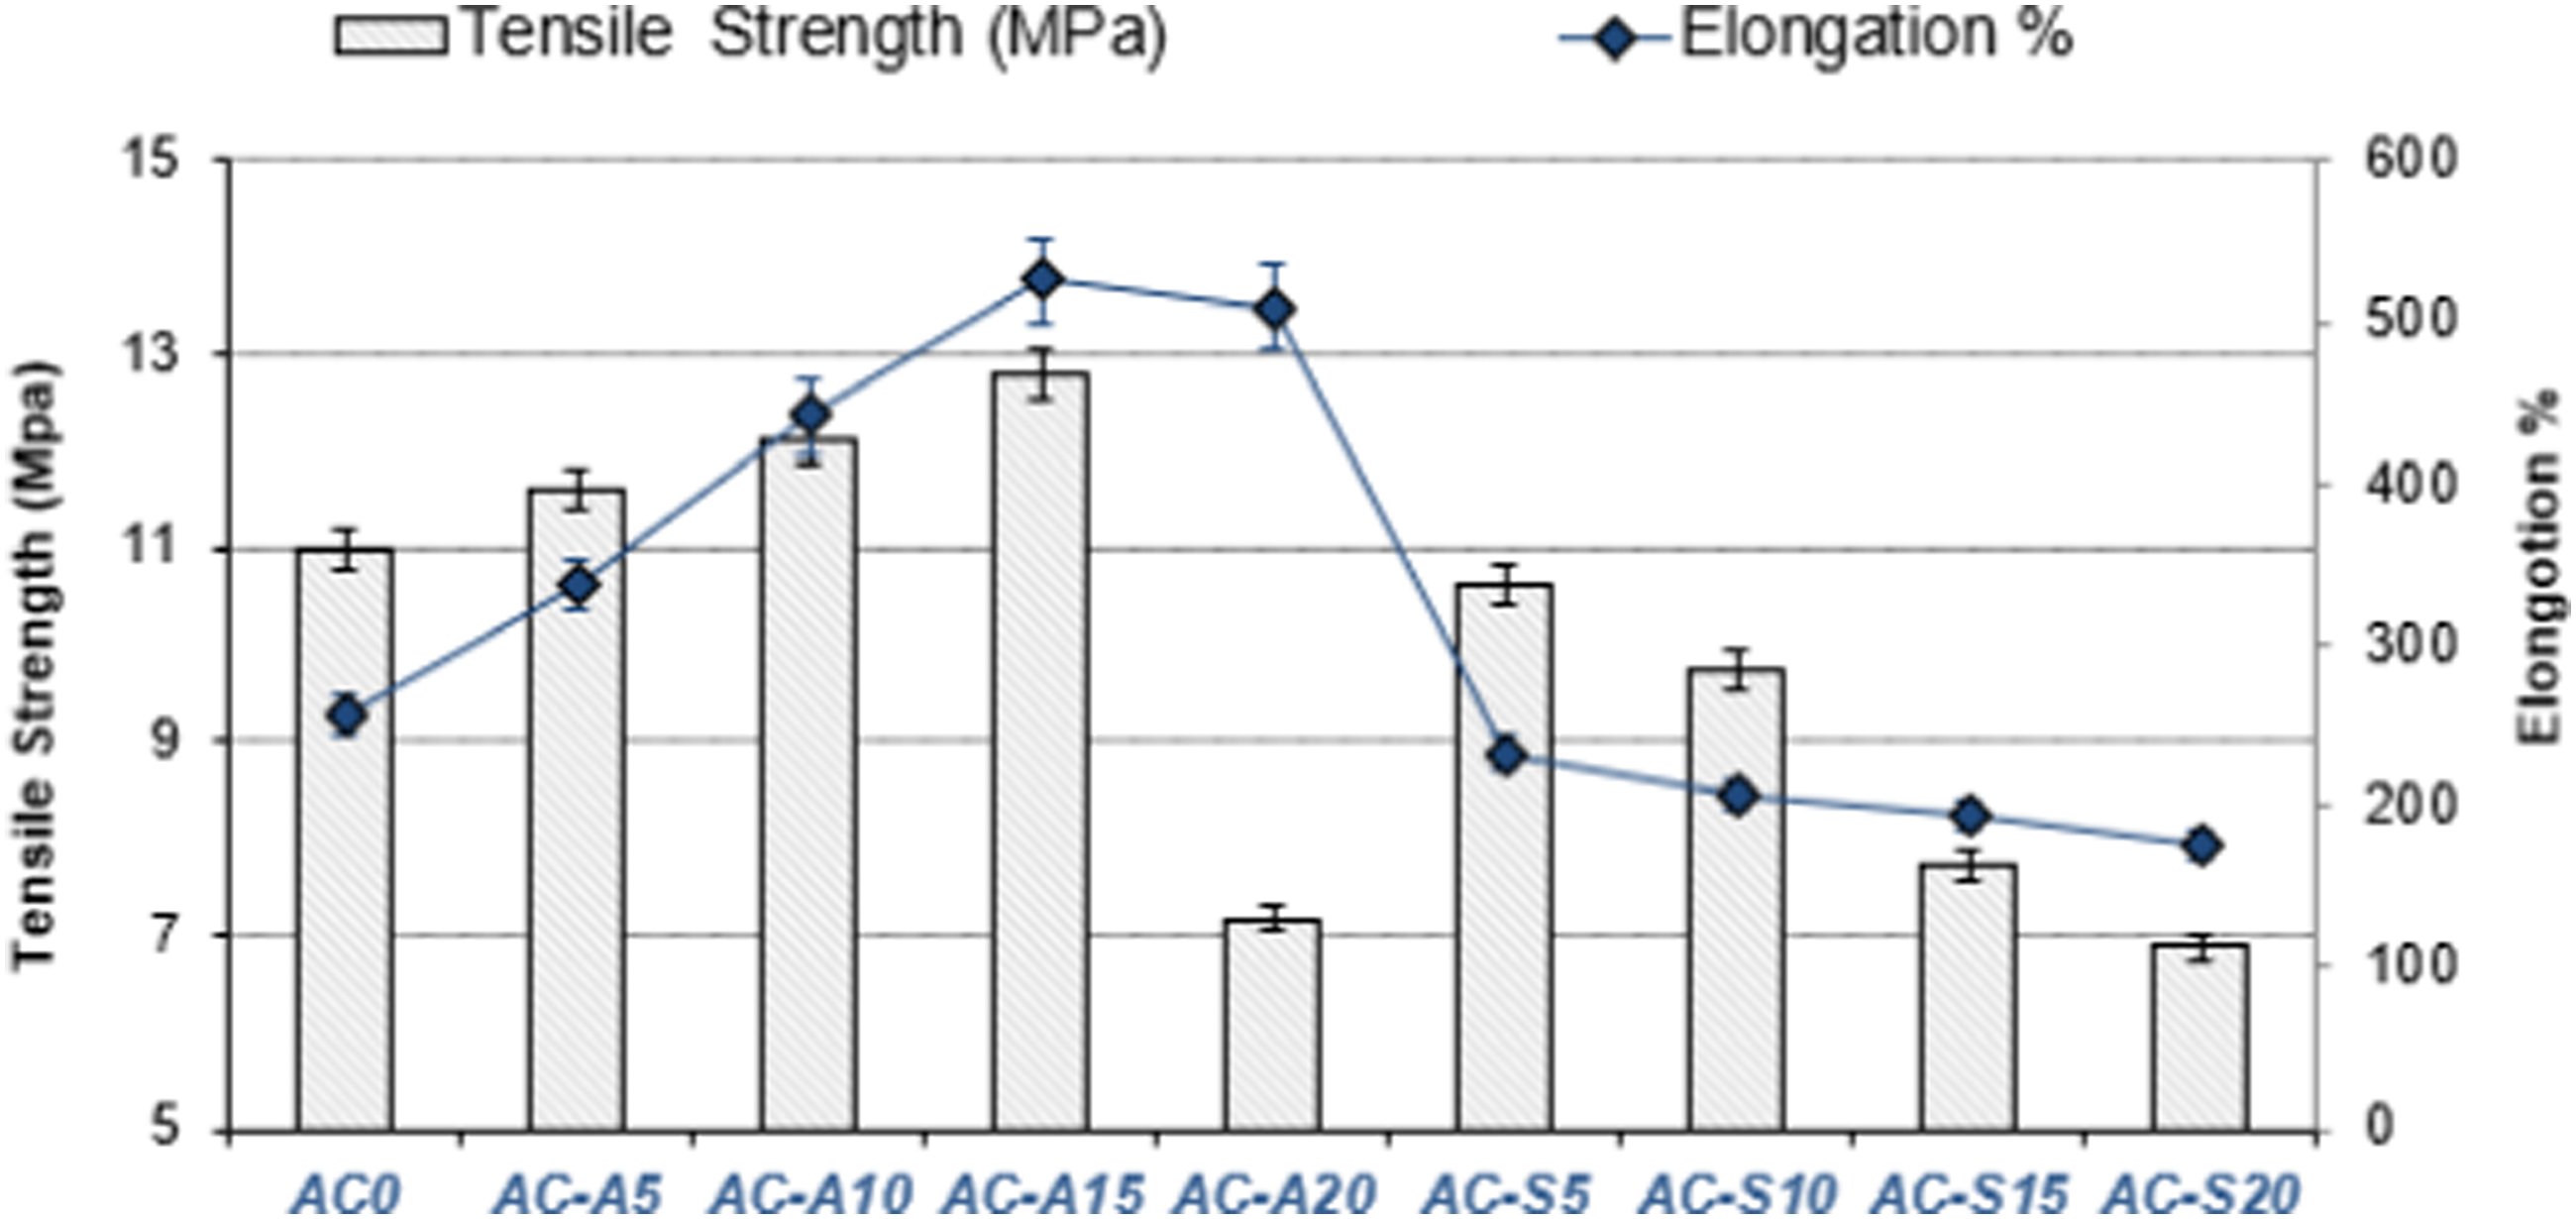
Previous studies indicated that when activated carbon used in different matrices and with various materials, enhances its mechanical properties, 61 while excessive amounts of activated carbon and other type fillers added to the mixture tend to diminish these mechanical characteristics.62,63 In a rubber related study, it was reported that adding activated carbon produced by the physical activation method to the SBR matrix up to 20%-30% improves the mechanical properties, however, due to the formation of clustering in the rubber matrix with the addition of activated carbon over 30%, the interaction of the rubber filler and the mechanical properties decreased. 64 In another study, activated carbon produced by physical activation method from dry Tecoma leaves was added to standard Malaysian rubber. As a result of the tensile test, it was found that the tensile strength increased with the addition of 5% activated carbon. 65 Thus, it is seen that the tensile and % unit elongation test results obtained in this study are in parallel with the literature. It is possible to say that the AC-S added to the compounds reduces the flexibility of the polymer chains and, accordingly, increases the stiffness. This condition was previously described in a study by Wang et al. 26
Modeling of experimental data with MLR
Multiple regression models were used to estimate the mechanical properties of experimentally created polymer composite samples. In the regression models created, the relationships between the independent variables (carbon black (CB), AC-S, and AC-A and the dependent variables (hardness, density (g/cm 3 ), tensile strength and unit elongation) were tried to be expressed by an equation. A regression model created in the form of three inputs and one output was used to examine the effects of three different variables on a single output variable. That is, in the context of this study, separate models were developed for 3 independent main inputs versus 4 dependent outputs.
In order to estimate the hardness, density, tensile strength, and % unit elongation values, a total of 54 data were obtained experimentally from 9 different samples as a result of 6 repetitions. The data set is divided into two as training and testing for the regression model. 42 data, which is 82% of the total data, were used as training data. A total of 9 data, including two samples that were never used during the training phase and laboratory data determined as a standard, were used to test the trained models.
The multiple linear regression method expresses the relationship between the dependent variable and more than one independent variable with a linear function. The effect of the carbon black (x1), activated carbon salt (x2), and activated carbon acid (x3) independent variables on hardness, density, tensile strength, and % unit elongation can be expressed as follows:


According to equation (5), hardness has a linear and binary interactive relationship with independent variables. In other words, the hardness changes as the amount of any independent variable increases. The effect of each independent variable on hardness is determined by its own coefficient. In addition, the combined use of independent variables also has an effect on hardness.
According to equation (6), density has a linear relationship with independent variables. In other words, as the amount of any independent variable increases, the density also increases.
The tensile (breaking) strength (Equality 7) has a linear and binary interactive relationship with independent variables. Based on these coefficients, it can be said that the effect of carbon black on the tensile strength is greater than others. The effect of activated carbon salt is negative. In other words, as the amount of activated carbon salt increases, the tensile strength decreases. The effect of activated carbon acid is positive, but less than carbon black. In other words, as the amount of activated carbon acid increases, the tensile strength increases, but this increase is slower. On the other hand, the terms of bilateral interaction indicate the contribution of the use of independent variables together to the tensile strength. For example, the interaction coefficient of carbon black and activated carbon salt is 0.04. In fact, the combined use of these two components increases the tensile strength. But this effect is less than the use of each of them alone.
Based on equation (8), it can be said that the % unit elongation has a linear relationship with the independent variables. The effect of activated carbon salt on % unit elongation is greater than others. The % unit elongation increases quickly as the amount of activated carbon salt increases. Carbon black has a similar effect, but to a lesser extent. The effect of activated carbon acid is minimal, meaning that the % unit elongation increases slowly as the amount of activated carbon acid increases.
In order to examine the effects of AC-S and AC-A values on hardness, density, tensile strength, and % unit elongation parameters, the values of these variables ranging from 0 to 20 were estimated by the MLR method, and the results are shown graphically in Figure 7. The changes of activated carbon salt and activated carbon acid ranging from 0 to 20 in hardness, density, tensile strength, and % unit elongation were plotted together with AC-A and AC-S. Those shown as a circle in Figure 7 are the test data. It was observed that the model makes a close prediction to the test data and can generalize. Comparison of the actual values of the test data with the estimation of the MLR model: (a) hardness, (b) density, (c) tensile strength, (d) % unit elongation graph.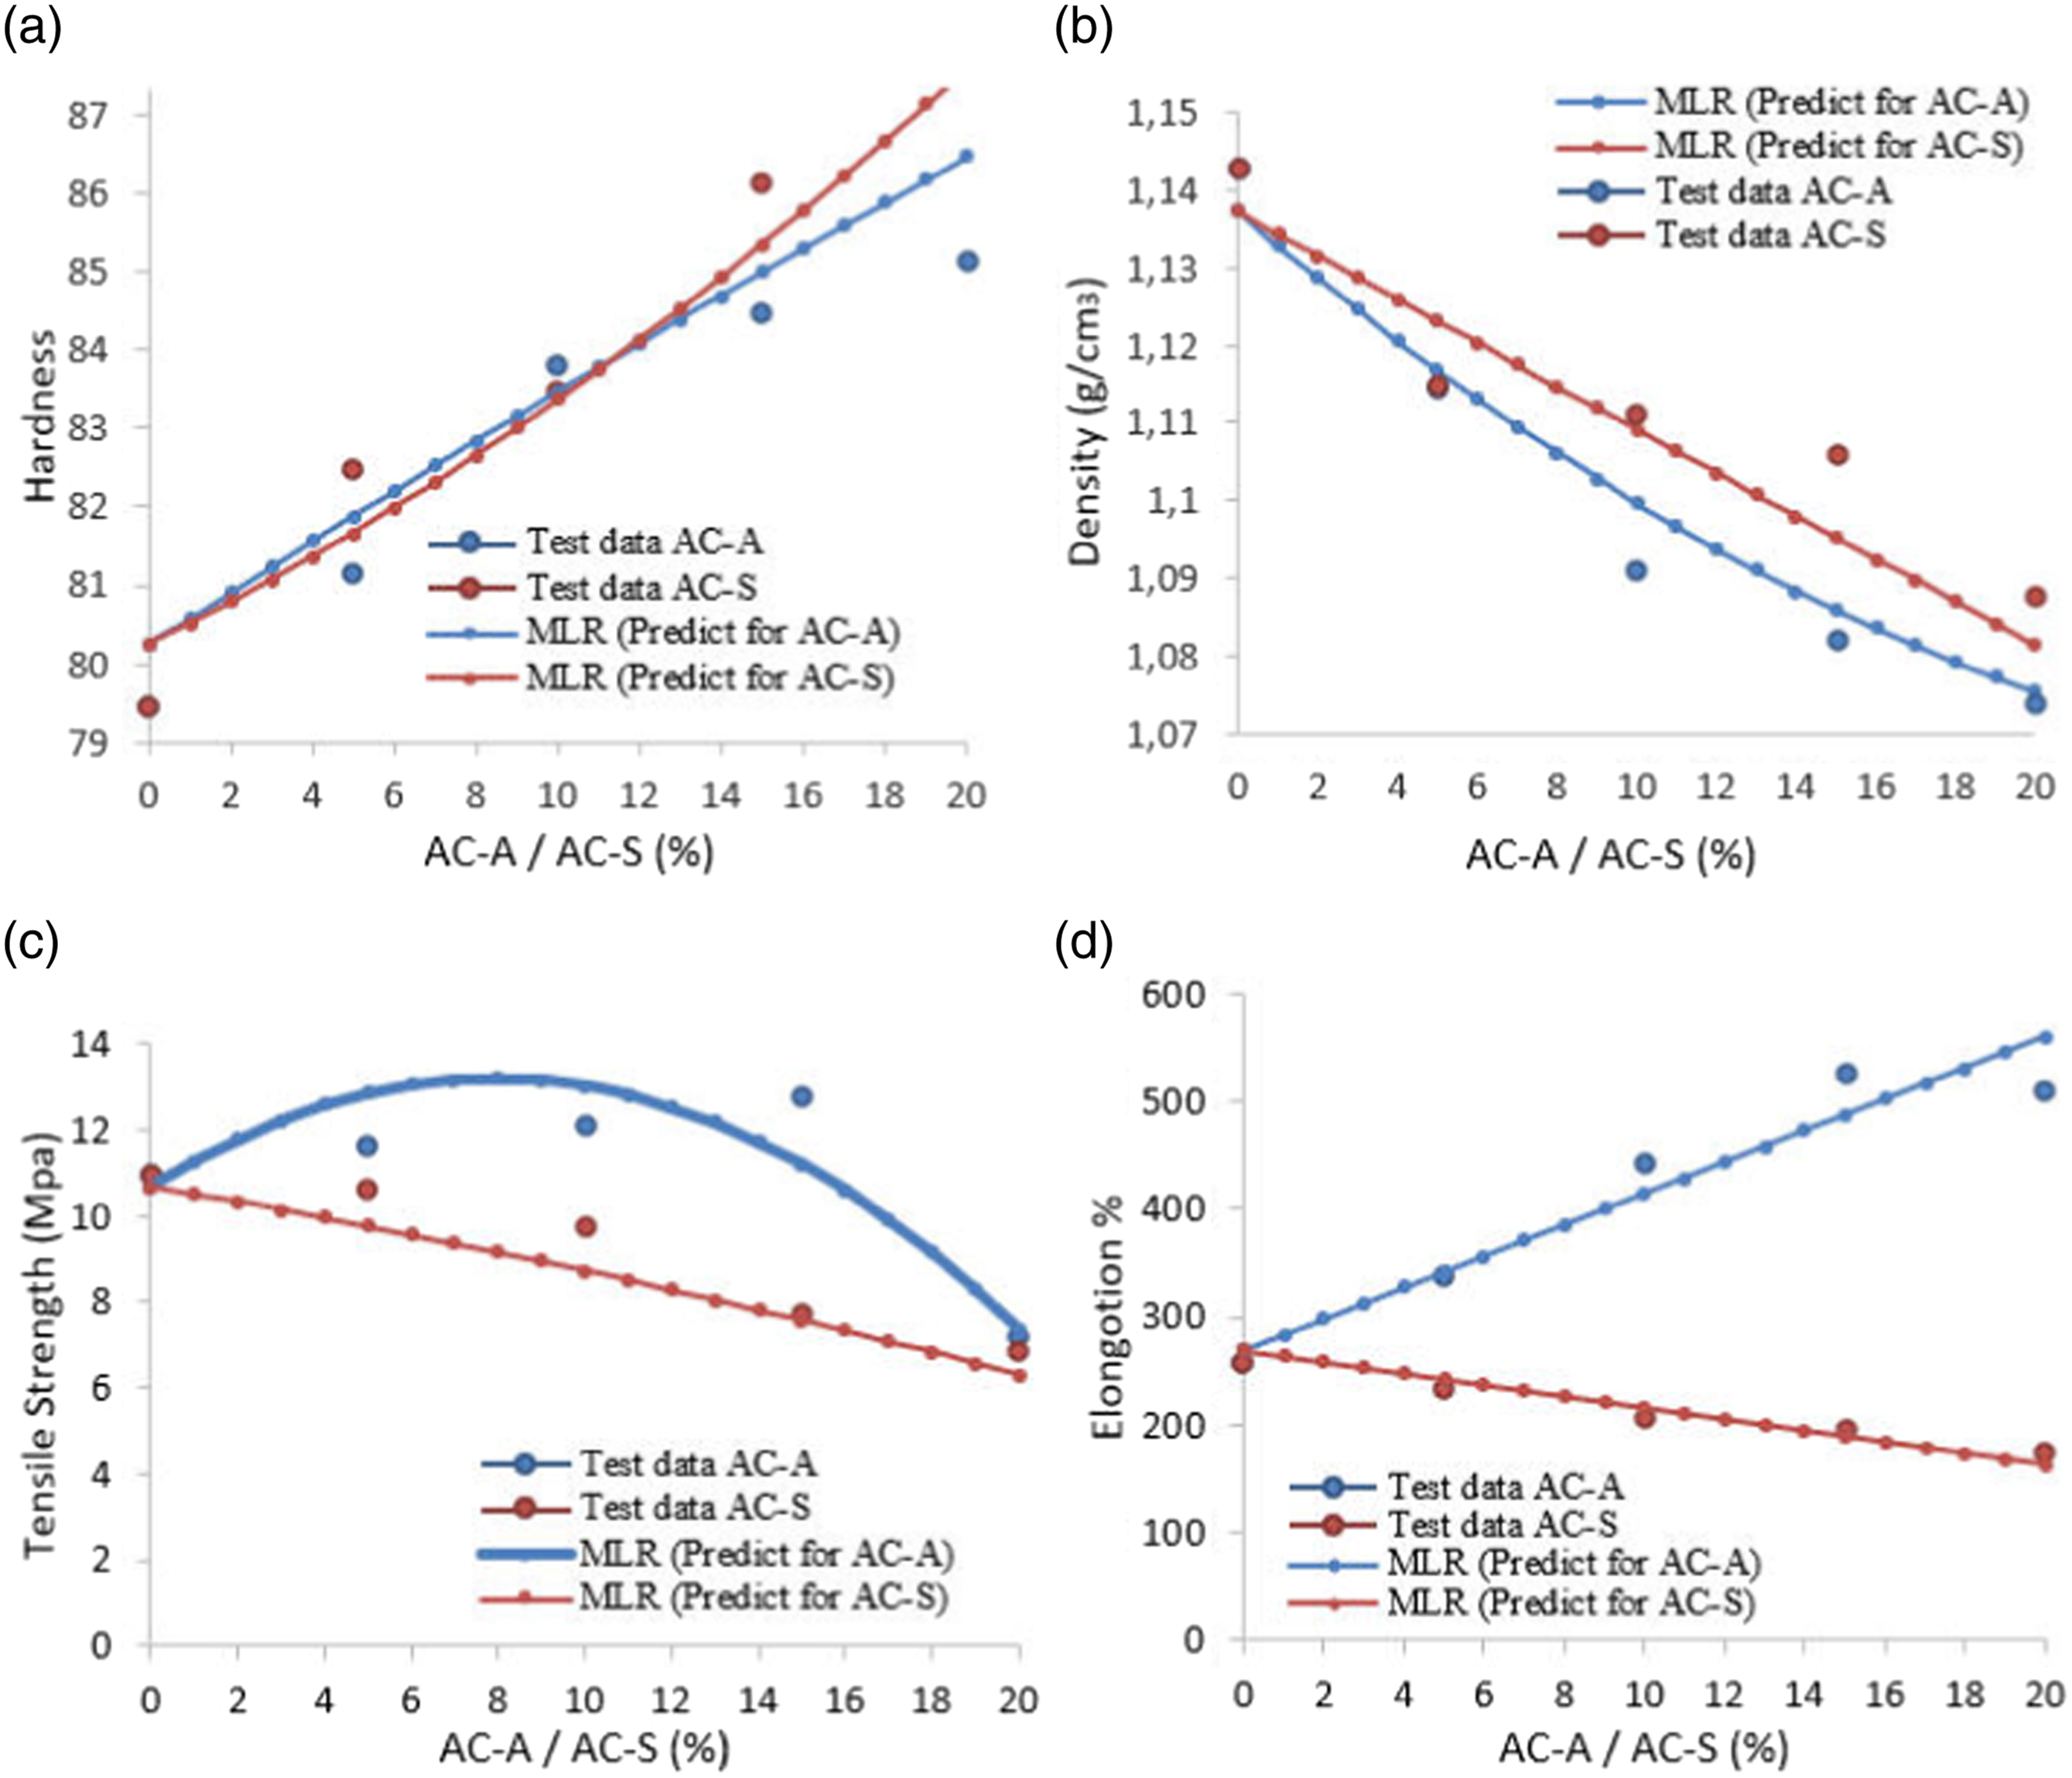
The estimated results of hardness, density, tensile strength, and % unit elongation values applied to the compounds created depending on the amount of activated carbon added to NBR/NR rubber were compared with the test data. The R-square values obtained for the test data were 0.89 for hardness, 0.90 for density, 0.84 for tensile (breaking) strength and 0.97 for elongation. These results show that the regression model explains these four dependent variables quite well. R-square values indicate how well the data is explained and how accurately the regression models make predictions. Based on these results, it can be said that while the model performed well for hardness and density, it showed a lower performance for tensile strength and showed a high performance for elongation. In a different study, the physical and mechanical properties of foam materials produced with the addition of activated carbon were examined by regression analysis, providing a robust statistical framework for analyzing the relationship between AC concentration and foam material properties. 66 The results were obtained based on the data set. Multiple linear regression is a preferred method when the data set is small and it is desired to avoid the problem of overfitting.29,30 Other complex methods perform better with big data, but they may be prone when working with small data. Since it is observed that the risk of overfitting is high in small-size data, the MLP method provides more stable results when working with them. It was seen that the developed models were successful in generalizing the data.
Conclusion
The primary objective of this study was to examine the impact of activated carbon produced from cellulose by utilizing various chemical agents on the mechanical properties of rubber composites. Activated carbons which have 586 m2/g and 672 m2/g surface area were produced from cellulose by using H3PO4 and ZnCl2 as activation agents. Activated carbon at different proportions (%0, %5, %10, %15 and 20%) was added to rubber compounds, and the hardness, density, tensile strength, and breaking elongation of the compounds were measured. When the produced rubber compounds were evaluated for use in shoe outsoles, the best results of the breaking strength and unit elongation values were given AC-A15 compound and were determined as 12.78 MPa and 523.86%, respectively. On the other hand, the most suitable hardness and density values for the shoe outsole were max 1.50 g/cm3 and 55 (Shore A), respectively. All samples ensured that they met the required standard. In addition, for the purpose of the study, multiple regression models were developed to understand and predict the effects of carbon black, activated carbon salt, and activated carbon acid values on hardness, density, tensile strength, and % unit elongation in order to determine the properties of carbon-based materials. The results showed that the models were successful in the prediction of the data and generalization. To reduce the time and cost spent on conducting experiments, it is suggested that satisfactory results can be predicted. As a result, the study promotes the use of environmentally friendly materials and can be seen as an important step towards a more sustainable industry.
Footnotes
Declaration of conflicting interests
The author(s) declared no potential conflicts of interest with respect to the research, authorship, and/or publication of this article.
Funding
The author(s) received no financial support for the research, authorship, and/or publication of this article.