
Abstract
Exposure to potentially psychologically traumatic events for correctional workers is high. However, the mechanisms driving the high prevalence are relatively unexplained. Using data from a cross-sectional, online survey of correctional service workers (n = 845) in Ontario, Canada, collected in 2017–2018, we assess the prevalence of mental disorders with a specific focus on uncertainty in the workplace and between correctional roles. We find that correctional officers, institutional governance, and probation/parole officers appear most at risk of mental disorders (prevalence of any mental disorder was 56.9%, 60.3%, and 59.2%, respectively). We argue slightly lower prevalence among institutional wellness, training, and administrative staff may result in part from their more predictable work environment, where they have more control. The results reaffirm a need for evidence-based proactive mental health activities, knowledge translation, and treatment and a need to explore how authority without control (i.e., unpredictability at work) can inform employee mental health.
Keywords
Introduction
Carleton and colleagues (2018) reported the prevalence of mental disorders for Canadian correctional workers to be as high as 55%, which is much greater than the approximately 10% prevalence found among the general Canadian population (Statistics Canada, 2012). Perhaps unsurprising, given correctional work is associated with occupational stressors (Boudoukha et al., 2013; Boyd, 2011; Lambert et al., 2009; Lambert & Paoline, 2010) and situations laced with unpredictability and therein uncertainty which has been linked to mental disorders (Carleton, 2016). All correctional workers have diverse degrees of authority and control in their workspace, and their control is often directly informed by the compliance of those in custody and the unpredictable nature of humanity (Rhodes, 2004; Sykes, 1958). Unpredictability can drive uncertainty. Experiencing uncertainty can lead to a weakened perception of safety, which in turn is associated with increased mental disorder symptoms (Fullerton et al., 2006; Grupe & Nitschke, 2013).
Uncertainty regarding one’s safety may be particularly detrimental for correctional employees who are on high alert to operational stressors (Ricciardelli & Power, 2020). Correctional worker roles vary substantially, but correctional workers remain embedded in an unpredictable and uncertain workspace replete with direct (e.g., in-person) and indirect (e.g., reading case files) Potentially Psychologically Traumatic Event (PPTE) exposures (Carleton, Afifi, et al., 2019; Carleton et al., 2018). Exposures to PPTE vary in severity and type (e.g., violence, physical assaults, death by suicide, and harassment) (Carleton, Afifi, et al., 2019; Isenhardt & Hostettler, 2016; Ricciardelli, 2019) and have been linked to increased risk of mental disorders including major depressive disorder (MDD), posttraumatic stress disorder (PTSD), panic disorder (PD), generalized anxiety disorder (GAD), social anxiety disorder (SAD), and alcohol use disorder (AUD) for correctional workers (Carleton et al., 2018; Ricciardelli, Carleton, Groll, & Cramm, 2018; Ricciardelli, Carleton, Mooney, & Cramm, 2018).
Correctional workers can reasonably expect PPTE exposures in diverse locations, like populations of people who are incarcerated and work environments. For instance, in Canadian federal prisons, in 2014, Correctional Services Canada (CSC) surveyed 122 correctional officers and found they experience PPTE in the form of excessive violence with 15% of respondents reported being physically assaulted more than 3 times; 17% reported responding to suicide attempts more than 3 times; 20% reported responding to a riot more than 3 times; 17% reported witnessing murder more than 3 times; and 50% reported witnessing a physical assault more than 3 times. Often these situations are laced with low control and uncertainty. Community correctional workers, such as probation officers, may be exposed to both direct (e.g., witnessing) and indirect (e.g., reading about) PPTE, with varying levels of control. Rhineberger-Dunn et al. (2016) found that secondary trauma was more likely to be reported by probation/parole officers in comparison with residential officers in the United States (see also: Rhineberger-Dunn & Mack, 2019). The coupling of persistent uncertainty with threat potential increases the risk of mental health disorders (Carleton, 2016).
In this study, we recognize the negative effects of workplace violence (Baines et al., 2011), bullying and harassment (Mayhew & Chappell, 2007), work-related stress (Bourbonnais et al., 2007; Mayhew & Chappell, 2007), and nonstandard (e.g., shift work) and precarious employment—all informing uncertainty—on the physical and mental health of correctional workers. With this in mind, we investigate the relationship between uncertainty and mental disorder symptoms for correctional employees working in different occupational roles, either within the prison or within the community, recognizing that improving the mental health of correctional workers is central to improving the well-being of individuals in custody and staff alike. To do so, we rely on data from the Provincial Correctional Worker Mental Health Prevalence Study drawn from a population of all correctional employees working in the province of Ontario, Canada.
Uncertainty Among Correctional Workers
Intolerance for uncertainty (IU) has been identified as an important factor for the development and maintenance of a wide range of mental disorders (Carleton, 2016; Korol et al., 2019). Individuals who experience high levels of IU find ambiguity particularly distressing and are more likely to expect an adverse outcome (Carleton, 2016; Dugas et al., 2001). When exposed to a PPTE, individuals who are increasingly intolerant of uncertainty also appear increasingly prone to maladaptive coping responses, such as denial, disengagement, and negative appraisals, which subsequently increase the risk of mental disorders such as PTSD (Bryant & Guthrie, 2007; Silver et al., 2002). Researchers have also suggested that as exposure to uncertainty increases, tolerance to uncertainty may also increase (Boswell et al., 2013; Carleton, Desgagné, et al., 2019). Research on the role of uncertainty on the mental health of correctional workers remains widely underexplored despite the high levels of uncertainty correctional workers experience. Recently, researchers evidenced public safety personnel (PSP), including correctional employees, appear more tolerant of uncertainty than the community and clinical workers (Angehrn et al., 2020), possibly because of the pervasive experience of uncertainty in their work environment.
Depending on their occupational role, staff have diverse degrees of authority and control perhaps a consequence of the often unpredictable environments within which they work (Byrd et al., 2000; Crawley, 2013; Ricciardelli, 2014; Sykes, 1958). Irregular environments in the community and within prisons can be expected to coincide with high levels of stress. For example, probation officers in community correctional services report high levels of stress from the “inconsistencies and ambiguity connected with the performance of professional duties, as well as stressors connected to supervision activities and inadequate physical working conditions” (Skowroński, 2015, p. 453, emphasis added). Prison work is highly structured and routinized, but it involves extremely unpredictable human behavior, which can cause havoc and compromise the control institutional staff are able to exert over a situation or the population (Ricciardelli, 2014; Ricciardelli & Memarpour, 2016). With this in mind, Byrd and colleagues (2000) found that jail employees “often must work is an environment that is unstable, uncertain, and unsafe” (p. 69). In the United Kingdom, Crawley (2013) noted the insidious and chronic stress correctional officers experience and its gradual onset, with the uncertainty that emerges from the unpredictability of the occupation. Many have argued that individuals in custody are actually in control of penal institutions and the correctional staff that “just steer them” (Rhodes, 2004, p. 76; see also Sykes, 1958). In addition, within the paramilitary command structure, management can leave officers feeling forced to act counterintuitively when obliged to follow the directives mandated by their superior officer despite their assessment of any situation or relationship with those involved (Crichton & Ricciardelli, 2016).
Correctional workers experience considerable uncertainty and ambiguity including a lack of clarity regarding occupational responsibilities, expectations, goals, and worker’s authority (Lambert et al., 2013a, 2013b). Uncertainty regarding correctional occupational duties and roles, coupled with other occupational stressors, may facilitate diverse detrimental outcomes such as burnout, work–family conflict, job dissatisfaction, job stress, lower commitment to the workplace, and lower worker effectiveness (Jiang et al., 2014; Jin et al., 2018; Lambert & Paoline, 2008; Mahfood et al., 2013). Researchers report that uncertainty regarding divisions of labor, as well as funding for correctional services, further contributes to correctional worker’s uncertainty in the workplace (Jin et al., 2018). Uncertainty may arise and vary due to both correctional system (e.g., community vs. state regulated) and position (e.g., upper vs. middle management) which appears particularly distressing for correctional staff (Kras et al., 2017). Conversely, correctional employees who experience a lower degree of uncertainty (e.g., when workers have higher involvement in decision-making, innovation, and supervision) also experience lower stress levels, higher job satisfaction, and greater occupational commitment (Lambert et al., 2009; Lambert & Hogan, 2009). Given the association between uncertainty and mental disorders (Angehrn et al., 2020; Carleton, 2016), uncertainty within occupational positions likely plays a key role in understanding the relationship between correctional work and mental health.
Current Study
In the current study, we unpack the correlates of mental disorders among provincial correctional workers with a specific emphasis on uncertainty and occupational roles. We theorize that certain occupational roles will be associated with higher levels of uncertainty; specifically, the more authority, control, and predictability an employee feels they have in performing their occupational duties, the more certainty they feel. We also theorize that uncertainty will be an important moderating factor in the relationship between occupational roles and respondents’ self-reporting mental disorders. We explore the following research questions:
Method
Correctional Services in Canada
In Canada, individuals remanded into custody or serving sentences of a maximum duration of 2 years less 1 day serve their time in a provincial or territorial correctional facility. Each province and territory has a unique system governed by the provincial or territorial Ministry or Department. In Ontario, Canada, there are 26 provincial correctional facilities (e.g., jails and correctional centers), 100 probation offices and suboffices, 164 reporting centers, 19 court and institutional offices, and corporate offices (V. Gannam, personal communication, September 12, 2019; Ontario Ministry of Community Safety and Corrections, 2010). The Ministry employs approximately 8,000 people as correctional workers (e.g., provincial correctional or parole/probation officers), most of whom are directly or indirectly responsible for the provision of all essential and nonessential services, as well as the safety and security for those in custody, staff, civilians, communities, and correctional facilities.
Data and Sample
We drew data for the current study from the Ontario Provincial Correctional Worker Mental Health Prevalence Study. The survey was administered using Qualtrics from December 8, 2017, until June 30, 2018. 1 Initial study participation emails were sent to all employees within Ontario’s Ministry of the Solicitor General including those working in correctional services—approximately 8,000 people. The emails were sent from two agency representatives associated with (a) Ontario’s Ministry of the Solicitor General and (b) the Ontario Public Service Employees Union. The emails informed potential respondents about the purpose of the survey and invited their participation. The emails with information and the study invitation could be forwarded (and the listservs used had an unknown level of overlap); as such, there was no way to estimate the total persons invited for potential participation or the response rate of participants. Additional details on the Ontario Provincial Correctional Worker Mental Health Prevalence Study have been published elsewhere (Ricciardelli et al., 2020).
The survey required approximately 25 to 40 min to complete and could be completed in sections. A total of 1,487 participants from diverse correctional roles agreed to participate in the study. Only 1,338 of the 1,487 participants could be definitively placed into one of the six occupational categories of interest in this study. There were 845 (63.2%) participants who were categorized and proceeded far enough into the survey to complete the sections on IU and mental disorder symptoms (i.e., data required for the current analyses). No statistically significant differences in sociodemographic covariates were noted between those included or excluded from the current analyses (see Supplemental Table S1, available in the online version of this article); however, community supervision officers appeared more likely to be excluded from the current analyses (i.e., not proceed far enough in survey to complete the sections required for analyses) than participants from other occupational categories (see Supplemental Table S1).
Measures
We used several key independent and dependent variables to examine the aforementioned research questions.
Occupational Categories
Correctional service workers were coded into six mutually exclusive categories: “Institutional Wellness,” referring to nurses, social workers, counselors, and psychologists; “Institutional Training” (i.e., teachers, program officers, chaplains, and coordinator of volunteers who are all persons involved in the coordination and delivery of programming); “Institutional Governance”—which includes superintendents, deputy superintendents, and correctional managers; “Correctional Officers” working in facilities for males or females; “Community Supervision Officers” (i.e., parole and probation officers); and “Institutional Administration” (nonsecurity; e.g., administrative assistants, records officers, and other supports).
Intolerance for Uncertainty
IU was assessed with the Intolerance of Uncertainty Scale–Short Form (IUS-12). The IUS-12 is a 12-item measure designed to assess both prospective IU (e.g., “Unforeseen events upset me greatly”) and inhibitory IU (e.g., “When it’s time to act, uncertainty paralyzes me”). Possible response options ranged from not at all characteristic of me to entirely characteristic of me. Total scores on the IUS-12 can range from 12 to 60. The IUS-12 is a reliable and valid measure of IU with high internal consistency (Cronbach’s α = .96) and evidences a strong correlation with the original scale (r = .96) in both community and clinical samples, and a continuous latent structure (Carleton et al., 2007; McEvoy & Mahoney, 2011).
Mental Disorders
Several reliable and validated self-report screening measures were used to determine current mental disorder symptoms. Both total scores and dichotomous coding (i.e., positive screen vs. negative screen) were computed for each screening measure. PTSD was assessed with the 20-item PTSD Check List 5 (PCL-5; Ashbaugh et al., 2016; Blevins et al., 2015; Bovin et al., 2016; Weathers et al., 2013). Respondents were asked if they had experienced symptoms over the past month with response options from not at all to extremely. Total scores on the PCL-5 can range from 0 to 80, and a positive screen for PTSD was indicated if the participant reported at least one PPTE exposure on the Life Events Checklist for the Diagnostic Manual of Mental Disorders, 5th edition (American Psychiatry Association, 2013; Blevins et al., 2015; Weathers et al., 2013), met minimum criteria on each PTSD symptom cluster (APA), and had a total score >32 on the PCL-5 (Weathers et al., 2013). MDD symptoms were assessed with the 9-item Patient Health Questionnaire (PHQ-9) based on a past 14-day timeframe (Beard et al., 2016; Kroenke et al., 2001, 2010; Löwe et al., 2004). Possible response options ranged from not at all to every day. Total scores on the PHQ-9 can range from 0 to 21, and a positive screen for MDD was indicated by a total score >9 on the PHQ-9 (Manea et al., 2015). Generalized anxiety symptoms were assessed with the 7-item GAD scale (GAD-7) based on the past 14-day timeframe (Beard & Björgvinsson, 2014; Kroenke et al., 2010; Spitzer et al., 2006). Total scores on the GAD-7 can range from 0 to 21, and a positive screen for generalized anxiety was indicated by a total score >9 on the GAD-7 (Swinson, 2006). Possible response options ranged from never to nearly every day. PD symptoms were assessed with the 7-item Panic Disorder Symptoms Severity Scale–Self-Report (PDSS-SR) based on a past 7-day timeframe (Furukawa et al., 2009; Houck et al., 2002; Shear et al., 1997, 2001). Possible response options ranged from not at all distressing to extremely distressing. Total scores on the PDSS-SR can range from 0 to 28, and a positive screen for PD was indicated by a total score >9 on the PDSS-SR (Shear et al., 1997). Problematic alcohol use was assessed with the 10-item Alcohol Use Disorders Identification Test (AUDIT) based on a past 12-month timeframe (Gache et al., 2005; Saunders et al., 1993). Total scores on the AUDIT can range from 0 to 40, and a positive screen for AUD was indicated by a total score >15 on the AUDIT (Gache et al., 2005). Possible response options ranged from never to almost daily.
We used the aforementioned mental disorder variables to measure the prevalence of specific mental disorders; however, a cumulative variable was also created. Any positive mental disorder screen variable (1 = yes; 0 = no) was computed based on whether or not the participant had a positive screen on one or more screening measures and/or self-reported mental disorders. Participants were also asked about self-report diagnostics for several other mental disorders including persistent depressive disorder, bipolar I, bipolar II, cyclothymic disorder, other mood disorders, social anxiety disorder, obsessive-compulsive disorder, and other anxiety disorders. Self-reported mental disorders were based on a lifetime (i.e., “ever been diagnosed”) timeframe. The low prevalence of the self-reported diagnoses (6.5%) made assessing relationships with IU scores impractical; as such, self-reported diagnoses were only included in any positive mental disorder screen variable.
Several variables were included in our models as controls. Sociodemographic covariates included a dichotomous indicator of sex (0 = female, 1 = male) and a categorical variable for the age group with the following groups: 20 to 29 years, 30 to 30 years, 40 to 49 years, 50 to 59 years, and 60 years and older. A categorical variable for marital status included the following married/common-law, single, separated/divorced/widowed, and remarried. We also accounted for work location using a dichotomous measure (0 = urban; 1 = rural) and education categorically (i.e., high school or less, some postsecondary less than a 4-year college/university program, and completed 4-year college/university degree or higher). Years of service was used to measure the total years of correction services work, and that variable was coded into the following categories: less than 4 years, 4 to 9 years, 10 to 15 years, more than 15 years.
Statistical Analyses
We begin our analyses by first presenting descriptive statistics for all variables. To assess Research Questions 1 and 2, mean mental disorders scores and mean IUS-12 scores are presented across occupational roles. The F statistic from a one-way analysis of variance model with Bonferroni corrections was used to test for differences in mean mental health disorder scores and mean IUS-12 scores across occupational roles. Then Pearson’s r correlation coefficients were examined between mental disorder and IUS-12 scores by occupational category. Finally, a series of multiple linear regression models were run to examine Research Question 3 and assess the relationship between IU and occupational roles (independent variables) and mental disorder symptom scores (dependent variable). All linear regression models adjusted for sociodemographic covariates (i.e., sex, age group, marital status, education, urban vs. rural work location, total years of service, and occupational category). In Model 1, IU was entered into the model (along with sociodemographic covariates). In Model 2, occupational categories were entered into the model (along with IU and sociodemographic covariates). In Model 3, an IUS-12 by occupational category interaction term was entered into the adjusted linear regression model to examine whether the relationship between occupational roles and mental health disorder symptoms was moderated by IU.
Results
The distribution of sociodemographic covariates is provided in Table 1. The sample was evenly distributed by sex, most participants were currently married, working in an urban location, had postsecondary education, and had less than 4 years or more than 15 years of service. Most participants were correctional officers. A substantial proportion of the sample met the criteria for a positive MDD, GAD, and/or PTSD screen. Fewer participants screened positive for PD and problematic alcohol use. In total, 55.8% of the sample screened positive for one or more of the mental disorders we assessed.
Descriptive Statistics in a Sample Correctional Workers in Ontario, Canada (N = 845)
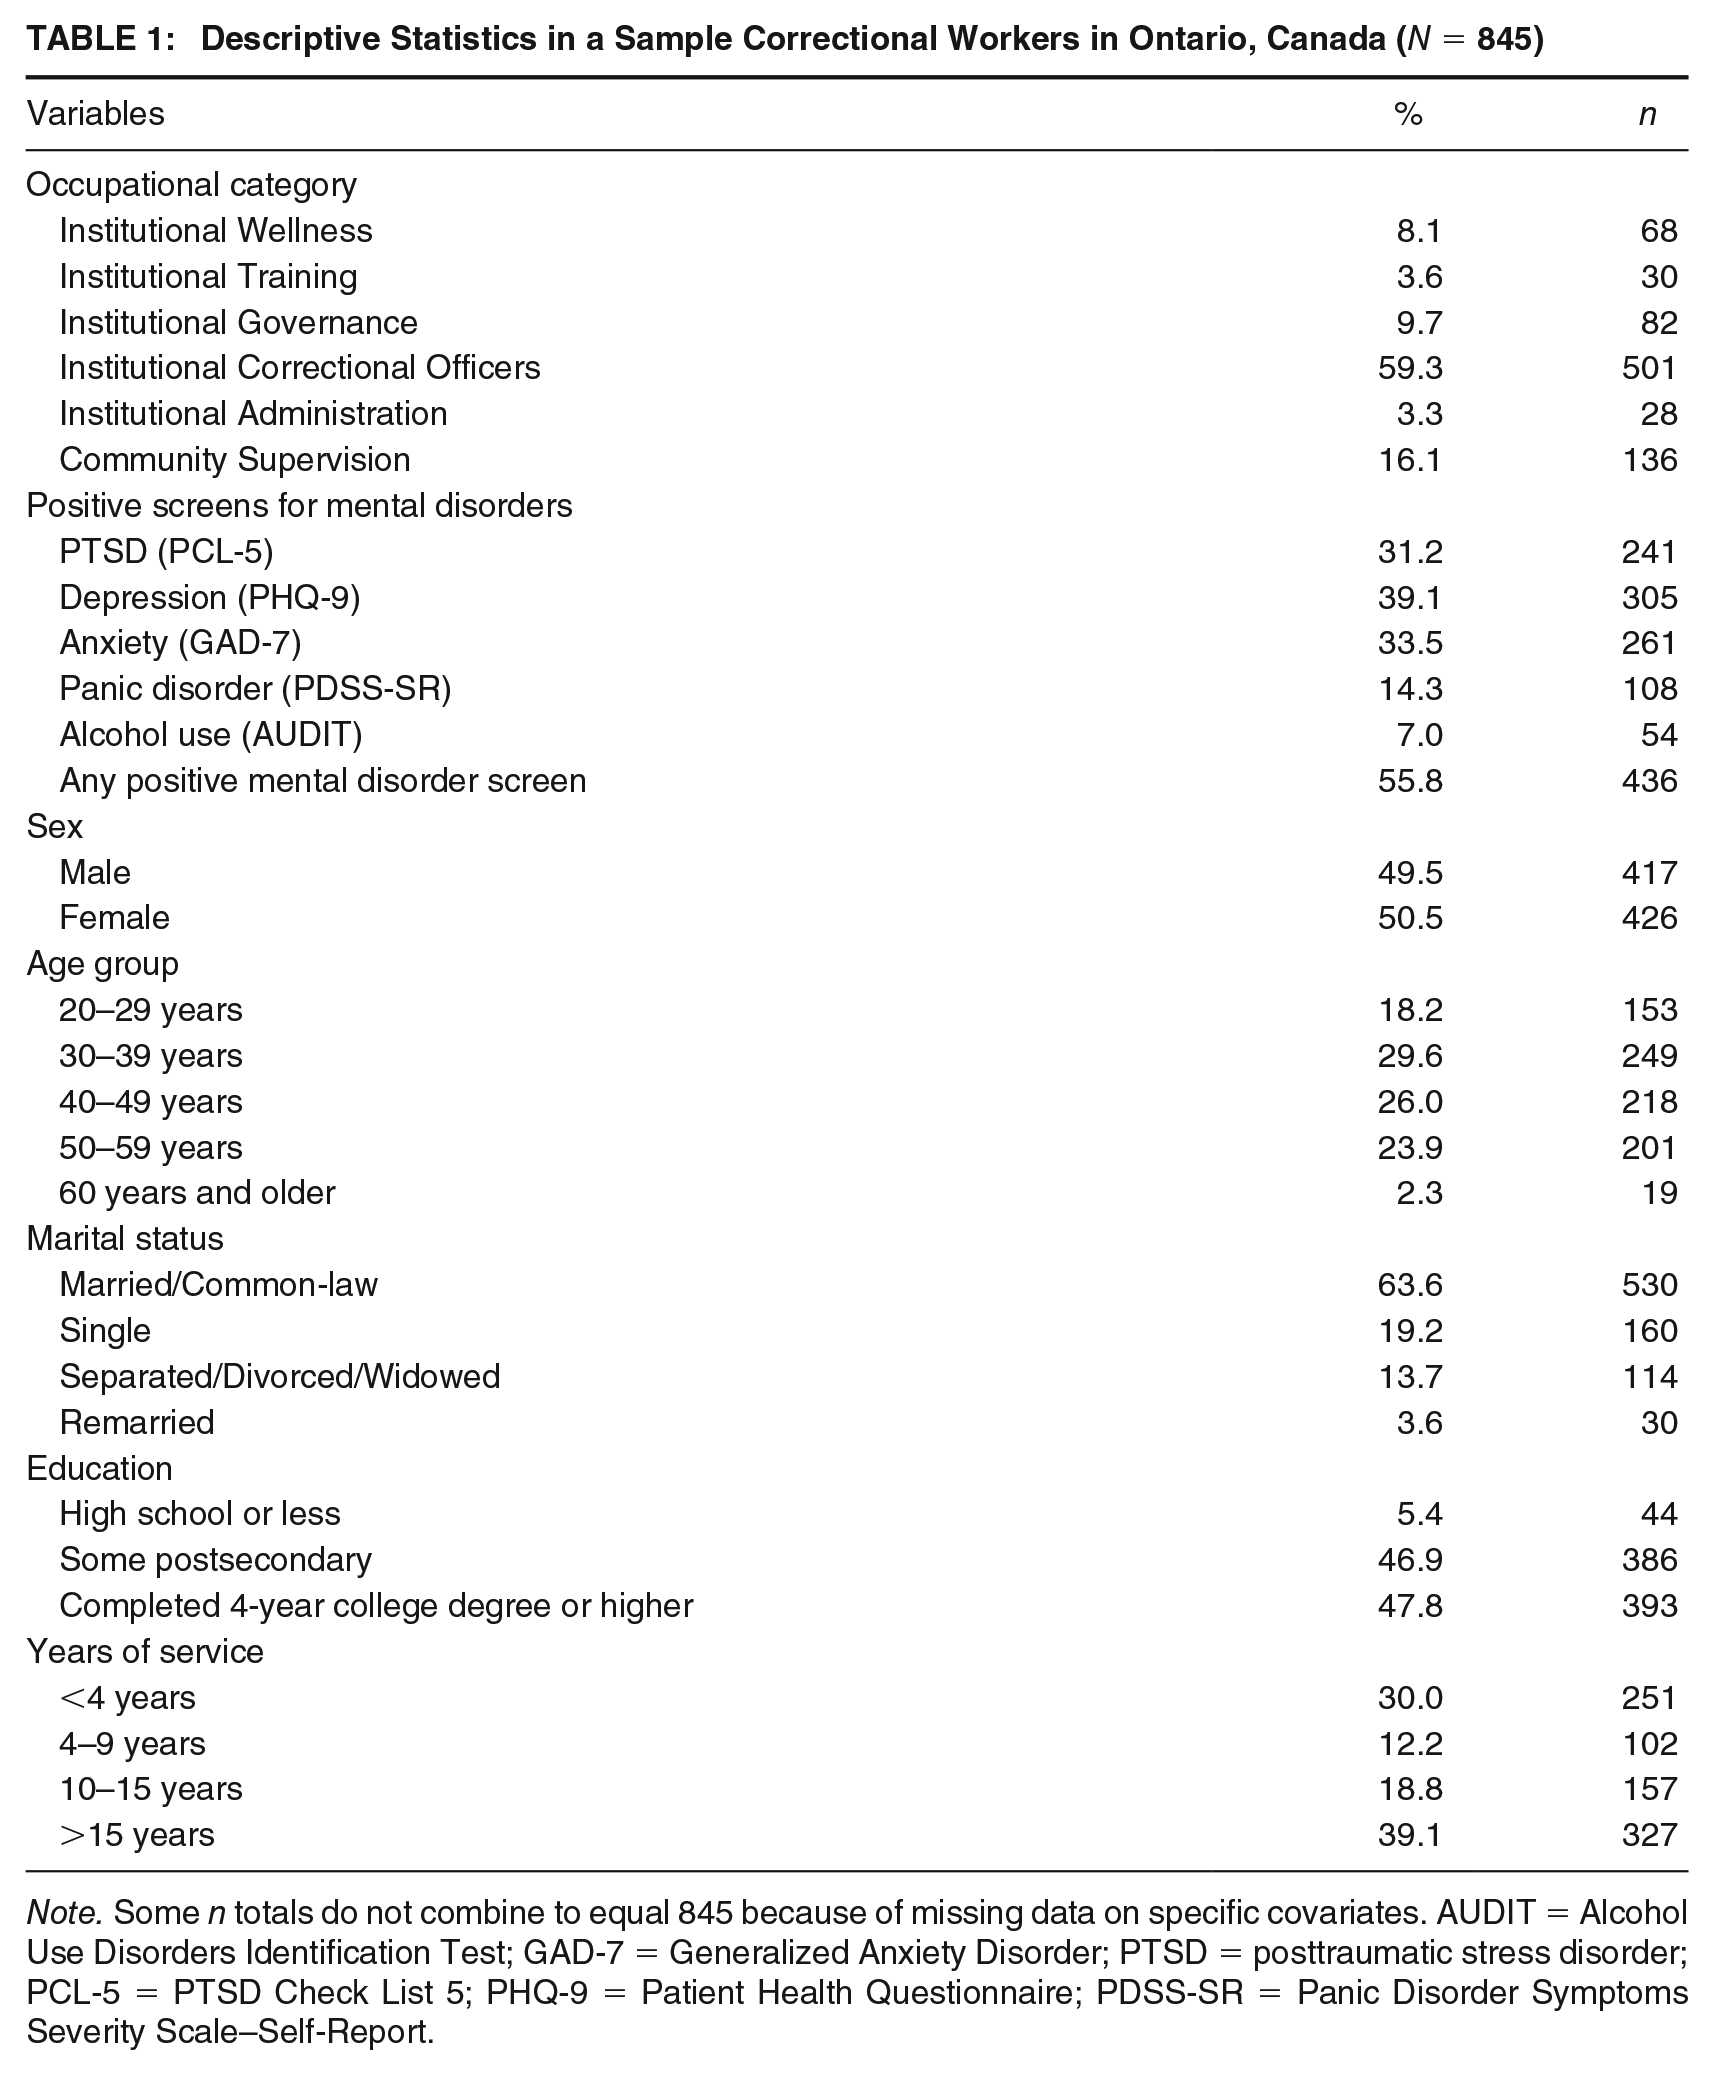
Note. Some n totals do not combine to equal 845 because of missing data on specific covariates. AUDIT = Alcohol Use Disorders Identification Test; GAD-7 = Generalized Anxiety Disorder; PTSD = posttraumatic stress disorder; PCL-5 = PTSD Check List 5; PHQ-9 = Patient Health Questionnaire; PDSS-SR = Panic Disorder Symptoms Severity Scale–Self-Report.
Addressing Research Questions 1 and 2, the mean scores for mental disorder symptom measures and the frequency of positive mental disorder screens are provided in Table 2 along with IU mean scores. Differences between occupational categories are indicated by different superscripts in Table 2. For the first research question, participants working in Institutional Governance had higher mean PTSD symptom scores than participants working in Institutional Wellness. Participants working in institutional correctional services had higher problematic alcohol use scores than participants working in Institutional Wellness, Institutional Administration, and Community Supervision Officers. Participants working in Institutional Governance had higher problematic alcohol use scores than those working in Institutional Wellness. No other statistically significant differences in mean mental disorder symptom scores were noted. With regard to differences in screening positive for one or more mental disorders, the Institutional Wellness category had a lower prevalence of screening positive for one or more mental disorders than Institutional Governance, Institutional Correctional Officers, and Community Supervision Officers categories. Similar analyses are used to examine Research Question 2, which shows that IUS-12 scores did not vary across occupational categories.
Mean Scores on IU and Mental Disorder Symptom Measures and Frequency of Positive Mental Disorder Screens
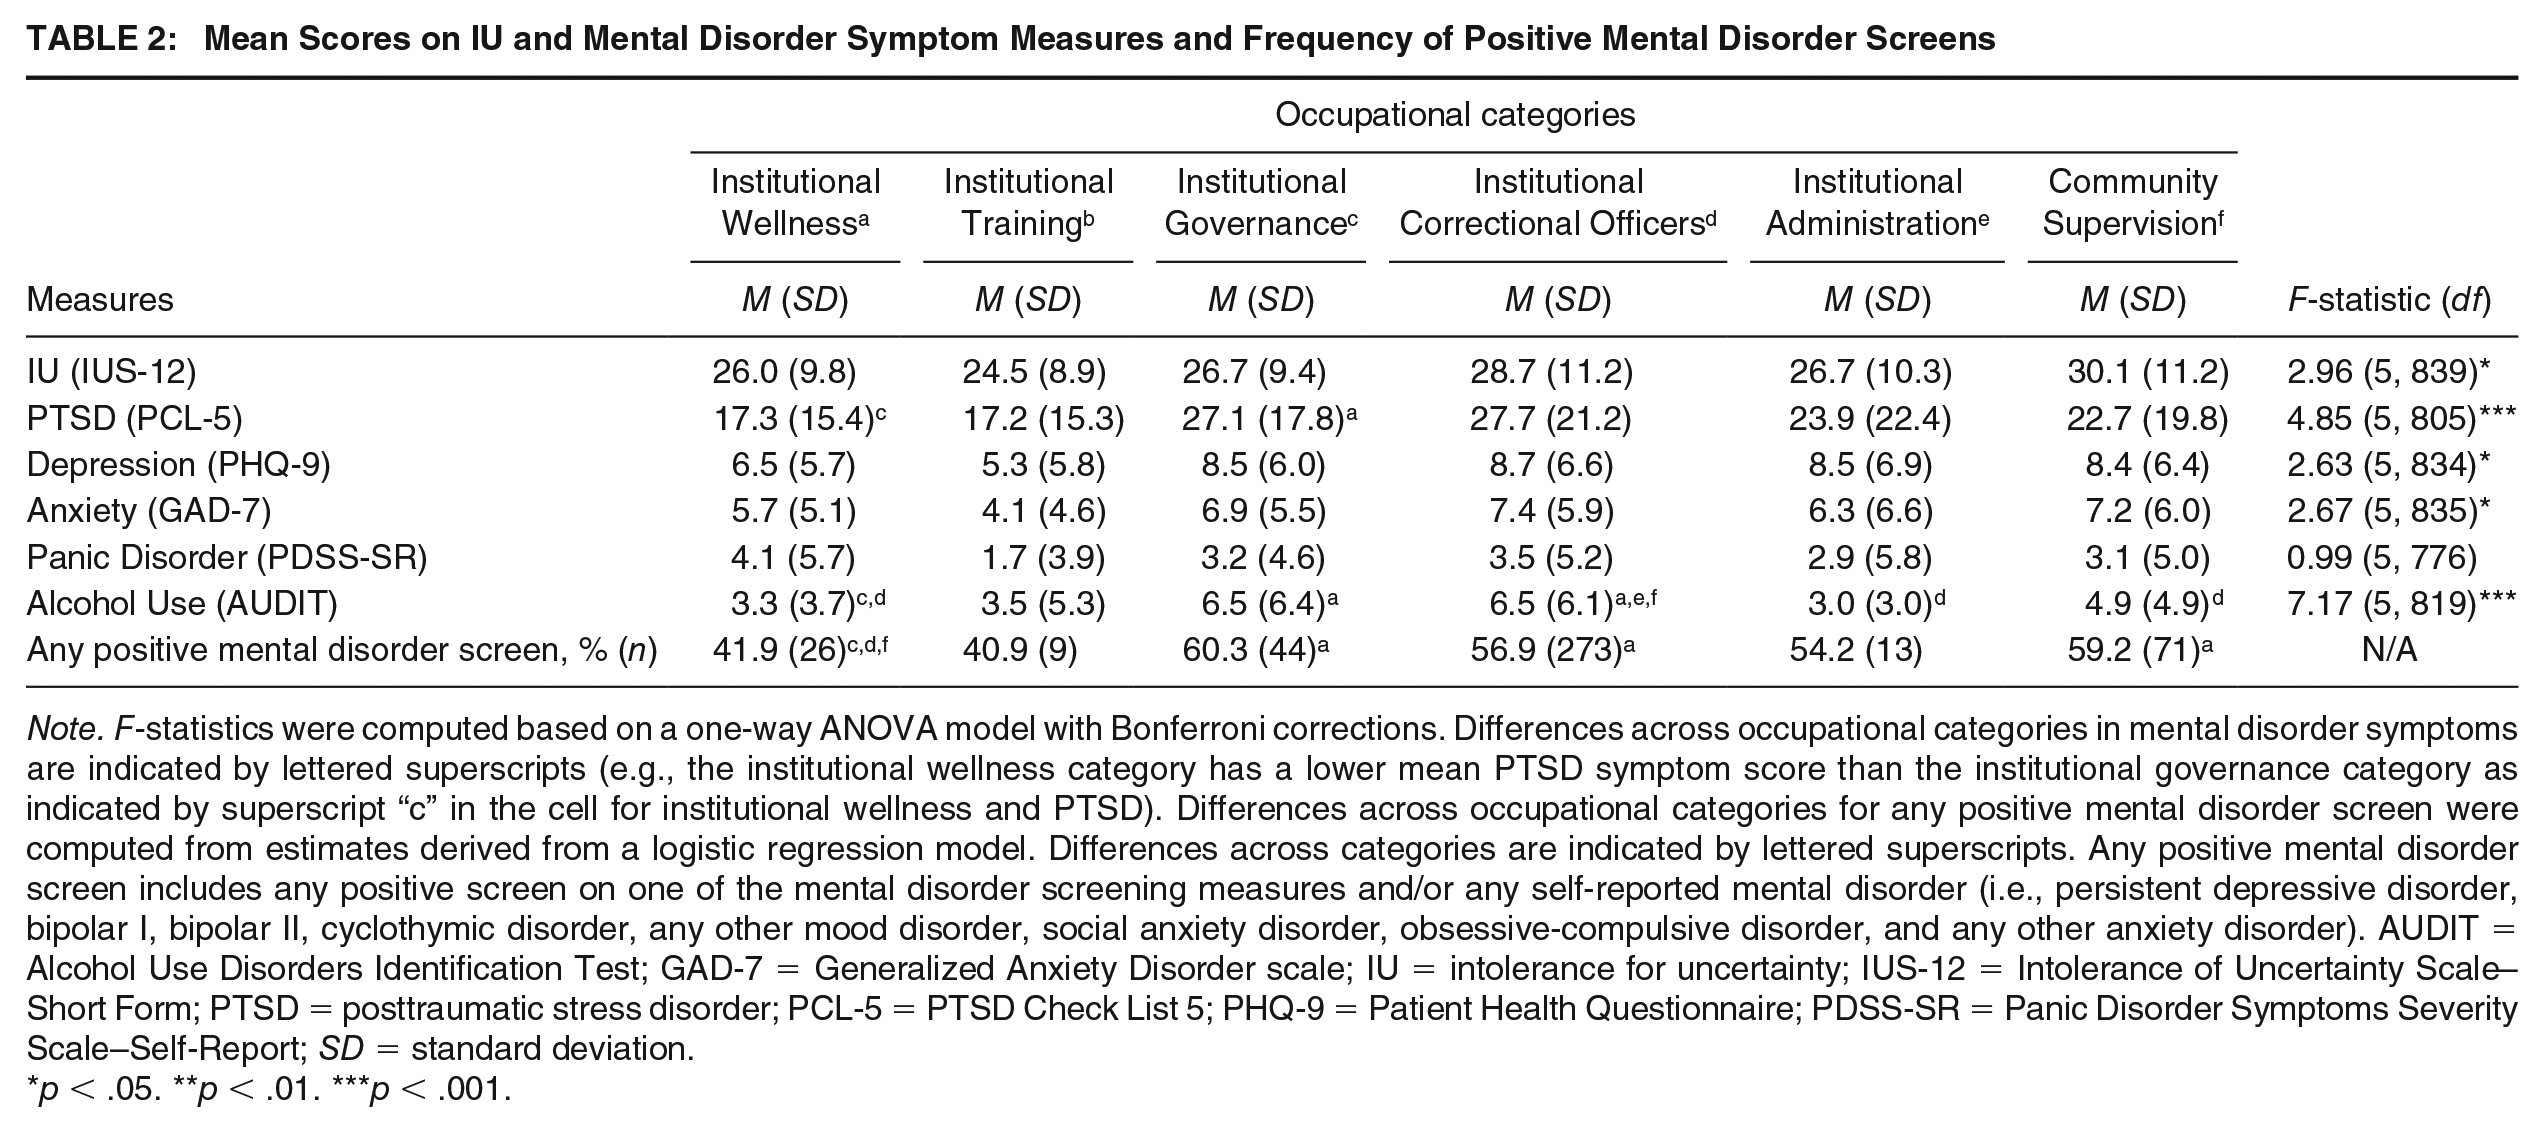
Note. F-statistics were computed based on a one-way ANOVA model with Bonferroni corrections. Differences across occupational categories in mental disorder symptoms are indicated by lettered superscripts (e.g., the institutional wellness category has a lower mean PTSD symptom score than the institutional governance category as indicated by superscript “c” in the cell for institutional wellness and PTSD). Differences across occupational categories for any positive mental disorder screen were computed from estimates derived from a logistic regression model. Differences across categories are indicated by lettered superscripts. Any positive mental disorder screen includes any positive screen on one of the mental disorder screening measures and/or any self-reported mental disorder (i.e., persistent depressive disorder, bipolar I, bipolar II, cyclothymic disorder, any other mood disorder, social anxiety disorder, obsessive-compulsive disorder, and any other anxiety disorder). AUDIT = Alcohol Use Disorders Identification Test; GAD-7 = Generalized Anxiety Disorder scale; IU = intolerance for uncertainty; IUS-12 = Intolerance of Uncertainty Scale–Short Form; PTSD = posttraumatic stress disorder; PCL-5 = PTSD Check List 5; PHQ-9 = Patient Health Questionnaire; PDSS-SR = Panic Disorder Symptoms Severity Scale–Self-Report; SD = standard deviation.
p < .05. **p < .01. ***p < .001.
To examine any moderation effects (Research Question 3), first the correlations between mental disorder and IUS-12 scores in the total sample and by occupational category are provided in Table 3. As shown, relatively strong associations were found for the relationship between PTSD and IU. Relatively strong associations were found for generalized anxiety and IU. Moderate to strong associations were reported for the relationship between depression symptoms and IU and PD symptoms and IU. Less consistent associations were found for the relationship between AUDIT and IUS-12 scores; specifically, there were statistically significant correlations (albeit relatively small) between alcohol use and IU for participating correctional officers and community supervision officers.
Correlation Between Mental Disorder Symptoms and IU by Occupational Category
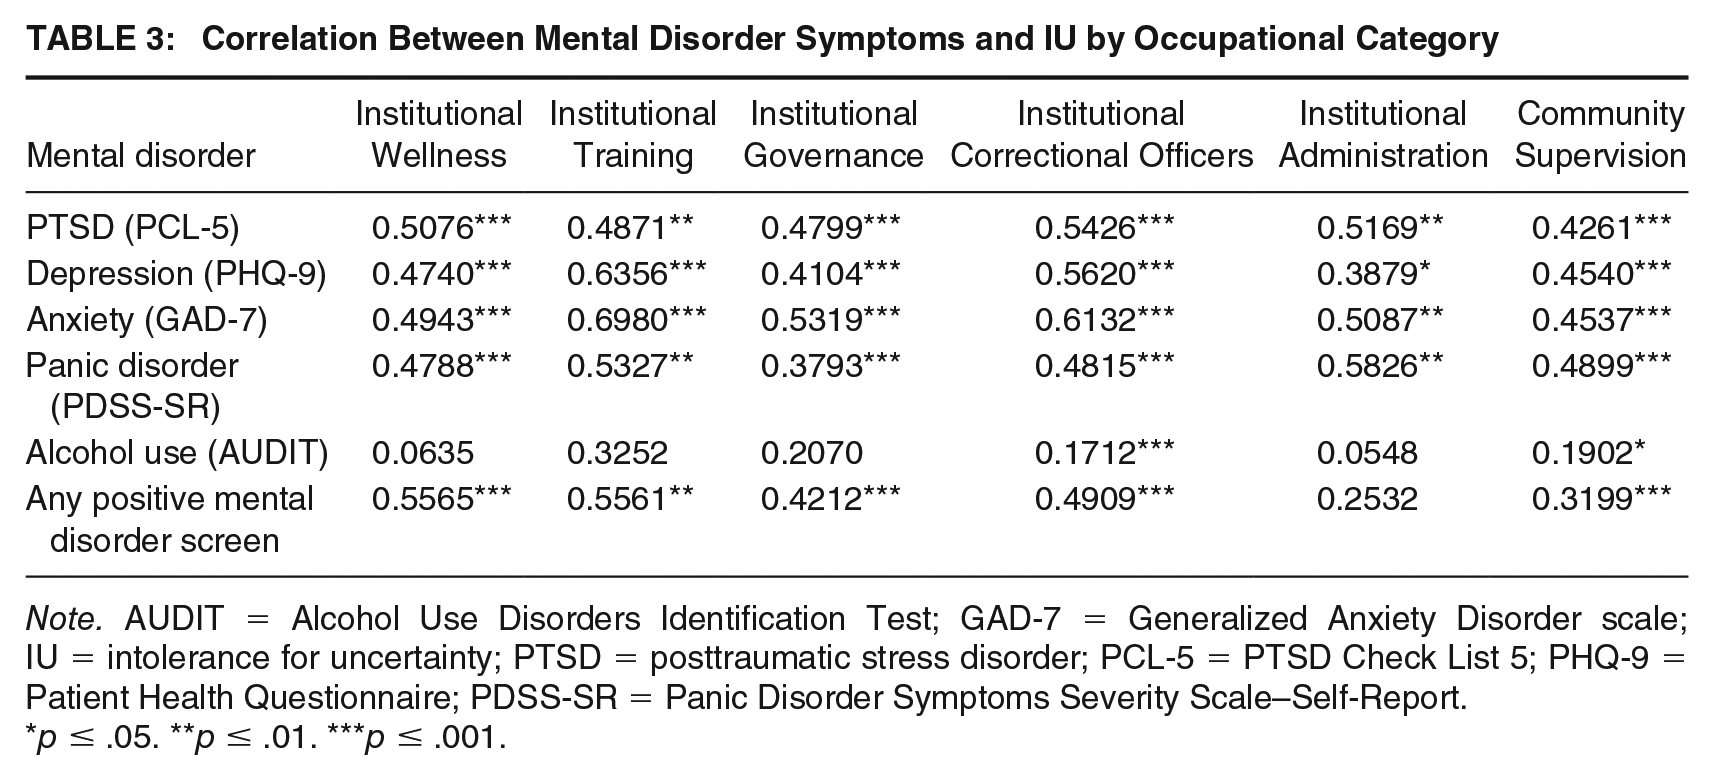
Note. AUDIT = Alcohol Use Disorders Identification Test; GAD-7 = Generalized Anxiety Disorder scale; IU = intolerance for uncertainty; PTSD = posttraumatic stress disorder; PCL-5 = PTSD Check List 5; PHQ-9 = Patient Health Questionnaire; PDSS-SR = Panic Disorder Symptoms Severity Scale–Self-Report.
p ≤ .05. **p ≤ .01. ***p ≤ .001.
Results from the linear regression models are provided in Tables 4 through 6. IUS-12 scores were associated with increases in mental disorder symptoms scores in both models adjusting for sociodemographic covariates (Model 1) and after further adjustment for occupational categories (Model 2) across all mental disorders. In particular, IU and sociodemographic covariates accounted for substantial variance in PTSD, depression, generalized anxiety, and panic disorder symptom scores (see Model 1 in Tables 4–6). IUS-12 scores were also associated with an increase in alcohol use scores, after adjusting for sociodemographic covariates, but less of the variance in AUDIT scores was attributable to IUS-12 scores and sociodemographic covariates in these models (see Model 1 in Table 6). The inclusion of occupational category in Model 2 did not substantially increase the amount of variance explained across the different mental disorder outcomes. None of the IUS-12 scores by occupational category interaction terms were significant in Model 3, suggesting that IUS-12 scores did not moderate the relationship between occupational category and mental disorder symptoms in our sample of Ontario correctional workers.
Multiple Linear Regression Results for Variance Accounted for in Mental Disorder Symptoms by IU and Occupational Categories
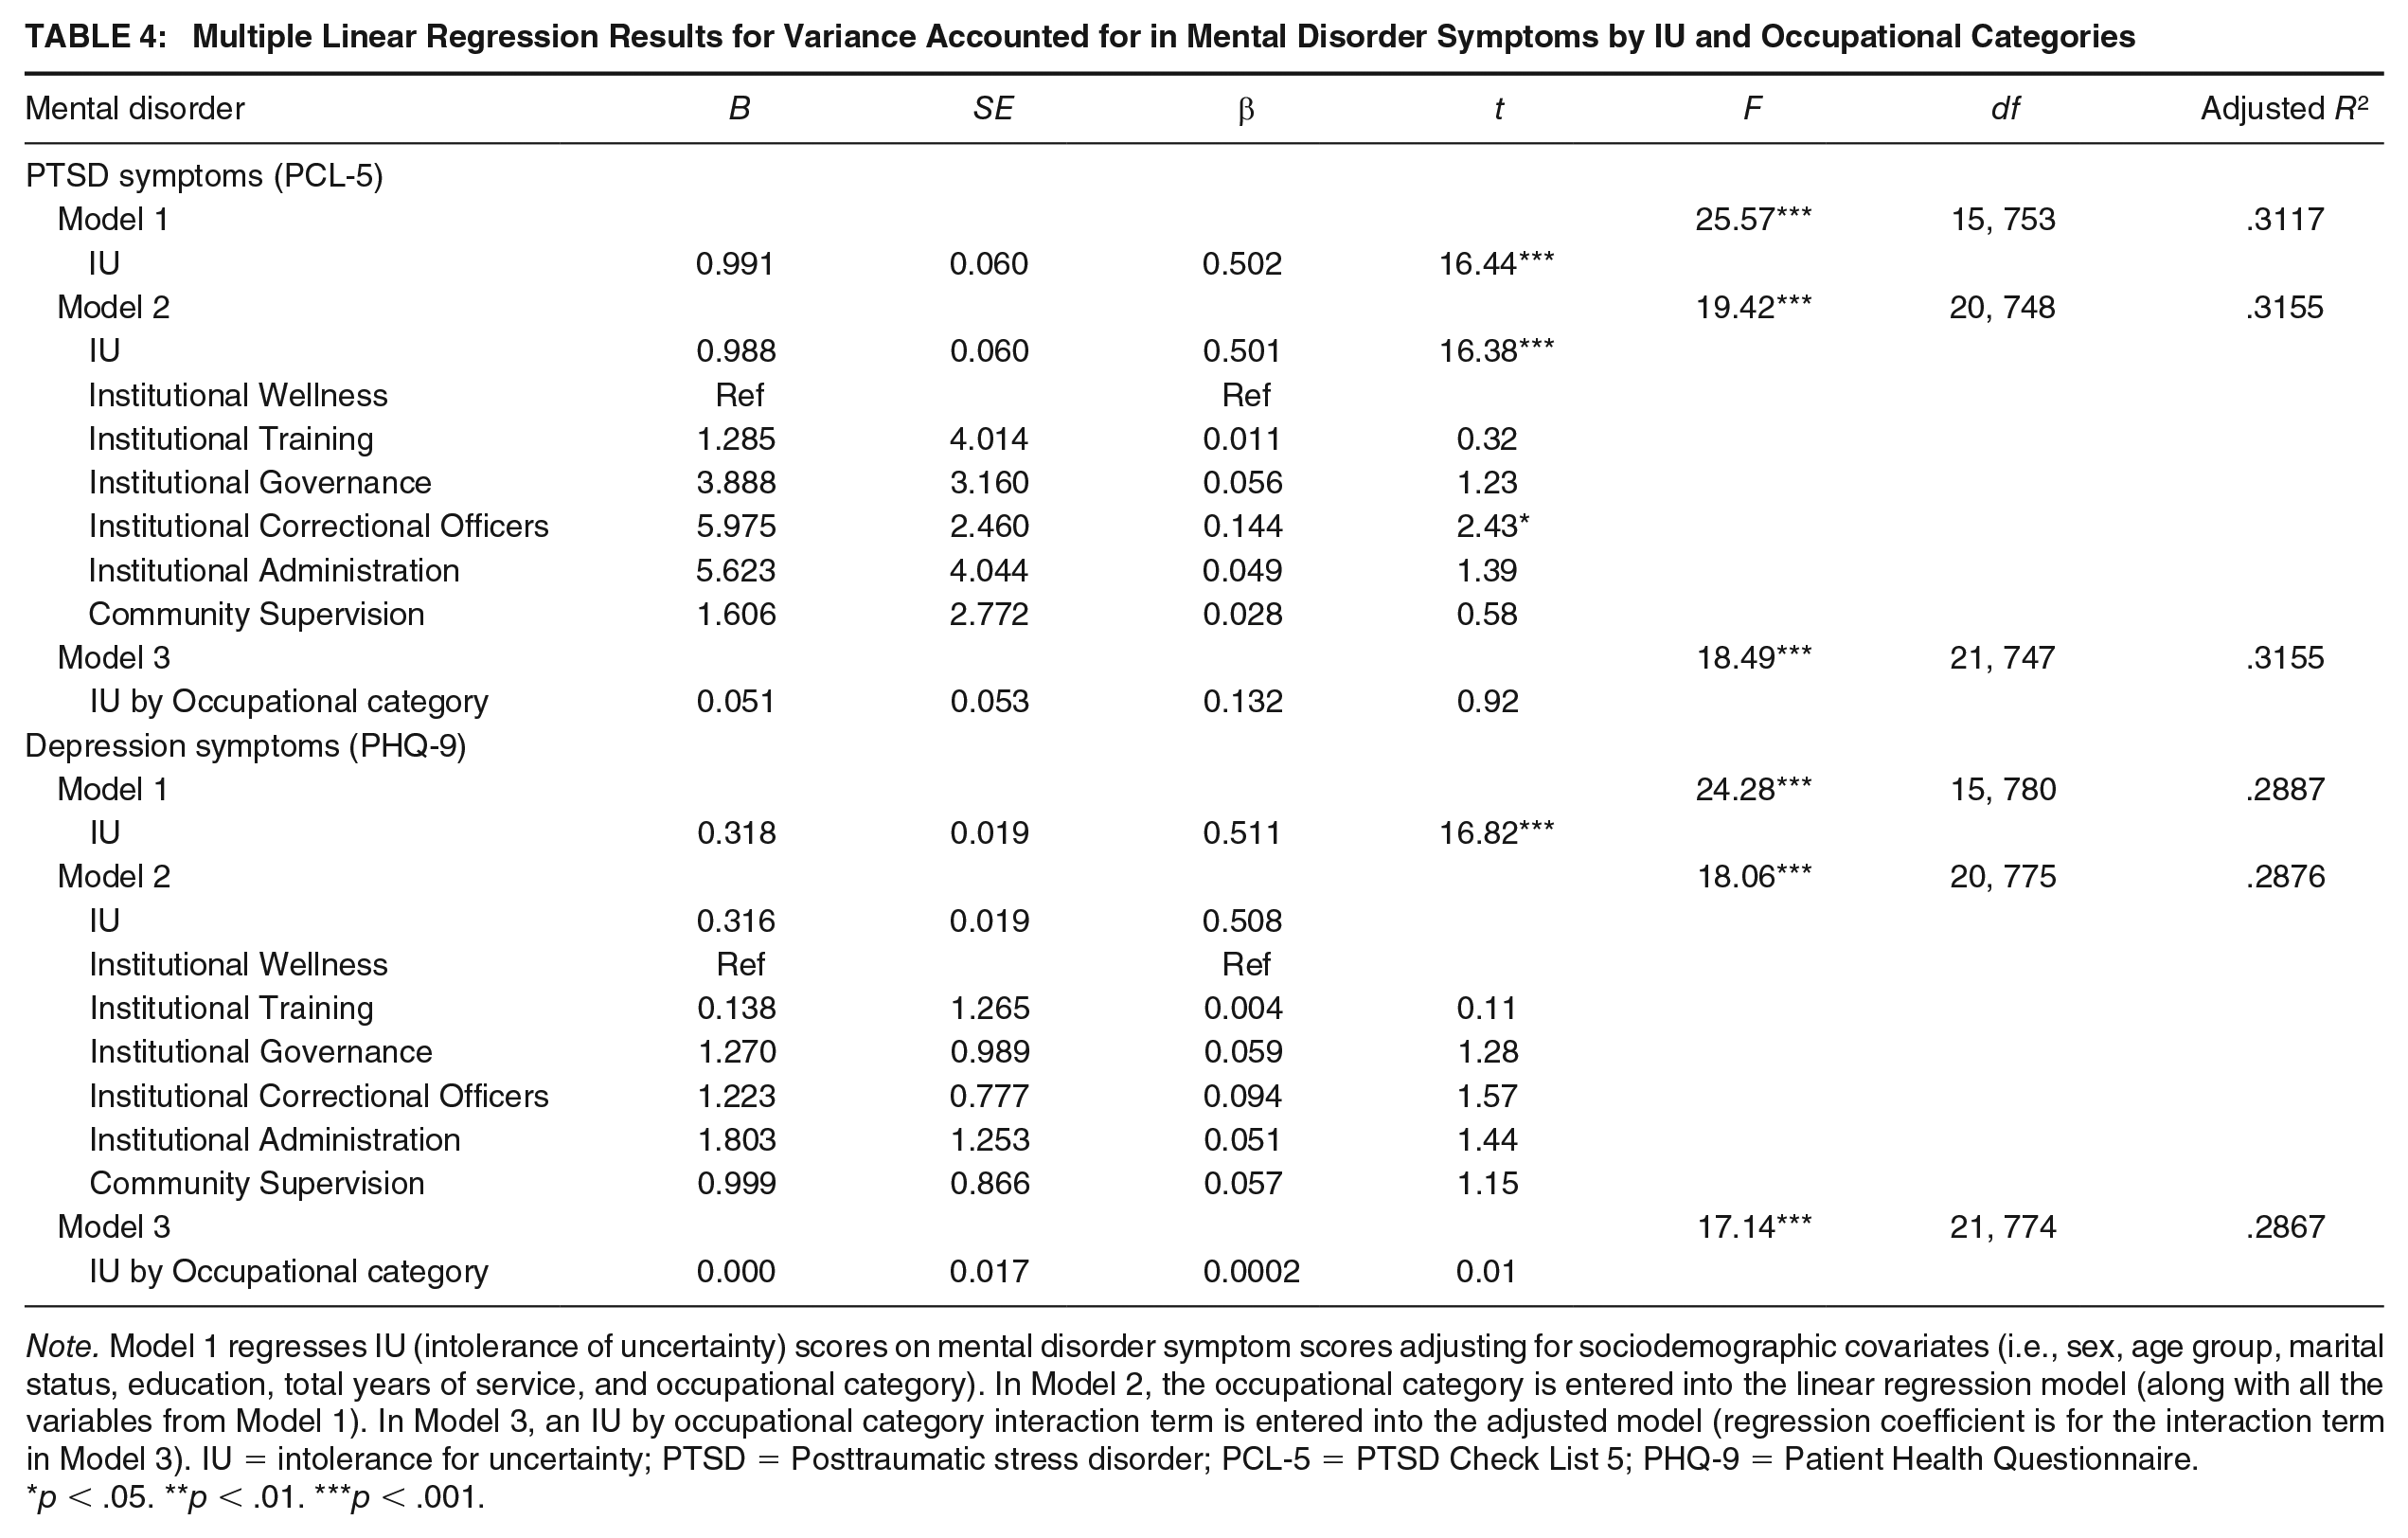
Note. Model 1 regresses IU (intolerance of uncertainty) scores on mental disorder symptom scores adjusting for sociodemographic covariates (i.e., sex, age group, marital status, education, total years of service, and occupational category). In Model 2, the occupational category is entered into the linear regression model (along with all the variables from Model 1). In Model 3, an IU by occupational category interaction term is entered into the adjusted model (regression coefficient is for the interaction term in Model 3). IU = intolerance for uncertainty; PTSD = Posttraumatic stress disorder; PCL-5 = PTSD Check List 5; PHQ-9 = Patient Health Questionnaire.
p < .05. **p < .01. ***p < .001.
Multiple Linear Regression Results for Variance Accounted for in Mental Disorder Symptoms by IU and Occupational Categories
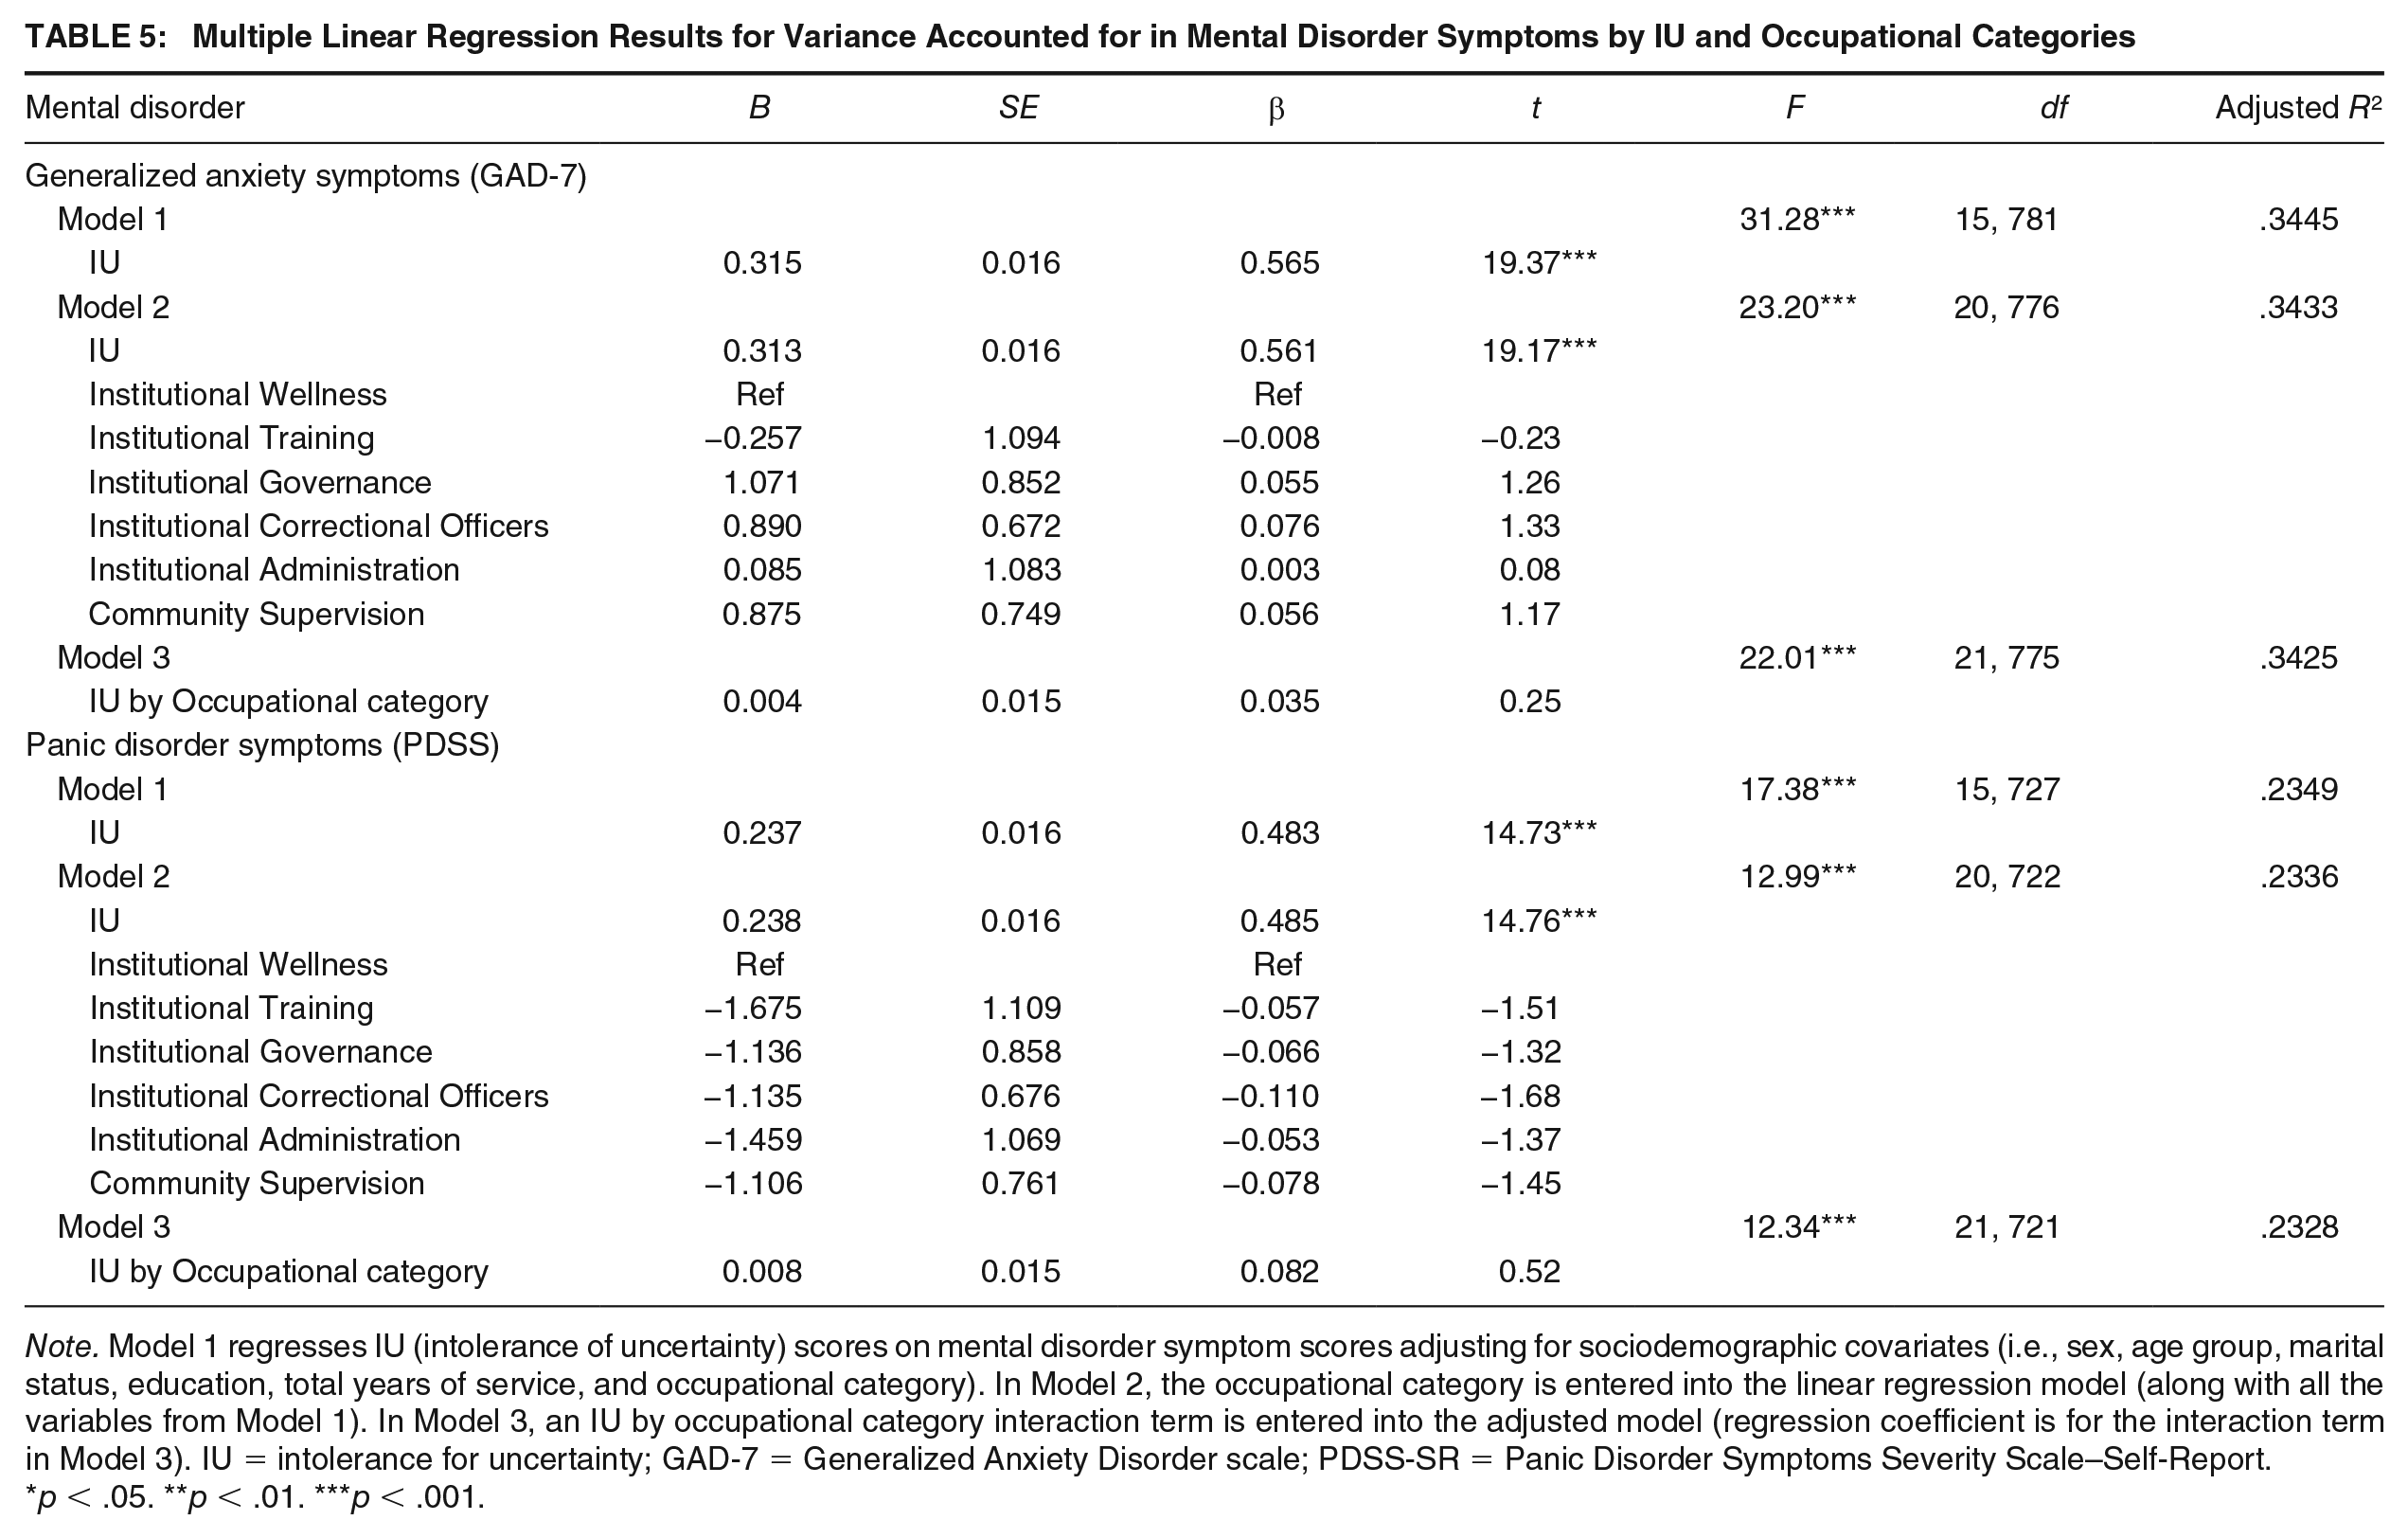
Note. Model 1 regresses IU (intolerance of uncertainty) scores on mental disorder symptom scores adjusting for sociodemographic covariates (i.e., sex, age group, marital status, education, total years of service, and occupational category). In Model 2, the occupational category is entered into the linear regression model (along with all the variables from Model 1). In Model 3, an IU by occupational category interaction term is entered into the adjusted model (regression coefficient is for the interaction term in Model 3). IU = intolerance for uncertainty; GAD-7 = Generalized Anxiety Disorder scale; PDSS-SR = Panic Disorder Symptoms Severity Scale–Self-Report.
p < .05. **p < .01. ***p < .001.
Multiple Linear Regression Results for Variance Accounted for in Mental Disorder Symptoms by IU and Occupational Categories
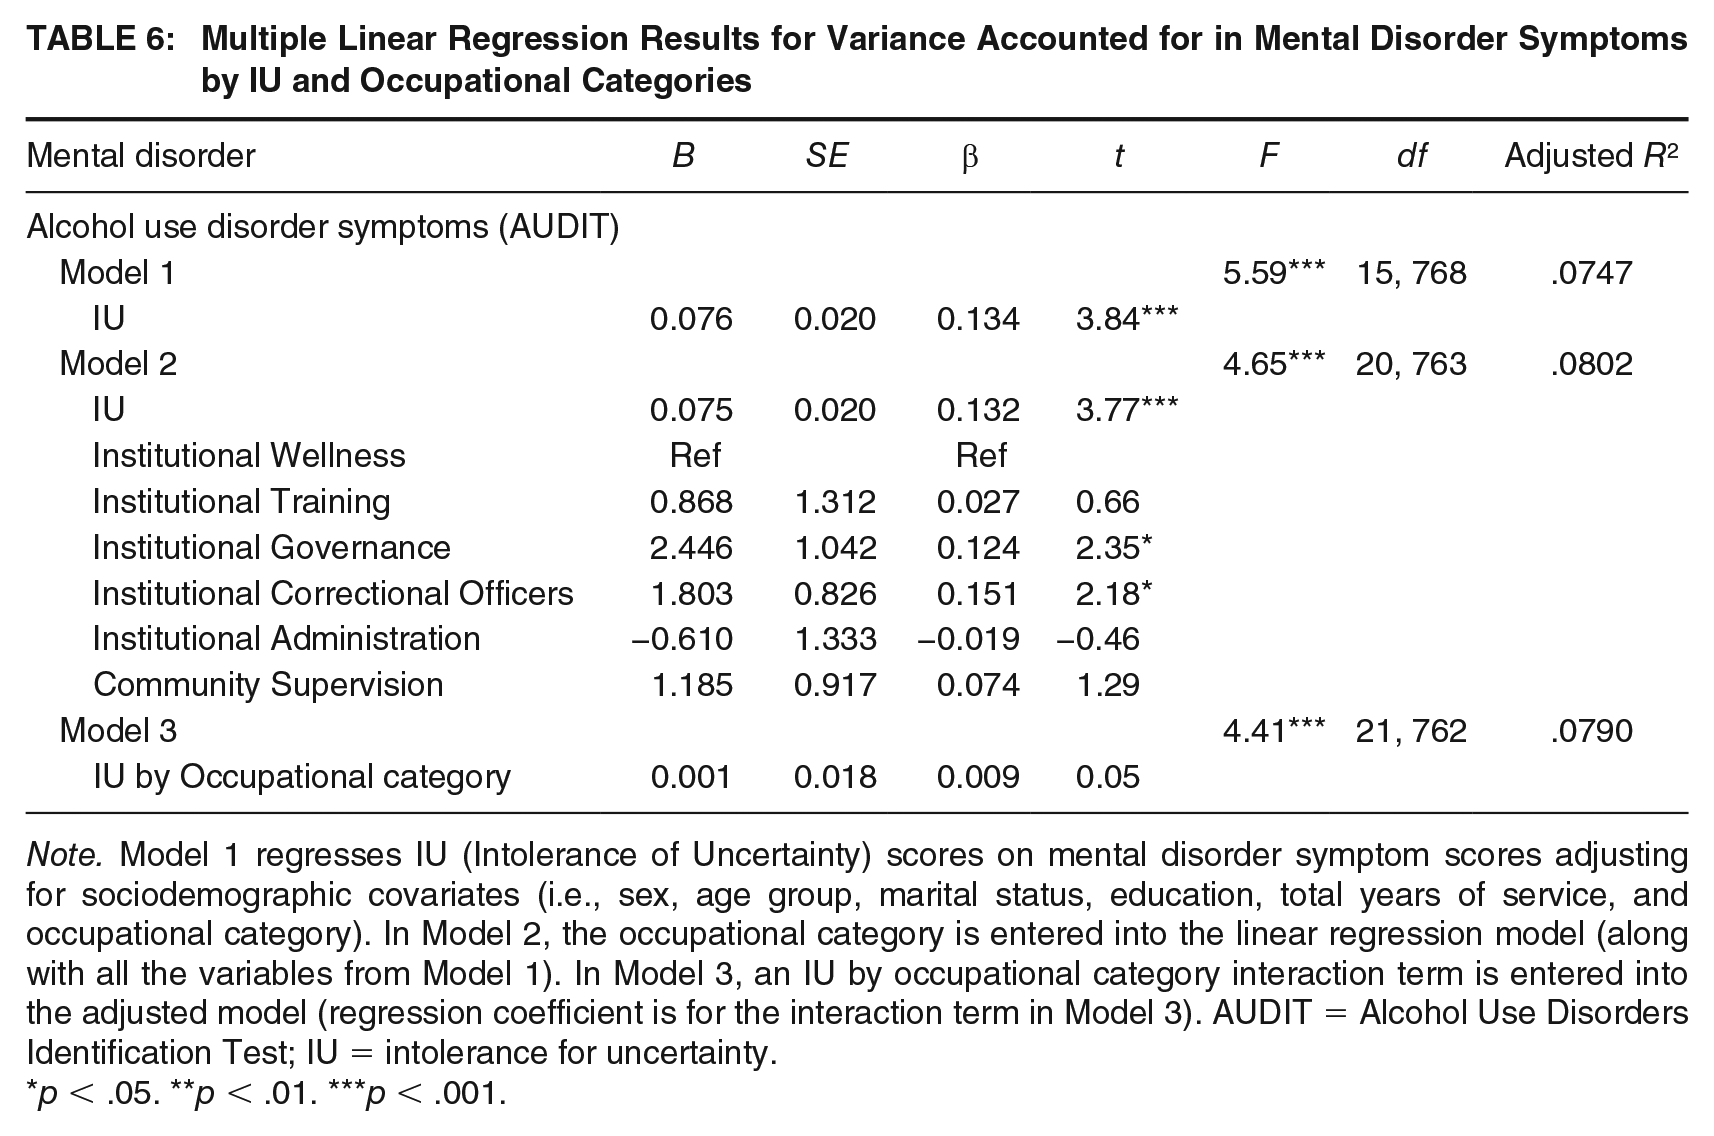
Note. Model 1 regresses IU (Intolerance of Uncertainty) scores on mental disorder symptom scores adjusting for sociodemographic covariates (i.e., sex, age group, marital status, education, total years of service, and occupational category). In Model 2, the occupational category is entered into the linear regression model (along with all the variables from Model 1). In Model 3, an IU by occupational category interaction term is entered into the adjusted model (regression coefficient is for the interaction term in Model 3). AUDIT = Alcohol Use Disorders Identification Test; IU = intolerance for uncertainty.
p < .05. **p < .01. ***p < .001.
Discussion
The mental health and well-being of correctional workers are a growing area of inquiry, given the well-being of staff directly impacts the well-being and living environments of people who are incarcerated (Ricciardelli, 2019). Findings from this research result in three important points of discussion. First, mental disorders are exceptionally high among correctional workers. Consistent with prior research results, more than half of our sample of correctional workers screened positive for at least one mental disorder. These findings reinstate the need to provide psychological supports for the mental health and well-being of persons working in correctional services, albeit in the community or institutions. Programs and policies are a starting point; however, officers report that even with those services, they are not likely to use them as interventions (Ricciardelli et al., 2021; Foley et al., 2021). Thus, substantial revisions to policies, programs, and supports need to happen to ensure that correctional workers are aware of how their work environment affects their mental health and then are open and feel supported to seek help regarding their needs.
Second, the prevalence of mental health disorders varies by occupational category although IU is not responsible for this variation. We did not find significant differences in self-reported IU across occupational categories, although persons working in Institutional Governance, specifically correctional workers who oversee the functioning of the institutions, reported significantly higher mean PTSD symptom scores than those in positions of Institutional Wellness. IU was not responsible for these variations, which suggests that other factors may influence these outcomes. Researchers have only begun to examine what correlates account for the overrepresentation of mental disorders among the correctional worker population. Prison conditions, exposure to PPTE, and occupational stress injuries are all identified contributors to this disparity in well-being (Sapers, 2013; Zarate, 2010). Other explanations may also account for this disparity—those being educated and cumulative trauma. Potentially, employees in Institutional Wellness may be well versed in mental health and mental health needs, which may explain their lower prevalence of PTSD. Given these findings, employers need to ensure that all workers, regardless of occupational category, are educated on mental health needs, ideally to the same extent as wellness workers. Ensuring the same level of training for all occupational categories could help to alleviate the disparity seen between groups.
Persons in Institutional Governance may have previous experience as frontline correctional workers prior to being promoted into their current positions (e.g., the Superintendent, or the correctional manager). Thus, prior frontline experiences may be impacting the mental health of persons in Institutional Governance, which may partially explain the significantly higher problematic alcohol use scores among the subpopulation along with higher levels of PTSD. These findings shed light on the cumulative trauma that correctional workers face throughout their career and highlight the need for therapeutic interventions to combat those PPTE exposures. Given most correctional workers do not seek mental help when services are provided, exploring required counseling, therapy, or program involvement for workers throughout their career may alleviate some of the cumulative strain they face throughout their tenure. Given problematic alcohol use was reported more frequently among participants working in institutions, it is evident that more can be done to support prosocial coping skills for this population, one in need of supports to process their mental health challenges.
Third, IU strongly influences mental health outcomes but does so equally across occupational categories. Intolerance to uncertainty and sociodemographic covariates explained variance in positive screens for PTSD, MDD, GAD, and PD. Thus, IU appears to be a predictor for all mental disorders—although more strongly for PTSD, MDD, GAD, and PD but less strongly related to AUD, although still significant. Correctional work is filled with uncertain situations and circumstances. Our study reveals that this uncertainty has negative implications on mental health. Thus, regardless of which occupational category a correctional worker holds, there is a need to target interventions to help overcome the impact of uncertainty on well-being.
The problem remains that correctional work can be mundane, repetitive, and even boring, yet it can also be unpredictable, violent, and trying; accordingly, navigating uncertainty may be inherent to the correctional workers, and reducing uncertainty appears largely impossible beyond the largely routinized strategies that direct institutional living and thus working. Although uncertainty may be unavoidable, correctional staff can support workers to handle these circumstances through recruitment, training, and open discussion. Said differently, the role of uncertainty in the mental health of correctional workers needs to be first acknowledged and then discussed before it can start to be addressed.
Correctional staff can ensure that they are recruiting employees that have coping skills and familiarity and resilience in uncertain circumstances. To do so, employers need to better understand the characteristics of correctional worker recruits and the skills and needs with which they enter the position. In addition, training is key so that recruits can understand the uncertainty associated with the work, familiarize themselves with those circumstances, and develop and strengthen coping still to navigate through those situations. Respondents reported a “moderate” level of uncertainty, which could be evidence that tolerance to uncertainty builds over time. The question becomes whether, given the highly unpredictable environment in institutional or community correctional work, have correctional workers built up a tolerance for uncertainty over time? Indeed, given the current results, and previous evidence that IU decreases with increased exposures to uncertainty (Boswell et al., 2013; Carleton, Desgagné, et al., 2019), we suggest future researchers should empirically disambiguate IU changes among correctional workers (and other PSP) with diverse occupational tenure and over time. Examining whether IU is a mediating mechanism for relationships between sociodemographic variables, occupational roles, and mental health outcomes may also provide opportunities for protecting mental health.
Our study is limited in that the correctional workers self-selected to participate in the study, which impairs our ability to calculate the actual response rate; as such, the results may not generalize to the greater correctional worker populations in Ontario or beyond. More specifically, community supervision officers were more likely to be excluded from the analysis; thus, the findings may be more reflective of the experiences of correction officers in the system given that they make up a large portion of the sample. In addition, the small subsamples of some occupational categories (e.g., Institutional Training, Institutional Wellness) may have hindered our ability to detect differences across the groups (i.e., lack of power to detect differences). Moreover, because participant responses were anonymous, reliability and validity may be ambiguous (Bethlehem, 2010).
Even when anonymous, respondents may underreport clinical symptoms for reasons such as stigma and concerns about confidentiality (Henderson et al., 2016; Karaffa & Koch, 2016; Ricciardelli, Carleton, Groll, & Cramm, 2018; Ricciardelli, Carleton, Mooney, & Cramm, 2018; Ricciardelli et al., 2020). Self-report screening tools, despite their robust design and evidence base, are approximations. As such, diagnostic interviews are required for a more accurate analysis of the prevalence of mental disorders among the population. To fully understand the experiences of IU, qualitative interviews with correctional workers across occupational groups are warranted, particularly as a complement to diagnostic interviews. As with qualitative interviews, the nuance of said experiences can be unpacked, including how exactly uncertainty is identified, experienced, responded to, and how correctional workers manage or cope with the emotions and outcomes of said experiences.
Conclusion
We theorized that correctional occupational roles, particularly those with less authority, control, and predictability, would be associated with higher levels of uncertainty and that IU would moderate the relationship between occupational roles and respondents self-reporting mental health disorders. We found, however, that uncertainty for intolerance did not moderate this association. Despite the nonsignificant results, we argue slightly lower prevalence among institutional wellness, training, and administrative staff results in part from a relatively more predictable work environment of which they have more control. The results indicate that although IU operates consistently across occupational roles, what remains are alarmingly high prevalence of positive screens for mental disorders among provincial correctional workers across occupational subgroups and a robust association between mental disorders and IU. The results reaffirm a need for evidence-based proactive mental health activities, knowledge translation, and treatment as well as supporting an opportunity to explore how authority without control (i.e., unpredictability in the workplace) can impact employee mental health.
Supplemental Material
sj-pdf-1-cjb-10.1177_00938548211050112 – Supplemental material for Pervasive Uncertainty under Threat: Mental Health Disorders and Experiences of Uncertainty for Correctional Workers
Supplemental material, sj-pdf-1-cjb-10.1177_00938548211050112 for Pervasive Uncertainty under Threat: Mental Health Disorders and Experiences of Uncertainty for Correctional Workers by Rosemary Ricciardelli, Meghan Mitchell, Tamara Taillieu, Andreanne Angehrn, Tracie Afifi and R. Nicholas Carleton in Criminal Justice and Behavior
Footnotes
Authors’ Note:
Special thanks for recruitment support and the review provided by the Ontario Ministry of the Solicitor General and the Ontario Pubic Service Employees Union. The author(s) disclosed receipt of the following financial support for the research, authorship, and/or publication of this article: R. Nicholas Carleton’s research is supported by the Canadian Institutes of Health Research (CIHR) through a New Investigator Award (FRN: 13666). Tracie O. Afifi’s research is supported by a Tier I Canada Research Chair. This research was also funded in part by a CIHR Catalyst Grant (FRN: 16234).
Notes
References
Supplementary Material
Please find the following supplemental material available below.
For Open Access articles published under a Creative Commons License, all supplemental material carries the same license as the article it is associated with.
For non-Open Access articles published, all supplemental material carries a non-exclusive license, and permission requests for re-use of supplemental material or any part of supplemental material shall be sent directly to the copyright owner as specified in the copyright notice associated with the article.