
Abstract
The value of negative results for knowledge advancement stands in contrast to the abundance of positive findings found in quantitative research across research fields. There is reason to believe that positive-results bias is also present in studies that use qualitative comparative analysis (QCA). This possibility has been neglected so far in work on QCA. This article contributes to the field of meta science and QCA by exploring whether hypothesis-testing QCA articles collectively indicate the presence of positive-results bias. An analysis of consistency scores and comparison of hypotheses and findings reported in QCA articles and PhD theses indicate the presence of biases. The results suggest two implications. First, the interpretation fo findings in a field should take into account that negative results may be underreported. Second, QCA research would benefit from exploring techniques that could be integrated into the research and peer-review process to address positive-results bias.
Knowledge advances through positive and negative findings in empirical research. The importance of learning from negative results stands in contrast with the mounting evidence for a bias toward positive results that is attributable to publication incentives (Fanelli 2010). Judged by the threshold for statistical significance, frequentist studies that present positive results are more likely to be published and greatly outnumber those with negative results (Christensen et al. 2019: chapter 3). For qualitative case study research and process tracing, there is also evidence that positive results are the rule among published articles (Jacobs 2020). For qualitative comparative analysis (QCA), there is reason to assume that the publishing-related mechanisms that account for positive-results bias are present too. The methodological development of QCA has made significant progress on multiple dimensions (Schneider et al. 2019; Siewert 2021; Thomann 2018), yet without considering the possibility that the corpus of empirical QCA research is marked by a positive-results bias.
In this article, I address positive-results bias in QCA studies in two related ways. First, I focus on the distinction between a positive result and a null result or non-finding. For QCA, this translates into the distinction between a consistent and an inconsistent set relation. I assess the presence of a bias toward consistent set relations through the analysis of 551 solution consistency scores from 195 hypothesis-testing social science articles published between 2009 and 2021. The predominance of consistent set relations and results of a caliper test indicate that a bias toward consistent set-relational findings is present. Additional observable implications that relate to exploratory journal articles and hypothesis-testing PhD studies support the interpretation that the bias follows from publishing-related incentives. Second, I distinguish between positive results as findings that support hypotheses, and negative results as disconfirming or contradicting theoretical expectations. In this perspective, a positive-results bias is more narrowly defined as a hypothesis-confirmation bias. A review of 40 QCA articles shows that out of 162 hypotheses, about 24 percent are found disconfirmed, and that about 75 percent of the articles report that at least half of the hypotheses are confirmed empirically. In combination, there is reason to believe that QCA studies are characterized by positive-results bias and that a stronger focus on its sources and means to diminish it is necessary.
The primary aim of this article is to increase awareness of both the harm and causes of positive-results bias. I do not criticize QCA as a technique because positive-results bias derives from the behavior of researchers, editors and reviewers and not from intrinsic features of a method. I am also not interested in highlighting individual studies and inferring that they are of low quality. The aggregated perspective on a corpus of QCA articles does not allow one to infer the reasons for a positive result in a single study. A second goal is to expand the field of meta science to empirical QCA research.
Positive and Negative Findings in QCA
Positive and negative findings can be defined on two partially related dimensions. The first dimension is more general and distinguishes a positive finding from a null result or non-finding. For hypothesis-testing research, the second dimension differentiates between findings that confirm or disconfirm a theoretical expectation. I address each dimension in turn and explain what it implies for QCA research. The focus is on the analysis of sufficiency by deriving a minimized QCA solution from the truth table. 1 A minimized solution is the target of QCA studies and is the result that is interpreted theoretically. 2
On the first dimension, the question is whether one finds evidence for any set relationship in the data. For QCA, the distinction is between a consistent and inconsistent set relationship covering a term and the outcome (Ragin 2006). 3 By convention, QCA research uses a consistency score of 0.75 or higher to infer that a sufficient relationship is present (Ragin 2006:293; Schneider and Wagemann 2012:129), that is, that the result is positive. A consistency score of <0.75 designates a negative result in the conventional reading. Because of the central role of the parameter of consistency, I refer to bias on this dimension as a consistent-result bias. 4
A criterion that distinguishes consistent from inconsistent set-relational findings can induce consistent-result bias in two non-exclusive ways. 5 First, bias is introduced in the peer-review process by reviewers and editors when they treat positive results more favorably than negative findings (Chopra et al. 2024). In anticipation of a positive-results filter during the peer-review process, researchers may not submit studies with negative results and put them into the (virtual) file drawer (Franco and Malhotra and Simonovits 2014; Rosenthal 1979). Second, a researcher induces bias in the research process when the analysis-related degrees of freedom are explored to derive a consistent result (for frequentist statistics; Wicherts 2016). 6 This subsumes practices such as the selective reporting of positive results, and the selective exclusion of cases to produce a positive result. In Appendix Section A, see Supplemental Material, I summarize the QCA design choices that represent the degrees of freedom in a QCA study. 7 A complementary perspective on positive results only concerns hypothesis-testing studies with a consistent set-relational finding. When one finds evidence for a set relation, the question is whether it confirms a hypothesis (positive), or disconfirms it (negative). 8 An inconsistent set relation always disconfirms a hypothesis that predicted the set relation to be consistent, while the reverse is not true. The distinction between the two understandings of a positive-results bias can be illustrated with a hypothetical extreme scenario: the consistent-results rate is 100 percent, while the hypothesis-confirmation rate is 0 percent. This would be the case when all set-relational findings are consistent and disconfirm every single hypothesis that had been formulated. From a more practical viewpoint, a strong hypothesis-confirmation bias, as opposed to the more general positive-results bias, implies a higher hurdle for getting published. One needs to present a positive result that also confirms a hypothesis in confirmatory research. This demonstrates that the two perspective on positive results are related, but not identical and should be distinguished.
In the empirical assessment, I distinguish between the two types of positive-results bias and present separate empirical assessments. Whenever I speak of ‘‘positive results” in the following, I mean both types of bias because the distinction then does not matter for the discussion at hand. If it is necessary to differentiate between them, I speak of a “consistent-result bias” and a “hypothesis-confirmation bias.”
Design and Data for Assessment of Positive-Results Bias
Units of Analysis
For the study of consistent-result bias, the primary unit of analysis is the result of the truth table analysis in articles that test a hypothesis. The outcome of the truth table analysis can take different forms. First, when the truth table is minimized, the solution consistency score can be equal to or higher than 0.75, or below it. In my primary analysis, the focus is on the entire solution and not on its constitutive terms. QCA research entails a Y-centered perspective with an interest in the overall quality of a solution (Marx et al. 2014:115; Mello 2022:2). The review of QCA articles shows that solution consistency is important and that it is reported and discussed. The Y-centered interest of QCA research is complemented with a term-centered focus that interprets the consistency and empirical importance of a solution’s constitutive elements. Since the Y-centered research interest has been defining for QCA since its inception (Ragin 1987:chapter 1), I focus on solution consistency in the following. I complement the analysis of solutions with an assessment of individual terms in Appendix Section G3, see the Supplemental Material. Second, an alternative outcome of the truth table analysis is that no truth table row reaches the consistency threshold of 0.75. This may put an end to the empirical analysis without moving on to the truth table minimization process.
The empirical analysis is concerned with articles that test at least one hypothesis. 9 Exploratory research is not of primary interest (see below) in a study of positive-results bias. The goal of exploratory research is to use the degrees of freedom to find a set of design choices that yield a positive result. The large number of available analysis choices makes it likely to report a consistent solution. The result of a hypothesis-testing study should derive from one set of design choices that is fully reported; specified before having seen the data and without knowing whether a given design decision will generate a positive result (Nosek et al. 2018). It is intuitive that a positive finding is less likely to be made when one must make analysis choices before seeing the data, rather than choosing between alternative sets of design decisions based on the result that they produce (I discuss the ideas of iteration and dialogue in the QCA process below). This intuition is supported by a comparison of ordinary quantitative articles, called standard reports (SRs), with registered reports (RRs). The percentage of confirmed hypotheses is 44 percent for RRs (95% CI [31.91, 55.95], 31 out of 71) and 96 percent for SRs (95% CI [91.61, 98.54], 146 out of 152) (Scheel et al. 2021). The high success rate of SRs is supported by reviews of non-registered articles from different disciplines finding that more than 95 percent of all articles present positive findings (95% for psychology journals, 85% for medical journals; Sterling et al. 1995:109; Sterling 1959:32). The analysis of positive-results rates between disciplines and over time until 2007 indicates that they increase over time in most disciplines and reach a level of at least 80 percent (Fanelli 2012:896).
For the study of hypothesis-confirmation bias in QCA, the unit of analysis is the individual hypothesis. It does not matter whether it covers a single condition or a conjunction, as long as it makes a prediction about what the empirical result will be.
Observable Implications
The analysis of a positive-results bias requires a benchmark of results that one would expect to be present if there was no bias. For solution-consistency bias, I follow a global and a local approach guided by meta science on quantitative research. The global perspective calculates the share of positive results of all findings that are reported for the truth table analysis. 10 The question is: how plausible is it that the observed share of positive results is as high as it is if there was no positive-results bias? The benchmark for interpreting the observed share of consistent solutions builds on the comparison of SRs with RRs that have a positive-results rate of 46 percent. 11 The complementary benchmark are the reviews of positive findings in quantitative research that report positive-results of 90 percent or higher and that are most likely at least partially driven by bias. 12
The local strategy for bias assessment uses a caliper test. The null hypothesis
For the local approach, I estimate the confidence interval (CI) for the share of positive results among all findings around the cutoff of 0.75. The larger the lower bound of the CI, the sharper the discontinuity at the threshold and the more plausible it is to assume that the spike in consistency scores is also attributable to a positive-results bias. I define an estimated share of positive results that is below 0.8 as substantively equivalent with the expectation of an equal distribution around the cutoff. 14 Substantive importance is a possible interpretation of the result if the upper bound of the 95 percent CI for the share of positive results is equal to or exceeds the equivalence bound of 0.8. The threshold of 0.8 is based on my individual assessment of what represents a substantively significant share of positive results. 15 I follow standard practice for robustness assessments of caliper tests and define multiple intervals of solution consistency scores that qualify as ‘‘just above” and “just below” 0.75. The three symmetric intervals have a range of 0.05 points (0.725–0.775), 0.1 points (0.7–0.8), and 0.15 points (0.675–0.825).
Additional observable implications are derived from solution consistency scores in exploratory QCA articles and hypothesis-testing PhD theses. I assume that researchers, editors and reviewers prefer positive over negative results for exploratory research (see above). If this assumption is correct, the peer-review process would work as a negative-results filter, regardless of the mode that is followed in an article. The exploration of defensible analysis choices in combination with a filter is the basis for three observable implications. First, globally, there should be an excess of positive results among all exploratory results. Second, locally, there should be a discontinuity in the frequency of consistency scores at the threshold of 0.75. Third, I compare the empirical cumulative distributions functions (ECDFs) of consistency scores reported in testing and exploratory articles. If the types of articles display positive-results bias for the same reasons, then the ECDFs should be similar. The third observable implication is assessed through a visual comparison of the two ECDFs and a DTS test (D test statistic) of the null hypothesis that the ECDFs are identical (Dowd 2020). 16
In a third step, solution consistency scores that are reported in testing articles are compared with PhD theses that use QCA to test hypotheses. The assumption is that the goal of publishing in journals and the peer-review process are the main reasons for a consistent-results bias. PhD theses submitted for obtaining a degree are usually not ready to be published as a peer-reviewed monograph by a book publisher, or, if rewritten as shorter documents, as peer-reviewed journal articles. 17 Based on the assumption that PhD theses submitted as monographs to the department are remote from the traditional peer-review process and publishing incentives, I derive additional implications. 18 First, I expect that the share of positive results among results is not as excessive for PhD theses as for articles. Second, there is no sorting of consistency scores taking place around the threshold of 0.75. Third, I expect to observe that the ECDFs of consistency scores in PhD theses and articles are different.
For the analysis of hypothesis-confirmation bias, I draw a random sample of 40 articles that are classified as confirmatory. For each article, I count the number of theoretical expectations. The empirical results are tied to the hypotheses using a three-fold distinction: they either confirm a hypothesis, disconfirm it, or are ambiguous. The codings are based on how the authors evaluate the hypotheses in their article. 19 The benchmark for percentage of confirmed hypotheses in QCA articles is the study by Scheel et al. (2021). The more the share of confirmed QCA hypotheses exceeds the 44 percent confirmation percentage for RRs and the closer it is to the percentage for SRs, the more reason to assume that a hypothesis-confirmation bias is present. This benchmark from a meta-science study of quantitative results is the best one that is available at present. The reader is invited to use another benchmark that one deems appropriate for interpreting the findings.
Data
The solution consistency scores were extracted from empirical QCA articles selected in a multistage process. I used the Social Sciences Citation Index to identify empirical studies from the fields of international relations, political science, public administration and sociology published between 2009 and 2021 (see Appendix Section C in the Supplemental Material for details). The period of analysis starts in 2009 because the consistency score was introduced in the mid-2000s (Ragin 2006). 20 At the end of the collection process, the corpus comprises 281 articles. The consistency scores were extracted manually because there is no standard for the presentation of results that would have allowed it to automate the task (see Appendix Section D in the Supplemental Material for details). The PhD theses were identified through a keyword search in the ProQuest database (Appendix Section G in the Supplemental Material). 21 The articles and theses were coded as either exploratory or hypothesis-testing through a qualitative analysis of their content (Appendix Section E in the Supplemental Material). This procedure yielded 281 QCA articles reporting 767 consistency scores. 551 consistency scores are reported for a hypothesis test in 195 articles, 216 for an exploratory analysis in 86 articles (Figure 1).
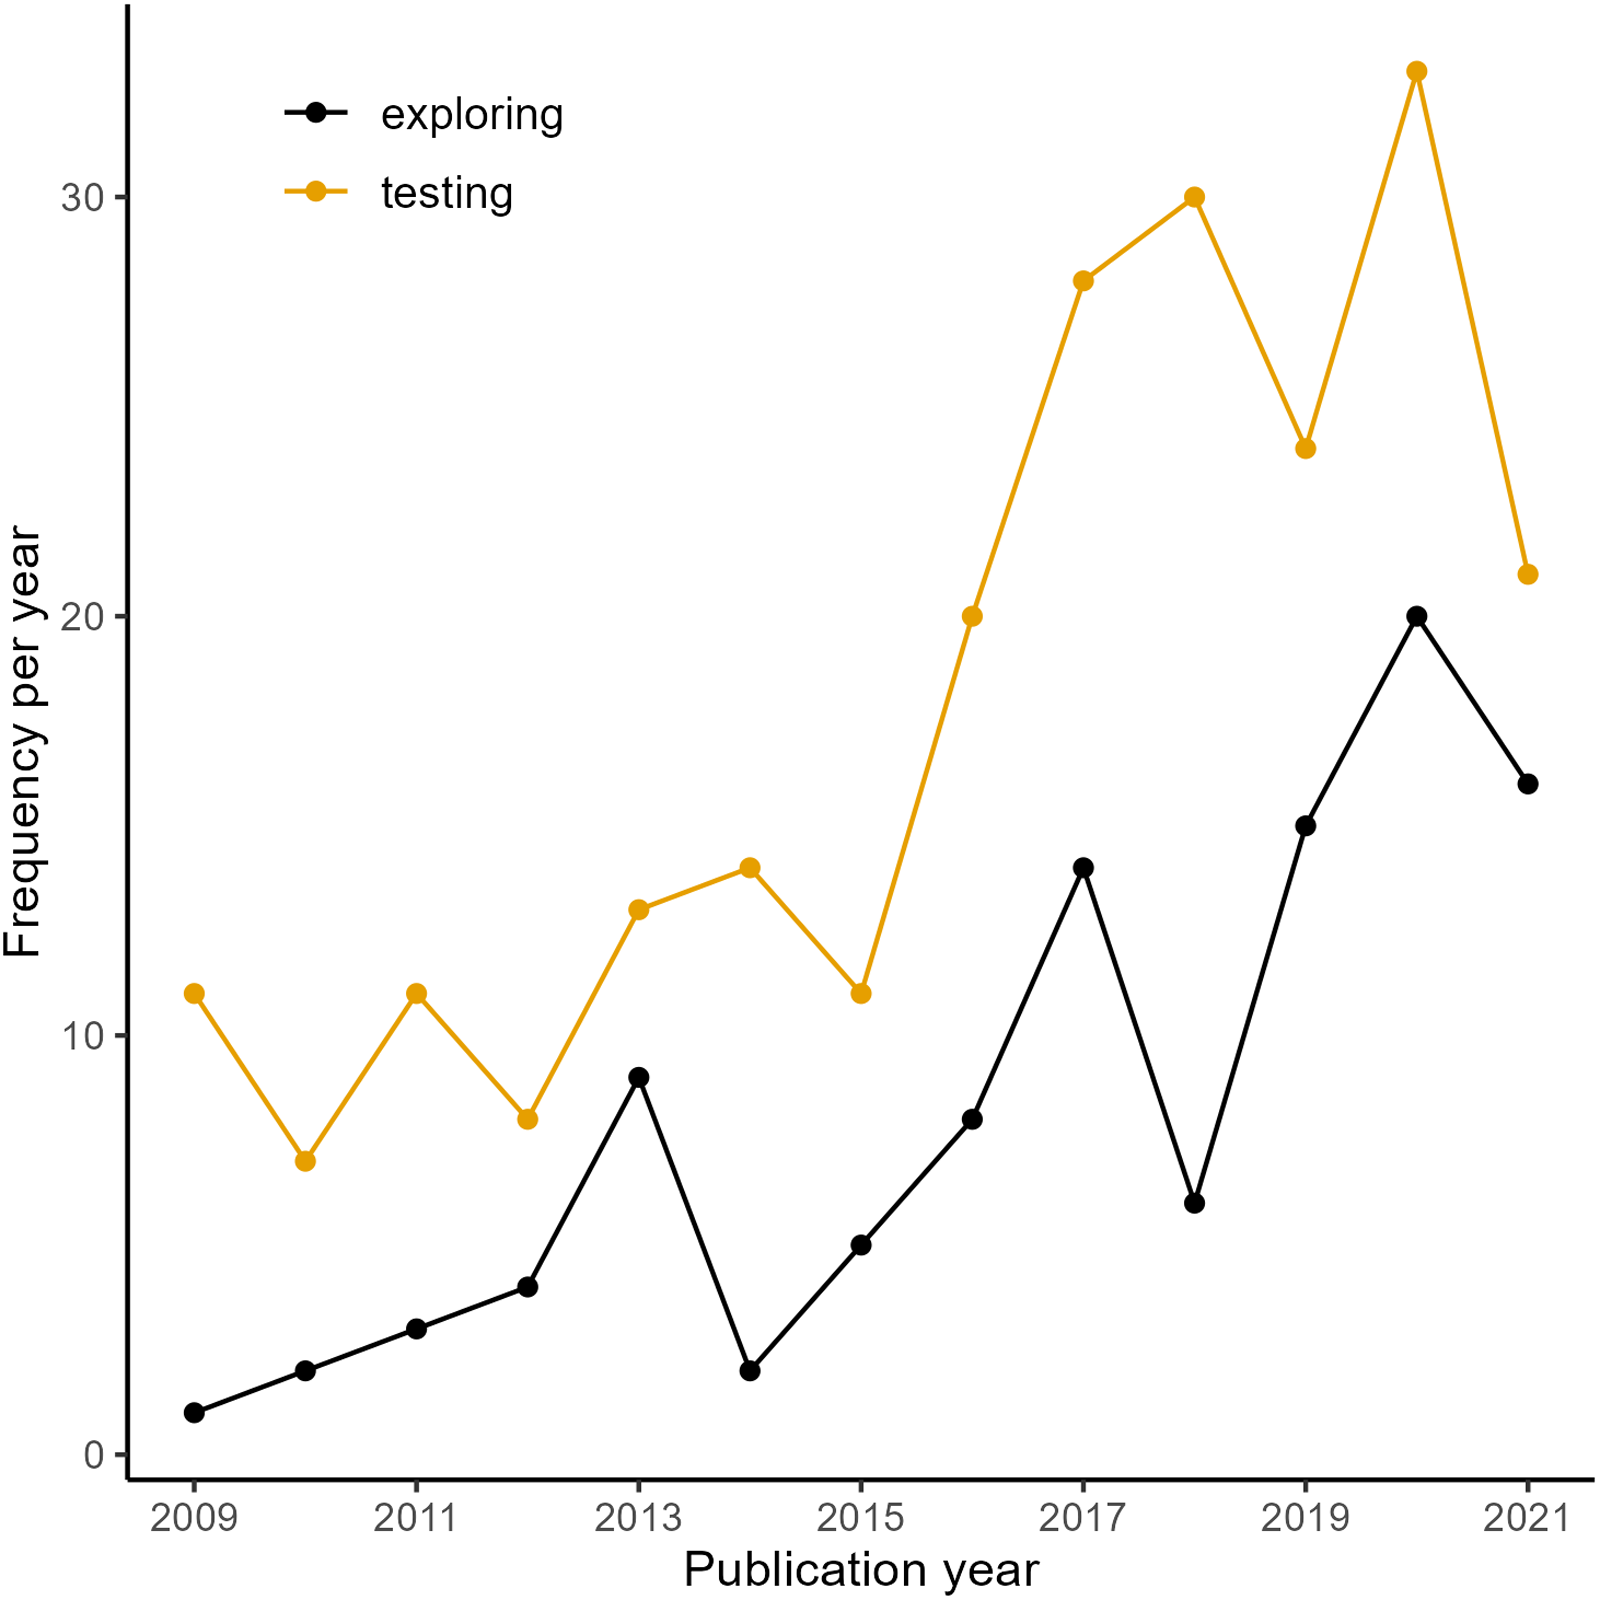
Exploratory and hypothesis-testing articles over timet.
The analysis of solution consistency scores in PhD theses is based on 63 theses submitted between 2004 and 2017. Fifty three are designated as testing a hypothesis and 10 as performing an exploratory analysis. The PhD theses report 345 solutions in total, 288 belonging to a hypothesis-testing study and 57 reported in an exploratory design. In the following section, I start with the results on consistent-solution bias and discuss hypothesis-confirmation bias afterward.
Empirical Analysis
Hypothesis-Testing Articles
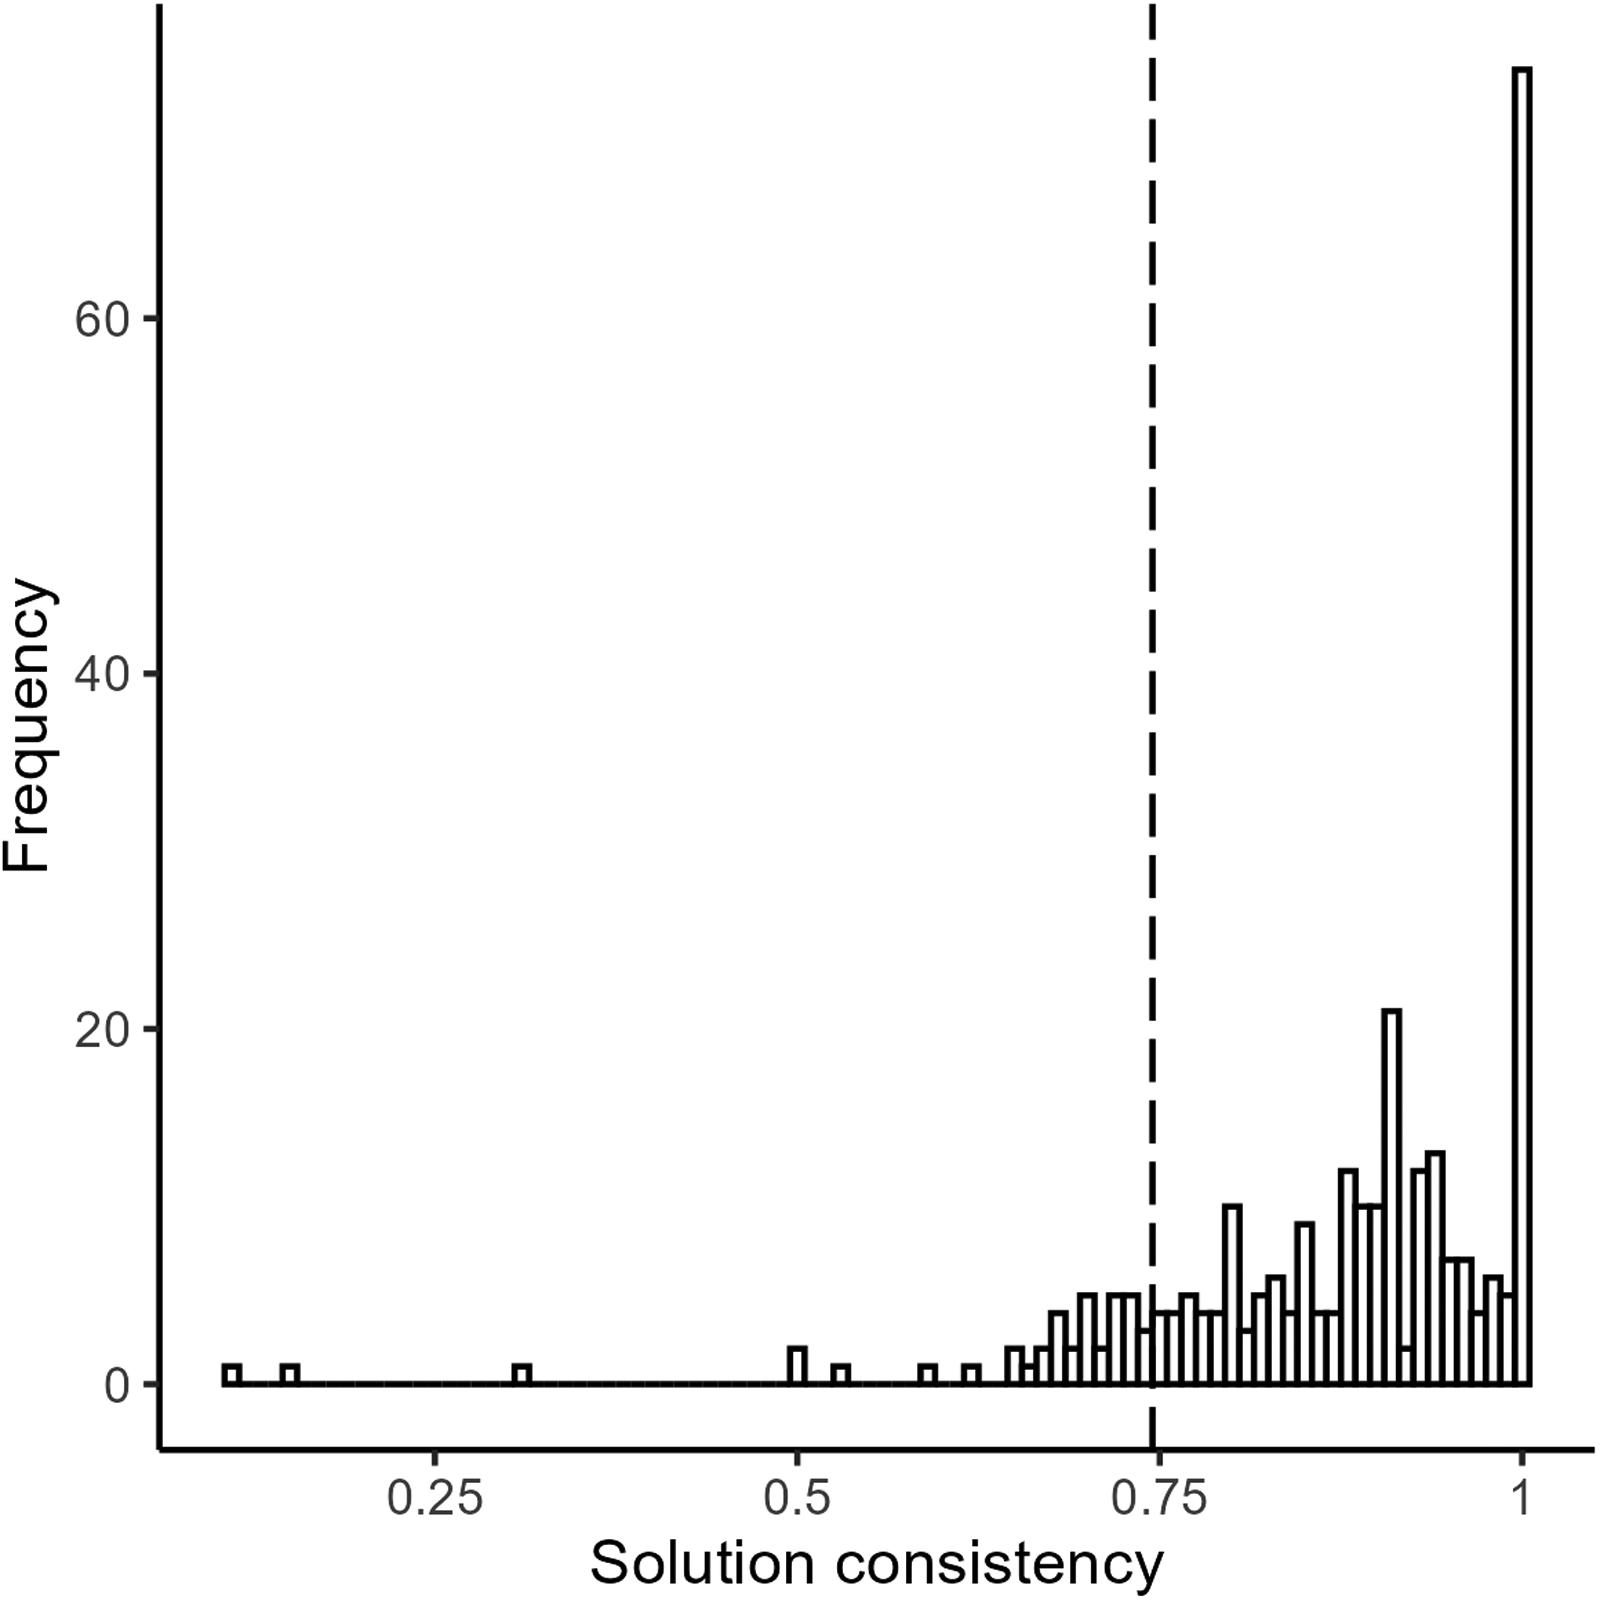
In a global view, Figure 2 shows that 538 out of the 551 consistency scores are equal to or above the threshold of 0.75 (98%) and only 13 are below it (2%) (see Appendix Section G in the Supplemental Material for more descriptive insights). I interpret this as evidence of a positive-results bias because the share is much higher than the benchmark from RRs. The share of 0.98 of positive QCA results is in the range of the shares of positive results that have been reported for SRs in quantitative research (Scheel et al. 2021; Sterling et al. 1995).
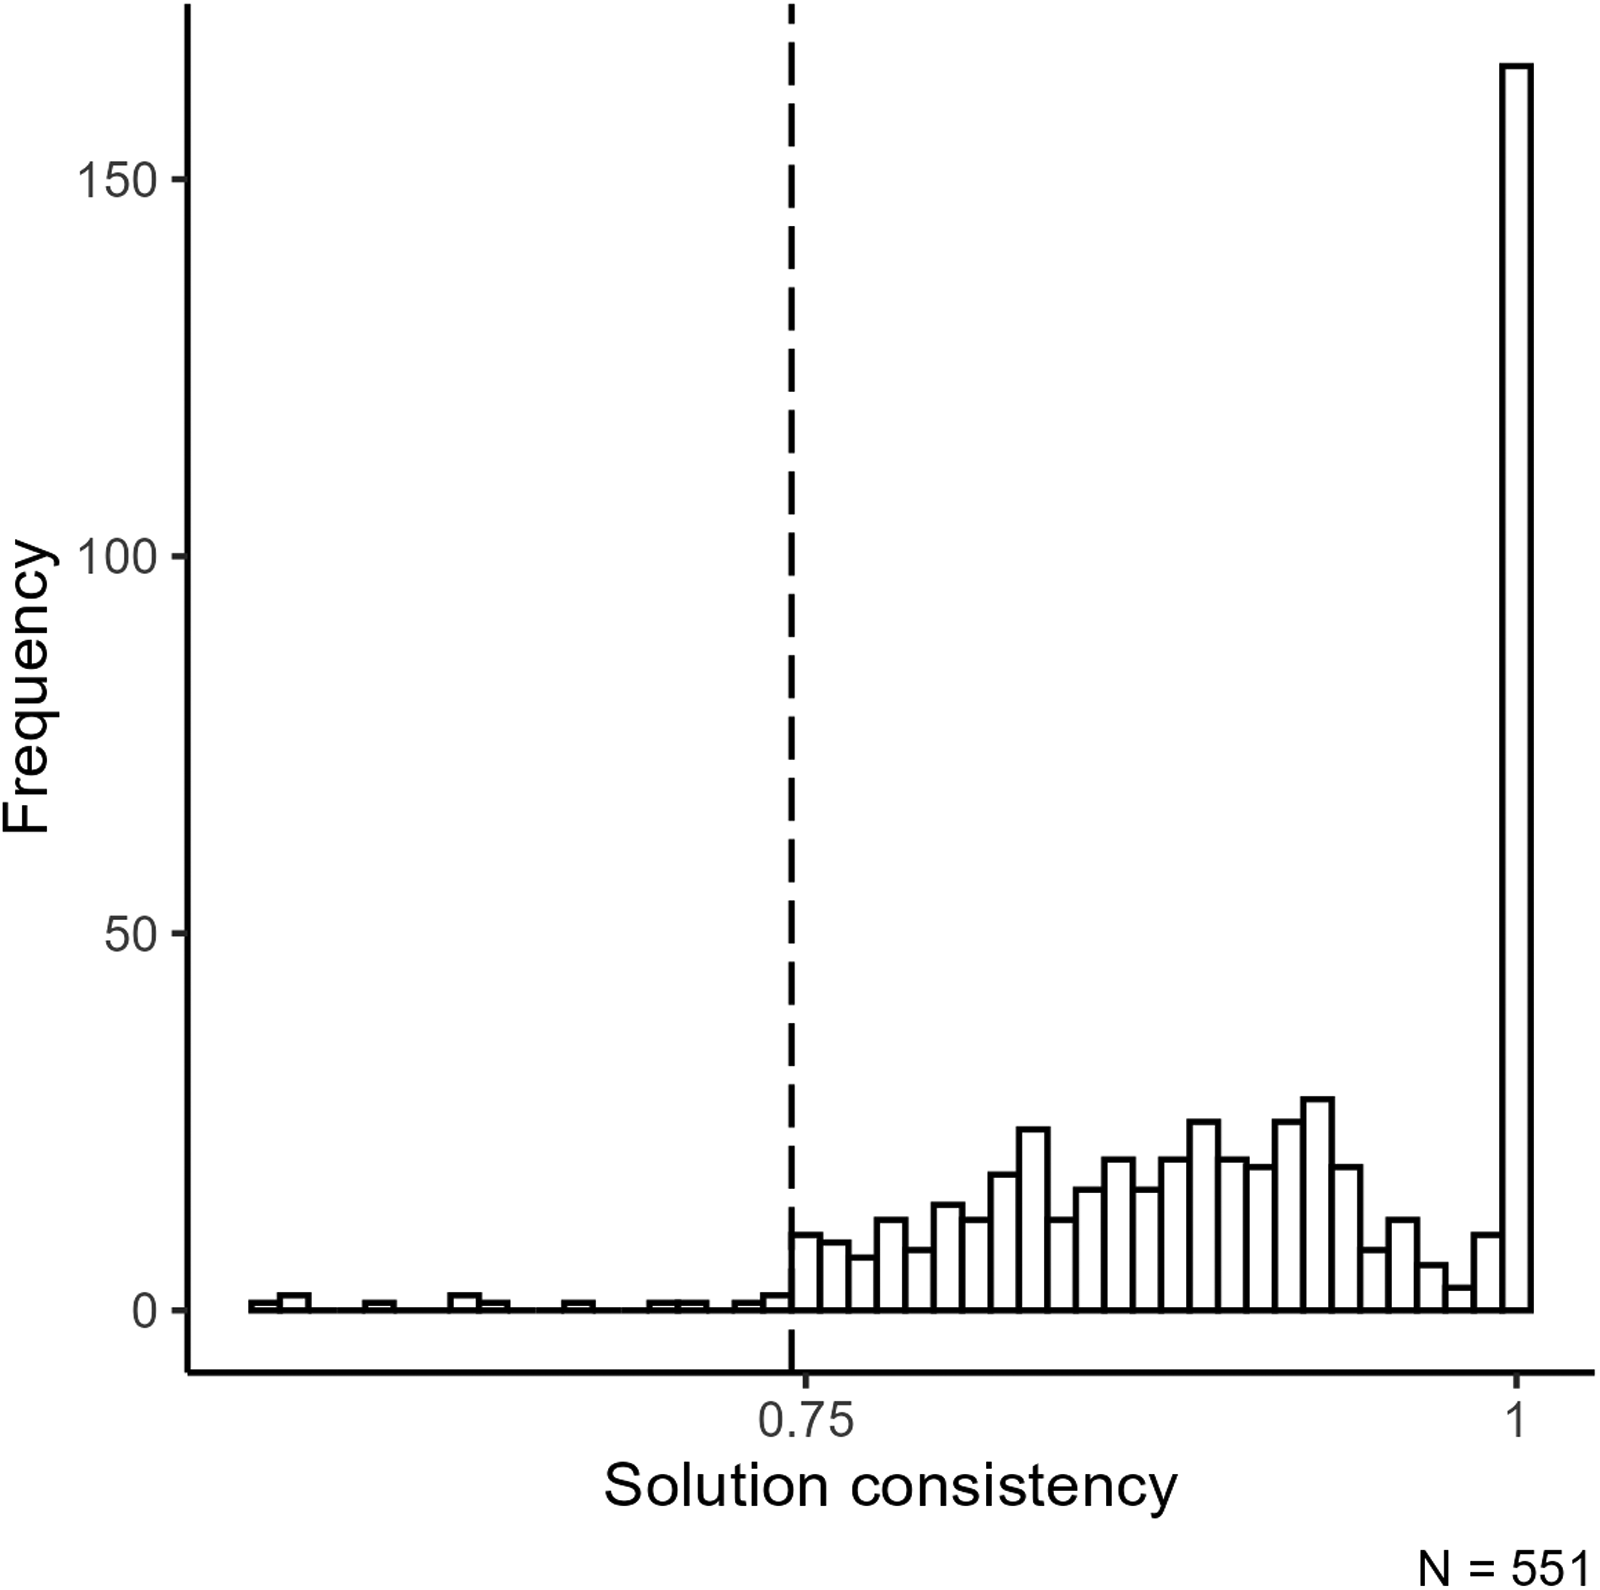
Histogram of solution consistency scores for hypothesis-testing qualitative comparative analysis (QCA) articles.
In the local perspective on consistent-solution bias, one observes a spike in the frequency of consistency scores at the cutoff of 0.75. This spike is a typical visual indication for consistent-solution bias (see for z-values, Gerber and Malhotra 2008).
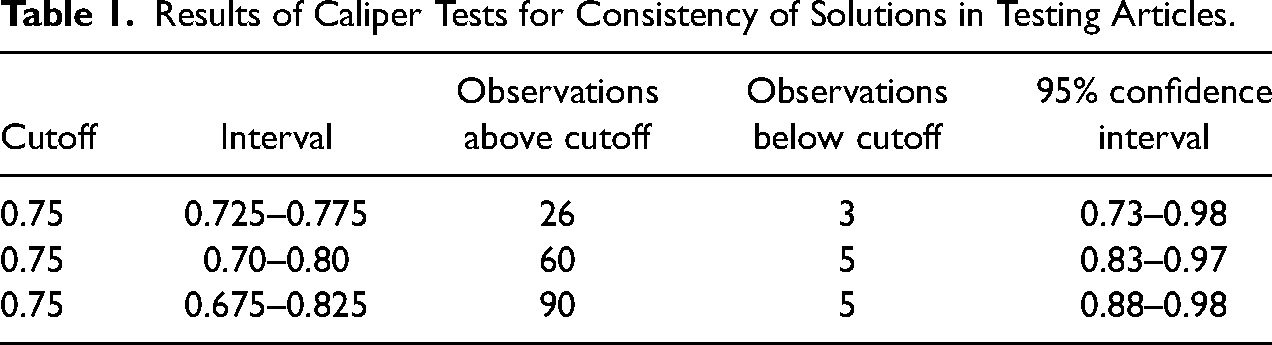
The results of the caliper test supports the visual inference (Table 1). For all three ranges, the number of consistency scores above the threshold is significantly and substantively larger than that of values articles below it. Table 1 shows that the lower bound of the CI is larger than 0.5 for all three ranges of consistency scores. The upper CI bound is always above the upper equivalence bound of 0.8 regardless of the width of the interval around 0.75. 22 Combined, the visual inspection and quantitative analysis suggest that a substantively significant positive-results bias is present in this corpus of QCA research.
Results of Caliper Tests for Consistency of Solutions in Testing Articles.
One may object to this analysis that one does not derive inconsistent results in QCA because the truth table minimization process only includes rows that have a consistency of at least 0.75. When one minimizes consistent truth table rows, one may think that the solution and its constitutive terms have to be consistent, too, because the consistency scores of the minimized and non-minimized solution are highly correlated. The fact that inconsistent solutions are produced in QCA speaks against this objection. For a deeper understanding of how the inconsistent solutions have been produced, I reviewed their design choices and presentation in the articles (see for details Appendix Section F in the Supplemental Material). This shows that low-consistency solution scores are produced and reported for one of three reasons. The most important reason to mention here is that the solution consistency score can drop below 0.75 even if all truth table rows that are minimized have a consistency of at least 0.75. This shows that one can expect QCA solutions to be inconsistent and use their frequency in an analysis of consistent-result biases.
The results on hypothesis-confirmation bias builds on the review of 40 articles (Appendix Section G.1 in the Supplemental Material for descriptive details). 23 The median number of hypotheses is four with a total of 162 hypotheses that are tested. 61.1 percent of the hypotheses are inferred to be confirmed by the set-relational analysis (n = 99); 24.1 percent of the hypotheses are presented as being disconfirmed (n = 39); for 13.6 percent of the hypotheses (n = 22) the authors’ inferences are ambiguous. The results on hypothesis-confirmation bias are less clear-cut than for a consistent-solution bias. The percentage of confirmed hypotheses is not as high, but still higher than the benchmark of 44percent confirmed hypothesis in RRs would let one believe (taking the CI into account). This reading is supported by the low percentage of disconfirmed hypotheses, which is close to low shares of negative results reported for quantitative research (e.g., as by Fanelli 2012). In a comparison of the number of confirmed and disconfirmed hypotheses per article, one observes for 30 articles that the number of supported hypotheses is at least equal to the number of invalidated or ambiguous hypotheses. For six articles, it holds that the number of disconfirmed hypotheses is equal to the confirmed and ambiguous expectations. 24
My interpretation of these numbers is that at least a small degree of hypothesis-confirmation bias is present because the percentages of confirmed hypotheses and articles that report at least half of the tests as successful is large. Follow-up research on hypothesis-confirmation bias could expand the sample and take the context of the hypothesis test into account. I find it reasonable to assume that not all hypothesis-testing articles are treated in the same way in the peer-review process. For example, an article that performs a test of two mutually exclusive hypotheses cannot have a confirmation rate of more than 50 percent. This is probably different from an article that puts forward a new theoretical argument, derives multiple hypotheses that could be all found confirmed, and has a success rate of only 50 percent. It would be interesting to see whether the nature of the tests is associated with the hypothesis-confirmation rates and indicate different degrees of bias.
Exploratory Articles
For exploratory QCA studies, 201 consistency scores out of 216 (93%) are equal to or above the threshold of 0.75; 15 scores (7%) are below this threshold (Figure 3). The overall distribution with an excessive share of positive results indicates a positive-result bias for exploratory QCA articles, which confirms the expectation. In a local perspective, there is a spike right at the cutoff consistency score, which also confirms the expectation that this should be observed for exploratory research.
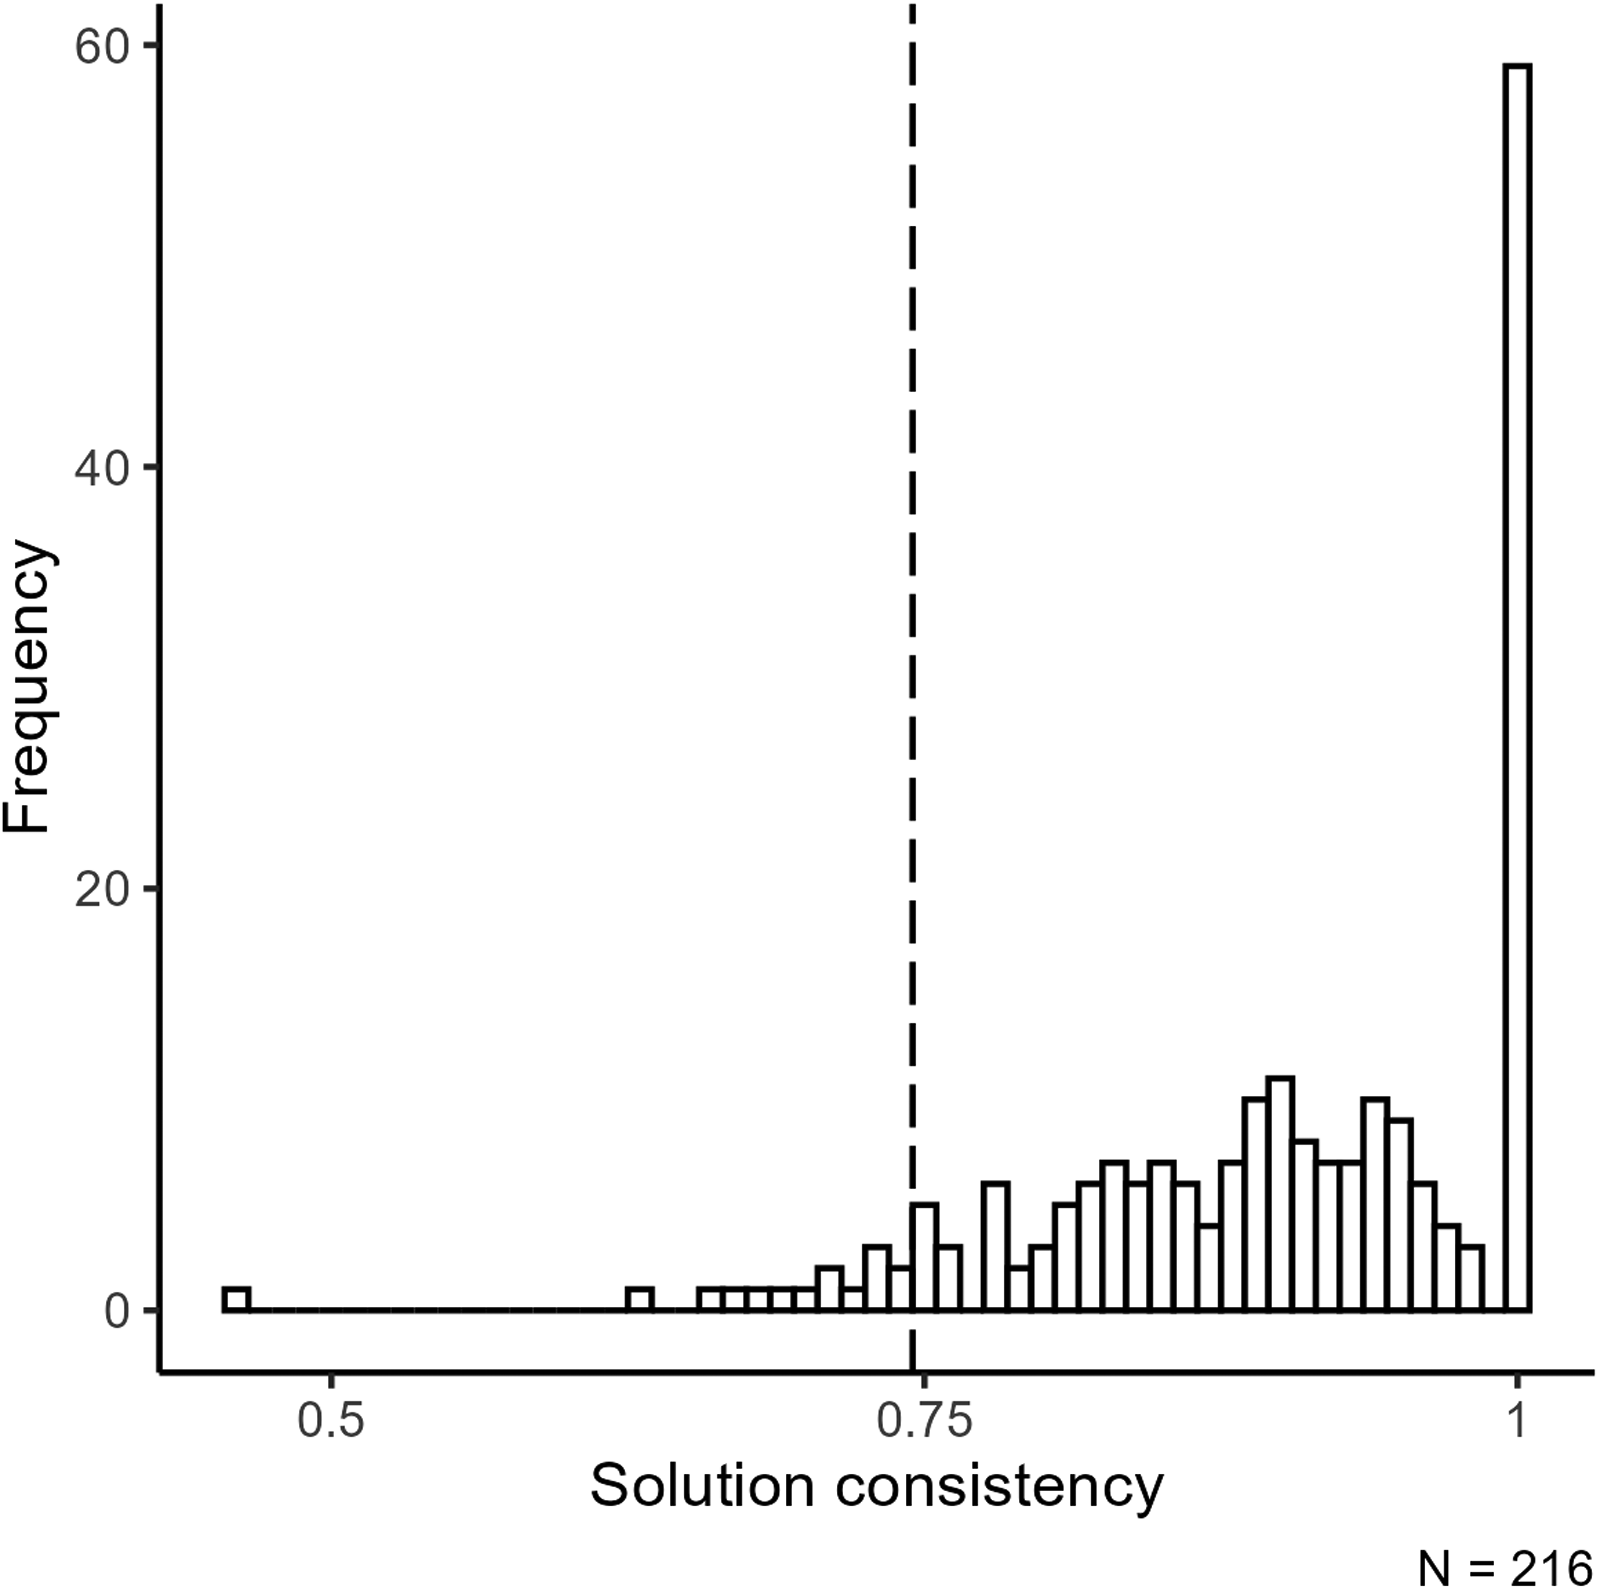
Distribution of solution consistency scores for exploratory qualitative comparative analysis (QCA) articles.
For each range of the caliper test (Table 2), the number of values above the threshold is larger than the number below, with a ratio increasing from about 1.5 to about 3.
25
The 95 percent CIs are wide because of the small number of consistency scores in each range. The lower bound of the 95 percent CI increases as the number of results in the range increases and excludes the
Results of Caliper Tests for Consistency of Solutions in Exploratory Articles.
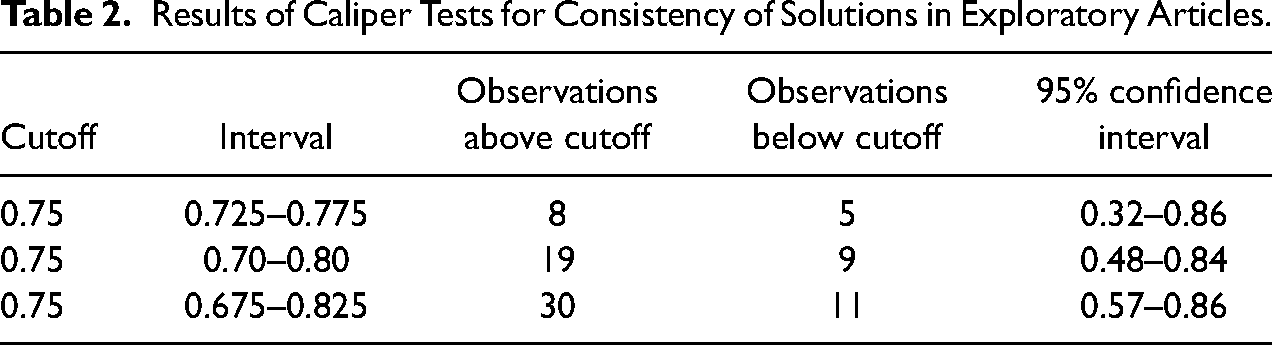
The analysis of consistency scores in hypothesis-testing and exploratory articles shows that they have a large share of positive results in common and a spike in values just above the consistency threshold of 0.75, where the results are more ambivalent for exploratory articles. These similarities from the quantitative analysis are supported by an informal comparison of the ECDFs (Figure 4). The functions largely follow similar lines with very few articles below 0.7, and a steady increase of the density from the range of 0.7 to 0.75 to about 0.9. The visual similarities between the distributions are supported by a DTS test. The test statistic has a value of 0.83 with a p-value of .23 that does not allow me to reject the null hypothesis of equal distributions. 26
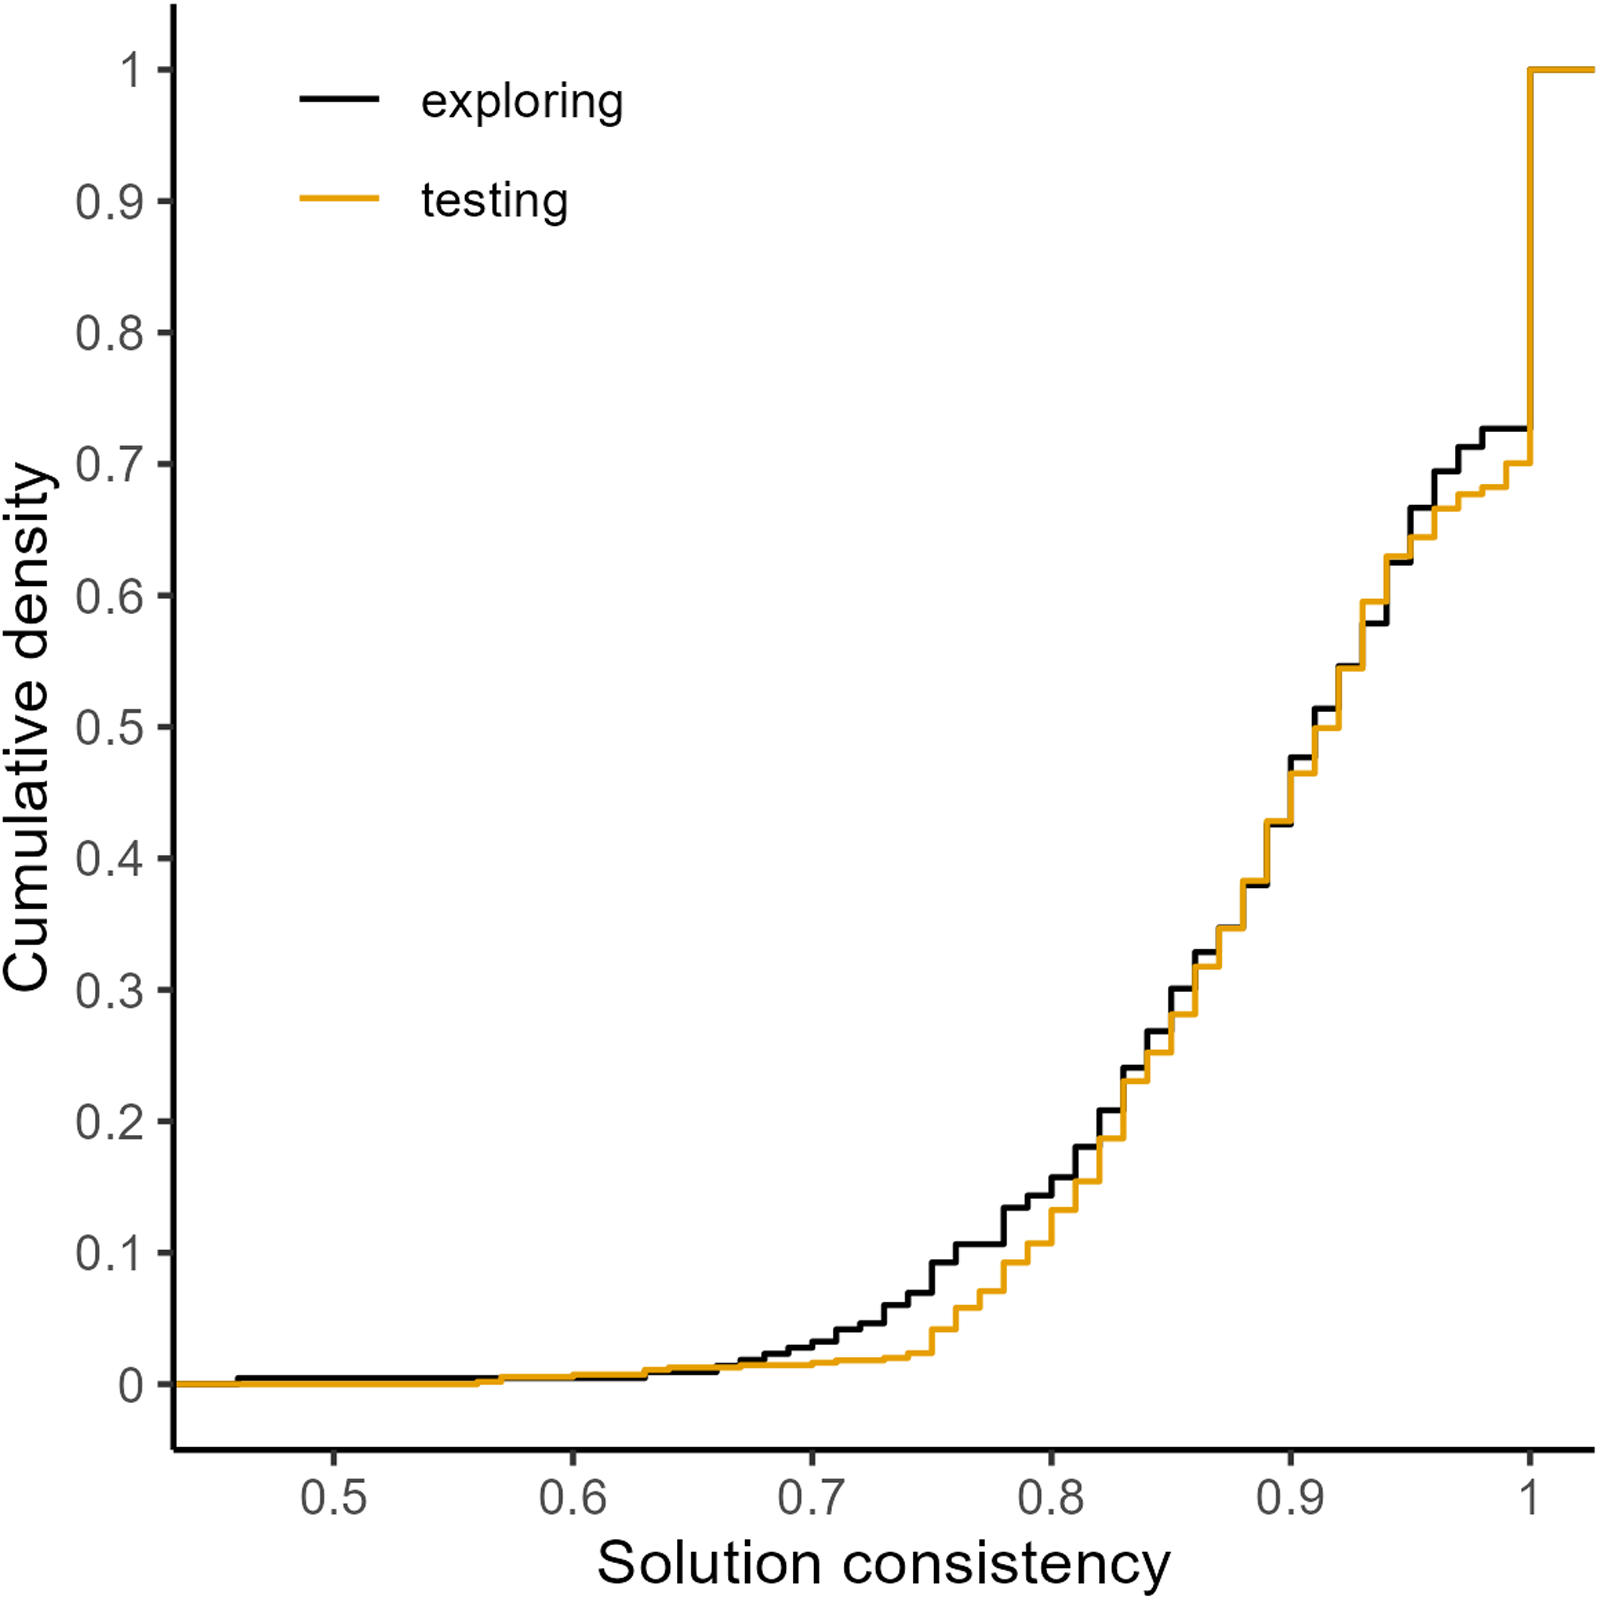
Cumulative density of solution consistency scores in testing and exploring articles.
Distribution of solution consistency scores for testing PhD theses.
These results for solution consistency scores in articles are supported by the results for the consistency values of individual terms (Appendix Section G.3 in the Supplemental Material).
Hypothesis-Testing PhD Theses
In a global perspective, 249 solution consistency scores out of 287 (72%) are equal to or above 0.75 (Figure 5). The share of positive results is smaller than for hypothesis-testing articles, but still large in absolute terms. Locally, the figure indicates that there is no discontinuity of consistency scores at a value of 0.75.
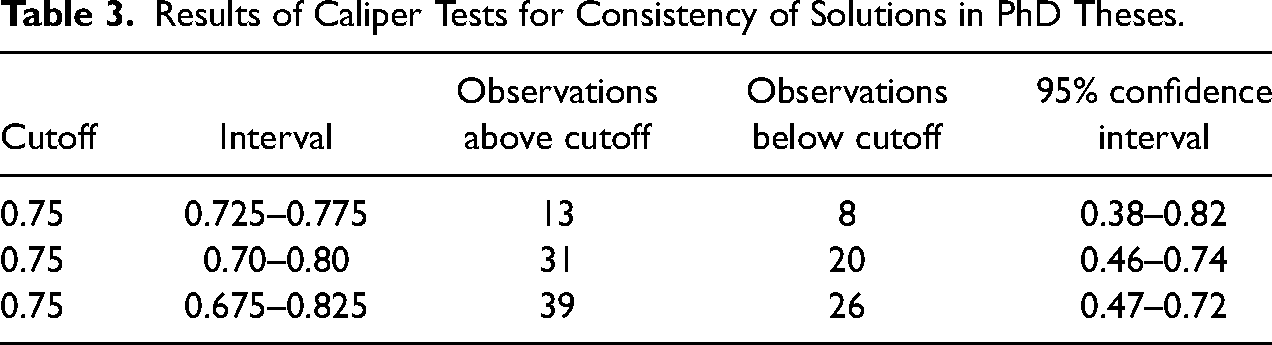
In the caliper test (Table 3), the number of scores above the threshold is larger than the number below for all three ranges. 27 The lower bound is always below the value of 0.5 of the null hypothesis, which does not allow one to reject the possibility of an equal distribution around the threshold. The uncertainty of the caliper test results is larger than for hypothesis-testing QCA articles because of fewer scores per range, but smaller than that of exploratory articles. As the caliper test range and the number of reported results increase, the upper bound falls below the equivalence threshold of 0.8. The results support the conclusion that the share of positive results is neither substantively nor statistically different from an equal distribution of scores around the cutoff.
Results of Caliper Tests for Consistency of Solutions in PhD Theses.
A DTS test of the ECDFs of hypothesis-testing articles and theses yields a test statistic of 3.17 with a p-value of .003 (based on Figure 6). This allows me to reject the null hypothesis that the ECDFs are identical. The visual analysis of the two ECDFs shows that the cumulative density of consistency scores of PhD theses is noticeably higher in the range below 0.75, which confirms the argument about publishing incentives and positive results. A question that remains is whether the difference between the two DTS values of 0.83 and 3.17 is statistically significant (Gelman and Stern 2006). I do not have a formal approach for a test of a significant difference. In substantive terms, the test statistics are in my interpretation different. 28
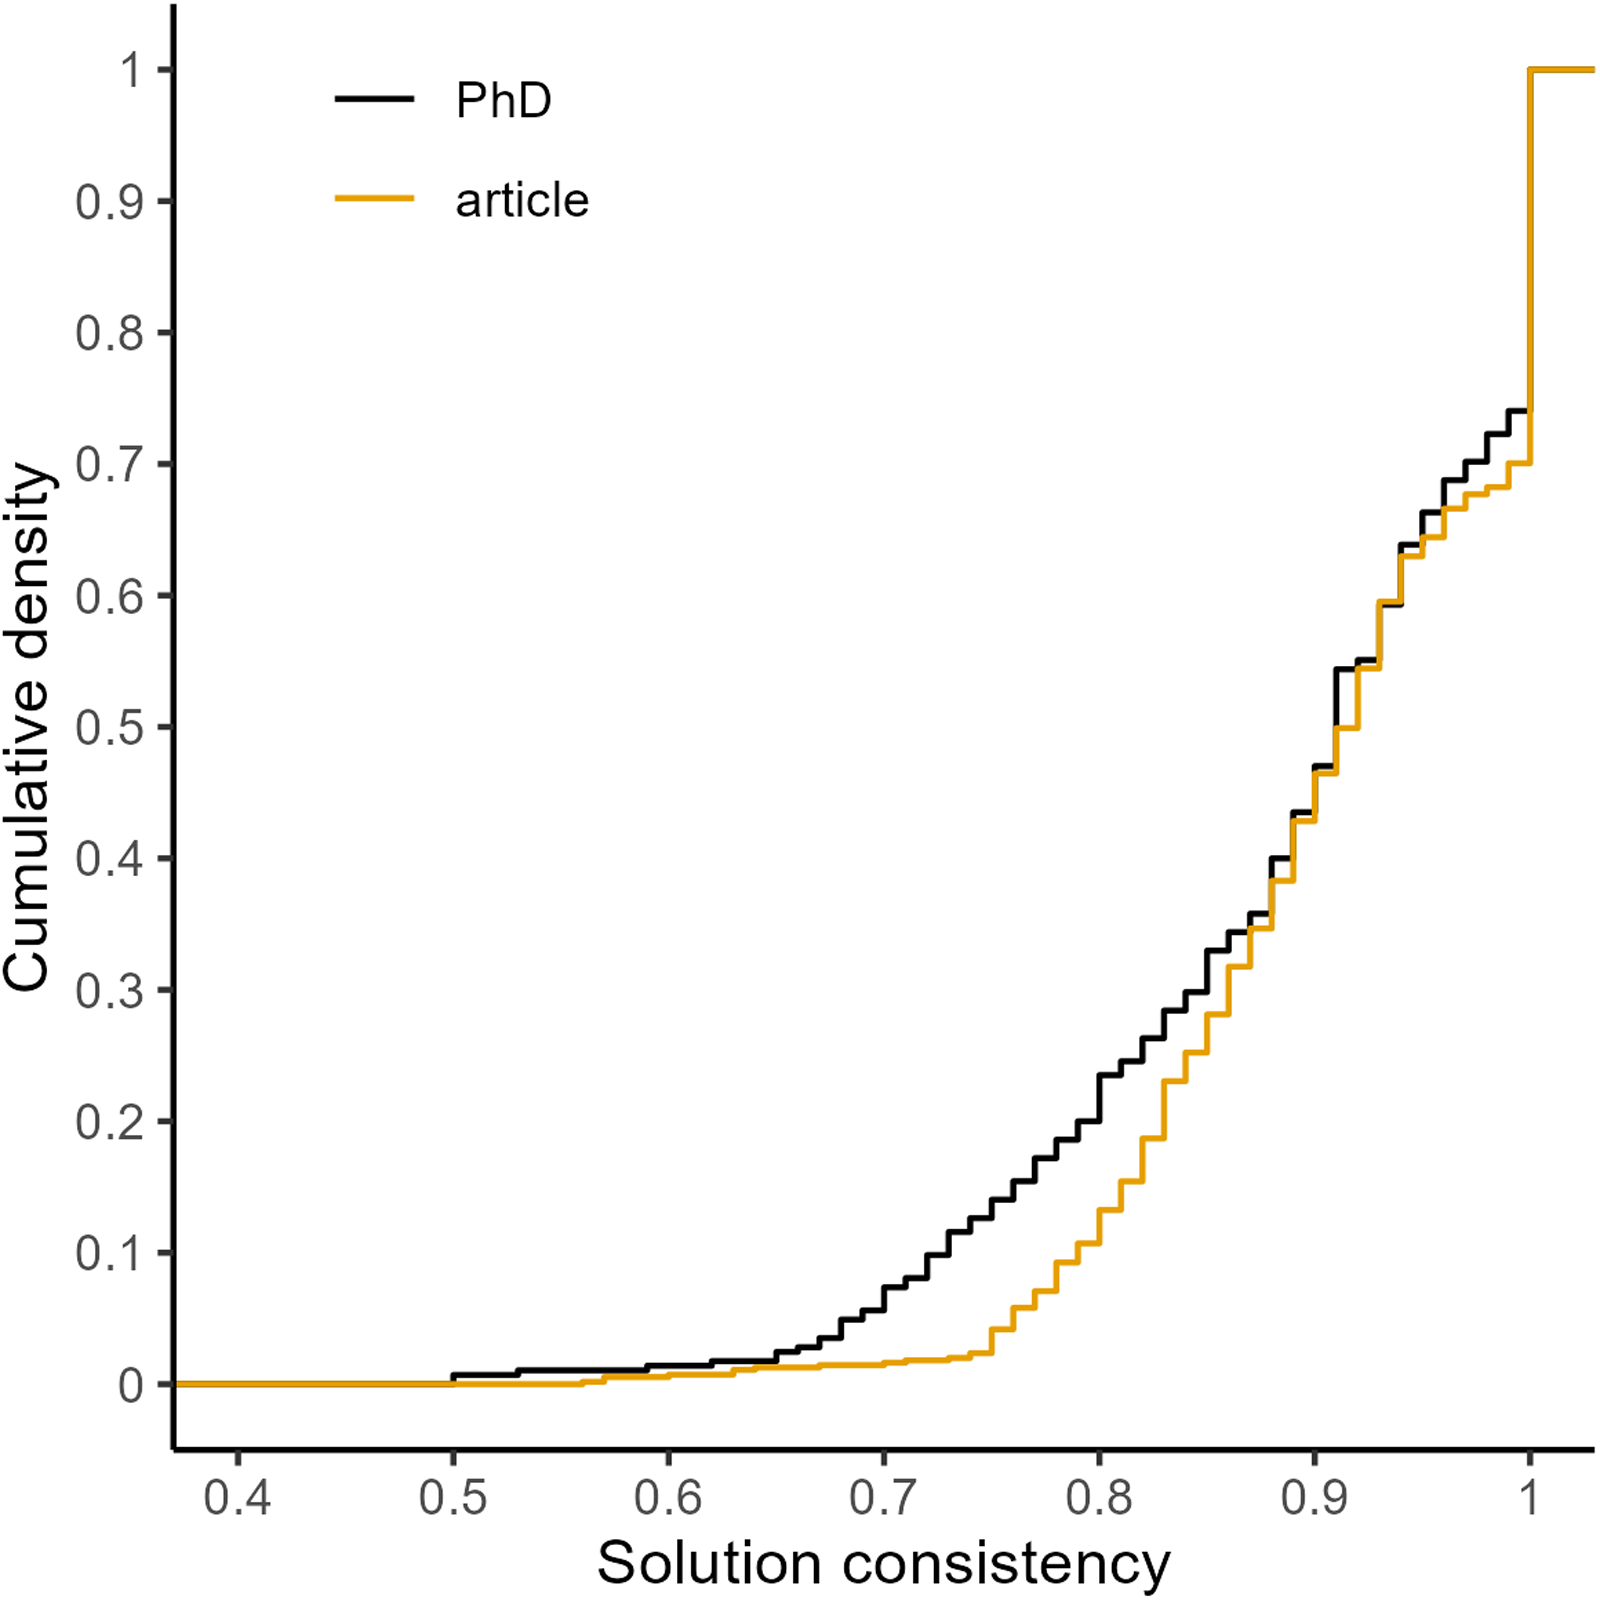
Comparison of empirical cumulative distributions function (ECDF) of articles and PhD theses that test hypotheses.
The analysis of consistency scores for testing PhD theses and their comparison with testing articles support the three observable implications. The share of positive results among all results in PhD theses is larger than the share of positive findings reported in registered reports. However, the positive-results rate is 25 percentage points lower than for articles. The differences between the two forms of hypothesis-testing publications are further indicated by the presence (articles) and absence (PhD theses) of sorting and the differences between their distributions of consistency scores. 29
Conclusion
In this article, I present evidence suggesting that a corpus of hypothesis-testing QCA articles exhibits a positive-results bias. The share of consistent results among all reported solution consistency scores is very high. Locally, one observes a higher share of consistency scores just above the threshold of 0.75 that defines what a consistent finding is in QCA research. These results complement similar findings of positive-results bias in quantitative research, as well as in qualitative case studies and process tracing. The number of inconsistent findings that is either reported formally with a consistency score, or informally by reporting that a result was inconsistent is low compared to the total number of results.
The conclusion that positive-results bias is present does not imply that the findings presented in individual QCA articles are wrong. I take a systemic perspective indicating that the collection of QCA results should be interpreted carefully because a positive-results bias is likely. For the guiding research question, it is irrelevant that the QCA studies have different research questions, use different data and conditions, and so on. While I have not assigned the articles to specific subfields and topics, it is plausible that the total number of hypothesis-testing articles that address the same research question is small. If this is the case, the amount of positive findings is small and would be more easily challenged by one or two negative QCA findings compared to a research field where hundreds or thousands of studies indicate the presence of a relationship.
Besides the possibility that the interpretation of a positive-results bias could be wrong, the study suggests that at least one of three non-exclusive reasons accounts for a bias: the non-submission of negative results; the underreporting or misrepresentation of analysis choices made in a QCA study; the filtering of negative findings by editors and reviewers in the peer-review process. While the reasons of positive-results bias cannot be identified in the present analysis (Brodeur et al. 2023), it seems safe to infer that one should take possible positive-results biases into account when interpreting substantive findings. Positive results are likely to be overreported and to give a biased impression of the state of knowledge on a particular research topic.
The best way to address positive-results bias, regardless of the method that is used, is a change in research norms that value all results and that treat exploratory and confirmatory research as equally valuable. The change of these norms can only be achieved over time and could be supported by the use of tools that aim to diminish bias. Registered reports (RRs), preanalysis plans (PAPs) and preregistration are among the tools that have been proposed for addressing positive-results bias (Christensen et al. 2019:chapters 3, 5, 6; Wuttke 2019). These techniques be used for observational research under specific circumstances (Burlig 2018). If the conditions are met, preregistration should be uncontroversial because the minimum requirement is that one publicly declares that one intends to do a QCA study on a particular topic.
A next step for the meta-scientific study of QCA would be to evaluate whether empirical QCA research can work with RRs and PAPs because they require the specification of what one intends to do. An issue that one would need to address is the relationship between the popular idea that QCA is characterized by a dialogue between theory, design data and findings (Mello 2022:6; Oana et al. 2021:201; Ragin 1987:chapter 9; Ragin 2008:25; Schneider and Wagemann 2012:296), and the requirement of RRs and PAPs that one only works with the data after an initial research plan has been devised.
RRs and PAPs do not deny per se an iterative process involving theory, research design, the data and empirical results. One purpose of RRs and PAPs is to increase the transparency of an empirical analysis by demonstrating to the reader whether a theoretical or conceptual idea, or research design and analysis choice was present or made before or after having processed the data. All choices that precede access to the data are part of the confirmatory analysis, everything that followed belongs to an exploratory analysis (Nosek et al. 2018: 2601; Chambers and Tzavella 2022:29). There are many examples of preregistered statistical analyses that test hypotheses and are complemented by a follow-up exploratory study (Chambers and Tzavella 2022:32; e.g., Weick et al. 2022). Furthermore, RRs and PAPs allow one to preregister a dialogue between theory and evidence, ranging from writing down the general idea of engaging in a dialogue, up to the precise specification of the research design tasks that are subject to an iterative process and its nature.
On a more general level, exploration done in its own right, or based on a failed hypothesis test, plays a valuable role in the research process in general and in QCA particularly. If one engages in an iterative analysis, it is vital to make all parts of the exploratory analysis transparent and to report the choices that yielded positive or negatives results (Freese and Rauf and Voelkel 2022). Full reporting is important to avoid redundancies in the collective research process. When one uses the same data as in another analysis that was either never published, or reports design choices and findings selectively, one runs the risk of making exactly the same choices producing the same negative findings as before.
This shows that a dialogue between theory, data and findings, at the end of which one reports a positive result, is not a problem at all. A problem is the partial disclosure of the analysis and results and the non-reporting of negative findings. Collectively seen, the large share of positive results among all reported findings in QCA research allows for the interpretation that the number of negative results made in QCA research are underreported, as evidenced by the small number of articles that formally or informally report exclusively inconsistent truth table rows or inconsistent solutions. An evaluation of the applicability of RRs and PAPs to QCA research should be open-ended and open-minded. Depending how this relationship is evaluated, the use of these tools, or functional equivalents, of course should not substitute, but complement high-quality QCA research that follows the current standards of good practice (Schneider et al. 2019).
Supplemental Material
sj-pdf-1-smr-10.1177_00491241251357948 - Supplemental material for An Exploration of the Presence of Positive-Results Bias in Qualitative Comparative Analysis
Supplemental material, sj-pdf-1-smr-10.1177_00491241251357948 for An Exploration of the Presence of Positive-Results Bias in Qualitative Comparative Analysis by Ingo Rohlfing in Sociological Methods & Research
Footnotes
Acknowledgments
For collecting data on consistency scores, I am indebted to the following student assistants for collecting and validating data from QCA articles (in alphabetical order): Taiwo Ahmed, Kevin Benger, Dennis Bereslavskyi, Lea Königshofen, Susanne Krenzer, and Fabian Willemsen. I am grateful to Nancy Deyo for text editing. A much earlier version of this work was presented at the ECPR General Conference 2018 in Hamburg, and an Open Science workshop at the University of Mannheim in January 2019. My thanks to the participants who commented on the paper. I am indebted to the comments of four anonymous reviewers.
Declaration of Conflicting Interest
The author(s) declared no potential conflicts of interest with respect to the research, authorship, and/or publication of this article.
Funding
The author(s) disclosed receipt of the following financial support for the research, authorship, and/or publication of this article: This project has received funding from the European Research Council (ERC) under the European Union’s Horizon 2020 research and innovation program (ERC Starting Grant agreement no. 638425).
Data Availability Statement
Supplemental Material
Supplemental material and Appendix for this article are available online.
Notes
Author Biography
References
Supplementary Material
Please find the following supplemental material available below.
For Open Access articles published under a Creative Commons License, all supplemental material carries the same license as the article it is associated with.
For non-Open Access articles published, all supplemental material carries a non-exclusive license, and permission requests for re-use of supplemental material or any part of supplemental material shall be sent directly to the copyright owner as specified in the copyright notice associated with the article.