
Abstract
Researchers are combining self-reports from mobile surveys with passive data collection using sensors and apps on smartphones increasingly more often. While smartphones are commonly used in some groups of individuals, smartphone penetration is significantly lower in other groups. In addition, different operating systems (OSs) limit how mobile data can be collected passively. These limitations cause concern about coverage error in studies targeting the general population. Based on data from the Panel Study Labour Market and Social Security (PASS), an annual probability-based mixed-mode survey on the labor market and poverty in Germany, we find that smartphone ownership and ownership of smartphones with specific OSs are correlated with a number of sociodemographic and substantive variables. The use of weighting techniques based on sociodemographic information available for both owners and nonowners reduces these differences but does not eliminate them.
The advent of smartphones and the rapid expansion of high-speed cellular Internet and Wi-Fi availability allow many people to use the Internet anytime and anywhere. Researchers now can employ smartphones for data collection in large populations using different methods, that is, for mobile web surveys (e.g., Couper, Antoun, and Mavletova 2017; Keusch and Yan 2017), passive mobile data collection of behavioral and digital traces via sensors and apps (e.g., Keusch, Leonard, et al. 2019; Kreuter et al. 2018; Scherpenzeel 2017; Sugie 2018), and data collection through other features of the smartphone such as the built-in camera for taking pictures (e.g., Jäckle et al. 2019; Yan et al. 2017). However, while smartphone penetration is growing, the proportion of smartphone owners in some subpopulations is lower than those in others. Users further differ by the type of smartphone they use and its operating system (OS; i.e., Android, Apple iOS, Windows). OSs vary in the amount and type of data that can be collected on a device, which is a limitation for studies that use sensors and apps to passively measure user behavior. For example, the architecture of the iOS and Windows systems currently do not allow mobile data, such as geolocation, call and text logs, and online browsing behavior, to be passively collected from smartphones with the same level of detail as Android. Even for data that can be collected on all OSs, developing a research app that runs on multiple OSs increases study costs. Thus, it is not surprising that many studies rely on the use of only a single OS (Church et al. 2015). If there are systematic differences between smartphone users and nonusers or users of different OSs in the variable of interest, coverage bias would arise in a study that uses smartphone technology for data collection, meaning certain subgroups of the population are systematically excluded from a sampling frame, and thus, no inference to the general population can be drawn (Groves et al. 2009).
Studying coverage error is not trivial because little to no information about the underrepresented population is available, and in some instances, it is difficult to separate coverage error from nonresponse error (see Eckman and Kreuter [2017] for a recent summary). To study coverage error, one needs auxiliary information (1) on who is and is not covered by a mode or technology and (2) on the variables of interest for both the covered and the noncovered population. To our knowledge, only a small number of studies have explored coverage error when using smartphones for mobile survey data collection (Antoun et al. 2018; Baier, Metzler, and Fuchs 2018; Couper et al. 2018; Fuchs and Busse 2009; Metzler and Fuchs 2014), in part because information on the population is rarely available. To date, no study has specifically assessed the potential for coverage bias when using a specific OS. The study presented in this article is the first to use an administrative population frame and a probability-based survey to assess coverage error and quantify the biases in a group of variables on sociodemographics, behaviors, and attitudes related to employment and poverty due to differences in smartphone ownership and OSs.
Our article extends the existing research on smartphone coverage error in several directions. We address the following specific research questions in Germany: What is the extent of smartphone coverage, Android smartphone coverage, and iPhone coverage in the German residential population aged 15 and older? Does coverage differ for key sociodemographic subgroups? To what extent does coverage affect key substantive outcome variables of the labor market and poverty survey? Can coverage bias be reduced by implementing specific weights that correct for known differences in device ownership?
We begin with a review of the existing literature on smartphone penetration and how the digital divide can lead to coverage error. Recent work has focused on differences between smartphone users and nonusers. Little information is known about whether differences between users of different OSs lead to coverage error as well, and our article extends the research on coverage error in this direction. We then describe the Panel Study Labour Market and Social Security (PASS), an annual mixed-mode survey conducted by the Institute for Employment Research in the German residential population (Trappmann et al. 2019). We explore the potential for coverage error in measures included in PASS when smartphone technology is used in this population. Our study shows that smartphone ownership and ownership of smartphones that operate on a specific OS correlate with sociodemographic as well as substantive variables.
Smartphones and the Digital Divide
Smartphone Penetration
The popularity of mobile devices is reflected in an increase in smartphone penetration in many countries over the last few years. Based on a national telephone survey, Pew Research (2017) estimated that 77 percent of the U.S. adult population owned a smartphone in 2016 and 46 percent owned a smartphone in 2012. Eurostat (2018) reported that in 2011, only 19 percent of Europeans used a smartphone (or another mobile phone) to access the Internet. In 2017, this proportion increased to 63 percent. Mobile Internet access varies considerably by country, and it ranged from 31 percent in Italy to 84 percent in the Netherlands and Sweden in 2017. In Germany, the proportion of people who used a smartphone (or another mobile phone) to access the Internet increased from 15 percent in 2011 to 73 percent in 2017.
Despite the fact that mobile Internet access is increasing, smartphone ownership exhibits large variability across subpopulations, leading to concerns about coverage bias. In 2016, 92 percent of U.S. adults under the age of 30 owned a smartphone, whereas only 42 percent of adults 65 years and older owned a smartphone. Smartphone ownership increases with household income and educational attainment, and U.S. adults living in rural areas are less likely to own a smartphone than are adults living in urban or suburban areas (Pew Research 2017). Similarly, for Germany, Eurostat (2018) data show that the proportion of people who use smartphones to access the Internet decreases with age and increases with educational attainment, household income, and population density. In addition, unemployed Germans are less likely to go online with a smartphone than are employed people.
Using 2007 data from the Eurobarometer, a face-to-face interview survey, Fuchs and Busse (2009) showed not only that smartphone penetration varies across 33 European countries but also that substantial coverage bias toward specific sociodemographic characteristics exists. Overall, the authors found a higher likelihood of smartphone ownership among Europeans who are male, younger, single, and live in nonrural areas and who were older when they obtained their most recent educational degree. An update on this research based on data from Eurobarometer 2013 (Metzler and Fuchs 2014) and 2017 (Baier et al. 2018) confirmed that mobile Internet access had increased in Europe. This trend leads to a moderate reduction in bias toward specific sociodemographic characteristics, and the level of coverage bias for mobile Internet converges toward that for landline Internet. In summary, studies comparing smartphone owners and nonowners, including individuals who own regular, nonsmartphone cell phones, confirm that a digital divide that is driven by sociodemographic differences in age, education, income, and employment status exists (Fortney et al. 2011; Park and Lee 2015).
While standard weighting procedures can account for differences in observed sociodemographics between covered and uncovered members of a population (Valliant, Dever, and Kreuter 2013), for users and nonusers of smartphones, there are concerns that many unobserved variables such as behaviors and attitudes will not be accounted for by weighting of sociodemographics. To date, only a few studies have examined the effect of smartphone coverage bias on substantive topics. First, Antoun et al. (2018) used data from the probability-based Longitudinal Internet Studies for the Social sciences (LISS) web panel in the Netherlands in 2013 to assess the influence of smartphone ownership on coverage bias before and after controlling for sociodemographic variables. Out of 19 substantive variables on technology, lifestyle, and politics, eight showed significant coverage bias. Two of these eight variables were associated with coverage even after sociodemographic controls were applied, indicating that weighting techniques based on sociodemographic information do not account for bias in these substantive measures. Smartphone owners were more likely to prefer using a tablet to go online and were more likely to report eating out in restaurants at least once per month compared to those who did not own a smartphone. The authors also found that coverage error was the largest contributor to total survey error, compared to nonresponse and measurement error.
Second, Couper et al. (2018) estimated smartphone ownership in the population of the National Survey of Family Growth (NSFG), a U.S. national probability face-to-face survey with a repeated cross-sectional sample of females and males aged 15–44. Based on NSFG data from 2012 to 2016, 81.6 percent of the study population had a smartphone. In terms of the sociodemographic variables, the authors found that teenagers were less likely to own a smartphone than were older groups of individuals, and married people and people without children were more likely to own a smartphone than were unmarried people and people with children, respectively. Confirming the findings from Pew Research (2017), urbanicity, income, and educational attainment were also significantly correlated with smartphone ownership. In terms of substantive measures from the NSFG, the authors found few consistent effects after controlling for demographics, and for most of the demographic variables, the bias was relatively small. In particular, core NSFG measures on divorce, cohabitation, and various dimensions of fertility behaviors were not strongly associated with smartphone coverage. For attitudinal questions, the bias introduced by smartphone coverage never exceeded 2.5 percentage points.
Lane and Manner (2011) found in a volunteer sample of 312 cell phone owners that smartphone owners reported higher levels of extroversion than did owners of nonsmartphone cell phones, but the authors reported that there were no differences between groups in the other four traits of the Big Five personality model. Park and Lee (2015) surveyed 395 undergraduate students and found that those owning a smartphone were more likely to be early adopters of digital technologies, reported having a significantly higher number of online friends and online-only friends, and reported more social engagement and political empowerment than nonowners.
Based on this evidence from previous studies, we expect to find a similar digital divide between owners and nonowners of smartphones in a population-based study on labor market activities and poverty in Germany, particularly in measures related to age, education, income, and employment status. In addition, we anticipate that coverage bias will extend to attitudinal measures even after the models are adjusted for observed sociodemographic differences between owners and nonowners.
Differences Between Owners of Smartphones Based on the OSs
Given that many smartphone studies run on only one OS (Church et al. 2015), it is worth investigating error that might arise from different types of OSs, particularly given the large price differential usually associated with the different OSs. We are not aware of any surveys that estimate the penetration of smartphones with different OSs in the general population. The only figures available on this topic are market shares. According to Kantar (2017), 83.2 percent of newly sold smartphones in Germany between August and October 2017 were Android devices, and 14.9 percent were Apple iPhones. However, these numbers reflect new sales only and thus do not necessarily provide a good estimate for the total user population.
Currently, there are no studies based on probability samples that have estimated coverage bias that stems from owning a smartphone with a specific OS. Several studies used volunteer samples to compare the characteristics of owners of different smartphones, and the results indicated that individuals who own Apple iPhones and those who own Android smartphones are indeed different groups of people. In terms of sociodemographic characteristics, several studies found that iPhone owners are younger (Pryss et al. 2018; Shaw et al. 2016) and more likely to be female than are Android smartphone owners (Götz, Stieger, and Reips 2017; Shaw et al. 2016; Ubhi et al. 2017).
Another consistent finding is that owners of smartphones with different OSs seem to differ in terms of their financial resources. iPhone owners reported having larger monthly budgets available (Götz et al. 2017) and spending more money on various categories of monthly expenses such as clothing, makeup and beauty products, and tech-related purchases compared to Android smartphone owners (Schmall 2018; Yarrow 2013). In contrast, Android smartphone owners are more likely to consider themselves a frugal person and to look for deals and discounts often (Schmall 2018). These findings are consistent with the price difference between Android smartphones and iPhones.
In addition, some studies have found differences in personality and attitudes of smartphone owners depending on the smartphone OS (see Götz et al. [2017] for an exception). For example, Shaw et al. (2016) reported that Android users displayed higher levels of honesty-humility, openness, and avoidance similarity, and they scored lower in emotionality than did iPhone owners. Schmall (2018) reported of a study that found that iPhone owners more often state that they like being the center of attention and are more likely to be very happy with their life in general and their current job in particular. In the same study, iPhone owners considered themselves more personable and sociable than Android users, and they reported having more close friends and being more active and social on weekends.
Finally, Shaw et al. (2016) found that Android smartphone owners felt that their smartphone was less of a status object than iPhone owners did. In summary, these findings on differences in the personalities of smartphone owners are in line with the personality of the Apple brand, which focuses on nonconformity, innovation, and creativity as well as belonging to a social elite (Dissanayake and Amarasuriya 2015; Götz et al. 2017).
Based on these findings in the literature, we expect to see differences between people who own smartphones that run on different OSs, especially in age and socioeconomic status, as well as in attitudinal measures, even after controlling for sociodemographic differences. We used data from the PASS in Germany, which is described in the next section, to study coverage error when smartphones are used for collecting data on labor market activities and poverty.
PASS
PASS is a yearly household panel survey conducted in the residential population in Germany (Trappmann et al. 2019). The main purpose of PASS is to create a data source for evaluating labor market and welfare state reforms and for enabling longitudinal research on the labor market and on poverty in Germany. The initial residential population sample was drawn from an address register of a commercial supplier (Rudolph and Trappmann 2007) with refreshments drawn from municipal registers before waves 5 and 11. Welfare benefit recipient households are oversampled based on national benefit recipient registers. PASS is conducted as a mixed mode survey utilizing Computer-Assisted Personal Interviewing (CAPI) as the main mode and Computer-Assisted Telephone Interviewing (CATI) as a follow-up mode for initial nonresponders. 1 However, the mode that was successful in the previous wave becomes the mode that is initially used in the following wave (Trappmann, Müller, and Bethmann 2013).
Each head of a household is asked to participated in a 15-minute household-related interview about topics such as household composition, dwelling, childcare, benefit receipt, household income, and deprivation. Subsequently, every household member aged 15 and older is asked to complete a 30-minute person-related interview on topics such as job searching and labor market participation, job quality, social inclusion, attitudes, and personality traits (Beste et al. 2013).
PASS provides a set of weights that allows researchers to weight all interviewed households and persons in a given wave to all households and persons in Germany at that time (Trappmann 2013). Detailed information on sampling and weighting can be found in the yearly data reports (for Wave 11, see Berg et al. 2018) and methods reports (for Wave 11, see Jesske and Schulz 2018). For the remainder of this article, the “standard PASS weights” always correspond to these PASS weights. 2
Methods and Data
Between February and September 2017, 13,703 individuals in 9,420 households were interviewed as part of PASS Wave 11. The personal questionnaire included two questions about smartphone ownership (see Figure 1).
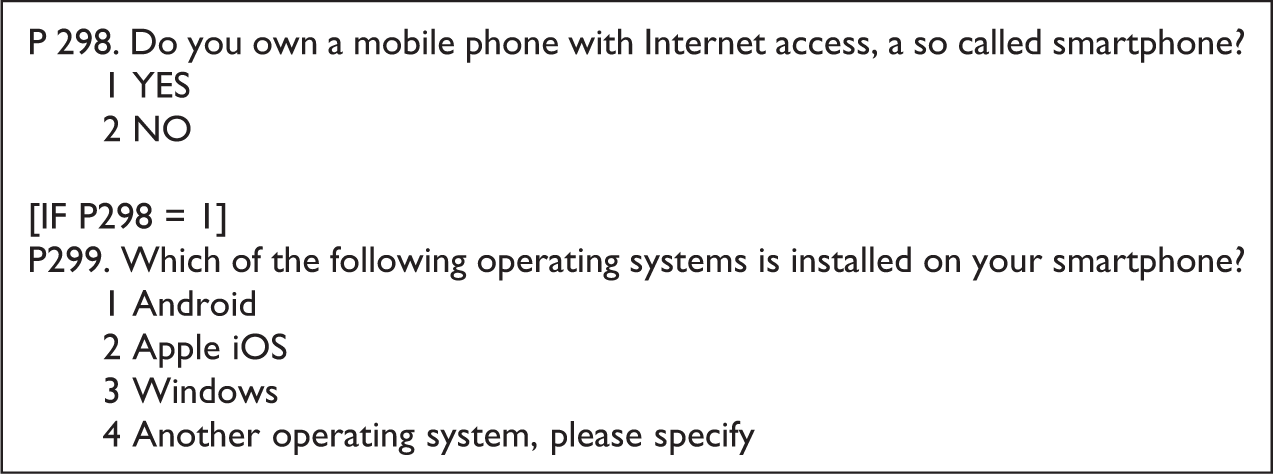
Questions on smartphone ownership and operating system in Panel Study Labour Market and Social Security Wave 11 (original questions are in German).
Based on these two questions, we assess coverage error in the German residential population aged 15 and older regarding (1) smartphone ownership, (2) Android smartphone ownership, and (3) iPhone ownership, first with an overall estimate of smartphone ownership and ownership of different OSs. We then consider (a) key sociodemographic variables that are assessed in previous research on smartphone coverage (Antoun et al. 2018; Baier et al. 2018; Couper et al. 2018; Fuchs and Busse 2009; Metzler and Fuchs 2014; Pew Research 2017) and are traditionally used when calculating weights for data from general population surveys. For Germany and the PASS, these sociodemographic weighting variables include age, sex, educational attainment, nationality, region, and community size. For each of these sociodemographic weighting variables, we assess differences in smartphone ownership, Android smartphone ownership, and iPhone ownership. Next, we consider substantive measures collected as part of PASS. We assess (b) other sociodemographic variables collected as part of PASS that are usually not available for weighting in Germany, such as marital status, household size, and the prevalence of individuals who live with their own children in the household. We then consider (c) substantive measures related to employment and poverty, that is, household income, employment status, working hours, welfare receipt, and deprivation. 3 Finally, we assess (d) attitudinal measures on different aspects of life satisfaction 4 (i.e., life in general, health, housing, living standards) and self-efficacy 5 as well as (e) measures of social embeddedness, that is, personal network size and social inclusion. 6 Table 1 presents all variables used in our analysis and how they were operationalized. The exact wording for the original items can be found at http://fdz.iab.de/en/FDZ_Individual_Data/PASS.aspx.
Variables Used to Assess Bias Due to Smartphone, Android Smartphone, and iPhone Coverage in Panel Study Labour Market and Social Security Wave 11.
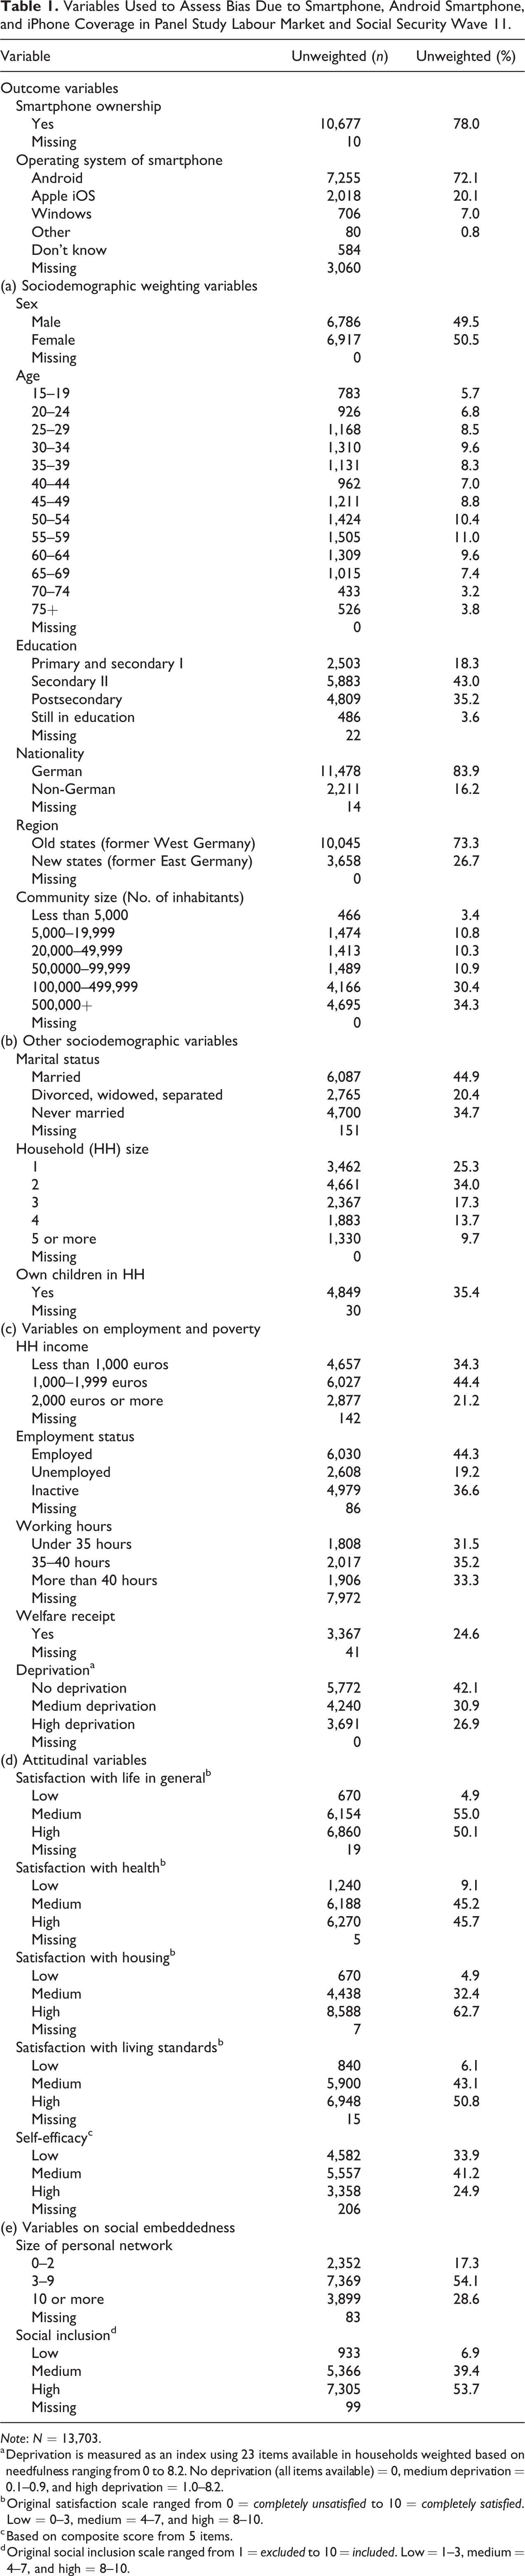
Note: N = 13,703.
a Deprivation is measured as an index using 23 items available in households weighted based on needfulness ranging from 0 to 8.2. No deprivation (all items available) = 0, medium deprivation = 0.1–0.9, and high deprivation = 1.0–8.2.
b Original satisfaction scale ranged from 0 = completely unsatisfied to 10 = completely satisfied. Low = 0–3, medium = 4–7, and high = 8–10.
c Based on composite score from 5 items.
d Original social inclusion scale ranged from 1 = excluded to 10 = included. Low = 1–3, medium = 4–7, and high = 8–10.
To assess the influence of smartphone, Android smartphone, and iPhone coverage on the substantive PASS measures, we produce estimates for the 15 substantive PASS variables (variable groups [b] through [e] in Table 1). We produce the estimates by following multiple steps: First, we estimate these outcomes based on the full PASS sample using the standard PASS weights (see Trappmann 2013). This procedure provides unbiased population estimates of the core outcomes of the PASS. Second, we estimate the same outcomes based on all smartphone owners, all Android smartphone owners, and all iPhone owners in our sample, again using the standard PASS weights. This provides estimates that we would obtain if we collected these measures based on samples of smartphone owners or owners of a smartphone with a specific OS, without specifically correcting for sociodemographic differences due to smartphone ownership or ownership of smartphones with a specific OS. Finally, to account for the fact that smartphone ownership and ownership of Android smartphones and iPhones varies substantially by sociodemographic variables, we estimate the 15 substantial PASS outcomes based on all smartphone owners, all Android smartphone owners, and all iPhone owners in our sample, but this time we adjust the standard PASS weights. To this end, we specify three models predicting smartphone ownership and ownership of a smartphone with a specific OS: one model with a binary dependent variable for owning a smartphone (vs. not owning a smartphone), one model with a binary dependent variable for owning an Android smartphone (vs. owning a smartphone with a different OS or not owning a smartphone at all), and one model with a binary dependent variable for owning an iPhone (vs. owning a smartphone with a different OS or not owning a smartphone at all). Each of the models uses the six sociodemographic weighting variables (i.e., age, sex, educational attainment, nationality, region, and community size) as predictors. We then create deciles for the predicted probabilities, and we multiply the inverse of the decile group means with the standard PASS weights. The product of this operation is what we refer to as the “adjusted PASS weights.”
To determine the magnitude of coverage bias in the substantive PASS variables, we follow the same approach as Couper et al. (2018) and estimate the difference between the full sample (f) and the sample covered (c) by smartphones, Android smartphones, and iPhones as

Next, we calculate the standard error of the estimated bias as

To test the significance of a given bias, we use a z-test. To calculate a test statistic, we divide the estimate of the difference by the standard error of the difference.
For all our analyses, we report estimates based on complete data and use case-wise deletion for multivariate models. We use Stata 15.1 with the svy command when applying weights in our analysis, thereby accounting for clustering and stratification of the survey design when estimating the standard errors.
Results
What Is the Extent of Smartphone Coverage, Android Smartphone Coverage, and iPhone Coverage in the German Residential Population Aged 15 and Older?
Based on the weighted estimates from PASS Wave 11, 75.8 percent of German residents aged 15 and older own a smartphone. Regarding the specific OS, 49.0 percent of German residents aged 15 and older own a smartphone with the Android OS, 16.7 own an iPhone, 5.4 own a Windows smartphone, and 0.7 percent own a smartphone that runs on another OS. Approximately 4 percent do not know on which OS their smartphone is operating. Due to the extremely small penetration of smartphones operating on platforms other than Android and iOS, we did not consider them individually for further analyses.
Does Coverage Differ for Key Sociodemographic Subgroups?
Table 2 presents weighted estimates (using standard PASS weights) of coverage rates for all smartphone owners, Android smartphone owners, and iPhone owners in Germany by key sociodemographic characteristics. Here, we include only variables for which information is available on the general population in Germany and that can thus be used for weighting (“sociodemographic weighting variables”). We test for significant differences in these characteristics using design-adjusted Rao-Scott chi-square tests.
Weighted Estimatesa, Standard Errors, and p-Values From Rao-Scott Chi-Square Tests Comparing Smartphone, Android Smartphone, and iPhone Coverage Rates by Sociodemographic Indicators From Panel Study Labour Market and Social Security (PASS) Wave 11.
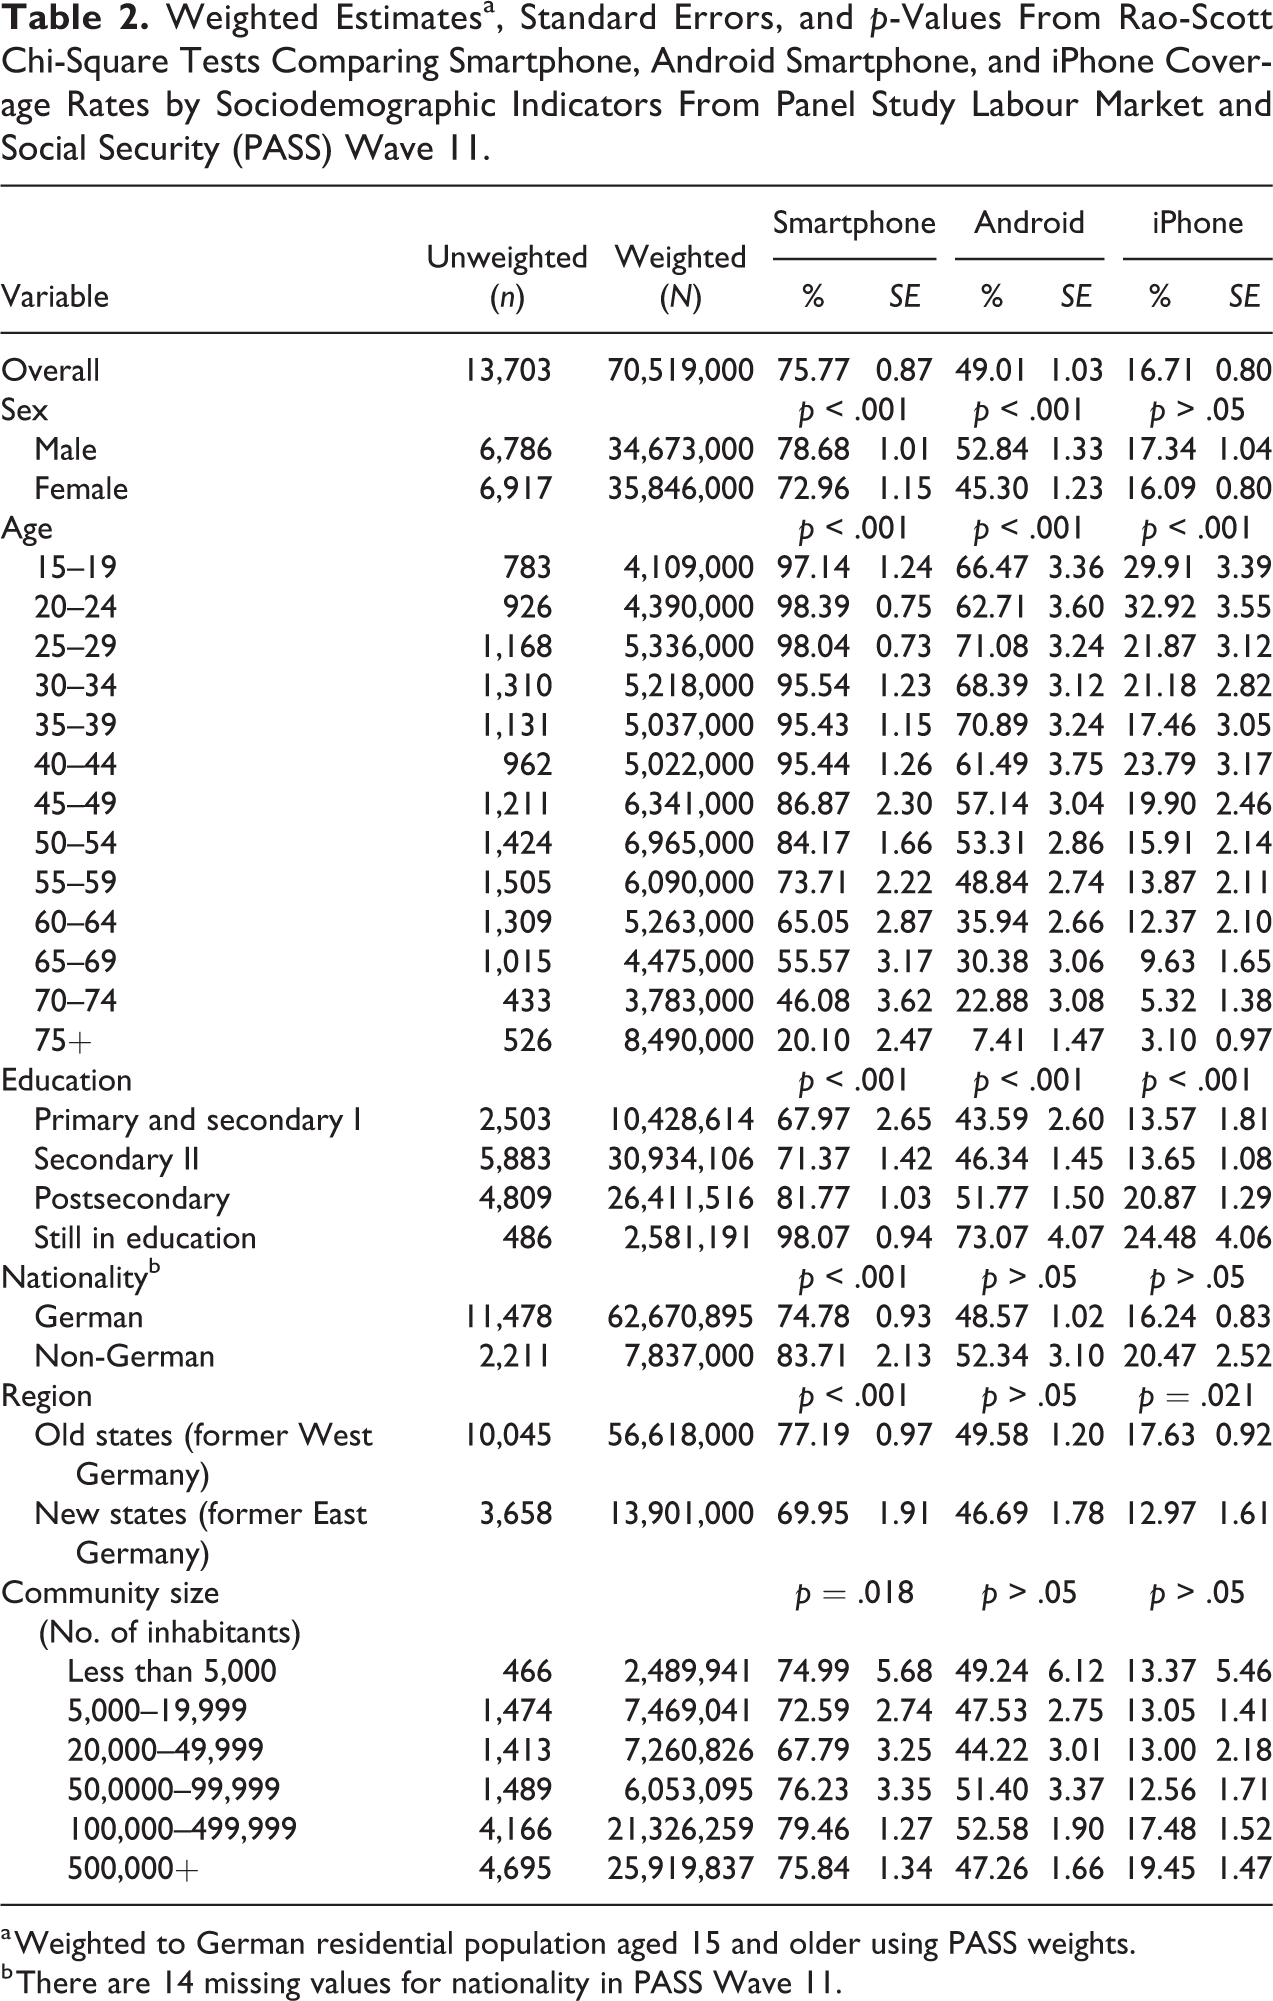
a Weighted to German residential population aged 15 and older using PASS weights.
b There are 14 missing values for nationality in PASS Wave 11.
From Table 2, we see that smartphone ownership and iPhone ownership do significantly differ by sex; 78.7 percent of male German residents aged 15 and older reported that they own a smartphone, while only 73.0 percent of female German residents aged 15 and older reported that they own a smartphone. Males (52.8 percent) are also significantly more likely to own an Android smartphone than are females (45.3 percent), while there is no significant difference between genders in iPhone ownership. Regarding age, while smartphone ownership is relatively consistent and remains above 95 percent for German residents under the age of 45, the likelihood of smartphone ownership drops significantly and substantially for older age groups. For example, fewer than 5 out of 10 German residents aged 65–69 and only approximately only 2 out of 10 aged 75 and older own a smartphone. While a similarly sharp decrease in ownership for older age groups can be observed for Android users, Android smartphone ownership peaks between ages 25 and 39 at approximately 70 percent. However, teenagers and young adults under the age of 25 are overrepresented among iPhone owners, with approximately 30 percent iPhone ownership in this age-group. Figure 2 shows the relationship between age groups and smartphone ownership as well as between age groups and OS ownership based on a locally weighted scatter-plot smoother regressions.
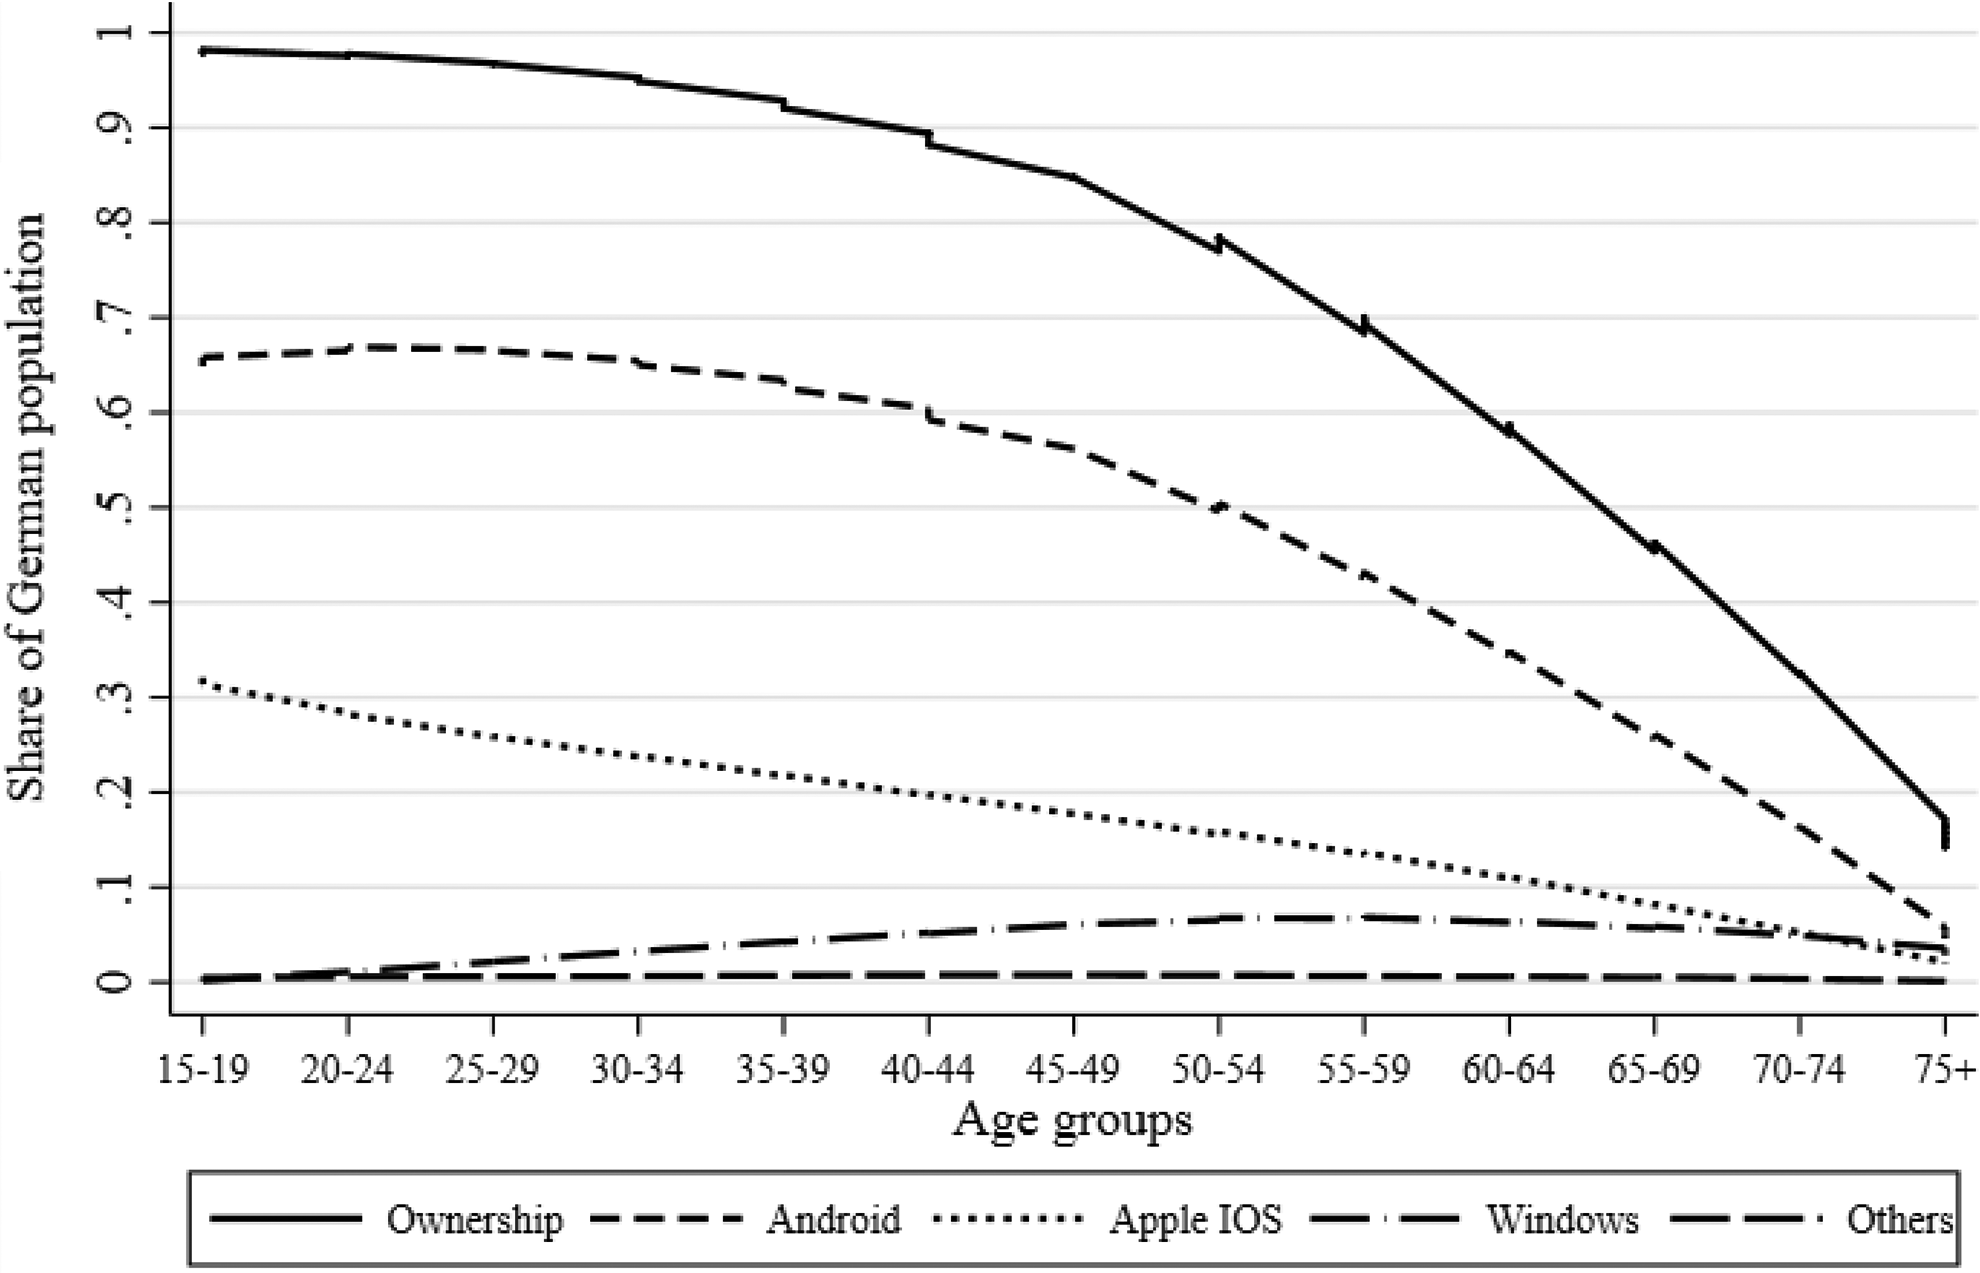
Smartphone ownership and operating system ownership by age groups.
Smartphone, Android smartphone, and iPhone ownership significantly increase with the level of education; 81.8 percent of the German residential population with a postsecondary degree own a smartphone, 51.8 percent own an Android smartphone, and 20.9 percent own an iPhone, while less than 70, 44, and 14 percent of German residents with a low level of formal education own a smartphone, an Android smartphone, and an iPhone, respectively. Smartphone, Android smartphone, and iPhone ownership are highest among individuals currently pursuing a degree. Given that people pursuing a degree tend to be younger, this result is not surprising.
Smartphone ownership is also significantly associated with nationality; the proportion of German citizens who are smartphone owners (74.8 percent) is smaller than that of non-German citizens (84.7 percent). However, the association between Android smartphone and iPhone ownership and nationality is not significant (p > .05).
Smartphone ownership also significantly differs by region. While 77.2 percent of German residents aged 15 and older living in one of the “Alte Bundesländer” (Old States) of former West Germany own a smartphone, only 70.0 percent of people living in one of the “Neue Bundesländer” (New States) of former East Germany own a smartphone. A similar trend can be observed for iPhone ownership (West: 17.6 percent, East: 13.0 percent), but the association between region and Android smartphone ownership is not statistically significant (p > .05).
Finally, smartphone ownership in Germany increases with community size. In cities with a population of more than 50,000, the proportion of smartphone owners is higher than 75 percent, while in smaller communities, smartphone ownership is significantly lower. A similar trend can be observed for iPhone ownership, but this association is not statistically significant (p > .05). For Android ownership, there seems to be no clear pattern in ownership by community size (p > .05).
To What Extent Does Coverage Affect Key Substantive Outcome Variables of a Labor Market and Poverty Survey?
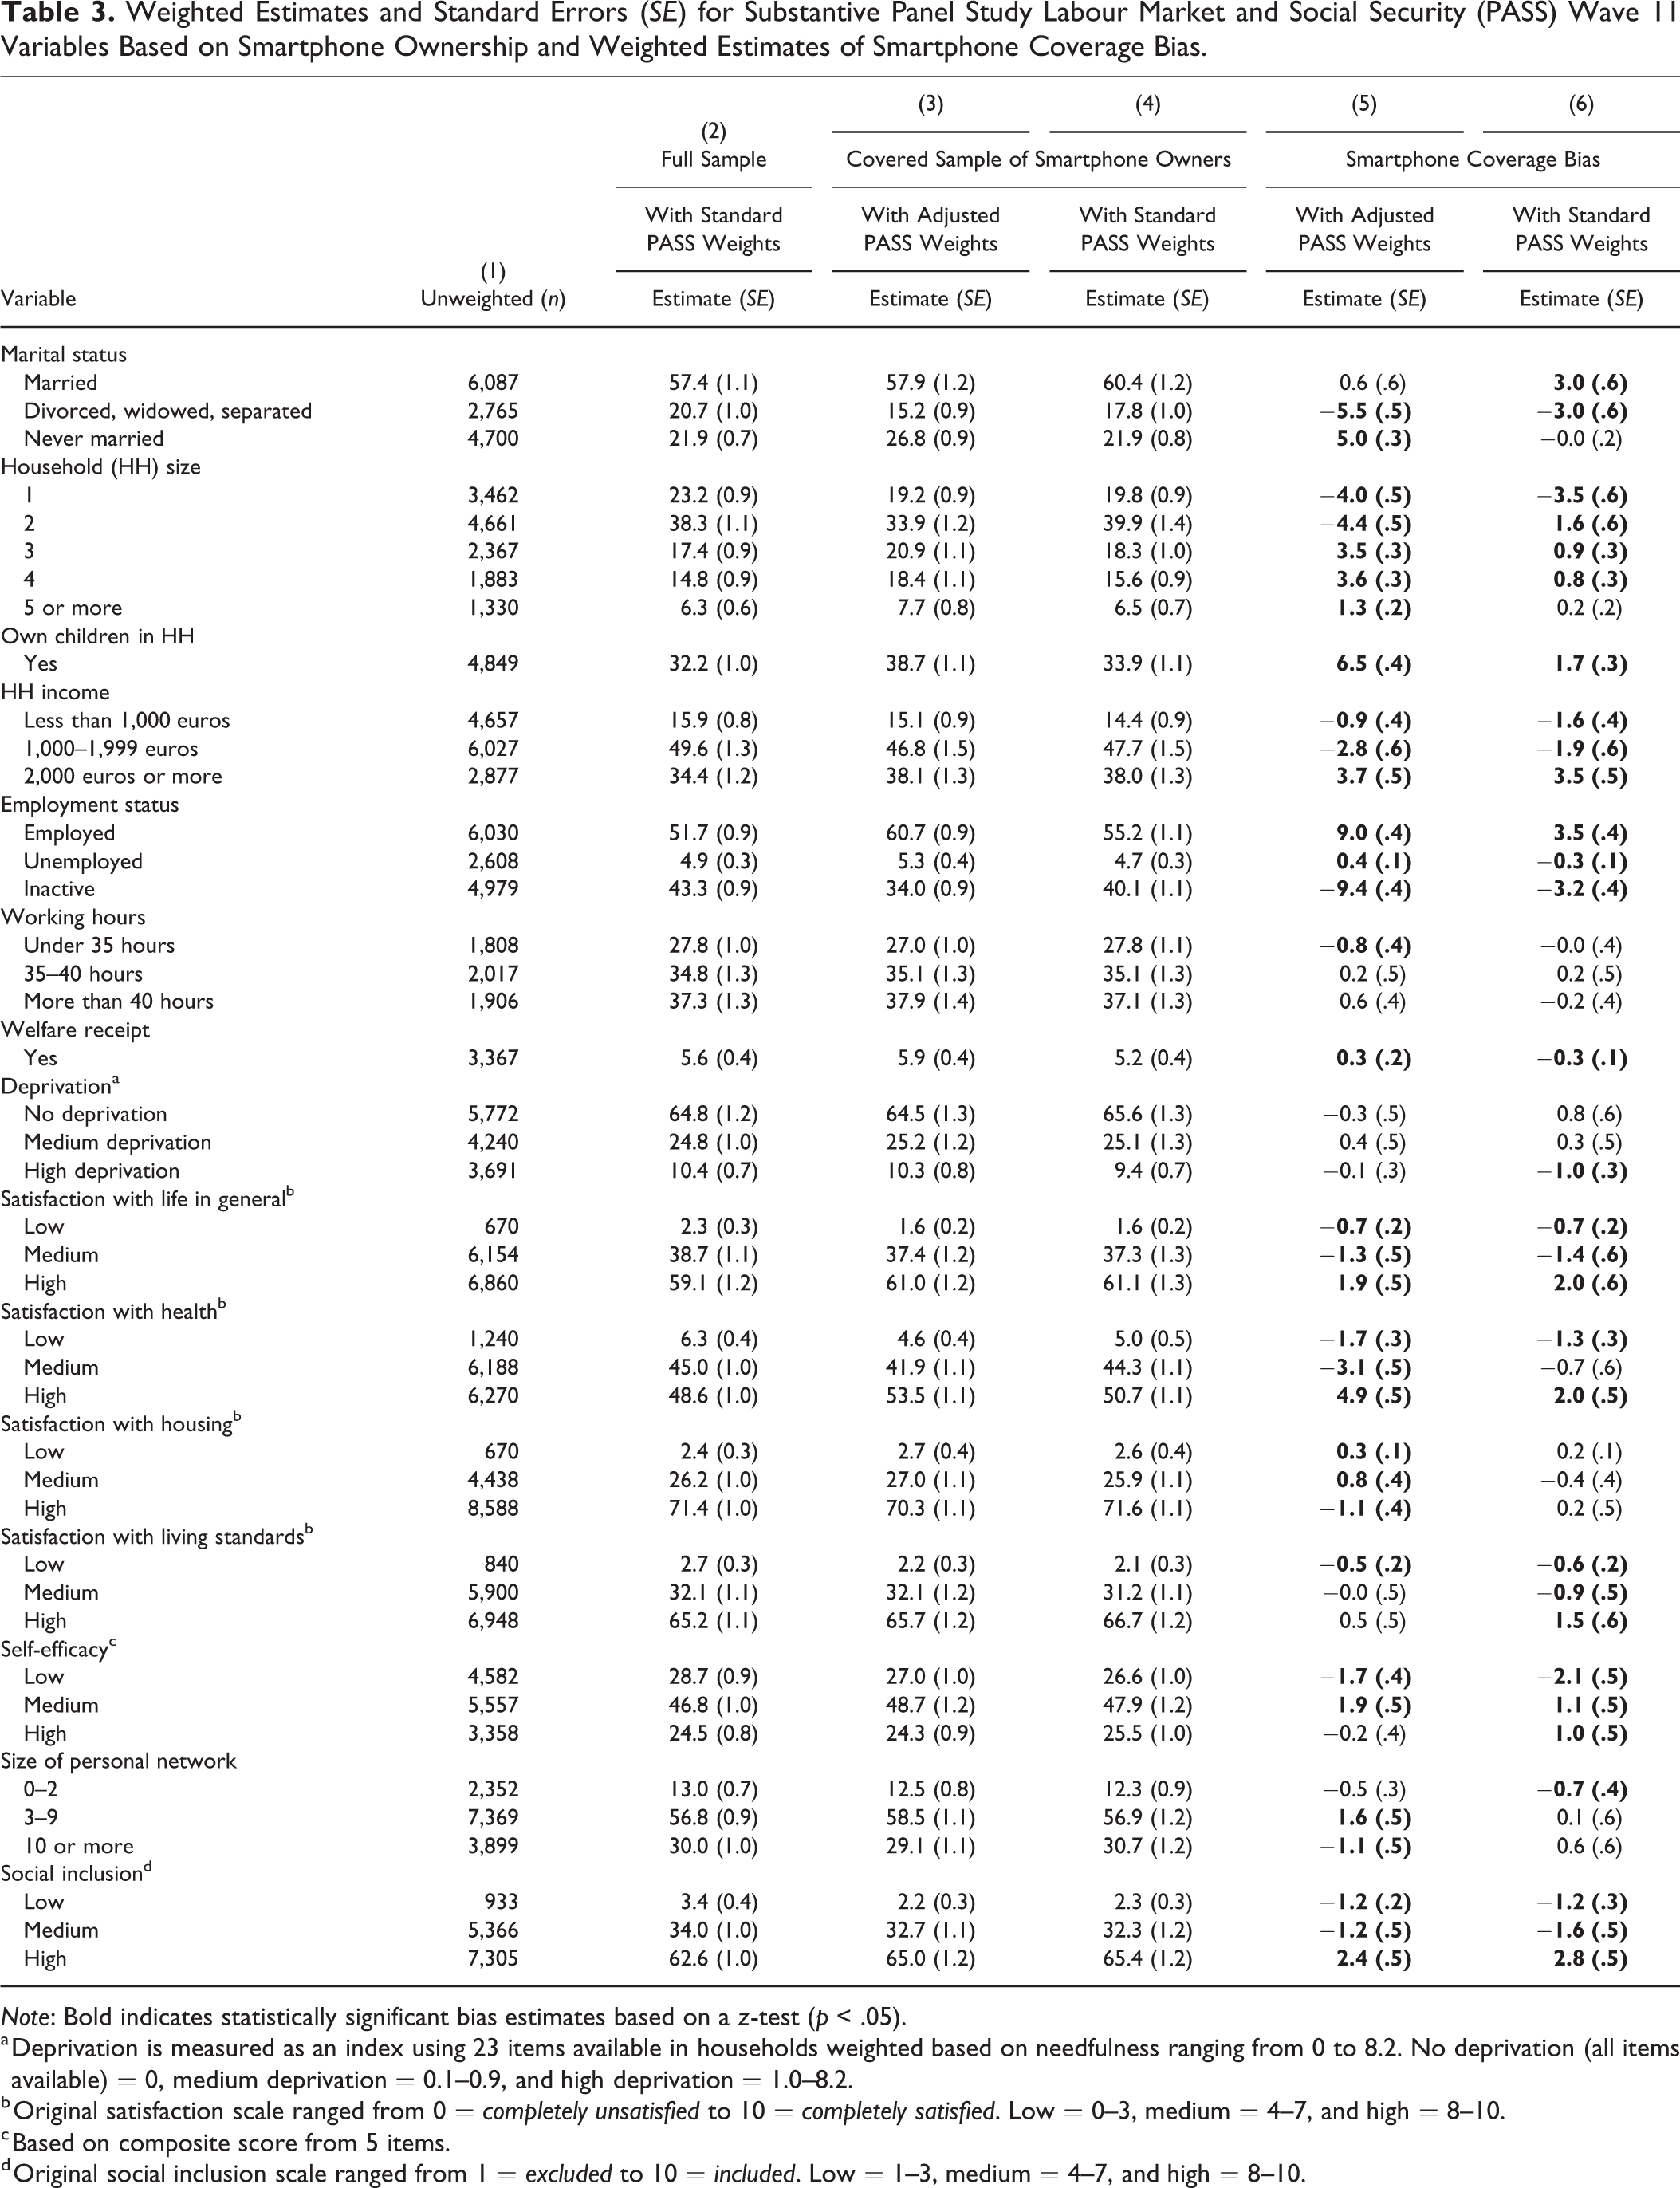
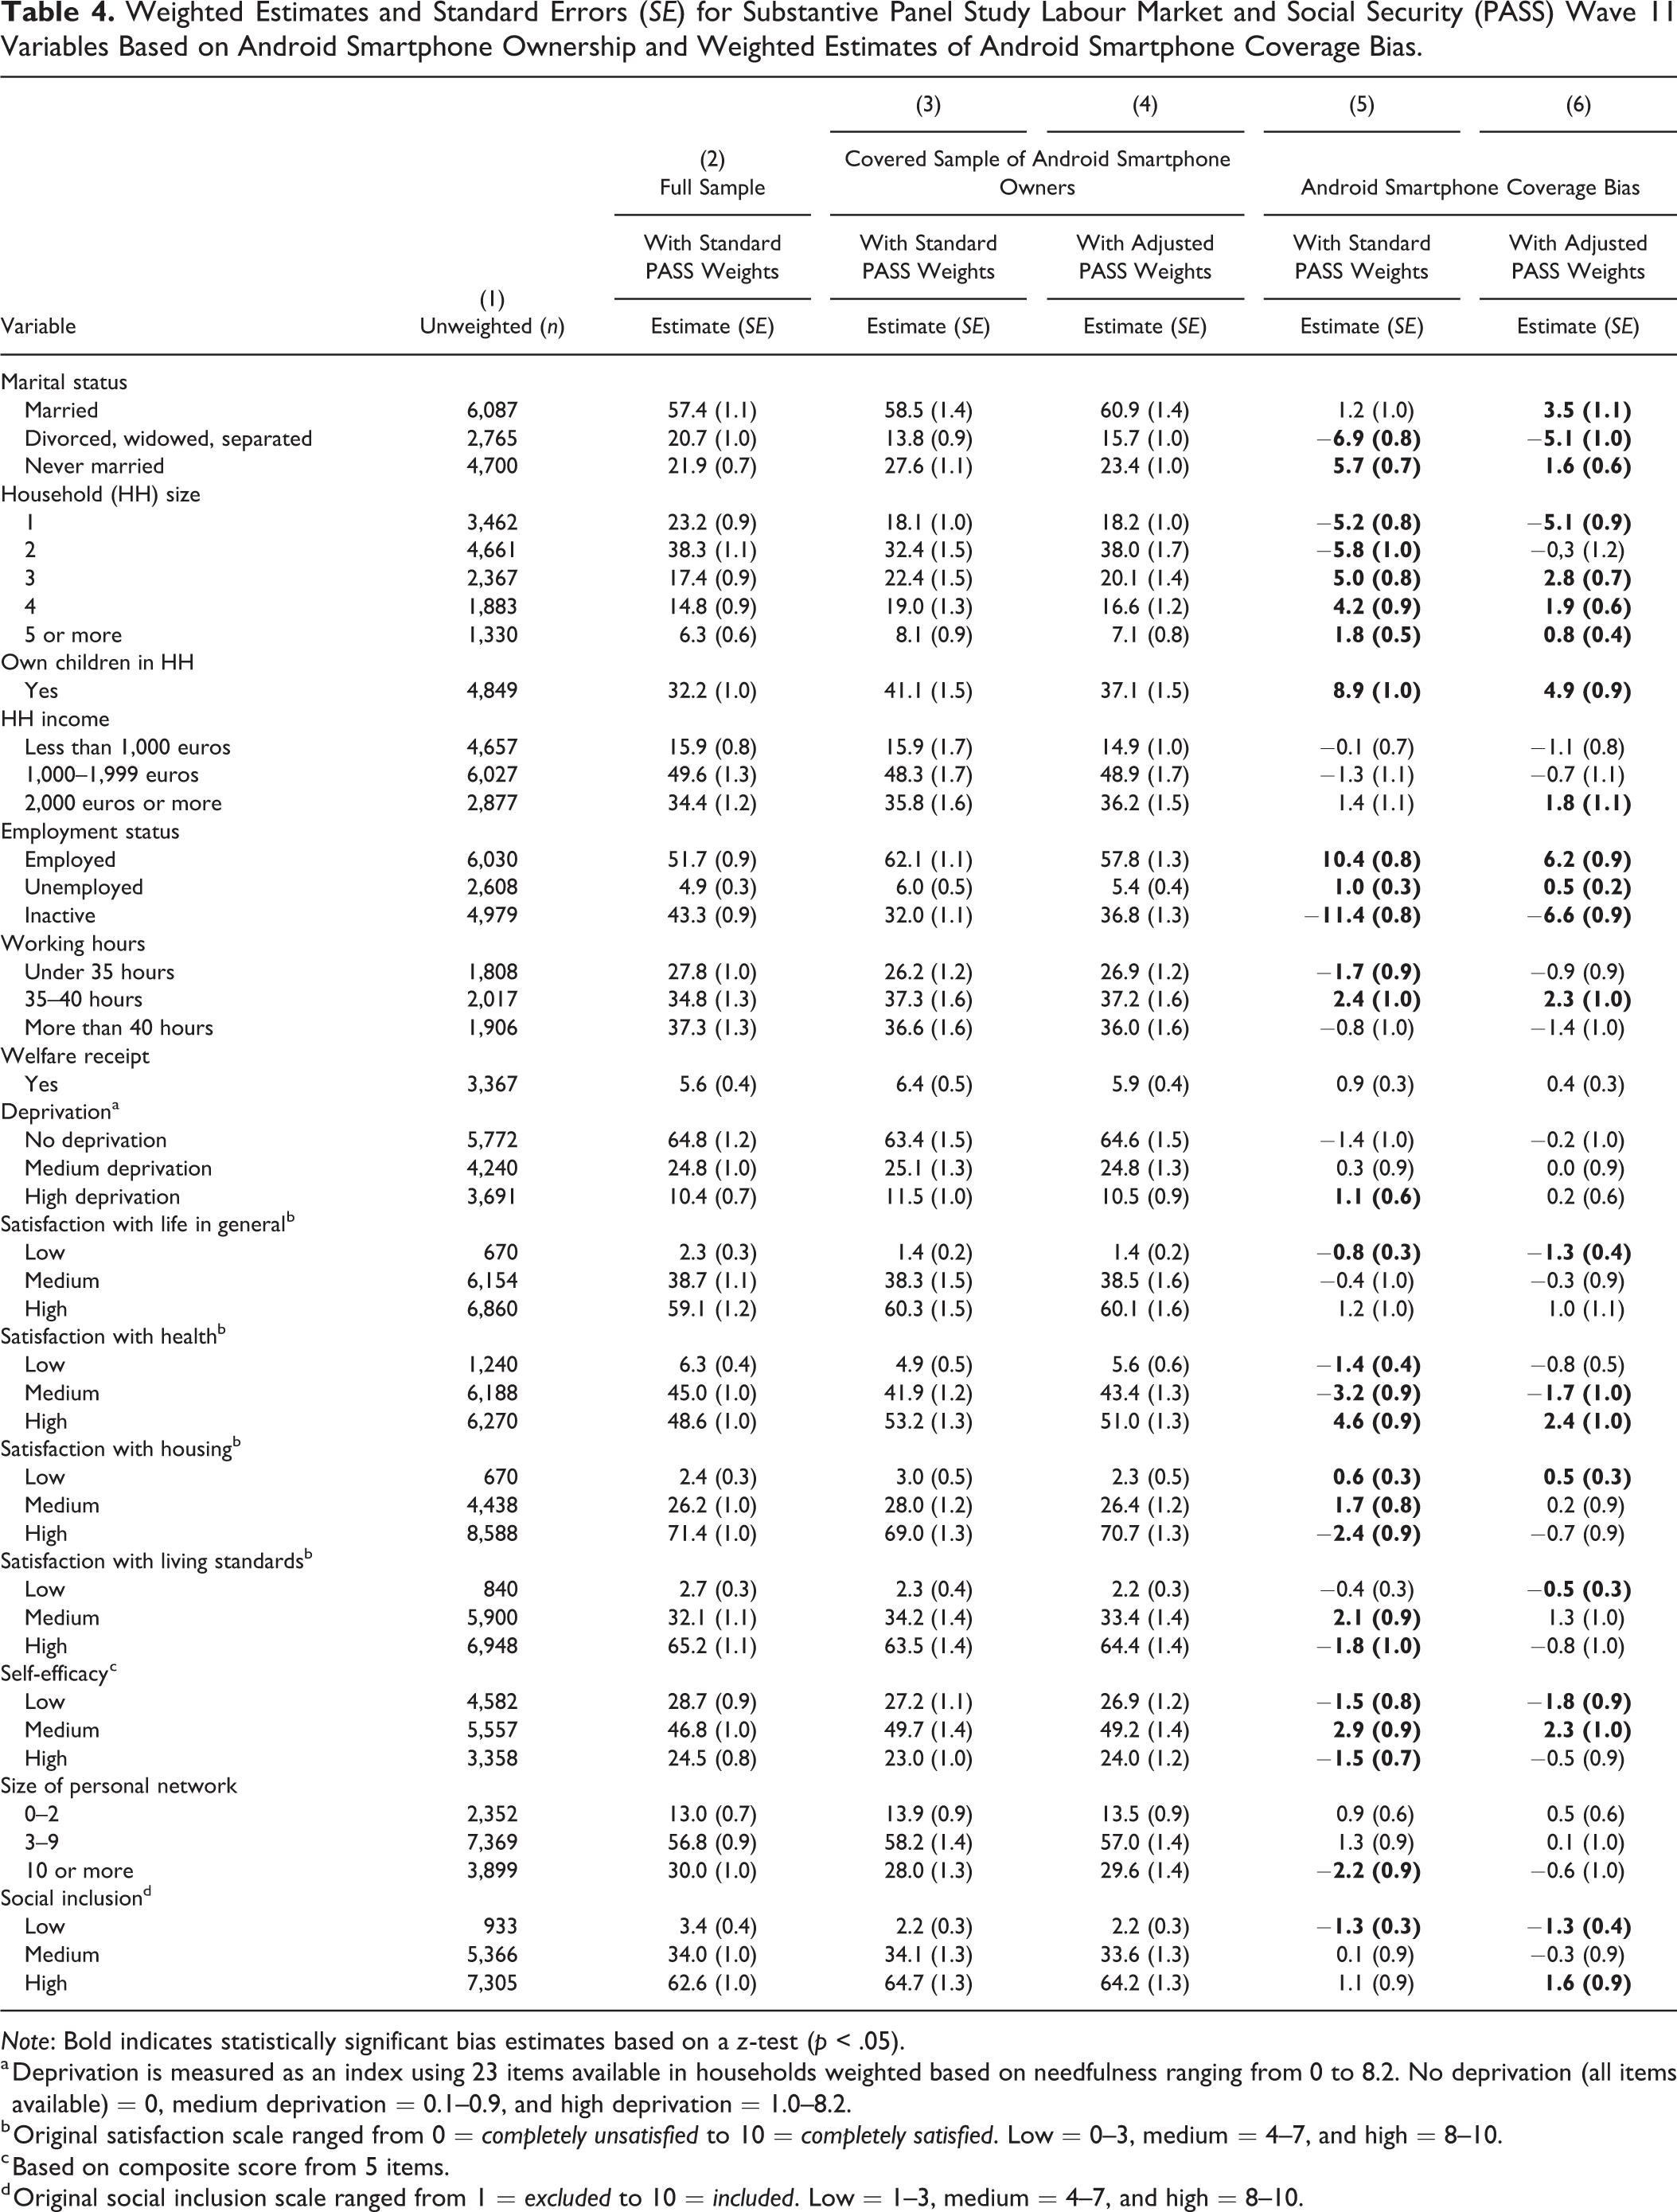
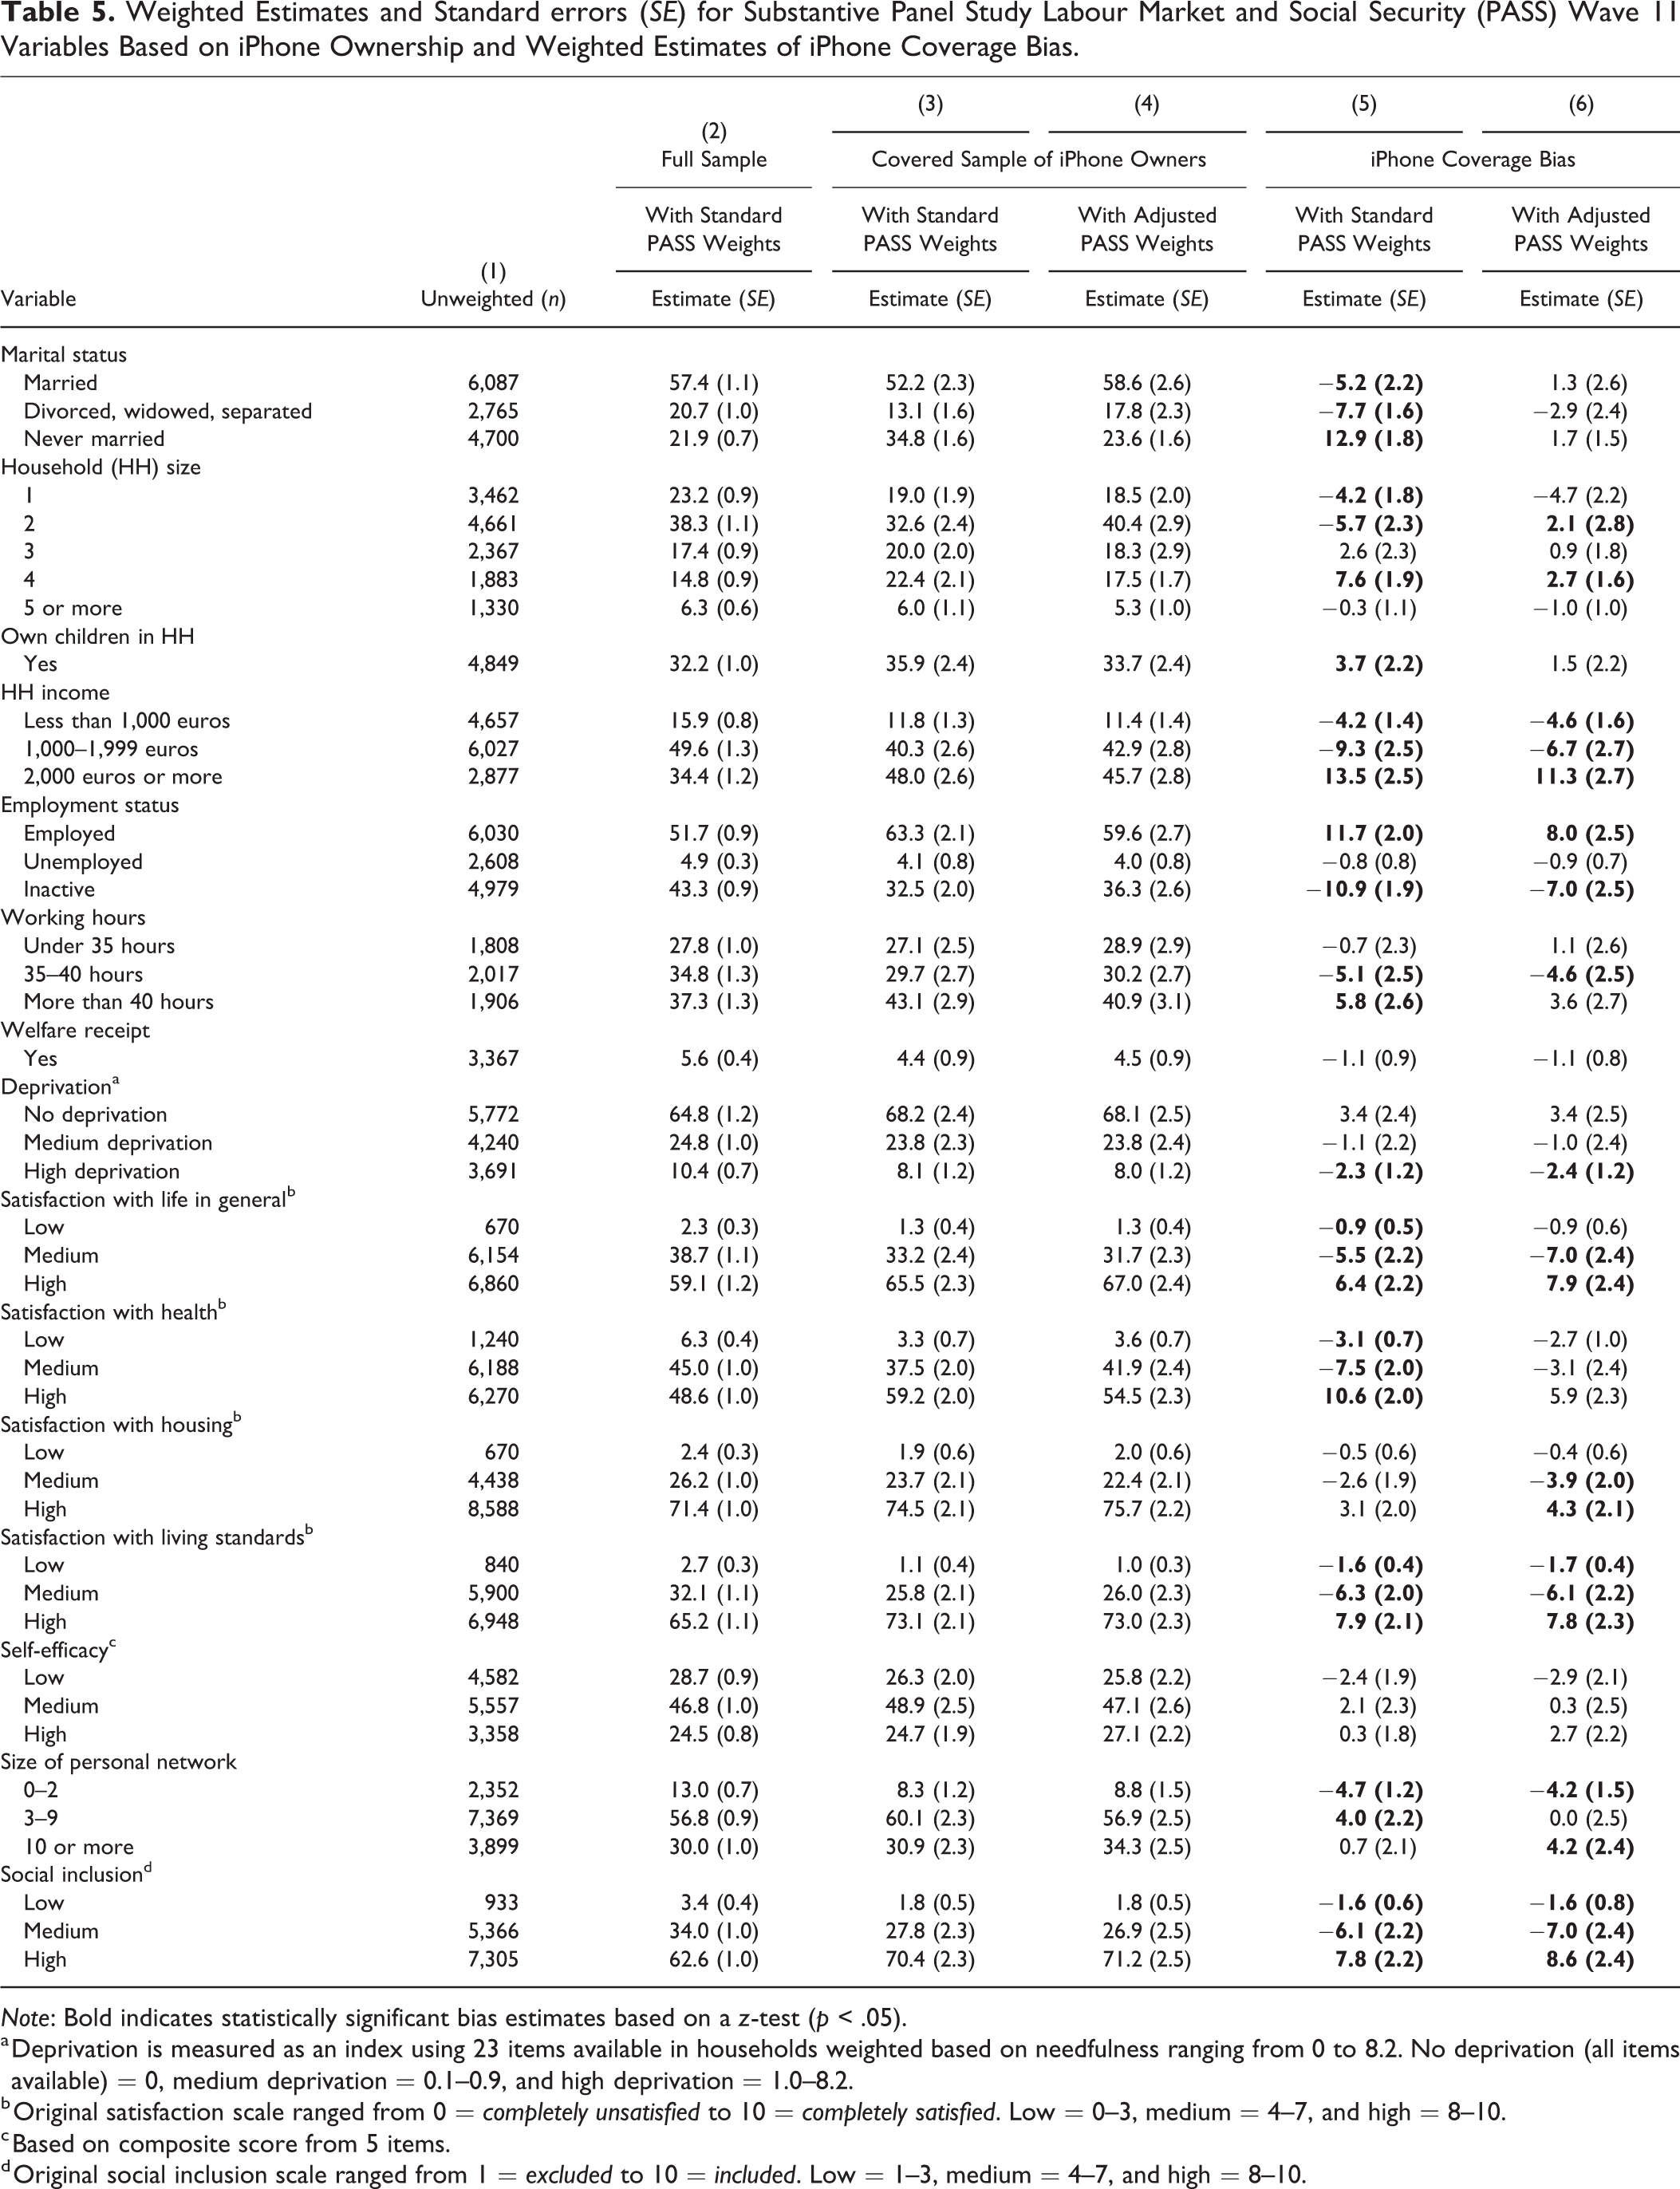
Tables 3–5 show the estimates and standard errors for the 15 substantive PASS variables corresponding to respondents who reported owning a smartphone (Table 3), owning an Android smartphone (Table 4), and owning an iPhone (Table 5). In each of the three tables, Column 2 presents the unbiased estimates and standard errors from the full PASS sample, and Column 3 presents the estimates and standard errors from the reduced sample covered by the device applying the standard PASS weights. Column 5 provides the bias estimates and their standard errors when the full PASS sample estimates are compared with the covered sample estimates using the standard PASS weights. Estimates that are statistically significant based on the z-test are in bold font.
Weighted Estimates and Standard Errors (SE) for Substantive Panel Study Labour Market and Social Security (PASS) Wave 11 Variables Based on Smartphone Ownership and Weighted Estimates of Smartphone Coverage Bias.
Note: Bold indicates statistically significant bias estimates based on a z-test (p < .05).
a Deprivation is measured as an index using 23 items available in households weighted based on needfulness ranging from 0 to 8.2. No deprivation (all items available) = 0, medium deprivation = 0.1–0.9, and high deprivation = 1.0–8.2.
b Original satisfaction scale ranged from 0 = completely unsatisfied to 10 = completely satisfied. Low = 0–3, medium = 4–7, and high = 8–10.
c Based on composite score from 5 items.
d Original social inclusion scale ranged from 1 = excluded to 10 = included. Low = 1–3, medium = 4–7, and high = 8–10.
Weighted Estimates and Standard Errors (SE) for Substantive Panel Study Labour Market and Social Security (PASS) Wave 11 Variables Based on Android Smartphone Ownership and Weighted Estimates of Android Smartphone Coverage Bias.
Note: Bold indicates statistically significant bias estimates based on a z-test (p < .05).
a Deprivation is measured as an index using 23 items available in households weighted based on needfulness ranging from 0 to 8.2. No deprivation (all items available) = 0, medium deprivation = 0.1–0.9, and high deprivation = 1.0–8.2.
b Original satisfaction scale ranged from 0 = completely unsatisfied to 10 = completely satisfied. Low = 0–3, medium = 4–7, and high = 8–10.
c Based on composite score from 5 items.
d Original social inclusion scale ranged from 1 = excluded to 10 = included. Low = 1–3, medium = 4–7, and high = 8–10.
Weighted Estimates and Standard errors (SE) for Substantive Panel Study Labour Market and Social Security (PASS) Wave 11 Variables Based on iPhone Ownership and Weighted Estimates of iPhone Coverage Bias.
Note: Bold indicates statistically significant bias estimates based on a z-test (p < .05).
a Deprivation is measured as an index using 23 items available in households weighted based on needfulness ranging from 0 to 8.2. No deprivation (all items available) = 0, medium deprivation = 0.1–0.9, and high deprivation = 1.0–8.2.
b Original satisfaction scale ranged from 0 = completely unsatisfied to 10 = completely satisfied. Low = 0–3, medium = 4–7, and high = 8–10.
c Based on composite score from 5 items.
d Original social inclusion scale ranged from 1 = excluded to 10 = included. Low = 1–3, medium = 4–7, and high = 8–10.
Column 5 in Table 3 shows that the majority of core substantive PASS variables are associated with smartphone coverage bias. Using the sample of smartphone owners in the PASS, we underestimate the percentage of German residents aged 15 and older who are divorced, widowed, or separated by more than five percetage points (p.p.), and we overestimate the percentage of people who never married by approximately the same amount. We also see that people living in households with more than two people are significantly overestimated and people living in single- and two-person households are underestimated. Similarly, there is a positive coverage bias for people living with their own children in the household (+6.5 p.p.).
Regarding measures on employment and poverty, we find that the smartphone-only sample overestimates the percentage of people living in the highest household income bracket (2,000 euros or more) by almost four points and underestimates the percentage of people living in the two lower household income groups (less than 1,000 euros: −0.9 p.p.; 1,000–1,999 euros: −2.8 p.p.). Coverage bias seems especially strong for employment status, where the smartphone-only sample overestimates the percentage of employed German residents by nine points, while it underestimates the percentage of people inactive by the same amount. In contrast, estimates on working hours, welfare receipt, and self-reported deprivation seem to be only minimally affected by smartphone coverage.
In terms of attitudinal variables, we find relatively small coverage bias in the measures of general life satisfaction (high: +1.9 p.p.; medium: −0.7 p.p.; low: −1.3 p.p.), satisfaction with housing (high: −1.1 p.p.; medium: +0.8 p.p.; low: +0.3 p.p.), and self-efficacy (high: ns.; medium: +1.9 p.p.; low: −1.7 p.p.). A substantially larger bias can be observed in the estimates of satisfaction with health; the sample covered by smartphones overestimates the proportion of people reporting high satisfaction with their health by almost five points (low: −1.7 p.p.; medium: −3.1 p.p.).
We also find only small biases due to smartphone ownership in the measures of social embeddedness; using the covered sample of smartphone owners, we overestimate the proportion of people who report having a personal network of between three and nine people (+1.6 p.p.) and underestimate the proportion of people who report having a personal network size of 10 or more people (−1.1 p.p.). We find a bias toward German residents reporting high social inclusion (+2.4 p.p.) compared to people reporting medium (−1.2 p.p.) and low social inclusion (−1.2 p.p.).
Regarding the bias produced by using the sample of respondents who reported owning an Android smartphone, we find comparable effects with slightly higher biases than those for the smartphone sample (see Column 5 in Table 4). The proportions of German residents aged 15 and older who reported never been married (+5.7 p.p.), were living in households with more than two people, were living with their own children (+8.9 p.p.), were employed (+10.4 p.p.), had high satisfaction with their health (+4.6 p.p.), had low (+0.6 p.p.) or medium (+1.7 p.p.) satisfaction with their housing, and had medium self-efficacy (+2.9 p.p.) are overestimated from the covered sample of Android smartphone owners. We find a negative bias estimate for people who reported that they were divorced, widowed, or separated (-6.9 p.p.); were living in two- (-5.8 p.p.) or one-person households (-5.2 p.p.); were inactive in the labor market (-11.4 p.p.); had low general life satisfaction (-0.8 p.p.); had low (-1.4 p.p.) or medium health satisfaction (-3.2 p.p.); had high satisfaction with their housing (-2.4 p.p.); had a social network of more than 10 people (-2.2 p.p.); and had low social inclusion (-1.3 p.p.). In addition, using the sample of covered Android owners, we overestimate the percentage of people reporting 35–40 working hours per week by two points, and we underestimate the percentage of people working under 35 hours per week (−1.7 p.p.). We also see a bias in reported satisfaction with living standards; the proportion of people reporting medium satisfaction is overestimated by two points, while the number of people reporting high satisfaction is underestimated (−1.8 p.p.).
Finally, Table 5 (Column 5) shows that we find even larger biases when we use the sample of iPhone owners to estimate the substantive PASS measures. For example, the percentages of never married German residents, those living in households in the highest income bracket, and those being employed are all overestimated by more than 13 points. In addition, we find that the percentage of people working more than 40 hours per week is overestimated by almost six points. We also find relatively large biases in the satisfaction measures, with an overestimation of people who reported having high satisfaction with life in general (+6.4 p.p.), health (+10.6 p.p.), and living standards (+7.9 p.p.). Finally, the percentage of people who reported having high social inclusion is overestimated by almost eight points compared to the percentages of people who reported having low (−1.6 p.p.) and medium social inclusion (−6.1 p.p.).
Can Coverage Bias Be Reduced by Implementing Specific Weights That Correct for Known Differences in Device Ownership?
Columns 4 in Tables 3–5 present the estimates and standard errors from the reduced samples of smartphone, Android smartphone, and iPhone owners, which were calculated with the newly adjusted PASS weights accounting for sociodemographic differences in device ownership. Column 6 provides the bias estimates and corresponding standard errors that resulted when the full PASS sample estimates were compared with the covered sample using the adjusted PASS weights.
Column 6 in Table 3 shows that the newly adjusted PASS weights using sociodemographic variables can reduce but not eliminate coverage bias that stems from smartphone ownership. Differences in estimates of marital status, household size, prevalence of individuals who live with their own children in the household, satisfaction with health and housing, and personal network size are reduced. In contrast, biases in household income, general life satisfaction and living standards, and self-efficacy due to smartphone ownership are unaffected by adjusting the PASS weights. Nevertheless, none of these biases are larger than 3.5 percentage points after the adjusted PASS weights are applied.
We see a similar pattern for Android smartphone coverage bias (Column 6 in Table 4); most of the biases are reduced when we apply the new weights adjusting for sociodemographic differences between Android smartphone owners and the general population. Nevertheless, the percentage of employed people is still overestimated by more than six percentage points, and the percentage of inactive German residents is still underestimated by almost seven points. Biases in attitudinal variables and social embeddedness are mostly under two percentage points.
Finally, applying the iPhone-specific adjusted weights reduces most of the bias in other sociodemographic variables, but we still find large biases in many of the other measures. For example, the percentage of people from high-income households is overestimated by more than 11 points, and the percentage of employed German residents is overestimated by 8 points. Similarly, we still see a large bias in the percentage of people who reported having high general life satisfaction (+7.9 p.p.), high satisfaction with their living standards (+7.8 p.p.), and high social inclusion (+8.6 p.p.).
When comparing the standard errors between the estimates using the standard PASS weights (Column 3 in Tables 3 through 5) and the estimates using the adjusted PASS weights (Column 4), the size of the standard errors is relatively unaffected by the additional weighting step. There seems to be no trade-off between a reduction in bias and an increase in the standard errors, suggesting that a reduction in bias will also lead to a reduction in mean squared error (not presented here). It thus seems advisable to apply the additional weighting step for sociodemographic differences when analyzing a sample of smartphone owners.
Conclusion
Using data from the PASS, an annual probability-based mixed-mode survey on labor market and poverty that targets the residential population of Germany aged 15 and older, we estimate that in 2017, 76 percent of German residents own a smartphone, 49 percent own an Android smartphone, and 17 percent own an iPhone. In accordance with the results of previous research on other European countries (Baier et al. 2018; Fuchs and Busse 2009; Metzler and Fuchs 2014) and the United States (Couper et al. 2018; Pew Research 2017), we find that smartphone owners are overrepresented among young and highly educated people and those who live in large communities. We also find that smartphone penetration is higher among non-German citizens than among German citizens. In addition, we find that smartphone ownership in Germany correlates with a number of substantive variables on the labor market and poverty, which are routinely collected as part of PASS. Our findings confirm the notion that the digital divide between owners and nonowners of smartphones expands beyond mere sociodemographic differences and affects measures of behaviors and attitudes.
Using weighting techniques based on the sociodemographic information on age, sex, educational attainment, nationality, region, and community size that is available for both owners and nonowners of smartphones in Germany does reduce some of the differences but does not eliminate them. The biases created by differences in estimates from the full sample and the sample of smartphone owners are statistically significant for many of the PASS variables. Some of the biases on attitudinal variables, such as satisfaction with different aspects of one’s life, social inclusion, and self-efficacy, are substantially small, with most of the bias estimates not exceeding two percentage points. Since some of the coverage bias is clearly driven by very low smartphone penetration in the older age groups, we see an improvement in bias for measures that highly correlate with age (e.g., satisfaction with health) when applying additional weights that account for these age differences. This finding confirms the results reported by Couper et al. (2018) on smartphone coverage bias on measures of fertility and sexual behavior from the NSFG in individuals aged 15–44 in the United States. Taken together, these findings provide additional evidence that smartphone penetration seems to have reached a level in many Western countries that is comparable to the level of nonmobile Internet coverage. Thus, conducting mobile web surveys with smartphones among people under the age of 65 seems to produce an amount of coverage bias that is not very different from that produced by traditional web surveys limited to landline Internet.
However, other substantive sociodemographic measures, such as household size, prevalence of individuals living with their own children in the household, household income, and employment status, show larger substantial biases, even after weights that specifically account for sociodemographic differences between owners and nonowners of the device are applied. These biases might be driven by other mechanisms, such as differences in income and other wealth-related variables between people who own and do not own a smartphone.
While most mobile browser-based web surveys currently are OS agnostic, that is, there are no major restrictions by the specific OS that is installed on a smartphone regarding the capability of displaying and responding to a web survey in a mobile browser, other forms of data collection using smartphones remain susceptible to the idiosyncrasies of different types of smartphones. For example, Android as an open-source platform is currently less restrictive in how and what data from different sensors and other apps can be accessed by and collected through a research app than the iOS ecosystem on Apple iPhones. If researchers want to leverage the full breadth of passive measurements in one study (e.g., continuous measurements of geolocation and movements, timestamps of app and browser use, and call and text message logs) as described by Kreuter et al. (2018), the researches would need to rely on participants with Android smartphones. Our study is the first to consider the bias that stems from coverage of smartphones with different OSs. For the substantive variables of PASS, we find that the bias produced by Android smartphone coverage is generally not much higher than the coverage bias for all smartphones in Germany, which is encouraging news for researchers who are eager to use smartphone technology for passive measurements. However, iPhone owners constitute a much smaller and more unique subpopulation in Germany, both in terms of sociodemographic characteristics and in terms of attitudes and behaviors, which confirms the results of previous research (e.g., Götz et al. 2017; Pryss et al. 2018; Shaw et al. 2016; Ubhi et al. 2017). In our study, we find relatively low iPhone coverage and large biases in many of the substantive PASS measures included in our analysis when we restrict the sample to iPhone owners. This bias is substantial even when iPhone-specific weights that should correct for sociodemographic differences between iPhone owners and the general population are applied. Thus, we caution researchers to limit their data collection to iPhone owners when possible since this strategy can systematically exclude specific subpopulations (e.g., individuals who are older, are not single, have a low income, work a small number of hours, have low satisfaction with various aspects of life, feel deprived, and feel less socially embedded).
Of course, the way we and others operationalize coverage assumes that ownership of a device equals uniform use of the technology across all owners. From research on how people engage with the Internet and other IT technology, we know that access to a technology does not necessarily mean that every individual is able and willing to use the technology to its full potential. Hargittai (2002) uses the term “second digital divide” to describe this phenomenon. Recent studies have found that smartphone skills and the use of smartphones for different activities correlate with the reported willingness to participate in smartphone data collection tasks that are more complex than mobile web surveys (Couper et al. 2017; Keusch, Struminskaya, et al. 2019; Wenz, Jäckle, and Couper 2017). In addition, privacy and security concerns predict how willing smartphone users are to share passive data with researchers (Jäckle et al. 2019; Keusch, Struminskaya, et al. 2019; Revilla, Couper, and Ochoa 2019; Wenz et al. 2017). In the future, we hope to see more research on selective participation in studies involving smartphone data collection and the biases associated with nonparticipation.
It is important to keep in mind that accessibility and willingness varies across study topics and institutions conducting the research. Thus, our study also needs to be interpreted in its context. We researched biases with data from a study on labor market activities and poverty in Germany. Coverage biases might look different when different outcomes are used as the variables of interest. Furthermore, smartphone contracts and devices vary in availability across countries. Before one generalizes our results from Germany to a different country, we recommend that they consider the possible relationships between smartphone and OS usage and their correlations with the substantive variables examined here. Our findings indicate that age and income as well as attitudinal measures on life satisfaction are strong correlates with smartphone ownership and thus need to be considered when smartphones are used as the main mode for collecting information that might be associated with these variables. We encourage others to also add to the small body of literature on coverage errors and coverage bias, so we can collectively learn about the error properties of data collected with smartphones and other mobile devices.
Footnotes
Declaration of Conflicting Interests
The author(s) declared no potential conflicts of interest with respect to the research, authorship, and/or publication of this article.
Funding
The author(s) declared the following potential conflicts of interest with respect to the research, authorship, and/or publication of this article: Georg-Christoph Haas’ time was supported by the German Research Foundation (DFG) through the Collaborative Research Center SFB 884 “Political Economy of Reforms” (Project A9) [139943784 to Markus Frölich, Florian Keusch, and Frauke Kreuter].