
Abstract
The increasing use of mobile devices in the frame of online surveys has been accompanied by the development of research apps. These research apps have the potential to facilitate the process for respondents (e.g. being able to complete surveys when Internet is not available provides more freedom on when and where participants can participate) and fieldwork companies (e.g. the possibility to use push notifications could lead to higher participation rates). However, previous research suggests that panelists may also be reluctant to install an app. In this study, we answer research questions related to the knowledge and use of the Netquest app. We found that a majority of panelist did not know about the app and although sending invitations significantly increased its installation, the overall total of respondents installing the app remained low. Furthermore, the profile of those who installed the app differs from those who did not. The participation of panelists after they installed the app seems stable. The main reason for installing the app is comfort while the main reason for not installing relates to space/battery usage. Most of those who did not install could accept to install the app.
Introduction
More and more respondents complete web surveys using mobile devices (Bosch et al., 2019; De Bruijne and Wijnant, 2014; Revilla et al., 2016), creating both new challenges and opportunities (Baker-Prewitt, 2013; Couper, 2013). In particular, this increasing use of mobile devices has been accompanied by the development of mobile apps, that is, “a software that resides on a mobile device, occasionally pre-loaded, sometimes downloaded from a website, but typically downloaded from an app store, such as Apple’s App Store or Android’s Google Play” (Poynter, 2015: 16). Mobile apps cover a wide range of topics and functions. A small portion of these mobile apps are for research purposes. Michelson (2010) proposed a typology of 54 different research apps. Since then, the number of research apps increased considerably.
These research apps can be used to answer web surveys, but in addition they usually present a series of other potential attractive features, as stated by Poynter (2015: 16): (1) Surveys can be completed when the Internet is not available; (2) surveys can access the features of the device, such as location or usage; (3) passive data collection can be done through the app; and (4) surveys can be initiated by the phone (e.g. through a push notification) rather than relying on an email or SMS from the researcher or online fieldwork company.
These features can be attractive for the respondents, as well as for the researchers and fieldwork companies. Indeed, from the respondents’ perspective, being able to complete surveys when Internet is not available provides more freedom on when and where they can participate. This makes it easier for panelists to participate in the surveys. Thus, it could lead to a higher participation overall. Moreover, the possibility to access additional information such as location, and more generally to collect data passively, might provide opportunities to reduce the surveys’ length, since part of the information might be automatically collected instead of being asked from the panelists. As a result, the efforts of the panelists can be reduced, and the burden of their participation lightened. Furthermore, receiving a push notification might be an easier and more immediate way to learn about the survey invitation, since no extra effort is required from the panelists (the notification appears on the phone so they do not need to look at their email). Finally, research apps often present additional functions (not mentioned by Poynter, 2015) that can be attractive for participants, such as allowing them to see the gifts available to them. Overall, the experience of participating in the surveys as well as in the panel may be improved.
From the researchers and fieldwork companies’ perspective, being able to complete surveys when Internet is not available (implying more flexibility) as well as the push notification (implying that more respondents could be made aware about the surveys since the invitations are more visible) could lead to higher participation rates, which in turn, could help in terms of representativeness and reduction of costs. In addition, the passive data collection might be a way to gather much more detailed information than survey data alone, and information that is more objective (no human memory limitation) and comes in real time (Revilla et al., 2017). Finally, it could allow reducing survey length, impacting positively data quality. Thus, overall, the use of apps could lead to higher data quality.
Therefore, some research started investigating the merits of apps versus regular browser surveys and the willingness of people to install and use such apps (see “Background” section). However, this research is scarce. Besides, the use of research apps in the academic sphere is still very limited. In addition, technology is changing very quickly, which can affect the performance of both apps and regular browser surveys. The familiarity of respondents with both solutions varies quickly too. Thus, more research is needed, both to study whether apps really have the potential to improve panelists’ experience and data quality, and to study the willingness of online panelists to install and use a research app for different purposes.
To start filling this gap, this article investigates the use of a research app, in the frame of the Netquest opt-in online panels in Brazil, Spain, and the USA. The research app can be downloaded by the panelists from the website, which redirects them to the app store. Nevertheless, many panelists might not know about the app and thus might not use it. Therefore, our first research question is: (RQ1) What is the current knowledge and use of the Netquest app among panelists?
To increase the app use, researchers and/or fieldwork companies can send invitations to the panelists. Little is known about how these invitations and their exact content affect the app use. However, previous research suggests that different email invitation elements (e.g. Petrovčič et al., 2016), as well as the use of different types of incentives (for recent overviews, see, for example, Ernst Stähli and Joye, 2016, or Asire, 2017), can affect survey response rates. In a similar way, the exact content of the invitation message as well as the inclusion of incentives might also affect the app use. This leads to our second research question: (RQ2) To what extent does sending (different) invitations to install the app increase its usage?
Furthermore, it is important to know the profile of those who install the app when invited to do so, versus those who do not, since this affects to whom the results hold when using data from the app. Therefore, our third research question is: (RQ3) What is the profile of those who installed the app versus those who did not?
In addition, one key argument to promote app use is that it could increase survey participation (more freedom on when/where to complete the surveys, possibly shorter surveys, and more direct invitation process). To test whether this is the case, our next research question is: (RQ4) Is panelists’ participation increased after they install the app?
Finally, to increase the app installation, it is important to better understand the mechanisms behind the (non)installation. This leads to our last research questions: (RQ5) What are the main reasons for installing or not installing the app? (RQ6) What could be done to increase the installation of the app? and (RQ7) What could be changed in the app to make it more attractive?
Background
Different studies have examined the installation of a research app. The first set of studies focused on asking respondents whether they would be willing to install an app (stated willingness). Pinter (2015) using an access panel in Hungary found that 42% of those who used smartphones were unwilling to install a research app, the three main reasons being not enough free time, not enough information to decide, and concerns about extra costs of using an app. After additional persuasion aimed at these concerns, 57% agreed to install the app. Pinter (2015) also found that the willingness to install the app was correlated with behavioral (e.g. number of apps, use of GPS) and socio-economic variables (e.g. age or income). Revilla et al. (2016: 1221) asked Netquest panelists in seven countries whether they would be willing to “install an application” on their smartphones and tablets. Only 4%–18% (depending on the country and device type) of the respondents said “no.” Keusch et al. (2019) found that 64.5% of the respondents of an opt-in panel in Germany would not be willing (0–5 on an 11-point scale) to install a tracking app. The willingness was affected by the sponsor and the duration of the study, the incentives, and the ability to turn off the tracker. Wenz et al. (2019) measured willingness to perform a variety of tasks including installing a survey or a tracking app, using the Understanding Society Innovation Panel in the United Kingdom. They found that 35% would not be willing to install a survey app while 55% would not be willing to install a tracking app. The willingness to install both a survey and a tracking app was affected by the number of activities done on smartphone, security concerns, and age (squared). Revilla et al. (2019) asked Netquest panelists in Spain about their willingness to install a tracking app on their smartphones: 82% said they would not be willing or were uncertain (answers 1 to 3 on a scale from “1 = Definitely not” to “5 = Definitely yes”).
Another set of studies asked participants to actually install an app (observed willingness). Johnson et al. (2012) asked panelists to install an app to answer a modular survey. Within the eligible panelists, 43% expressed willingness to participate and were sent a link to download the app. Of those, 37% (i.e. 16% of eligible panelists) successfully downloaded the app and 33% (14% of eligible panelists) completed at least one survey. McGeeney and Weisel (2015) randomly assigned panelists of the Pew American Trends Panel who used an eligible smartphone to a browser- or app-based version to complete a short survey twice a day for a week. In the app group, 76% agreed. Of those, 80% installed the app (i.e. 61% of those invited). Completion rates for the 14 surveys were significantly lower for the app group than the browser group. Kreuter et al. (2018) developed the IAB-SMART app to measure the effects of long-term unemployment on social integration and social activity and asked members of the panel study “Labour Market and Social Security” (PASS) to install this app for 6 months. The app needed extensive access to sensor and activity data on the smartphone. They obtained a participation rate of 15.9%. Once participants gave consent, they did not tend to revoke it. Jäckle et al. (2019) invited panelists in the Understanding Society Innovation Panel to download an app to scan receipts and report their spending over a month: 16.5% of respondents downloaded the app and completed the registration survey. The participation was related to the frequency of Internet and mobile device use, and with general cooperativeness with research.
This brief summary of previous research shows that some panelists are not willing to install and use an app, but the proportion depends on the kind of app (e.g. surveying and/or tracking) and its specific design (e.g. possibility to turn the tracker off or not). It also suggests that there are differences across countries. The present study contributes to this literature, by looking at the case of the Netquest app (which is a research app for a panel, not for a single study, as in most of previous research) across three different countries (Brazil, Spain, and the USA), trying out different ways to encourage participants to install the app, looking at how the app use affects the survey participation, at reasons for installing or not installing the app, and at suggestions for increasing the app installation and usage.
Methods and data
Data
The Netquest app
We use data from the Netquest online fieldwork company (www.netquest.com) from three countries that differ not only in terms of languages and culture but also in terms of when the panels were created: Brazil (2010), Spain (2005), and the USA (2017).
Netquest sends panelists survey invitations via email, using a list of individuals who have agreed to receive emails after answering a short customer satisfaction surveys on a website belonging to one of the company’s collaborators. For each survey completed, panelists are rewarded with points, based on the estimated length of the questionnaire. The median number of points across 186 surveys studied in Spain in 2016 was 12 while the median length was 10 minutes (Revilla, 2017). These points can be redeemed for gifts.
Panelists can also use an app, of which there are versions available for iOS and Android. They can be downloaded from their respective app stores. All the information available in the app is also available on the website, once the panelists log into their account. The app varies somehow depending on the version (e.g. the layout of the menu or of some buttons slightly differs), but all versions have similar functions: check the panelist’s current points balance, the pending surveys, see possible gifts, redeem points for gifts, or go to the help/contact section. Once panelists have installed the app, they receive a push notification from the app, together with the email invitation, each time a new survey is available. Panelists can then decide to answer from the app or follow the link sent in the email invitation. We should notice that the Netquest app does not currently allow to complete surveys without an Internet connection. However, it does offer the other potential advantages of apps listed by Poynter (2015: 16; see “Introduction” section) and it only occupies 35 MB. In addition, the Netquest app can also be used to register passively online behaviors (URLs of the webpages visited by the participants). However, this function of the app can only be activated if Netquest proposes it to the panelists and the panelists accept. While no invitations are sent by Netquest for installing the app to use it for general purposes, some invitations are sent in the case of using the app to track behaviors. In this study, we focus on the use of the Netquest app as a research app excluding the tracking function. However, when considering the current knowledge and use of the app, we should remember that the existence of this tracking function could play a role.
The first survey
To answer our first research question (knowledge and use of the Netquest app), we implemented a first survey in the three countries of interest. Data collection took place from 30 November to 4 December 2018. We used crossed-quotas of gender, age, and education (variables available from the profiling system Netquest uses) such that the distribution of these variables in the sample is similar to the one in the whole panel in each country. The objective was fixed at 1000 panelists finishing the survey per country. The survey consisted of a maximum of 11 questions 1 : age, gender (used to confirm the panelist identity), seven questions about knowledge, installation, and use of the app (whether panelists have used at least once the app; and used it for answering surveys, checking points, looking for a gift, using the help/contact section), and two questions about whether panelists have a smartphone and a tablet. 2 The survey was optimized for mobile devices.
In total, 7813 panelists were invited. From those, 4015 panelists entered the starting page of the survey; 885 were screened out (quotas full, unmatched age and gender answers to the panel information, or wrong answer to a very simple instructional manipulation check) and 80 dropped out during the socio-demographic questions. Thus, 3050 panelists answered the question about knowledge of the app. Another 48 respondents dropped out during the next questions, which means that 3002 respondents answered the last survey question: 1002 in Brazil, 1001 in Spain and 999 in the USA. These are the respondents considered in our analyses (more information in supplementary material 1).
The invitations to install the app
To answer our second research question (impact of sending different invitations), we implemented an experiment within the Netquest panels in Brazil, Spain, and the USA, varying two aspects of the invitation emails:
The emphasis of the invitation message: positive aspects for the respondents only, or also for brands and researchers. By pointing out the positive aspects for the brands and researchers as well, we expect a higher app installation. Indeed, previous research found that many people experience a feeling of reward when helping others (Dillman et al., 2014). Consequently, previous research found that emphasizing that their participation helps others can lead to higher survey response rates (e.g. see Mowen and Cialdini, 1980). Similarly, it could increase the installation of the app.
The incentive: no incentive or a small incentive (three points). Even if previous research shows that the effect of using incentives on survey response rates is not always present and depends on the type and value of incentives (Ernst Stähli and Joye, 2016), proposing a small incentive could increase the proportion of respondents installing the app.
In each country, we identified all active panelists that had not already installed the app and had not participated in the first survey. Panelists were considered active if they had completed at least one of the last 12 surveys received. Within those, we drew a sample of 2500 panelists using age, gender, and education quotas such that they represent the panel on these variables.
These samples of 2500 panelists in each country were randomly divided into five groups of 500 persons each: control group (these respondents are not sent any invitation email),
The invitations were sent by Netquest to the 6000 panelists of the four treatment groups on 11 December 2018. Out of them, only 2000 opened the email (33.3% of the invited).
The second survey
To answer our second research question, we also needed more information about the app use, which we collected through a second survey. This second survey also aimed to answer RQ5 (reasons for installing or not), RQ6 (how to increase the installation), and RQ7 (what to change in the app). The second survey was directed to panelists in the four treatment groups and panelists in the control group who installed the app. The content of the survey varied depending on whether the panelists installed the app or not (observed using paradata) in the 38 days after the invitations were sent. Those who installed the app (in the treatment groups and the control group) got a maximum of 13 questions to determine for what they used the app (similar as first survey), how they evaluated the app, the reasons why they installed the app, and suggestions for improvements. Those who did not install the app (in the treatment groups) got only two questions about the reasons for not installing it and what could be changed to convince them to install it. 3
The data were collected for this second survey from 18 to 28 January 2019. In total, 6010 panelists were invited (6000 of the treatment groups and 10 who installed in the control group). Of those, 1922 (31.9%) answered the survey: 59.1% were women, the mean age was 44.6 years, and 51.8% had a university diploma or equivalent (see supplementary material 1).
Profiling and panel participation information
To answer our third research question (profile of those who installed the app versus those who did not), we used profiling information collected by Netquest (gender, age, and education), as well as the history of panelists participation in Netquest (number of days in the panel and participation rate, defined as 100 times the number of surveys a panelist answered, divided by the number of surveys a panelist was invited to since he or she joined the panel).
To answer RQ4 (increase in panelists participation after they install the app), we also looked at the participation rate before and after sending the invitations to install the app. Since the second survey was sent 38 days after the invitations, we computed the participation rates for 76 to 38 days before the invitations were sent (26 September to 3 November 2018), 38 days before the invitations were sent (3 November to 10 December 2018), and 38 days after the invitations were sent (12 December 2018 to 18 January 2019).
Analyses
What is the current knowledge and use of the Netquest app?
We use the answers of the first survey to determine the current knowledge and use of the Netquest app in Brazil, Spain, and the USA. For each country, we report the proportions of respondents who stated that they know that there is a Netquest app, that they installed this app (out of the ones who knew it), that they used the app at least once in general and for different purposes (out of the ones who used it at least once): answering surveys, checking points, redeeming points for gifts, and visiting the help/contact section.
To what extent sending (different) invitations to install the app would increase its use?
We study the impact of four types of invitations on the proportions of panelists who installed the app. The invitations vary in the focus on the message (advantages for the respondents only or also for the brands/researchers) and the presence of an incentive (three points or nothing). For each country, we compare the proportions of panelists who installed the app (observed from paradata) in the control group and the four treatment groups 38 days after the treatment groups received the invitation using two-sample Z-tests (prtest command in Stata). In addition, we use two-sample Z-tests to study if the proportions of panelists installing the app significantly differ between those who were proposed a 3-point incentive and those who were not.
Then, we check whether panelists who installed the app also use it in the 38 days after the invitations were sent and for which purposes (using the answers from the second survey). Because of the very small number of panelists who installed the app, we do not differentiate between experimental groups in these (and the following) analyses.
What is the profile of those who installed the app versus those who did not?
To answer this question, in each country, we compare those who have installed the app (observed through paradata) to those who have been invited (all treatment groups) but did not install it, first, in terms of basic socio-demographics (available from profiling): mean age, proportions of women, and proportion of panelists with university education.
In addition, we compare those who installed the app versus those who did not in terms of panel loyalty, measured by two indicators: (1) the number of days in the panel before invitation; and (2) the average participation rate since they joined the panel, that is, number of surveys answered × 100/number of surveys invited to since they joined the panel.
Is panelists’ participation increased after they install the app?
To answer RQ4, we compare in each country the panelists’ participation rate in the 38 days before versus the 38 days after the invitations were sent, for those who installed the app. Moreover, to get an idea of the usual evolution of the participation rates, we also compute the participation rates for the days 76 to 38 before the invitations were sent. We use all panelists who installed the app (treatments, but also control group) since the goal is to look at the effect of having installed the app (however, excluding the panelists in the control group leads to similar results).
What are the main reasons for installing or not the app?
In the second survey, we asked open-ended questions about the main reasons why panelists installed or did not install the app. Then, we manually coded the answers. If more than one reason was mentioned, all were counted. We present all the reasons mentioned by at least 5% of the panelists answering. We do not present the results by country in this case, because of the high number of different reasons mentioned and the small number of panelists answering, mainly in the case of installing.
What could be done to increase the installation of the app?
In the second survey, we asked panelists who did not install the app in the 38 days after the invitations were sent what could be done to convince them to install the app. The answers were coded in a similar way as the ones of the open question about the reasons of (not) installing the app. We report the aspects mentioned more often by the respondents.
What could be changed in the app to make it more attractive?
Panelists who installed the app, instead, were asked about their evaluation of the app (liked, easy to use, useful, improved experience as panelist) and an open question about what could be improved in the app. We report the general evaluation (proportions of respondents answering the two highest categories on each of the four closed questions, on 5-point scales, where 5 is the most positive) and the improvements suggested most often in the open question.
Main results
What is the current knowledge and use of the Netquest app?
To tackle our first research question, we asked a sample of panelists in the three countries of interest about their knowledge and use of the Netquest app (first survey). Table 1 presents the proportions of panelists who stated they knew, installed, and used the app at least once for different purposes, per country.
Stated knowledge and use of the Netquest app (first survey).
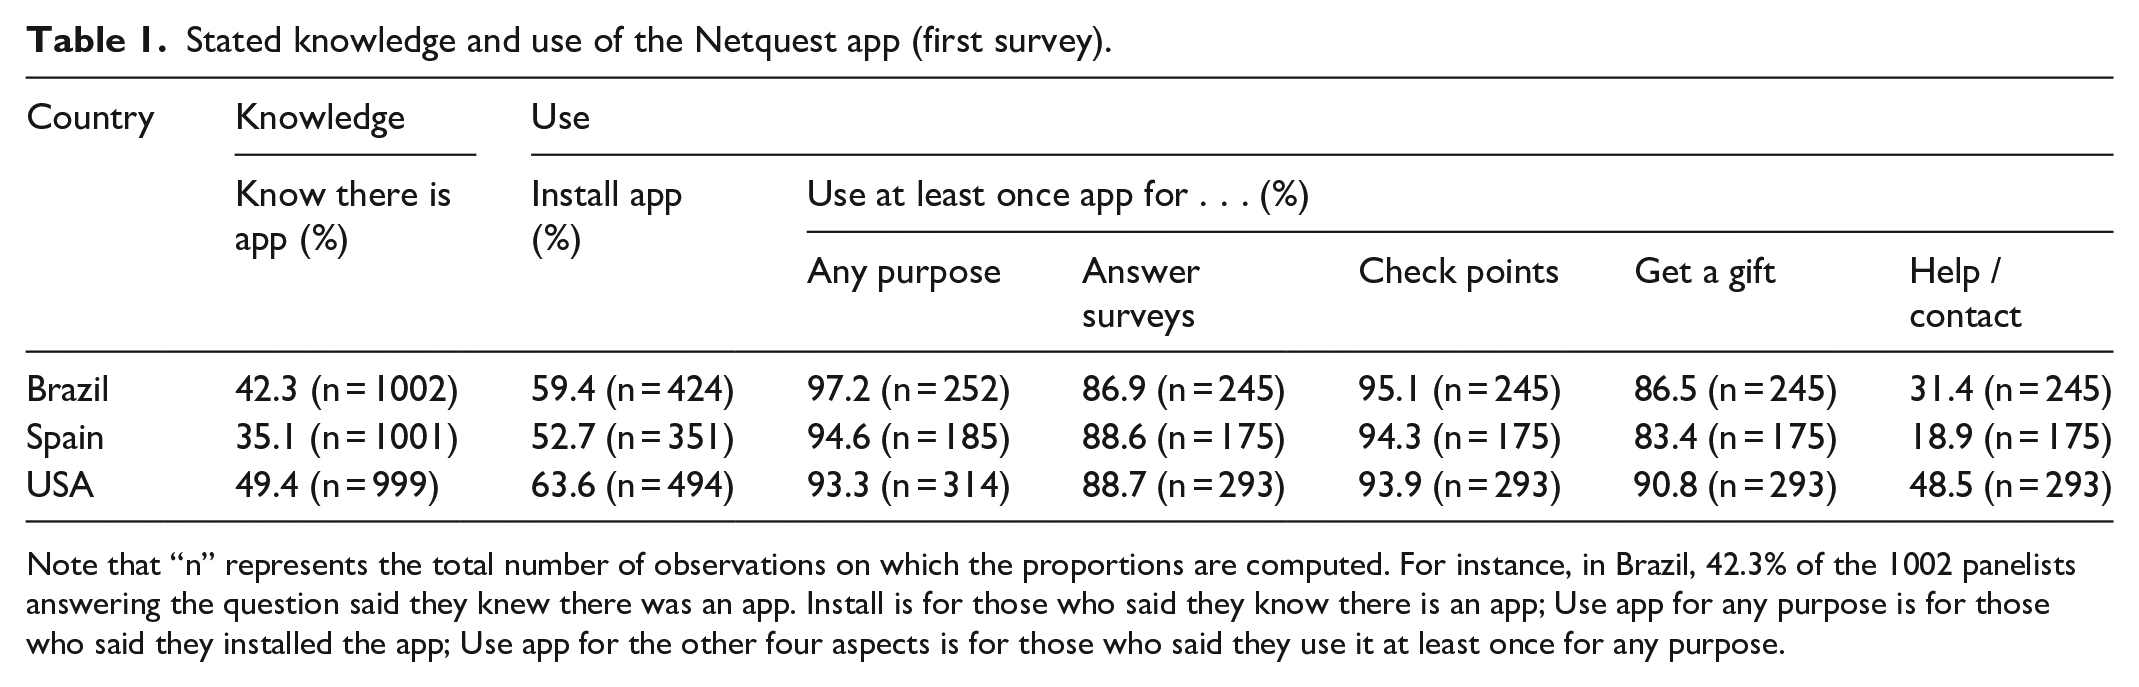
Note that “n” represents the total number of observations on which the proportions are computed. For instance, in Brazil, 42.3% of the 1002 panelists answering the question said they knew there was an app. Install is for those who said they know there is an app; Use app for any purpose is for those who said they installed the app; Use app for the other four aspects is for those who said they use it at least once for any purpose.
First, a majority of panelists do not know that there is an app available. In particular in Spain, the knowledge about the app is very low (35.1%), whereas in Brazil it is somehow higher (42.3%) and in the USA it almost reaches 50%. This could be related with the fact that the Spanish panel was created much before (in 2005): many panelists thus started before an app was available (2015). They may just have got used to participate through the web. On the contrary, the USA panel started when apps were already very common (2017) and thus many panelists might have directly started using the app. Even if there are clear differences across countries, overall, this suggests that if one has interest in increasing app use, one should then inform better the panelists about the existence of the app.
Second, within the ones who knew about the existence of a Netquest app, 52.7% (Spain) to 63.6% (USA) installed it. Moreover, of the ones who installed it, 93.3% (USA) to 97.2% (Brazil) used it at least once. Within the ones who used the app at least once, 86.9% (Brazil) to 88.7% (USA) used it at least once to answer a survey, 93.9% (USA) to 95.1% (Brazil) to check their points, 83.4% (Spain) to 90.8% (USA) to get a gift, and 18.9% (Spain) to 48.5% (USA) to consult the online help/contact section. 4 This suggests that if panelists install the app, they usually use it, and for different purposes, checking their points being the most common. Again, differences across countries are clear.
To what extent sending (different) invitations to install the app would increase its use?
Next, we study the impact of four invitations on the proportion of panelists who installed the app in the 38 days after the treatment groups received the invitations. Table 2 presents these proportions, and the results of the tests of significance in differences across groups, in each country.
Proportions who installed the app in each group and country in the invitation experiment (Paradata).
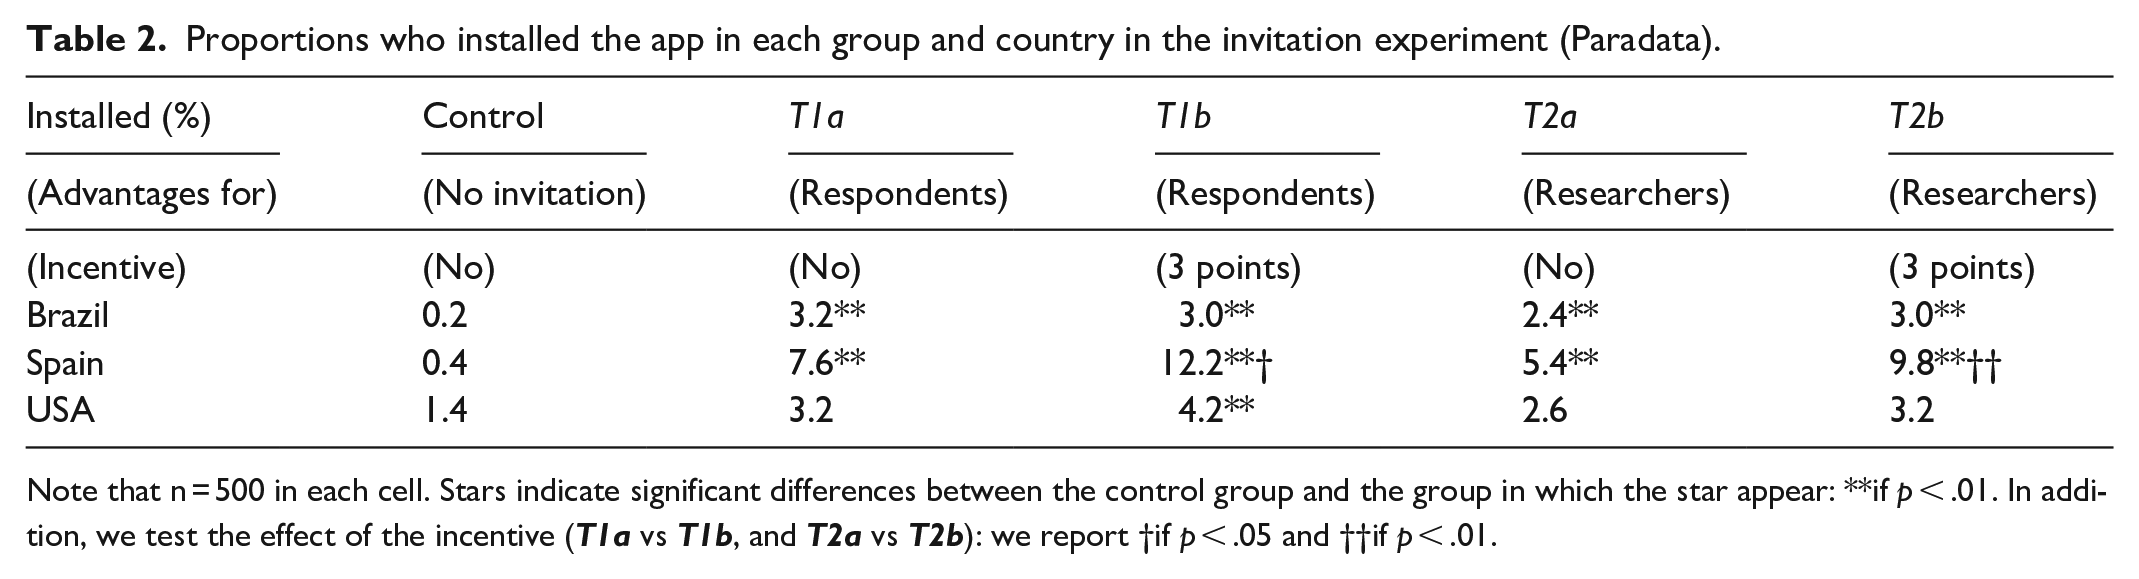
Note that n = 500 in each cell. Stars indicate significant differences between the control group and the group in which the star appear: **if p < .01. In addition, we test the effect of the incentive (
As expected, very few panelists installed the app in the control group (i.e. without invitation). Sending invitations increased significantly the proportions who installed the app in 9 out of 12 cases. However, the proportions of panelists installing the app in the 38 days after receiving an invitation stays really low, mainly in Brazil and the USA. The highest proportion is found for the
There are different possible explanations for these low proportions. First, we focus here only on panelists who had not installed the app before we started our experiment, excluding thus the panelists who are most interested in using the app who installed it without any invitation before the experiment (according to Table 1: 52.3% × 351/1001 = 18.5% in Spain to 63.6% × 494/999 = 31.4% in the USA of respondents in our first survey). Second, only 33.3% of the panelists in the treatment groups did open the email invitation (according to paradata). Thus, the other 66.7% did not really receive the treatment. This could be linked with the low participation rate of a large part of the sample. For instance, in the 38 days before the invitations were sent, around half of the panelists in the treatment groups did not answer any survey. In some cases, this might be because they received few invitations (65% received only one or two invitations in that period), but in others, it might indicate that the panelists are not very active in general. Therefore, we repeated the analyses of Table 2 but considering only the panelists who opened the email to see how this affects the results (see Table 2 bis in the supplementary material 3). While all proportions are now higher (up to 26.6% in Spain for
Moreover, to see whether panelists really used the app, and not only installed it, we also asked respondents in the second survey whether they used the app at least once in these 38 days and if yes, for which purposes. Results are presented in Table 3.
Use (at least once) app for different purposes (second survey).
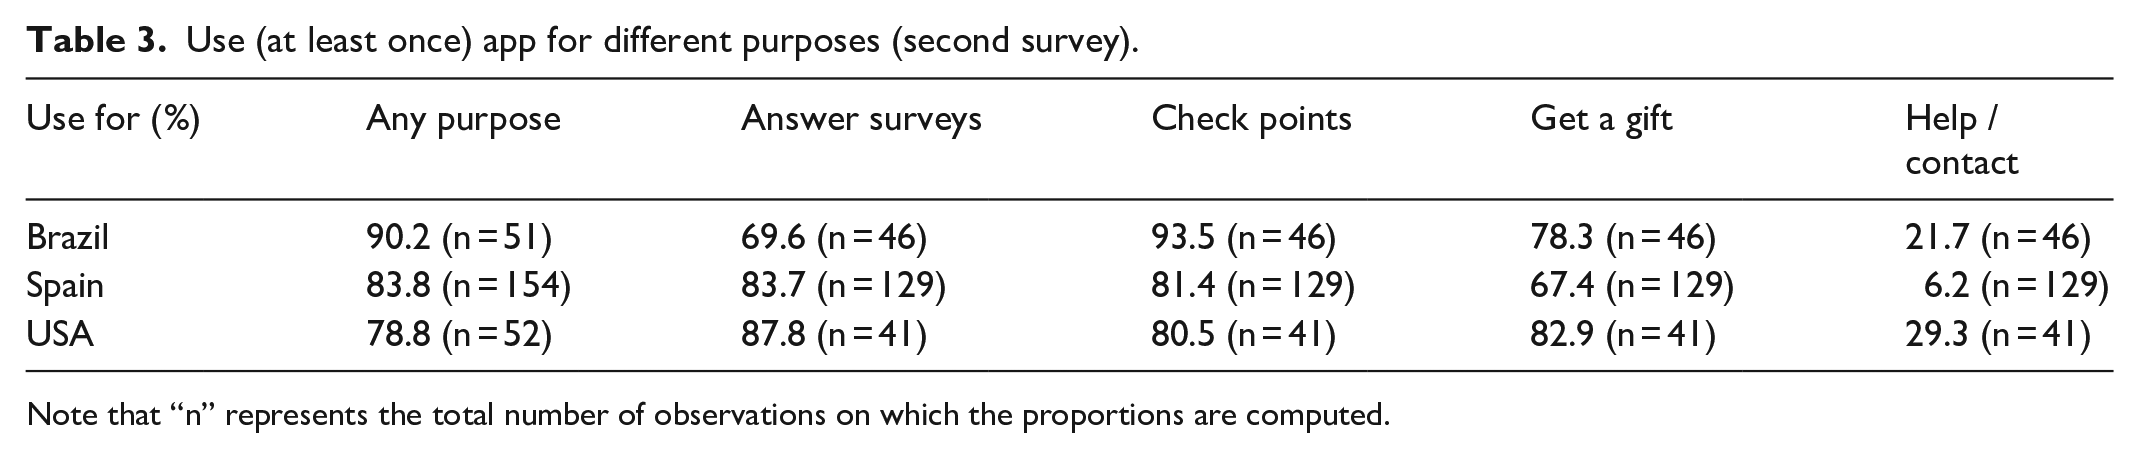
Note that “n” represents the total number of observations on which the proportions are computed.
Even if most panelists used the app after installing it, there is a non-negligible proportion of panelists who installed the app (9.8% to 21.2%) but did not use it in the 38 days after the invitation was sent. Further research would be needed to explain why this occurred. One hypothesis is that we might need to leave them more time, since they may not have had the opportunity. It might also be that they installed the app just to get the three points or because we asked, without planning to use it. When using the app, panelists use it very often for answering surveys, checking points, and getting a gift, while looking at the help/contact section is much less common.
What is the profile of those who installed the app versus those who did not?
To answer our third research question, Table 4 compares panelists who installed the app versus those who did not, in terms of socio-demographics and panel loyalty.
Profile of those who installed the app versus those who did not in the invitation experiment (profiling, panel participation data, and paradata).
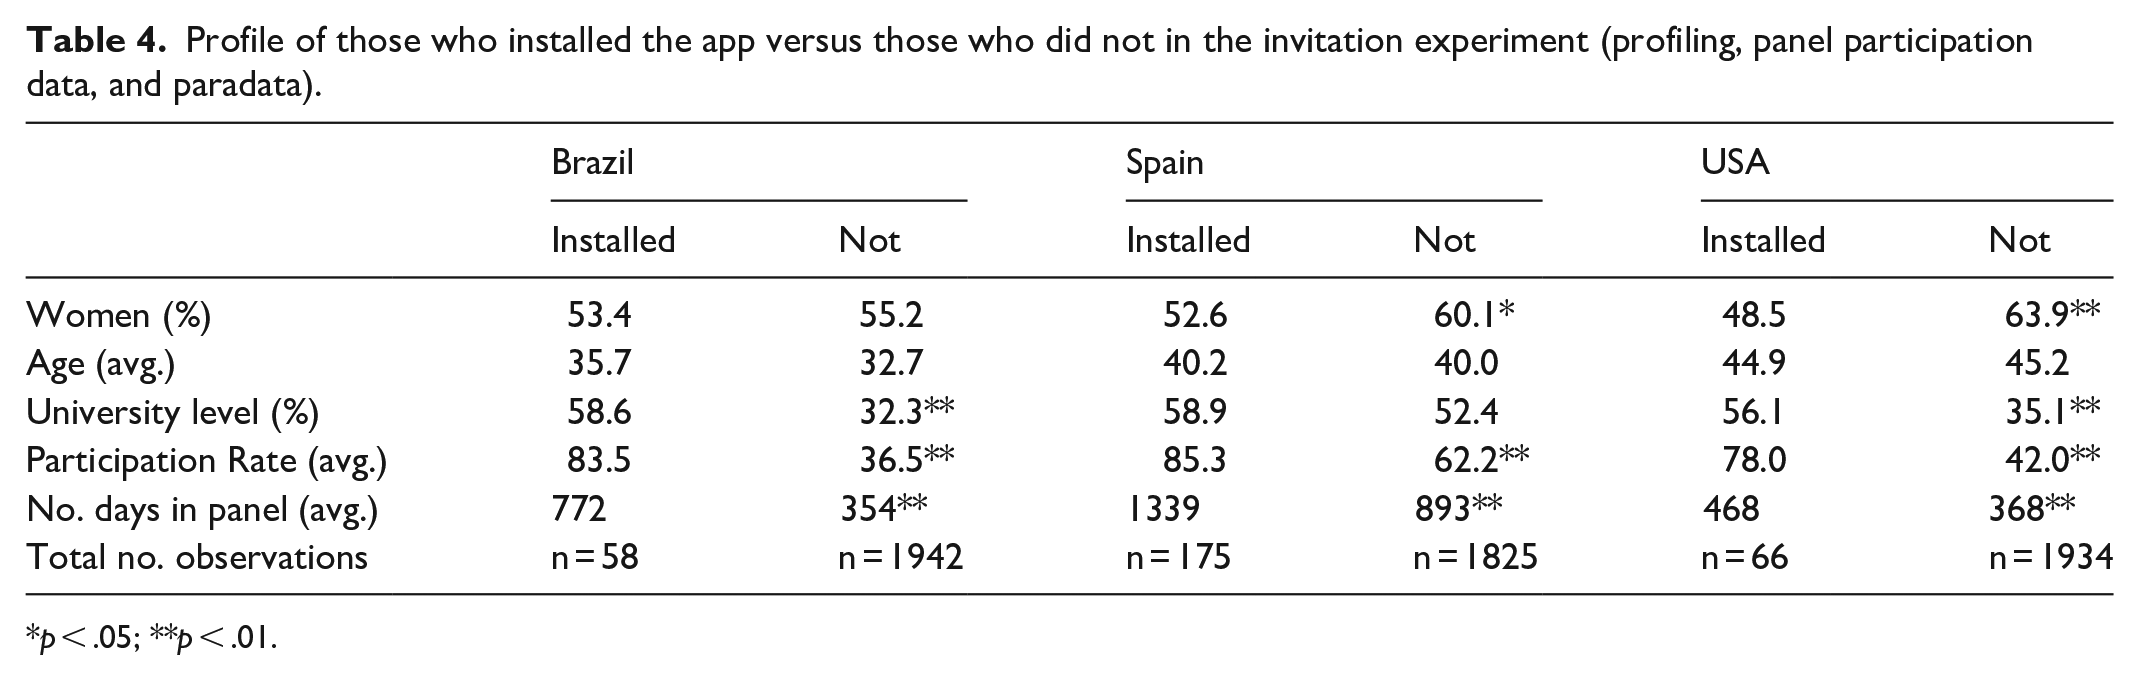
p < .05; **p < .01.
There are no significant differences between those who installed the app and those who did not in terms of age (average). In contrast, there are significant differences between these two groups pertaining to gender in Spain and the USA (more women in those who did not install) and in terms of proportions having a university level in Brazil and the USA (less people with university degree in those who did not install). There are also significant differences in terms of panel loyalty (both number of days in the panel and average participation rate) in all three countries (less loyal in those who did not install). Thus, overall, we do find different profiles. However, we should notice that the number of observations for the groups “Installed” is quite low, particularly in Brazil and the USA. Furthermore, we also replicated the results of Table 4 focusing on the panelists who opened the email according to the paradata information (see Table 4 bis in the supplementary material 3). We found less significant differences between those who installed and those who did not install but opened the email than what we see in Table 4.
Is panelists’ participation increased after they install the app?
Table 5 presents the average participation rate before and after sending the invitations for those who installed the app.
Average participation rate before and after sending the invitations for those who installed and those who did not install the app (panel participation data).
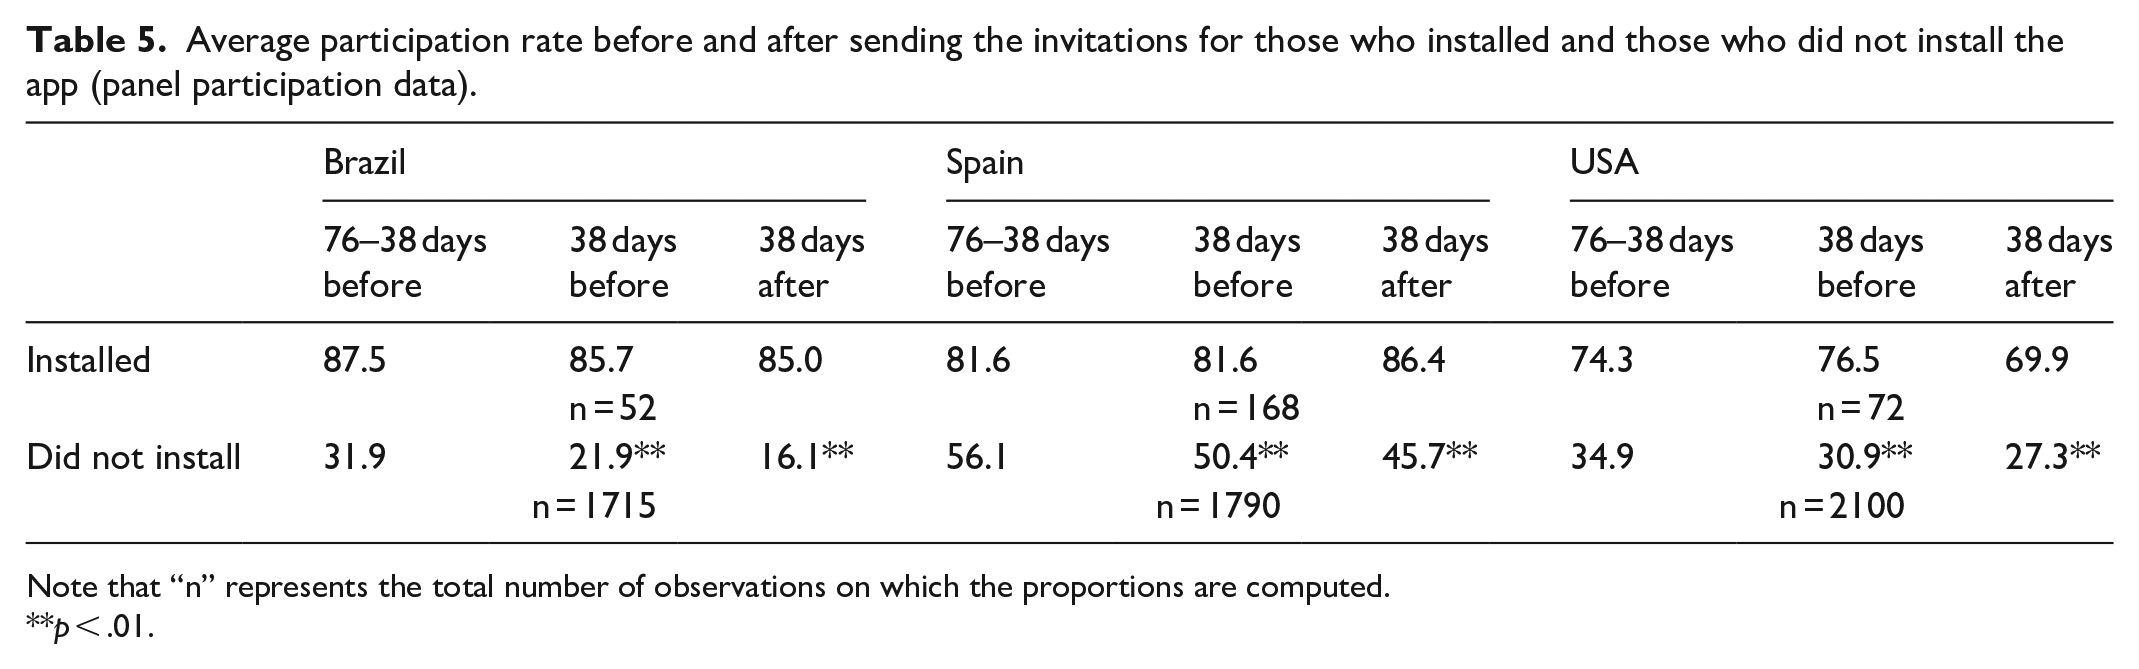
Note that “n” represents the total number of observations on which the proportions are computed.
p < .01.
First, for those who installed the app, if we compare the average participation rate within the period of the 76 to 38 days to the one of the 38 days just before the invitations were sent, we observe a small but non-significant decline in Brazil (87.5% versus 85.6%), stability in Spain (81.6% in both cases), and a small but non-significant increase in the USA (74.3% versus 76.5%).
In comparison, the participation rate just before and just after the invitations were sent is stable in Brazil (85.6% versus 85.0%), slightly increases in Spain (81.6% versus 86.4%), and slightly decreases in the USA (76.5% versus 69.9%), but again, the differences are not significant. This does not suggest much effect of installing the app on the participation. However, we should notice again that we have a small number of observations for the group who installed.
Also, it is interesting to note that panelists who installed the app have much higher participation rates overall, both before and after the invitations, than panelists who did not install the app. In addition, those who did not install the app show significantly decreasing participation rates over time: due to this reduced involvement in the panel, it might not be useful for them to install the app.
What are the main reasons for installing or not installing the app?
Respondents of the treatment groups were asked in an open-ended question to provide the main reasons why they installed or did not install the app in the 38 days after the invitations were sent. We report the reasons mentioned most frequently, based on all three countries.
On the one hand, the main reasons for installing the app are comfort (mentioned by 31.4%) and ease (19.0%), followed by the fact that they want to do surveys or more surveys (14.0%), the incentive received (12.0%) and then the fact that they like to get notifications from the app when a new survey is available (9.3%). Respondents also mentioned that it makes it quicker for them (6.6%).
On the other hand, the main reason for not installing the app are concerns about space or battery use (21.5%), even if the Netquest app is small (only 35 MB). This is followed by people forgetting or not having time (15.5%), the preference for using a PC for answering surveys (10.0%), people thinking they have too many apps (7.6%) or that the app is not needed (5.8%). We also have many respondents who did not install the app simply because they did not know there was one (14.2%), which is probably linked to the low opening rate of the email invitation. It is interesting to notice that only 3.3% of the respondents mentioned issues related with privacy/safety/trust.
What could be done to increase the installation of the app?
On the one hand, around 26.7% of the panelists who did not install the app and answered the question about what could be done to convince them to install the app in the second survey (n = 1531) said that nothing could be done by Netquest. However, it was not always clear that this really meant that they would never install such an app. In some cases, it simply suggested that there was no need from Netquest to do something. On the other hand, 8.7% said that they will install the app now/soon: these are mainly panelists who did not know about the app or forgot; answering the survey learned or reminded them about the app.
Besides these two groups, the main aspects panelists mentioned that could convince them to install such an app are getting a material incentive (often huge, e.g. a new phone; 20.0%), just ask/remind them again (9.2%), need for a better device (6.3%), that the app should take less space/use less battery (5.7%), that Netquest should provide them more information explaining the advantages (5.1%), and that the app should be more useful (more surveys, surveys only in app; 4.4%).
Since some respondents said that they will install the app now/soon, around 1 month after the second survey (26 February 2019), we checked whether the respondents of the second survey who had not installed the app before the survey started installed it later: 142 panelists (8.6% of those who had not installed and answered the second survey) did so. Within them, it is interesting to notice that 39 had answered that they will install, 18 that they would do it if we would ask again (which we did not do), 17 that they would do it in exchange of an incentive (which we did not give them), and 15 had said “nothing” (underlying again that this “nothing” did not necessarily mean that they would never install such a app, only that Netquest did not need to do anything to convince them).
What could be changed in the app to make it more attractive?
Panelists who installed the app were asked to evaluate the app and whether they had suggestions on how to improve the app. First, the evaluation of the app was quite good overall: a large majority of respondents (total n = 216) liked it (81.5%), found it easy to use (86.1%), useful (77.8%), and considered that it improved their experience as panelists (76.4%).
As a result, 59.3% of the respondents said that nothing needed to be changed in the app. The main suggestions for changes were that the surveys could be done within the app and not redirect you to the browser (6.5%) and that they should receive more surveys to make it more useful (5.6%).
Discussion
Summary of results
In this study, we investigated the knowledge and use of an app in the frame of an online opt-in panel (Netquest) in Brazil, Spain, and the USA, as well as the possibility to increase the app installation and usage, and how this would affect the participation. We found that most panelists do not know about the existence of the app. Therefore, the app installation and use are quite low. Sending invitations usually leads to a significant increase in the installation, but the proportion of respondents installing the app stays low. This could be related to the fact that we only focus on panelists who did not install the app by themselves before our experiment, but also due to the fact that only 1/3 of the invited panelists opened the invitation email, and to an overall relatively low involvement in the panel (even if we focused on active panelists as defined by Netquest, more than half of the invited panelists had a participation rate of 0 in the 38 days before receiving the invitation). The invitation message that in general lead to the highest installation emphasized the benefits only for the panelist. Offering a small incentive only helped in Spain. We should notice that the panels in the different countries are very different (e.g. USA started much later). Thus, the differences observed across countries should not be interpreted as differences in culture; but most likely (at least partly) as differences due to the maturity of each panel. The profile of those who installed the app differ on many aspects from those who did not install. The participation rates of panelists after they installed the app are not significantly different from their participation rates before. The main reason for installing the app is comfort while the main reason for not installing is space/battery use. Around three-fourths of those who did not install the app could accept to install it, mainly in exchange for a (large) material incentive. But there are also many respondents (17.9%) who said they will do it after the survey or simply if we ask/remind them again.
Limitations
This study also presents some limitations. First, we had to measure the use of the app based on survey answers and not on paradata since it was not possible to retrieve this from the paradata available. People might not recall properly their use of the app. Second, the low opening rate of the invitation email means that many panelists did not really receive the treatment. Reminders could have improved this opening rate. In addition, probably linked to this low opening rate of the invitation email, only few panelists installed the app and answered our second survey. The resulting small number of observations limits the possible analyses and pushed us to combine the treatment groups and sometimes the countries. Moreover, there is self-selection in who downloaded the app or not. This limits the possibility to study the effect of the app installation on the subsequent survey participation. Furthermore, our focus is on panelists who have not installed the Netquest app until the point where we started the study. They might very well differ from those who have. Thus, the results are limited to a portion of the full panels. In addition, we used open-ended questions to leave more freedom to respondents, but some answers were difficult to interpret/classify or not in line with other information (e.g. people saying I did not install the app but paradata suggests that they have the app installed, or vice versa). Also, the answers were coded by only one researcher. Furthermore, this is only a one case study. In a panel where surveys are sent more frequently or that proposes an app with more functionalities (e.g. allowing to answer surveys without Internet or a tracking app), results could be very different (more emails opened, more useful for panelists to install the app, etc.). Finally, even if we have three countries, we cannot make conclusions about cross-national differences since countries differ in many aspects, particularly when the panels were created.
Practical implications
Even if the study has limitations, we can learn important lessons from it that have direct practical implications. If researchers/fieldwork companies want people to install and use the app more (e.g. such that they can take advantage of this for collecting different data types), they need first to put more efforts into the app characteristics (to guarantee it uses minimal space/battery) and what the app can do, to make it more useful for panelists (since installing an app for answering one survey every 2 months is not worth it). For instance, the app could have more functionalities such as giving feedback to panelists based on their survey answers or other data collected through the app. Second, they need to better inform panelists about the app (e.g. the Netquest app only occupies 35 MB so space should not be a problem, but panelists need to be informed clearly about this). They need to send more than one invitation email (since lot of respondents did not see the invitation email, and almost 10% actually suggested that Netquest should ask/remind them again) and include more information in it (what exactly is the size of the app, how much battery use is expected, what are the advantages, what are the different functions, how to install it, etc.). Proposing higher incentives might also help, since the one proposed in this study was especially small. Future research could investigate further whether larger incentives are more efficient.
Supplemental Material
sj-docx-1-mio-10.1177_2059799120985373 – Supplemental material for Use of a research app in an online opt-in panel: The Netquest case
Supplemental material, sj-docx-1-mio-10.1177_2059799120985373 for Use of a research app in an online opt-in panel: The Netquest case by Melanie Revilla, Ezequiel Paura and Carlos Ochoa in Methodological Innovations
Footnotes
Acknowledgements
We thank all the Netquest team who provided help at different stages, and in particular Cristina Medina and the marketing team for their support in preparing the invitation emails, as well as an anonymous reviewer for his or her very helpful comments on a previous draft of this article.
Declaration of conflicting interests
The author(s) declared no potential conflicts of interest with respect to the research, authorship, and/or publication of this article.
Funding
The author(s) received no financial support for the research, authorship, and/or publication of this article.
Supplemental material
Supplemental material for this article is available online.
Notes
Author biographies
References
Supplementary Material
Please find the following supplemental material available below.
For Open Access articles published under a Creative Commons License, all supplemental material carries the same license as the article it is associated with.
For non-Open Access articles published, all supplemental material carries a non-exclusive license, and permission requests for re-use of supplemental material or any part of supplemental material shall be sent directly to the copyright owner as specified in the copyright notice associated with the article.