
Abstract
This article compares the effectiveness of a research messenger layout to a traditional online layout with regards to probing. Responses to different types of probes (explanation, elaboration and category selection probes) were examined in terms of length and quality, measured by number of characters, number of themes, and an indicator for response quality. The research messenger layout, regardless of device being used, had a negative effect on both response length, number of themes and response quality. Further, we found that in both the traditional and research messenger layout, using a mobile device negatively affects the number of characters and themes used in probed responses. We conclude that probing is most effective when a traditional survey is completed on a computer. The research messenger layout was not able to generate responses of similar quality compared to the traditional layout, regardless of device being used.
Introduction
Though web surveys are still by far most often completed on computers, online surveys are increasingly completed on other devices, especially on smartphones (Antoun et al., 2018; Callegaro, 2010; Lugtig and Toepoel, 2016; Mavletova, 2013; Revilla and Ochoa, 2016; Tourangeau et al., 2017). Research on web surveys found response length to be shorter for mobile surveys compared to computer surveys, in terms of words and characters (Mavletova, 2013; Revilla and Ochoa, 2016). Some even concluded that open-ended questions should be avoided in mobile web surveys, since the small screen sizes of mobile phones and their functionality of a touch screen decrease ease of completion (Antoun et al., 2018; De Bruijne and Wijnant, 2014; Mavletova, 2013; Peytchev and Hill, 2010). It is, however, important to design an online mixed-device survey in such a way that it is mobile friendly, to ensure mobile responses to be equally effective as computer responses.
Open-ended questions are in general associated with lower response rates and lower response quality, since they require more effort to answer than closed-ended questions (Behr et al., 2012; Behr et al., 2013; Galesic, 2006; Holland and Christian, 2009; Israel, 2010; Meitinger et al., 2018; Smyth et al., 2009). However, open-ended (narrative) questions are beneficial to go deeper into what respondents think (Revilla and Ochoa, 2016) compared to closed questions. Open-ended questions are sometimes asked by means of probes. Probing is a method used frequently to gain additional information that is otherwise unseen, resulting in longer and more complete responses to questions, and hence an increase in data quality (Beatty and Willis, 2007; Willis, 2004a, 2004b; Willis and Artino Jr, 2013). Mobile phones have become a frequently used device for survey completion. Research on how to design mobile surveys with regards to open-ended questions is lacking, however. With mobile phones, people are becoming increasingly accustomed to using messenger tools for short texting. Apart from text messaging that has been available on mobile phones since the 1990s, apps like Whatsapp, Telegram or Facebook Messenger are being used to have ‘conversations’ online. Because these so-called messenger apps are becoming more and more natural conversation tools, they could also be used within surveys to enhance a conversational interviewing style. A survey designed as a research messenger may foster the survey as a conversation, and may prove to be a more natural survey experience, especially when the survey is taken on a mobile phone. In particular, we expect a messenger layout to result in better answers to open questions, resulting in longer answers and richer information.
In this study we use data from an online survey distributed in the US among Amazon Mechanical Turk panel members in which respondents were randomly assigned to a research messenger layout and a traditional (normal) online survey layout. This enabled us to investigate whether a messenger layout is more effective for probing. We also investigate whether a certain combination of survey layout and device (computer or mobile device) increases response length, number of themes and response quality. In addition, we perform reliability analyses to investigate if the open-ended responses from the research messenger layout can be coded as reliable as the traditional layout.
Theoretical background
Since the early 1980s, scholars have studied the cognitive and communicative processes underlying survey responding (see e.g. Schwarz, 1999; Schwarz and Oyserman, 2001 for overviews). The literature distinguishes four cognitive steps, which respondents go through when answering survey questions; respondents must first comprehend and interpret a question, then retrieve relevant information from memory to answer the question, make a judgement about how to respond and finally respond to the question by matching their internally generated response with response alternatives (Collins, 2003; Daugherty et al., 2001; Drennan, 2003; Haeger, Lambert, Kinzie and Gieser, 2012; Schwarz, 1999; 2007; Schwarz and Oyserman, 2001; Schwarz et al., 2010; National Research Council, 1984; Tourangeau et al., 2000 ; Uskul et al., 2010; Willis, 2004a, 2004b). These four steps can be seen as tasks, which respondents need to complete in order to answer a question (Behr et al., 2014; Schwarz, 1999; Schwarz and Oyserman, 2001; Strack and Martin, 1987; National Research Council, 1984; Tourangeau et al., 2000). Whether or not a respondent performs well on each of these tasks can be determined from a cognitive and conversational viewpoint. The cognitive viewpoint can be described from cognitive theories about information processing and memory. From a conversational viewpoint the survey can be seen as a two-person conversation. Thus, how communication takes place in ordinary conversations, affects the way how interaction takes place in a survey. From this perspective, a survey should be designed similar to how people communicate in normal conversations (Ongena and Dijkstra, 2007) in order to have respondents motivated in performing their tasks as survey respondents.
Probing
A tool to help understand the cognitive processes in surveys is probing. The main idea of probing is that respondents are asked supplemental questions to gain additional information on a survey item or question (Beatty and Willis, 2007; Willis, 2004a, 2004b; Willis and Artino Jr, 2013). Probes can thus be seen as follow-up questions, asking for other specific information relevant to the question, or the answer given (Willis, 2004a, 2004b; Willis and Miller, 2011). Additional information can for example be gathered by asking respondents to elaborate on their answer or to reveal what they thought when they first heard the question (Willis, 2004a, 2004b). These are examples of general probes, while specific probes explicitly ask respondents to provide more details on a certain item (Behr et al., 2012; Meitinger et al., 2018; Willis, 2004b). Several studies find specific probes to be more effective than general probes (Beatty and Willis, 2007; Edgar et al., 2016). Although there is not one generally accepted list of probing categories, many authors distinguish between comprehension, recall, paraphrase, confidence, response, and category selection probes (Campanelli, 2008; Collins, 2003).
Comprehension probes ask respondents to define a certain term or to explain what meaning they give to a certain term (Beatty et al., 2002; Behr et al., 2012; Campanelli, 2008; Dietrich and Ehrlenspiel, 2010; Meitinger et al., 2018; Willis, 2004a, 2004b; Willis and Miller, 2011). Paraphrase probes ask respondents to repeat a question in their own words (Dietrich and Ehrlenspiel, 2010). Comprehension and paraphrase probes allow for revealing term and question comprehension. Recall probes, asking respondents how they remember their answer, or how they got to a specific answer, can determine respondents’ cognitive recall strategy. This in turn can indicate response accuracy (Campanelli, 2008; Dietrich and Ehrlenspiel, 2010; Willis and Miller, 2011). Confidence, or so-called certainty probes ask respondents to indicate how sure they are of their answer or how well they think to remember something (Campanelli, 2008; Dietrich and Ehrlenspiel, 2010; Willis and Miller, 2011). Response probes ask respondents for example to indicate whether a certain question was difficult (Campanelli, 2008; Collins, 2003). Such questions can reveal missing answer categories. Category selection probes ask respondents to explain why they chose a certain answer category for a closed-ended question (Behr et al., 2012, 2013; Meitinger et al., 2018; Willis, 2004b). Like comprehension probes, responses to these probes can reveal whether respondents interpreted terms the same and as intended. Probes can hence be used to understand the question-answering process.
Online versus offline probing
While cognitive interviewing is typically executed offline in interviews, probing can be done both in interviews and in self-administered (web) surveys. Probing techniques implemented within web surveys are called online probing (Meitinger and Behr, 2016). A main difference between offline and online probing is sample size. Due to the time-consuming aspect, and therefore high costs, sample sizes are smaller for offline probing (Beatty and Willis, 2007; Behr et al., 2012, 2013, 2014; Conrad and Blair, 2009; Couper and Miller, 2008; Edgar et al., 2016; Willis, 2004a, 2004b). Small sample sizes enable in depth interviews, but might lead to missing potential errors or false negatives (Beatty and Willis, 2007; Blair and Conrad, 2011; Conrad and Blair, 2009; Edgar et al., 2016; Willis, 2004a). Large sample sizes can produce information which otherwise would have been missed, avoid false negatives, and enable quantitative data analysis (Behr et al., 2012, 2013, 2014; Edgar et al., 2016).
Another main difference is the presence of an interviewer for offline probing, who can motivate respondents to give (adequate) answers. Not only interviewers, but also interviewees can act more spontaneous with offline probing compared to online probing; interviewees can make remarks at any time, which might increase voluntary feedback (Conrad and Blair, 2009). Perhaps related to this interactivity, Meitinger and Behr (2016) found offline probing to reveal some problems with questions that online probing did not detect. However, the small sample sizes for offline probing prevents a clear distinction between false negatives and real errors (Drennan, 2003; Meitinger and Behr, 2016). Furthermore, offline probing has the potential risk of interviewer effects (Beatty and Willis, 2007; Behr et al., 2012, 2013; 2014; Blair et al., 2006; Conrad and Blair, 2009; Edgar et al., 2016; Willis and Artino Jr, 2013). The anonymity of the web might be why online probing reveals more often retrieval errors, indicating ignorance in a topic (Meitinger and Behr, 2016). Another favor of online probing is standardization. Respondents are more likely to receive the same probes, which makes results more comparable and thus useful for quantitative analyses (Behr et al., 2012, 2013; Edgar et al., 2016; Meitinger and Behr, 2016). A research messenger survey layout can mimic the presence of an interviewer in online surveys, and hence have the best of both online and offline cognitive interviewing.
Data quality in an era of mobile web
Online surveys are increasingly completed on smartphones (Antoun et al., 2018; Mavletova, 2013; Revilla and Ochoa, 2016; Tourangeau et al., 2017). Smaller screen sizes and touchscreen functionalities appear to have a negative effect on response quality, since these mobile device characteristics decrease ease of responding. Furthermore, since mobile devices can be used at any time at any place, it is more likely that respondents multitask while completing a survey, which decreases their attention. This in turn can decrease response quality. Further, several researchers found that response length for open-ended questions is shorter for mobile surveys compared to computer surveys, in terms of words and characters (Mavletova, 2013; Revilla and Ochoa, 2016). Despite differences in size and functionally, cognitive response processing seems to be similar between respondents of different devices (Peytchev and Hill, 2010). Antoun et al. (2018) and De Bruijne and Wijnant (2014) investigated how response rates and data quality could be improved for mobile web surveys and conclude that mobile surveys should avoid open-ended questions. Peytchev and Hill (2010) and Mavletova (2013) agree on this finding, arguing that response burden increases when a lot of typing is required on smartphones.
In an era of mobile web, an online mixed-device survey should be designed in such a way that open-ended questions require as little effort as possible to answer them, in order to profit from the advantages of probes (Behr et al., 2012, 2013). Responses to open-ended questions, as with probes, might be more useful when asked in a research messenger tool, since people have become increasingly accustomed to the use of messenger tools for short messaging. A messenger tool has a similar look and appearance as a chatbot. Chatbots are commonly used in consumer research (see, e.g. Folstad et al., 2018; Brandtzaeg and Folstad, 2017; Xu et al., 2017), but they have rarely been used in survey research. Crutzen et al. (2011) used a chatbot to answer questions related to sex, drugs and alcohol. The chatbot was evaluated positively in relation to information lines and search engines. A messenger tool has not been tested as a replacement of traditional online surveys, however.
Design
Data
Data come from an online survey which was fielded on Amazon Mechanical Turk (MTurk) in the US. Respondents were randomly assigned to a traditional online survey layout using a responsive design (where the software detects the device of completion and adapts the layout accordingly), or a research messenger layout. Amazon Mechanical Turk (MTurk) is a crowdsourcing marketplace that enables outsourcing of processes and jobs to a distributed workforce that can perform these tasks virtually. Respondents could participate in this study between June and August 2018. The dataset contains information about 2078 respondents. However, 201 respondents were deleted from the dataset since they ultimately did not participate in the survey (only looked at the welcome screen). Furthermore, 149 respondents were deleted from the dataset, since they did not complete the survey (partial nonresponse). In the end, we use information about 1728 respondents (complete interviews). ‘Bots’, that provide automatic fake responses from the same geolocation (not to be confused with chatbots), are reported to be active on MTurk; we found no evidence in our data of the presence of these ‘bots’; this was probably due to the fact that we asked respondents to complete the survey outside of MTurk, and used a lot of open questions. We checked the quality of answers, response durations, and the navigation behaviors (e.g. going back), and have not found any suspicious data.
The survey contained four blocks. Each block consisted of questions about one of the following topics: politics, news, sports and health. After finishing these four blocks, all respondents received some questions about their background and their opinion on the survey in general. As Meitinger et al. (2018) show, the order in which different types of probes are asked, affects response quality. Therefore, we randomized the order of the four blocks to avoid question order effects and possible respondent fatigue dependent on the position of probe in the survey. Respondents received about 30 questions. Some of these questions were followed by probes. Throughout the survey, respondents received 18 open-ended probes and one closed-ended probe. In this paper we focus on three open-ended probes: an elaboration, explanation and category selection probe. In Appendix 1, an example of each probe type and its preceding question is shown.
While respondents could self-select into a device (computer, mobile phone or tablet) to complete the survey, they were randomly assigned to either the traditional online survey layout, or a research messenger layout. The two layouts are rather similar, for example in terms of color and presentation of answer options. However, the styles differ in some areas. The size of the text box was larger in the traditional layout than the research messenger layout. We decided to adapt the size of the answer box to common practice in traditional surveys (large box) and messengers (small box). Furthermore, for open questions, ‘next’ buttons were used in the traditional layout while respondents in the research messenger layout had to press enter. Autoforwarding was used in both type of layouts for closed questions. For the research messenger layout, the software was programmed in such a way that it took some time before the next question would pop up, similar to a messenger tool (‘Peter is typing’). In Appendix 1 screenshots of both layouts are presented, illustrating how they differ in the selection of answer possibilities. Due to the exploratory nature of the research, we have no clear hypotheses. We expect that the conversational element of the research messenger layout is higher than for the traditional layout; although reactions to respondents’ answers are all preprogrammed, the research messenger layout resembles respondents to have interactive contact with an interviewer. Because of the resemblance of a conversation, it can be conjectured that the research messenger layout leads to longer responses, as with offline probing with an interviewer. However, shorter response lengths for the research messenger layout can be conjectured too, since respondents are texting in a messenger tool and people often use abbreviations and keywords whilst texting. Overall we expect that those surveys completed on mobile phones, regardless of type of survey, lead to shorter response length, because the smaller screens and touchscreens are less beneficial for typing long responses.
Conceptualization of variables
Dependent variables
The main goal of this study is to investigate the effectiveness of layout (traditional versus research messenger) on probing, in terms of response length, number of themes, and response quality. Three open ended probes were chosen on the basis of representing different types of probes. In section A, respondents were asked how much time they spend using the internet, whereupon an explanation probe followed. This probe asked respondents to describe a few main activities that characterize a typical day for them. In section B, respondents were asked to briefly describe ‘the main problem facing the U.S.A today’, whereupon an elaboration probe followed, asking respondents to write more about this specific problem. In section C, respondents were asked to indicate to what extent they agreed with a statement, whereupon a category selection probe was asked. This probe asked respondents to explain why they chose a certain answer. The three open probes will from now on respectively be referred to by Explain, Elaborate and Choice. These probes are shown in Appendix 1.
For these three open probes two distinctive coding schemes were developed by four researchers; one for the number of themes mentioned in probe responses and one for response quality. The first 500 responses to two probes (Explain and Choice) were coded for both themes as quality by all four researches. To compare the coding so far, four Cohen’s Kappa values were computed and were as follows; 0.72, 0.53, 0.76, 0.46. These Kappa values respectively refer to the number of themes in responses to the Explain probe, its response quality, and the number of themes in responses to the Choice probe and its response quality. Though according to Fleiss these Kappa values were all fair (0.4 to 0.6), good (0.6 to 0.75) or even excellent (0.75 +) (Fleiss and Cohen, 1973), both coding schemes were adapted by the researchers, to increase the coding similarity between the researchers (Allen et al., 2014). Subsequently, the next 300 responses were coded by only two researchers, following the new coding schemes. Again, Kappa values were computed, resulting in 0.86, 0.77, 0.91 and 0.75. According to Fleiss, all Kappa values were now excellent. Therefore it was decided to let one researcher code the remaining responses.
Characters: One indicator of response length is the number of characters used in probe responses. Three variables were computed for the number of characters used in response to the three open-ended probes. A fourth variable represents the sum of these three variables. A fifth variable represents the total number of characters used in responses to all 18 open-ended probes used in the survey.
Themes: As another indicator for response length, we manually coded the number of themes mentioned in responses to two probes (Explain and Choice). Each characteristic of a typical day mentioned in responses to the Explain probe, and each reason to choose a certain answer category mentioned in responses to the Choice probe, were counted as a theme. A third variable represents the sum of these two variables. No themes were coded for the Elaborate probe, since the item only asked a single theme.
Quality: The quality of responses to all three probes (Explain, Elaborate and Choice) were rated a score of 1, 2 or 3, where 3 indicated the highest quality. Our coding scheme defined high quality as responses that were clear, complete and or consisting of multiple details. These responses would not need any further explanation or elaboration of respondents. Responses which were not clear at all or not answering the question, were seen as low quality responses. These responses would need multiple additional questions in order to be understood. A response was rated as medium quality, when asking one additional question should be enough for the response to become clear and complete. As a fourth variable, the sum of the three probes was created compared to the sum scores before. This resulted in a scale from 3 to 9. Therefore, we recoded this sum score into three categories (3–4, 5–7, 8–9), to keep all quality scales consistent on a three-point scale within the study.
Independent variables
A binary variable (RM) was computed for the type of layout; respondents were either assigned to a traditional layout (0) or to a research messenger layout (1).
Furthermore, the effect of the combination of assigned layout and self-selected device on response length and quality is investigated. Respondents could self-select into a computer, mobile phone or tablet. Since only a few respondents chose to complete the survey on a tablet and because mobile phones and tablets can be seen as rather similar, these devices were together seen as mobile devices (MOB). By far most respondents self-selected into a non-mobile device (computer). When combining self-selected device and assigned type of survey, four groups appear; Group 1 (TRAD on MOB) consists of people who completed the traditional layout on a mobile device; Group 2 (TRAD on COMP) consists of people in the same layout condition, but who completed the survey on a computer; Group 3 (RM on MOB) consists of people who completed the survey in a research messenger layout on a mobile device; and Group 4 (RM on COMP) consist of people in the same layout condition, who completed the survey on a computer.
In addition, effects of gender, age, level of education and self-perceived mobile phone skills are used as independent variables. Before a dummy variable (Female) could be computed for gender, people who indicated to neither belong to females (1) nor men (0), were categorized as missing. Education was also recoded into a dummy variable, resulting in people being either a college graduate (1) or not (0). Further, we use age as a continuous variable. Since the proportion of self-perceived phone skills is highly skewed, no changes were made to its five original categories, ranging from ‘beginner’ to ‘advanced’. In Table 1 the descriptive statistics of all dependent and independent variables are shown.
Descriptive statistics of dependent and independent variables
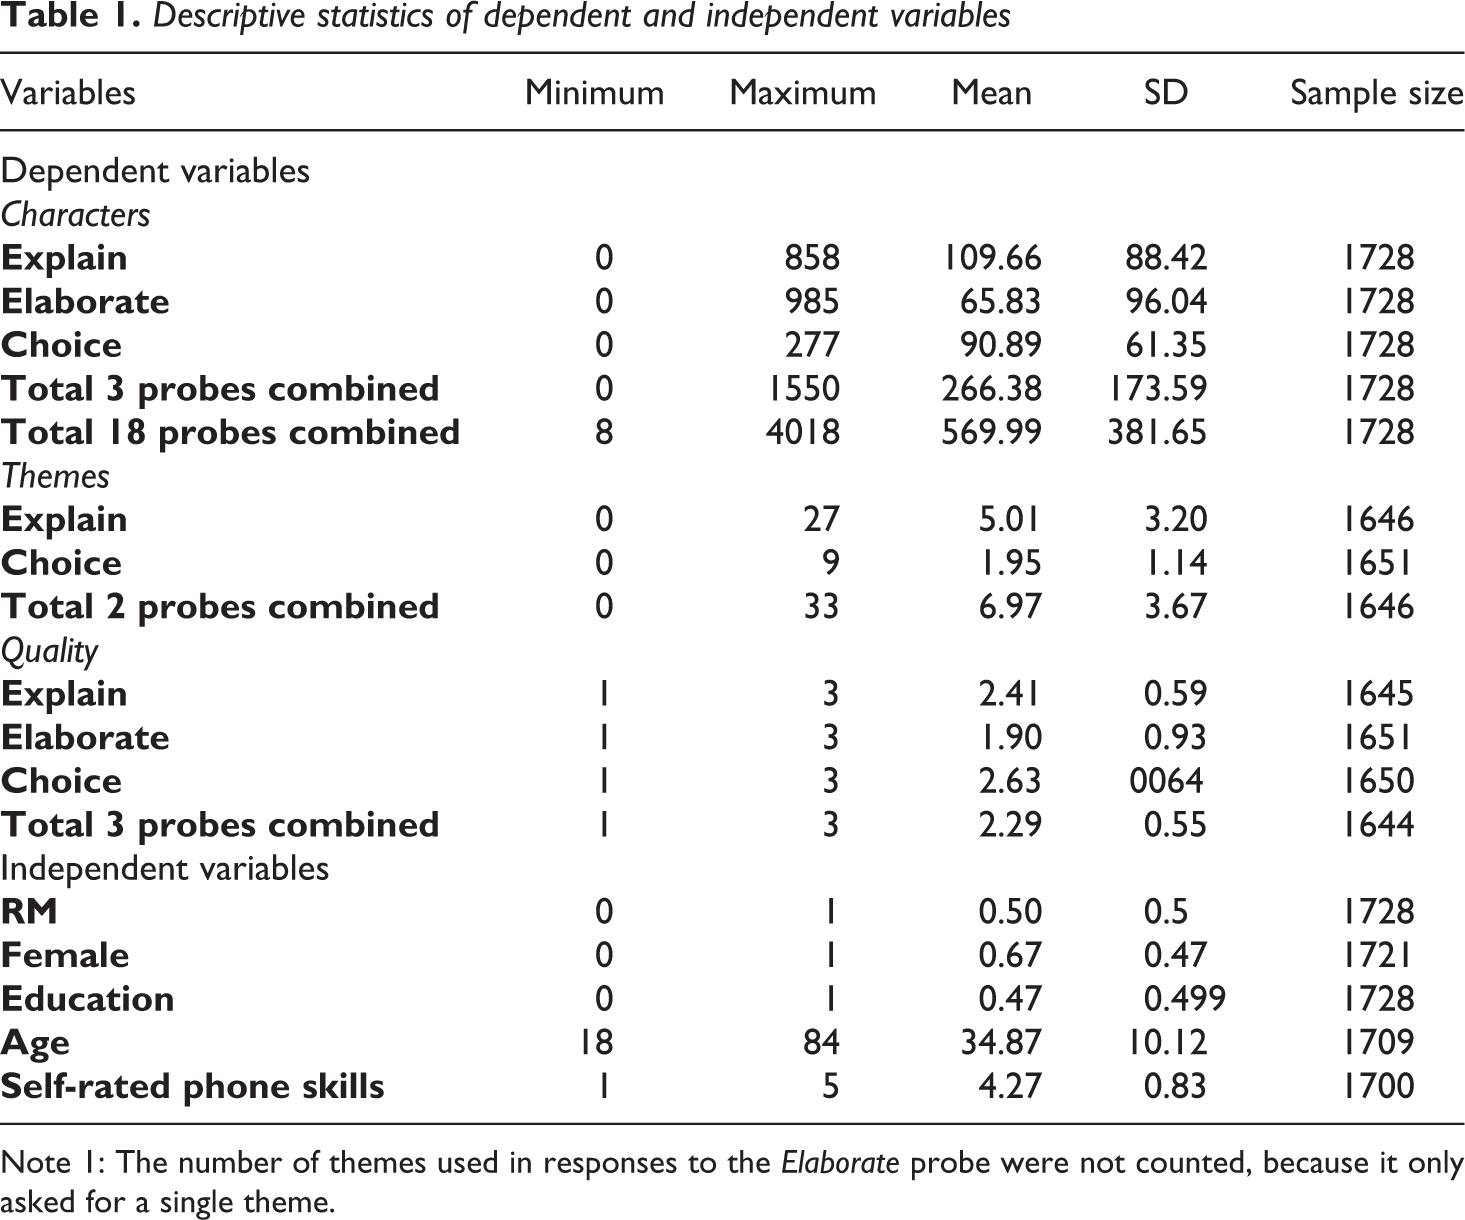
Note 1: The number of themes used in responses to the Elaborate probe were not counted, because it only asked for a single theme.
The survey results, together with the coding schemes, were converted into SPSS, in order to conduct statistical tests.
Results
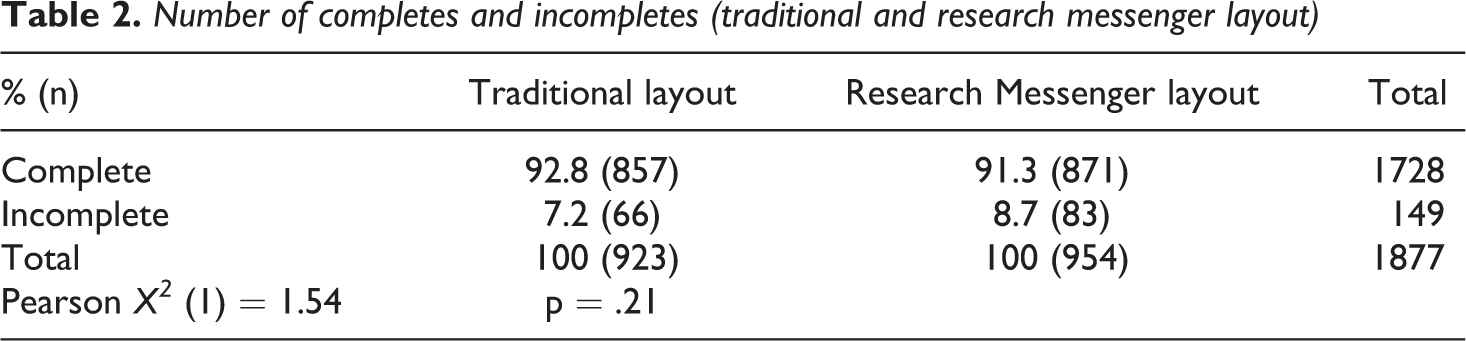
Table 2 shows the number of complete and incomplete surveys per layout, and Table 3 shows the number of self-selected devices for completes. There are no significant differences between the research messenger layout and the traditional layout when it comes to number of completes or device used to complete the survey. Table 4 shows differences in duration of the survey: it took respondents from the traditional layout approximately one minute less to complete the survey than respondents from the research messenger layout.
Number of completes and incompletes (traditional and research messenger layout)
Number of self-selected devices for completes (traditional and research messenger layout)
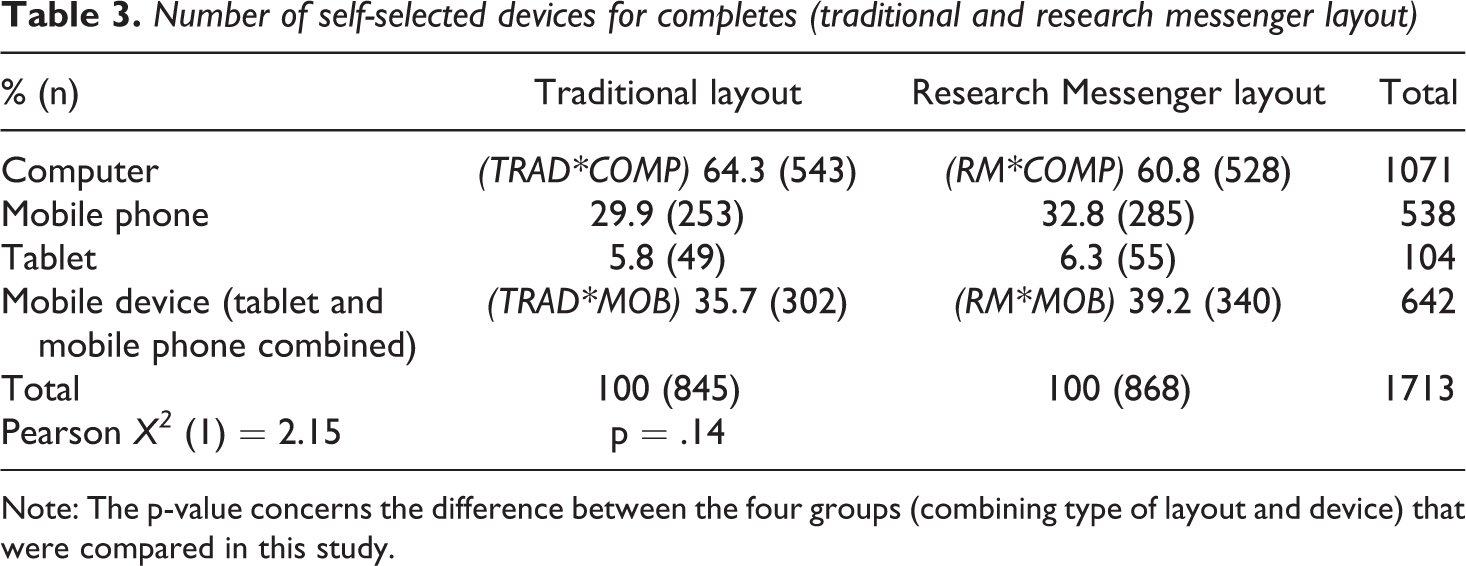
Note: The p-value concerns the difference between the four groups (combining type of layout and device) that were compared in this study.
Survey duration in seconds for completes (traditional and research messenger layout)
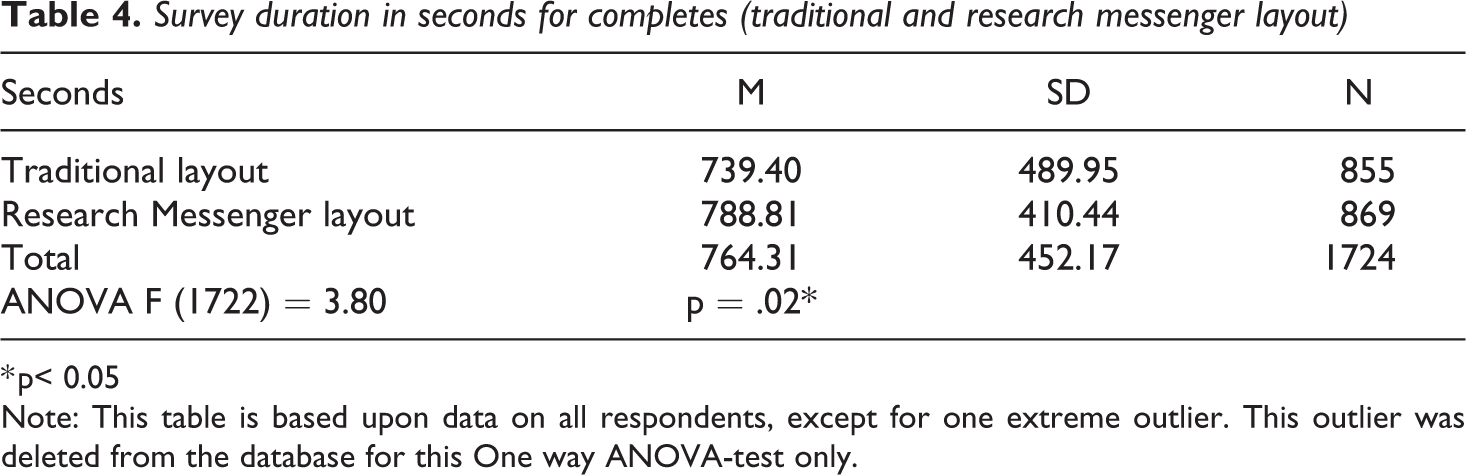
* p< 0.05
Note: This table is based upon data on all respondents, except for one extreme outlier. This outlier was deleted from the database for this One way ANOVA-test only.
Response length open-ended probes
We also performed eight One way ANOVA-tests to compare the type of layout combined with device on response length, in terms of number of characters and themes used in probe responses. To see which groups differ significantly from each other, we subsequently conducted Tukey post hoc tests.
Table 5 shows that no significant differences were found between the two layouts and the device being used in the number of characters or themes mentioned in responses to the Choice probe. However, for the Elaborate probe we found significant differences, with surveys completed in the research messenger layout (both on mobile and computer) showing fewer characters and themes compared to the traditional layout. When we combine the results of the three probes, we see that the traditional layout completed on a computer generated more characters and themes compared to the traditional layout completed on a mobile device or any of the research messenger groups. This effect is more apparent when investigating all 18 probes combined. The traditional layout completed on a computer generated significantly longer responses than the traditional layout completed on a mobile phone, while this last group generated significantly longer responses than any of the two research messenger groups.
One way ANOVA-tests (mean scores) comparing type of layout and device for response length
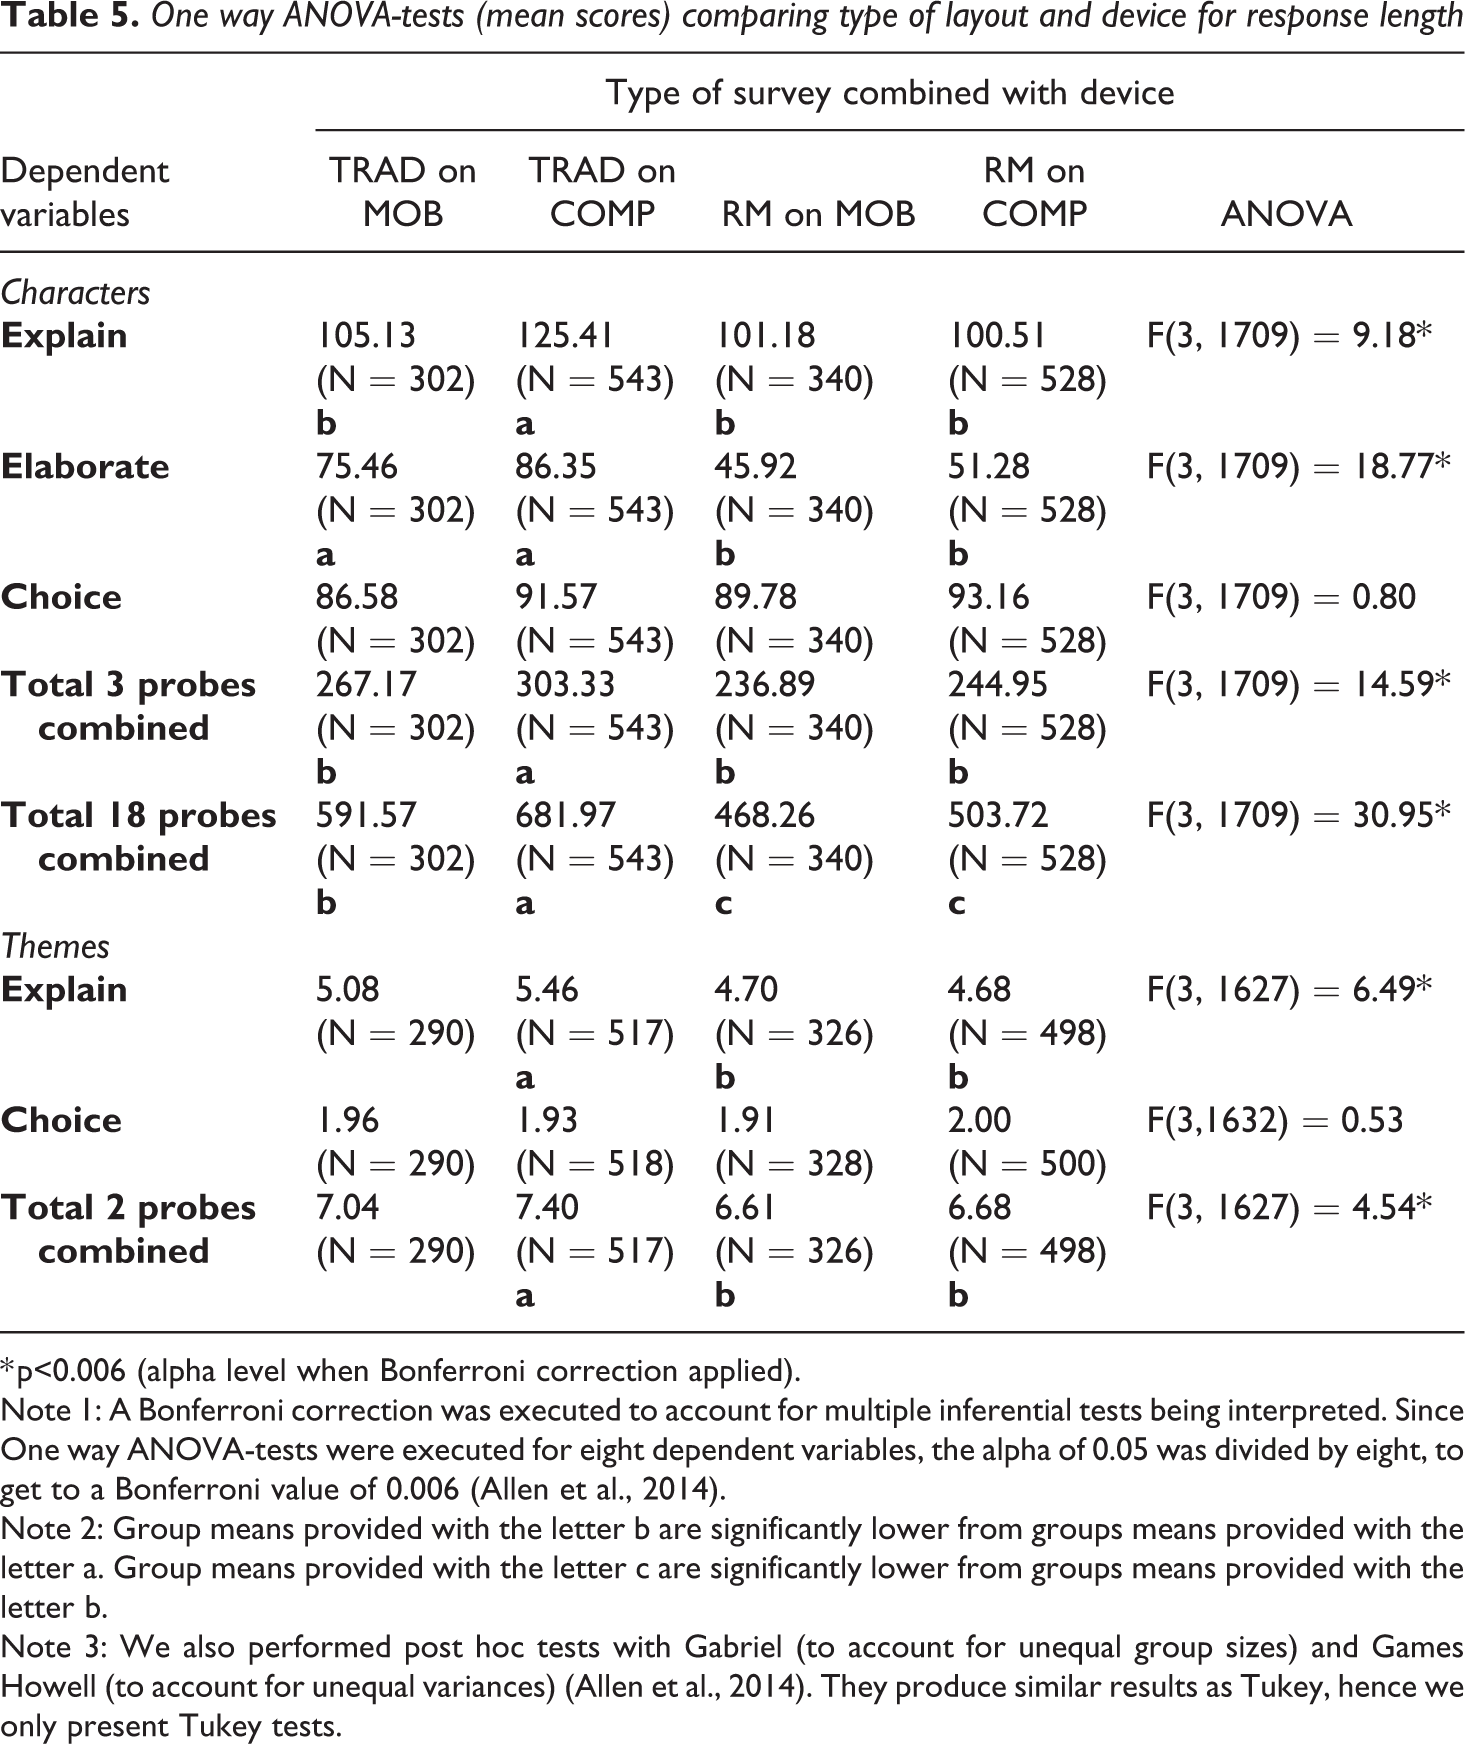
* p<0.006 (alpha level when Bonferroni correction applied).
Note 1: A Bonferroni correction was executed to account for multiple inferential tests being interpreted. Since One way ANOVA-tests were executed for eight dependent variables, the alpha of 0.05 was divided by eight, to get to a Bonferroni value of 0.006 (Allen et al., 2014).
Note 2: Group means provided with the letter b are significantly lower from groups means provided with the letter a. Group means provided with the letter c are significantly lower from groups means provided with the letter b.
Note 3: We also performed post hoc tests with Gabriel (to account for unequal group sizes) and Games Howell (to account for unequal variances) (Allen et al., 2014). They produce similar results as Tukey, hence we only present Tukey tests.
Response quality open-ended probes
Furthermore, four Chi square-tests were executed to determine whether response quality differed between the four groups. Table 6 shows no significant differences in the Explain and Choice probe for response quality. There are, however, significant differences for the Elaborate probe. Response quality is higher for the traditional layout on computer. The traditional layout on mobile and the research messenger layout on computer have somewhat the same amount of high quality responses. The research messenger layout on mobile has the lowest amount of high quality responses.
Chi square-tests comparing combination of type of survey and device for response quality
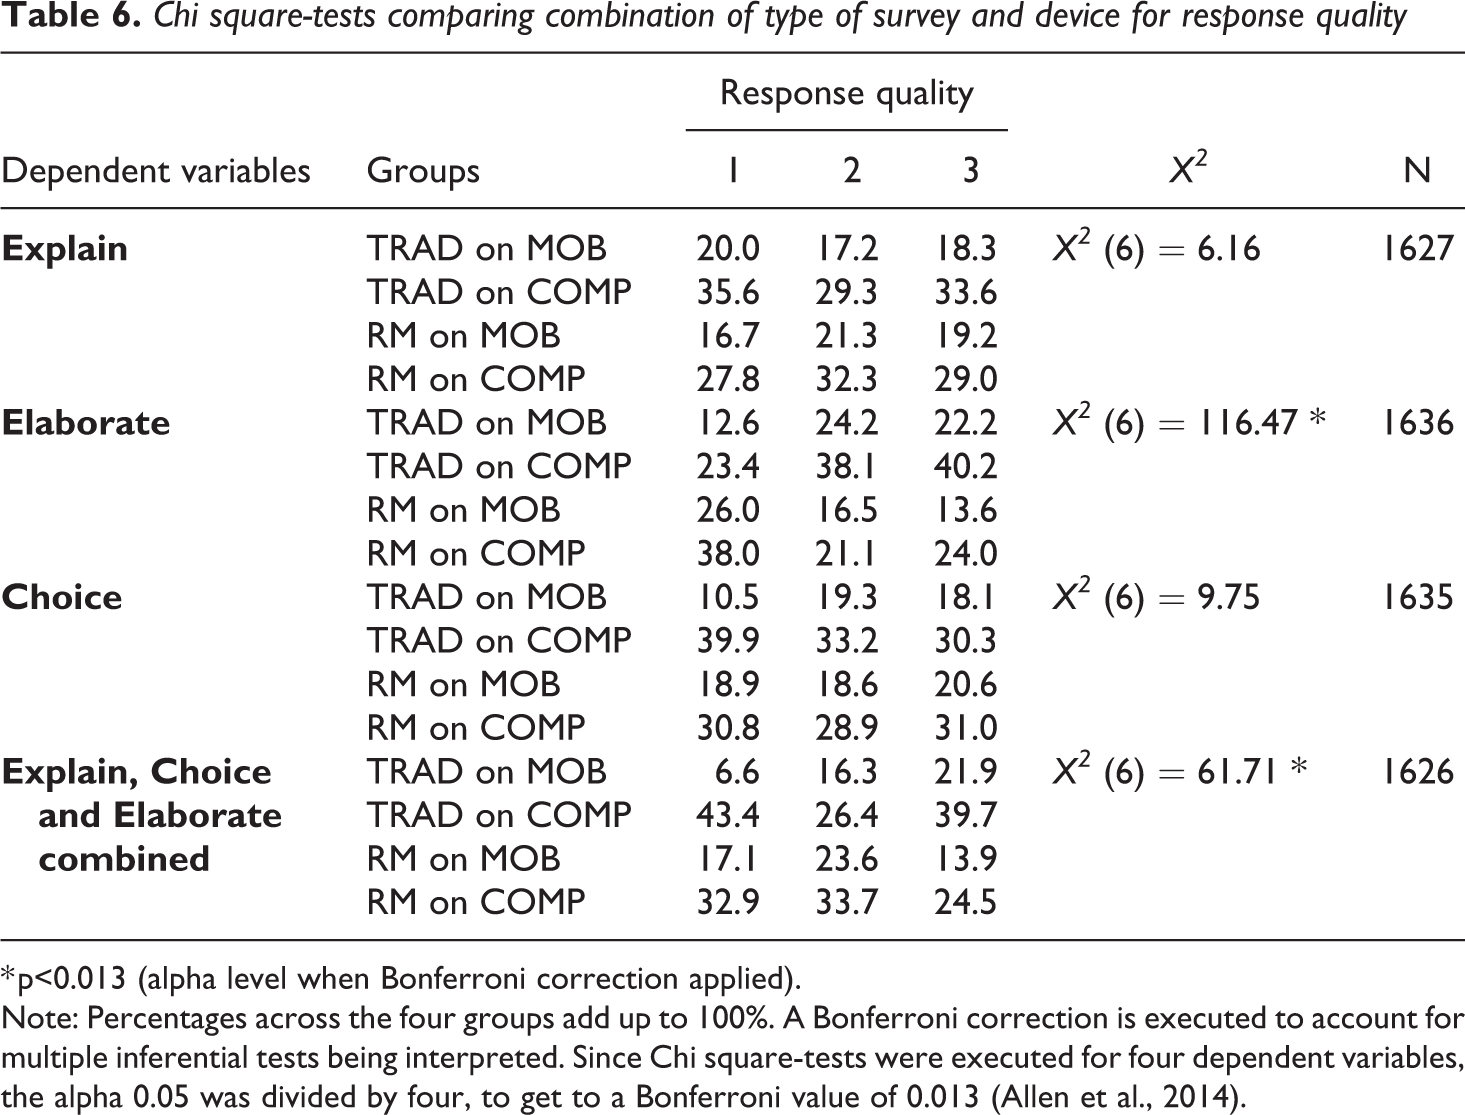
* p<0.013 (alpha level when Bonferroni correction applied).
Note: Percentages across the four groups add up to 100%. A Bonferroni correction is executed to account for multiple inferential tests being interpreted. Since Chi square-tests were executed for four dependent variables, the alpha 0.05 was divided by four, to get to a Bonferroni value of 0.013 (Allen et al., 2014).
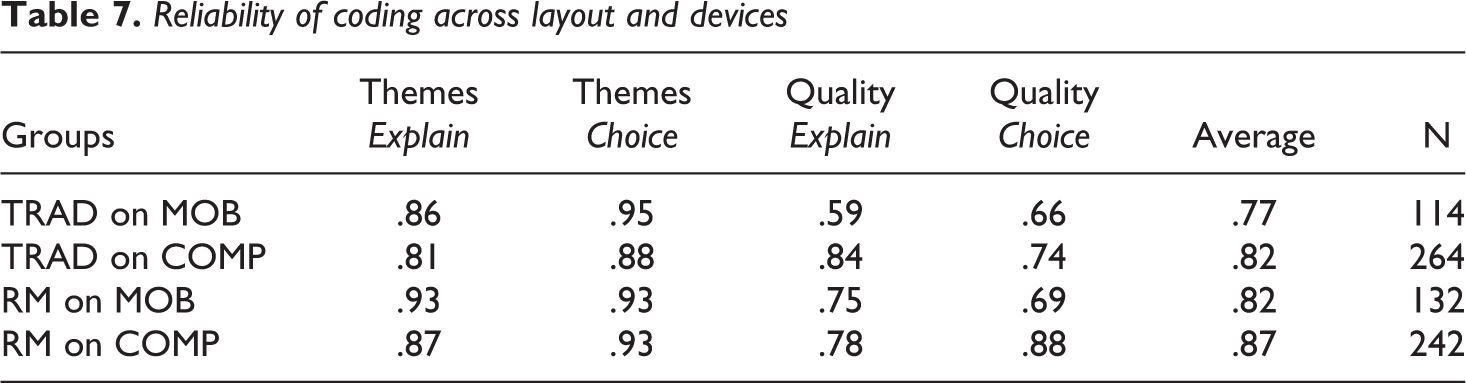
Reliability of coding across layout and devices
To test the quality of the open-ended answers to the probes, we split the reliability analyses that we conducted earlier (see Methods section) to ascertain that we were able to clearly identify how the number of themes and response quality indicators compare across the layout formats and devices. Table 7 shows some variation across the probes that ask to explain and motivate the choice for an answer, but on average, we see that answers in the research messenger layout have about a .05 higher reliability than the questions asked in the traditional layout, and that the reliability of answers on a computer are about .05 higher than those answered from a mobile device.
Reliability of coding across layout and devices
Predicting response length and quality
We conducted a multiple linear regression analysis to predict the number of themes for the Explain and Choice probe combined from the type of layout and device being used, gender, age, education, and level of phone skills. Table 8 shows that compared to the reference group (traditional layout on computer) there is an equal number of themes when the traditional layout is completed on a mobile device. However, both the research messenger groups show fewer themes. In addition, women generate more themes than men, and people with a college degree produce more themes than respondents without a college degree. Also, people with more phone skills generate more themes. We did not find an effect of age on the number of themes.
Results multiple linear regression analyses predicting response length (themes and characters) and results binary logistic regression analysis predicting high response quality
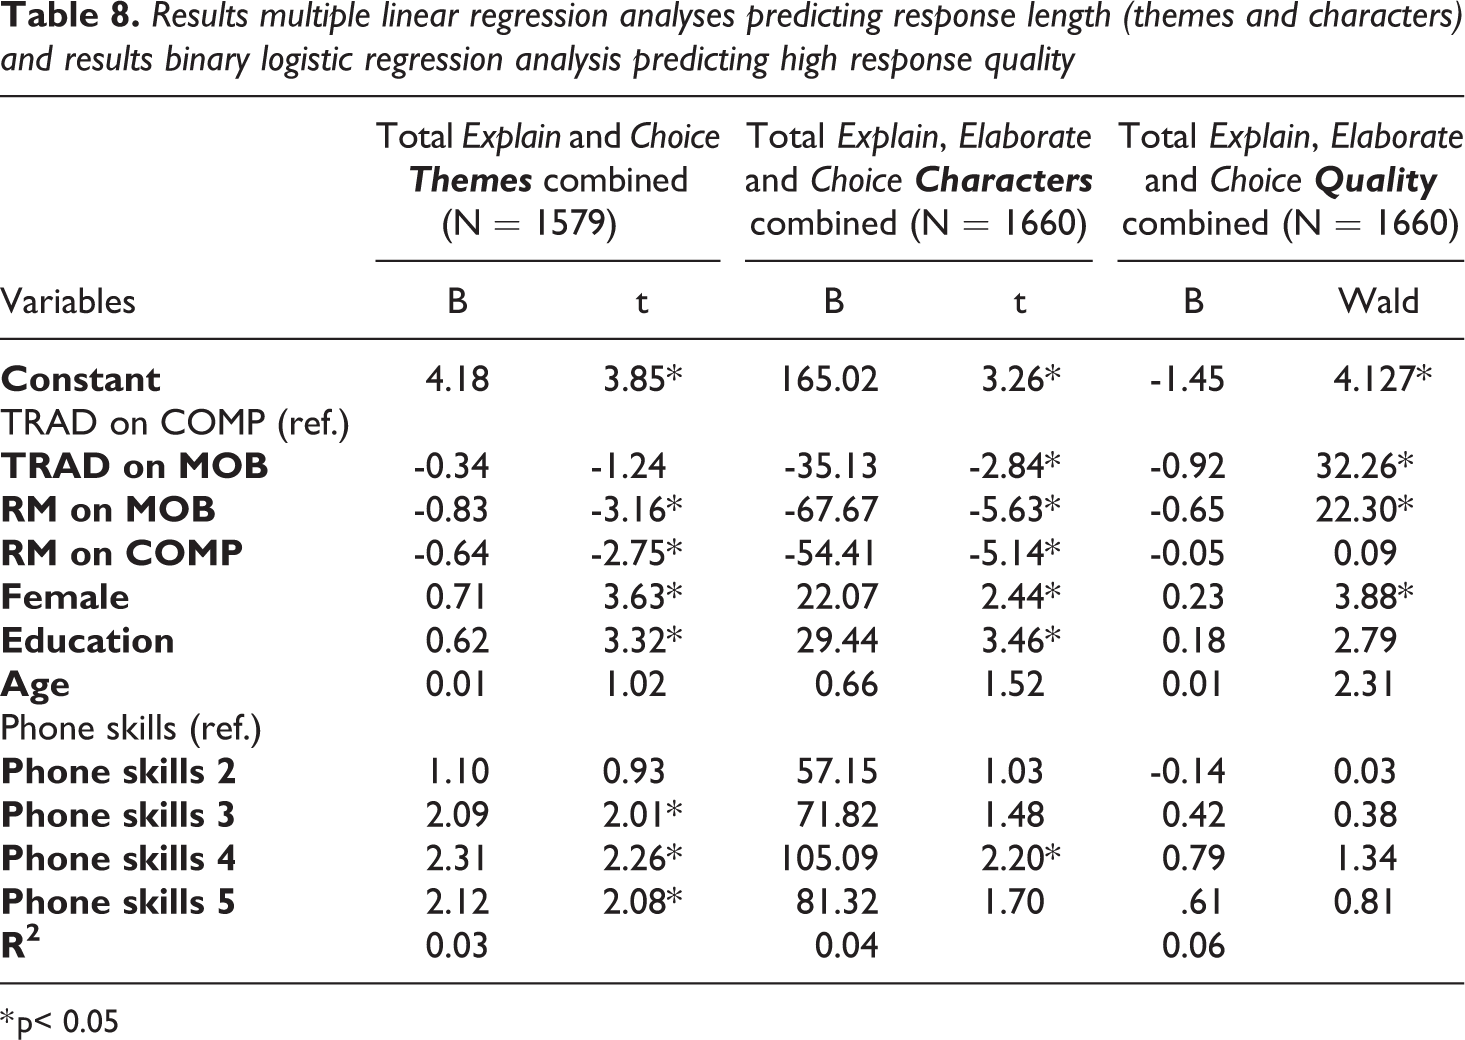
* p< 0.05
A multiple linear regression analysis to predict the number of characters shows similar results. However, the traditional layout on mobile devices generates significant fewer characters compared to the reference format TRAD on COMP. This indicates that the number of characters in a traditional layout is lower on a mobile phone than a computer, but that respondents are more efficient (use fewer words to get across the same message) on mobile phones since the number of themes is not significantly different. We also conducted a multiple regression analysis on all 18 probes in the survey (results not shown), that generated similar results as the three probes discussed above and shown in Table 8.
In order to estimate the probability of high quality responses to the combined three probes (Explain, Elaborate and Choice), a binary logistic regression analysis was conducted. We compared high quality responses (1) to low and medium quality responses combined (0). Assumption testing conducted prior to the analyses did not indicate any violations. Coefficients for the model’s predictors are presented in Table 8. Research messenger layout on both mobile and computer generates lower quality answers. In addition, male respondents generate lower quality responses. We did not find an effect of education, age, and phone skills on response quality.
Conclusion and discussion
The goal of this study was to investigate whether a research messenger layout compared to a traditional online survey layout is more efficient for online probing. To test this, response length and response quality were examined. The research messenger layout, regardless of device, produced significantly shorter responses, in terms of both themes as characters, than the traditional layout. The traditional layout completed on mobile devices was also found to negatively affect the number of characters. Respondents are more efficient (use fewer words to get across the same message) on mobile phones, therefore, since the number of themes is not significantly different. Further, females and college graduates – as concluded by earlier research – and people with higher self-rated phone skills were found to produce longer responses. High quality responses were found to be more often produced by the traditional layout (especially on computer), and less often by the research messenger layout (especially by the research messenger layout completed on mobile devices). Thus, completing a traditional layout on a computer is (still) found to be most effective for response length and quality in probing. Therefore, respondents should be encouraged, if given the opportunity, to respond from a computer when dealing with open questions. We note that although a research messenger layout might encourage a more spontaneous and natural conversation, there can be an effect of ‘predisposition’ of respondents to answer in a more synthetic way when they are questioned via a research messenger.
Respondents in the research messenger layout took significantly longer to complete the survey. This is probably related to the fact that for each new question, the software took some time to respond (indicated by ‘Peter is typing’) mimicking a real conversation. This extra time did not result in more incompletes in the research messenger layout, however.
Coders were able to code the open-ended responses more reliably in the research messenger layout compared to the traditional layout. This is a remarkable result and deserves future investigation. It could be that respondents provide more to-the-point answers in the messenger format (driven by short and efficient communication customs in messenger apps) and hence coding is easier in the messenger layout.
The fact that the traditional layout completed on computer produced longer responses might be due to the size of the answer fields, which was larger for the traditional layout than for the research messenger layout. Note that the size of the answer fields was similar in the traditional responsive layout on computer and mobile devices, but since mobile phones have smaller screen sizes, the size of the answer field is indeed smaller. Several studies indicate that larger answer fields increase response length, in terms of words and themes (Couper et al., 2011; Israel, 2010; Stern et al., 2007; Smyth et al., 2009). It can be argued that the size of answer fields is interwoven with the four cognitive processes mentioned before; respondents seem to infer from large answer fields that longer responses are desired (Israel, 2010). Indeed, our study concludes that the survey with smaller answer fields (research messenger layout) affects response length negatively. However, it was also found that completing the traditional layout on a mobile device has a negative effect on number of characters. Behr et al. (2014) argue that different types of probes require different answer field sizes, as they often vary in required level of elaboration. An elaboration probe for example asks for more detail and elaboration than a category selection probe. However, in our study all probes were followed by the same answer field size. Future research should experiment with surveys’ probe answer field sizes. In particular, experimentation needs to be done with keeping the size of the answer field the same across traditional and research messenger layout (although this would go against common practice in messaging apps where the size of the answer field is typically small).
Response length was measured by the number of themes and characters. However, we did not take the use of abbreviations into account. Respondents of the research messenger layout are more likely to use abbreviations, as people are accustomed to use abbreviations for texting in messenger apps. Future research should therefore compare the use of abbreviations between the two layout styles. Perhaps response length of the research messenger layout is only shorter in terms of characters, since those respondents used more abbreviations. This could mean that those respondents actually say just as much as respondents of the traditional layout, but just use less characters to do so.
We note that there are more probe types than the three we examined in this paper. Perhaps other probe types, like paraphrase and response probes, are more likely to produce long elaborated responses. Future research should include more different probe types to make the relation between probing and research messenger layout clearer. Furthermore, additional experimentation in substantive open questions (other than probes) is recommended to explore if our results carry over to survey questions.
The survey used for this study was completed by MTurk participants, who rather frequently complete surveys. They are experienced survey completers, who know what information is required by certain types of questions. Response quality and response length might be lower for people who do not complete surveys regularly, as they are not familiar with certain questions that require quite some information. On the other hand, if experience in survey completion matters, the four groups should not have differed as much as they did now. Still, future research should compare response length between experienced and non-experienced survey completers, to see whether the former produce higher quality responses as they know what information is sought. Another critical note regarding our sample, is the origin of the survey results, since the survey was only distributed in the USA. Research showed that US citizens use their mobile phones less for short text messaging than citizens of for example Spain, Britain and France (Kohut et al., 2011).
To conclude, the research messenger layout as implemented in this study is not found to produce higher quality responses for online probing. Future research should keep looking for a survey style which can increase response length and quality. Perhaps short texting is not the answer to the problematic mobile surveys, since this remains less beneficial on the small screens of mobile phones. Since people increasingly use voice memo’s and virtual assistants like Siri, it might be an idea to implement voice memo’s into surveys. Future research should examine the effectiveness of such a ‘speaking style of surveys’.
Footnotes
Declaration of Conflicting Interests
The author(s) declared no potential conflicts of interest with respect to the research, authorship, and/or publication of this article.
Funding
The author(s) received no financial support for the research, authorship, and/or publication of this article.
Appendix 1. Screenshots of Probes.
RM refers to the research messenger layout and traditional refers to the traditional (normal) online survey layout.
Introduction to the Survey:
Question Preceding the Explain Probe:
The Explain Probe:
Question preceding the Elaborate probe:
The Elaborate Probe:
Question Preceding the Choice Probe:
The Choice Probe: