
Abstract
Fragmented outpatient care systems dominated by small providers require reliable efficiency measurement tools to inform benchmarking and reimbursement design. However, it remains unclear to what extent efficiency estimates depend on methodological choice, particularly when cost-based data are used. This study evaluates cost–revenue technical efficiency of 344 dental practices observed between 2017 and 2020 using input-oriented Data Envelopment Analysis (DEA) under constant and variable returns to scale and Stochastic Frontier Analysis (SFA). Inputs include labor and material costs; output is annual revenue, standardized per employee. Correlation, robustness testing, and temporal analysis were performed. Average technical efficiency ranged from 0.50 (SFA) to 0.61 (DEA_VRS), indicating substantial unused production potential. Strong correlation was observed between DEA variants (r = .763), while correlations between DEA and SFA were weak (r < .30), suggesting that the methods capture distinct dimensions of inefficiency. Efficiency increased modestly over time but dispersion across providers widened. The 2020 results may partially reflect pandemic-related service disruptions. Efficiency estimates in fragmented outpatient care are highly sensitive to methodological specification. The results reflect financial production efficiency rather than clinical or value-based performance. A combined DEA–SFA framework provides complementary insights for benchmarking and policy design, but operational implementation requires explicit decision rules and contextual adjustment.
Keywords
Introduction
Outpatient health care systems are increasingly shaped by fragmentation, a high prevalence of small providers, and sustained pressure to improve efficiency under constrained financial resources. In this context, policymakers, payers, and health system managers rely on performance indicators to support reimbursement decisions, benchmarking, and organizational reforms aimed at improving resource allocation and service delivery.1 -3 The usefulness of such indicators, however, critically depends on how provider efficiency is measured and interpreted–particularly in outpatient settings characterized by substantial heterogeneity in provider size, cost structures, and service mix.
Technical efficiency analysis has therefore become an important tool in health services research, offering insights into how effectively health care providers transform inputs into outputs. Among the most widely applied approaches are Data Envelopment Analysis (DEA) and Stochastic Frontier Analysis (SFA). DEA, originally introduced by Farrell 4 and later formalized by Charnes, Cooper, and Rhodes, 5 is a non–parametric method that constructs an empirical efficiency frontier based on observed best practices. In contrast, SFA is a parametric approach that estimates a production frontier while explicitly separating inefficiency from random noise. 6 Due to these fundamental methodological differences, efficiency estimates derived from DEA and SFA may diverge substantially, particularly in environments characterized by small scale, heterogeneity, and imperfect information. 7
Most empirical evidence comparing DEA and SFA in health care originates from hospital–level analyses, where providers typically operate at larger scale and under relatively standardized production conditions. 8 In contrast, outpatient care often dominated by small, autonomous practices–remains comparatively underexplored. This gap is especially relevant given that outpatient providers frequently operate under mixed reimbursement schemes, face region-specific demand constraints, and experience limited competitive pressure. In such settings, methodological differences in efficiency measurement may translate into materially different signals for performance assessment, benchmarking, and policy design.
Dental practices provide a relevant empirical setting for examining fragmented outpatient care. International studies indicate that efficiency in dental services is influenced not only by input utilization, but also by organizational arrangements, workforce composition, and the broader socioeconomic context. 9 In the Czech Republic, dental care is characterized by a high share of out–of–pocket payments, a predominance of self-employed practitioners, and pronounced regional disparities in access to care.10 -13 Despite a growing number of providers, structural constraints persist, including uneven patient distribution, limited opportunities for resource sharing, and demographic pressures associated with the aging of the dental workforce. These characteristics make dental practices a suitable case for examining efficiency measurement in small outpatient provider settings.
In response to this gap, the present study examines how alternative efficiency measurement approaches shape the assessment of provider performance in fragmented outpatient care. Using dental practices as a representative case, the study applies both DEA (with constant and variable returns to scale) and SFA to a balanced panel of providers observed between 2017 and 2020. Rather than treating methodological choice as a purely technical issue, the analysis explicitly evaluates the degree of agreement between DEA and SFA efficiency estimates and considers the implications of their divergence for health care organization, provision, and financing.
Methods
The methodology is chosen in accordance with the defined research objective and research questions. This study follows the STROBE reporting guidelines for observational studies. The framework (Figure 1) illustrates the logical structure of the study, which was applied to a panel dataset of 344 dental practices (decision-making units, DMUs) over the period 2017 to 2020.

Methodological framework of the study.
Production Units: Inputs and Output
The data used in this study were obtained from publicly available sources, with the primary source being the Institute of Health Information and Statistics of the Czech Republic. 14 Registry data were supplemented using the Commercial Register and Collection of Deeds, 15 from which the financial statements of individual providers were acquired. The observation period was set from 2017 to 2020, allowing for the capture of longer-term characteristics of dental practice operations, including potential trends or fluctuations.
The selection process for dental practices (hereinafter referred to as practices or DMUs) was multi-stage and ensured that only homogeneous units with fully comparable data were included in the study. The final dataset comprised 344 practices (n = 344) from all regions of the Czech Republic. Practices with a maximum of 5 employees (n = 289), labeled as Small (S) in the technical efficiency (TE) analysis, represented the largest group, accounting for approximately 84% of the total sample. The remaining 16% consisted of 55 practices with 6 or more employees, labeled as Large (L) in the TE analysis.
Although the majority of practices belong to the small-size category (84%), subgroup analyses indicate minimal differences in mean efficiency across size groups after standardization. Nevertheless, the size distribution should be considered when interpreting dispersion patterns, as smaller practices may face different managerial and demand constraints.
For the purposes of TE analysis, 3 economic indicators were selected from the profit and loss statements – 2 as inputs (x1, x2) and 1 as output (y1).
The first input (x1) is consumption of materials and services – this includes costs for materials, energy, outsourced services, and other operational inputs directly related to the provision of dental care. This indicator reflects the consumption nature of the practice and its use of resources.
The second input (x2) represents personnel costs – this item includes all expenditures on wages, statutory contributions, bonuses, and other forms of remuneration. It is the most significant cost component of practices and also an indicator of the intensity of human resource utilization (dentists, dental technicians, assistants, and other professional staff).
The chosen output (y1) is annual revenue (hereafter referred to as income), derived from the profit and loss statements. This indicator reflects the total economic contribution of a practice and includes both reimbursements from health insurance funds and out–of–pocket payments by patients. This approach is consistent with recommendations in the literature – for example, Chen and Ray’s study 9 considers gross revenue to be a more appropriate output measure than the number of treatments, as it better captures differences in the scope and complexity of services provided.
Both inputs and the output were standardized by converting them to a per-employee basis, ensuring comparability between practices of different sizes. This standardization assumes proportional scaling of inputs and output across provider size, implicitly limiting the influence of scale economies within the observed size range. It further assumes comparable production structures across practices and similar staff productivity profiles. While this approach improves comparability, efficiency scores should therefore be interpreted as relative performance conditional on these assumptions.
Table 1 presents the basic descriptive statistics for the input variables (x1: material costs and x2: personnel costs) and the output variable (income) of practices in the years 2017 to 2020. The average values and aggregate sums show a gradual increase in both costs and revenues over the observed period. This growth reflects a combination of volume expansion, inflationary trends, and likely also changes in the structure of services provided.
Descriptive Statistics of Inputs and Output for the Period 2017 to 2020, n = 344 per Year.

Descriptive statistics indicate a high degree of variability among dental practices, which is a necessary condition for reliable evaluation of TE.
The median number of employees remained stable over the observation period (2 employees), while the mean increased from 3.8 in 2017 to 4.3 in 2020. The maximum rose from 25 to 35 employees, resulting in greater dispersion (SD: 3.6 → 4.3). This reflects increasing diversity in the capacities and organizational models of dental practices.
For the entire panel dataset (n = 1376; 344 practices × 4 years), a Pearson correlation analysis was conducted between the inputs and the output. The correlation between x1 (material costs) and x2 (personnel costs) was weak (r = .287, P < .001), confirming their suitability as separate input variables. Both inputs were significantly correlated with the output y1 (income): r = .676 for x1 and r = .655 for x2 (both P < .001), confirming their relevance for efficiency modeling.
These results confirm the robustness, consistency, and predictive strength of the dataset and support its suitability for technical efficiency analysis using DEA and SFA methods.
Scope of Efficiency Measurement
It is important to emphasize that the estimated efficiency scores reflect financial production efficiency under revenue constraints. The specification captures the relationship between cost inputs and revenue output and does not measure clinical effectiveness, quality of care, or value-based performance. Consequently, the results should be interpreted as indicators of cost–revenue efficiency rather than overall healthcare system performance.
Technical Efficiency Model
TE reflects the ability of a production unit to convert inputs (eg, labor, capital) into outputs (products or services). Two basic approaches to TE can be distinguished:
Input-oriented TE focuses on minimizing inputs while maintaining a given level of output;
Output-oriented TE aims to maximize output given a fixed level of inputs.
A unit is considered efficient if it operates on the production frontier (TE = 1). Values below this frontier (TE <1) indicate inefficiency. The analysis also includes an assessment of returns to scale, that is, changes in output resulting from proportional increases in all inputs.16,17
In this study, technical efficiency was estimated using 3 models:
The parametric Stochastic Frontier Analysis (SFA);
The non-parametric DEA with constant returns to scale (CRS);
And DEA with variable returns to scale (VRS) – all applied in an input–oriented framework.
SFA is a parametric approach based on the assumption of a specific functional form of the production function (eg, Cobb–Douglas). It distinguishes between a random error term (noise, measurement error) and inefficiency, making it more robust to statistical noise and suitable for hypothesis testing on the effects of individual factors.6,7
DEA is a non–parametric method based on linear programing, which constructs the efficiency frontier from the best observed performance without assuming a predefined functional form. It is flexible, suitable for multi-dimensional inputs and outputs without the need for their aggregation, and widely used in performance evaluation in the public sector. 8 The main disadvantages of DEA include higher sensitivity to extreme values and the inability to account for random variation.
Both methods were applied in parallel with the aim of increasing the robustness of findings and enabling cross-validation of results. 17
SFA estimations were conducted using Stata 15.1, while DEA models were calculated in Payton software. The resulting TE scores were subsequently analyzed using descriptive and correlation analysis, including tests of relationships between models and the identification of differences.
The combination of DEA and SFA has been successfully applied in previous studies, such as Khezrimotlagh et al 18 or in evaluations of hospital efficiency across the EU, 3 where the authors emphasize the sensitivity of results to distributional assumptions. A 2–stage approach using DEA and regression analysis has been effectively employed in Brazilian public dentistry, 19 and DEA has also been used to assess the impact of systemic changes on the efficiency of dental units. 20
Results
Estimation of Technical Efficiency
Table 2 summarizes the descriptive statistics of technical efficiency (TE) scores calculated using 3 models: SFA, DEA_CRS, and DEA_VRS. Results are presented for the full sample of practices (A), as well as separately for large (L) and small (S) providers.
Descriptive Statistics of Technical Efficiency (TE) Scores by Model.

A = all; L = large; S = small.
As inputs and outputs were standardized per employee, the dataset is relatively homogeneous. Nevertheless, some differences between groups and models remain.
The SFA model yields the lowest average efficiency score (0.504) and the lowest variability (SD = 0.071). The scores range from 0.298 to 0.907. The difference between large (0.510) and small practices (0.502) is negligible, which confirms the limited sensitivity of SFA to size variation after standardization.
The DEA_CRS model shows a slightly higher average efficiency (0.528) and greater dispersion (SD = 0.129). The minimum score is only 0.058, reflecting stricter penalization of inefficient units. The difference between small (0.529) and large practices (0.519) is again small, though it may indicate potential structural distinctions.
The DEA_VRS model provides the highest average score (0.610) and the greatest variability (SD = 0.145). Efficiency scores range from a minimum of 0.261 to a maximum of 1.000. The difference between small and large practices is minimal (0.610 vs 0.614), though the greater flexibility of the model allows for a better detection of differences in internal organization or the scope of services provided.
In summary, although standardization reduced the impact of practice size, certain differences between provider types persist. The systematic distinction between models is also evident: SFA yields the lowest scores, DEA_VRS the highest, and variability increases with the flexibility of the methods used.
To assess the effect of time, a one-way analysis of variance (ANOVA) was conducted to test differences in mean efficiency across years. The effect of the variable “year” was statistically significant (F(3, 1371) = 15.08; P < .001). However, the coefficient of determination (R2 = .0319; adj. R2 = .0298) indicates that time accounts for only about 3% of the variability in efficiency. This suggests that the main differences stem from the characteristics of individual providers.
As a robustness check, the Kruskal–Wallis test which does not assume data normality–was also applied. The result again confirmed statistically significant differences between years (χ2(3) = 83.87; P < .001). The sum of ranks increased gradually from 2017 (191 525) to 2020 (281 921), indicating a steady rise in median efficiency.
Relationship Between Models
Table 3 presents the correlation between the 3 applied technical efficiency models (SFA, DEA_CRS, and DEA_VRS), based on Pearson correlation coefficients and supplementary bootstrap statistics.
Correlation Between Technical Efficiency (TE) Models.

The highest agreement was observed between the 2 non-parametric models, DEA_CRS and DEA_VRS, with a correlation coefficient of r = .763 (P < .001). This strong and statistically significant relationship confirms that, despite differing assumptions about returns to scale, the results of both models are largely consistent. The bootstrap confidence interval (0.728; 0.795) further supports the robustness of the estimate.
In contrast, correlations between the SFA model and the DEA models were substantially lower. The correlation coefficient between SFA and DEA_CRS was r = .298, and between SFA and DEA_VRS it was r = .246 (both P < .001). These values represent weak but statistically significant positive relationships. This suggests that SFA and DEA capture technical efficiency from different perspectives – SFA, as a parametric approach, accounts for random error, whereas DEA is based on a deterministic construction of the frontier.
Bootstrap estimates further confirm the stability of the result bias values were close to zero in all cases (ranging from – 0.002 to 0.000), standard errors were low, and confidence intervals were narrow.
These findings indicate that SFA and DEA models are not interchangeable, as they offer distinct perspectives on technical efficiency. In contrast, the high concordance between DEA_CRS and DEA_VRS strengthens confidence in the internal consistency of results within the non-parametric framework.
Graphical Comparison of Models
The relationship between technical efficiency estimated using DEA with constant returns to scale (DEA_CRS) and Stochastic Frontier Analysis (SFA_TE) shows a limited degree of concordance, as illustrated in Figure 2. Out of a total of 1376 observations, 286 units fall within the upper-right quadrant – that is, above the average value in both indicators simultaneously. However, no unit achieved full efficiency (score of 1.0) in both methods at the same time.

Relationship between SFA_TE and DEA_CRS models.
This confirms that the DEA and SFA models capture technical efficiency from different perspectives – SFA relies on parametric modeling of random effects, whereas DEA applies a deterministic approach without specifying a production function.
A similar pattern is observed in the relationship between DEA_VRS and SFA_TE, as shown in Figure 3. Again, 286 units fall above both average values, yet none of them reach a score of 1.0 in both dimensions simultaneously.
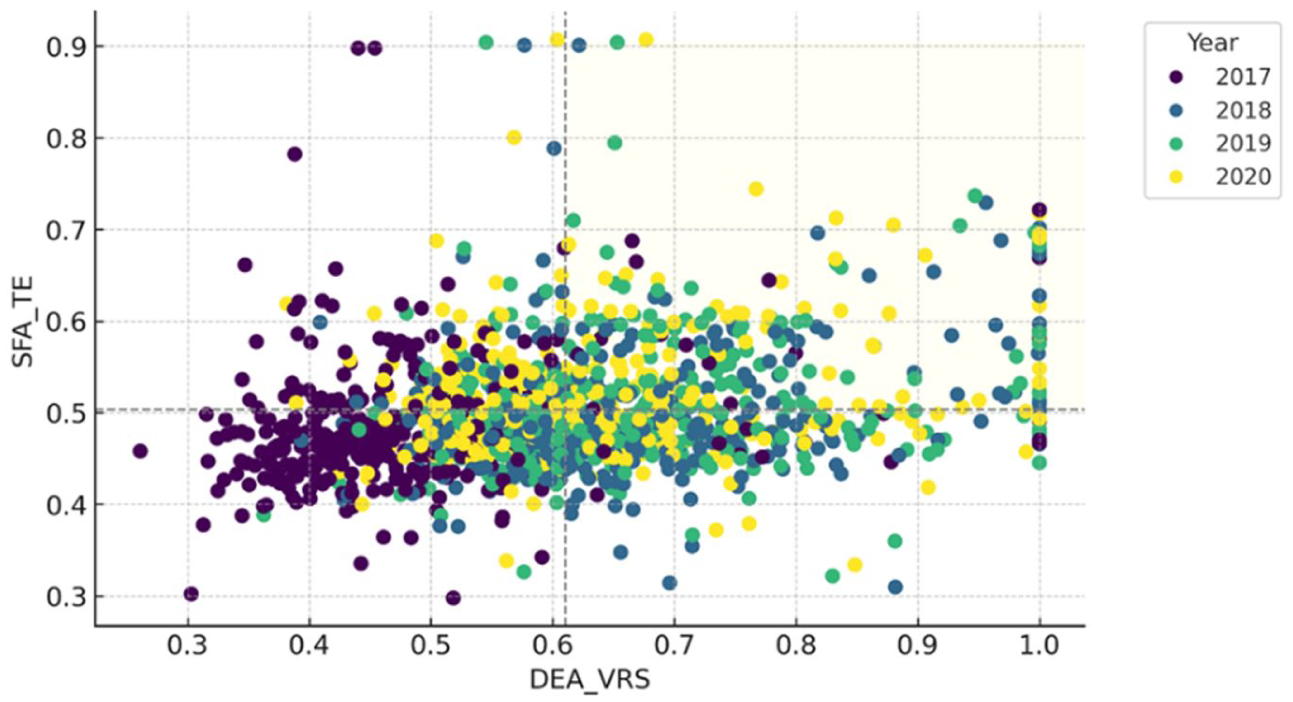
Relationship between SFA_TE and DEA_VRS models.
Although DEA_VRS is often regarded as a more flexible and less restrictive version of DEA, the empirical results once again demonstrate that methodological and empirical differences between parametric and non-parametric approaches significantly affect performance evaluation.
In contrast, a significantly stronger relationship can be observed between the 2 DEA models – DEA_VRS and DEA_CRS. A total of 446 units are located in the jointly above-average quadrant, indicating a higher level of consistency between these 2 efficiency estimates. Moreover, 16 units achieved full efficiency (score of 1.0) in both DEA variants simultaneously, which suggests robust performance regardless of the returns-to-scale assumption.
This result underscores the internal consistency of DEA methods while also confirming their sensitivity to model specification, as illustrated in Figure 4.

Relationship between DEA_VRS and DEA_CRS models.
Discussion and Interpretation of Results
Overall Efficiency Levels and Unused Production Potential
The results of the technical efficiency (TE) analysis – based on a combination of DEA models with constant and variable returns to scale (CRS, VRS) and the SFA show that the vast majority (98%-99 %) of dental practices in the Czech Republic did not operate at the efficient frontier (TE = 1) during the period 2017 to 2020. Average efficiency across the applied models ranged from a relatively low 50% to 61%.
These findings indicate a substantial potential for improving technical efficiency, even without increasing outputs – for example, through input rationalization, process reorganization, or better resource allocation.
Because revenue is used as the sole output indicator, higher efficiency does not necessarily imply higher value-based care or better patient outcomes. Revenue may reflect service volume and price structure rather than clinical quality. Consequently, the estimated scores should be interpreted as financial production efficiency rather than comprehensive healthcare performance. Future research should therefore integrate quality–adjusted outputs, patient-reported outcomes, or treatment complexity indicators to better approximate value-based efficiency.
The differences between individual methods are consistent with their theoretical foundations. The DEA_VRS model is the least restrictive, allowing for variable returns to scale and capturing technical efficiency without penalizing size–related differences. The stricter DEA_CRS model produces lower efficiency scores, while the SFA, which incorporates a stochastic component, tends to “smooth” the efficiency frontier, resulting in lower score variability.
From a methodological perspective, combining multiple approaches proves beneficial. Differences between DEA and SFA may indicate whether low efficiency stems more from technical reserves within a unit or from random or exogenous factors. For example, units scoring highly under DEA_VRS but low under SFA may be internally efficient yet affected by external conditions (eg, regional demand, legislative changes).
Standardizing data per employee helped reduce the effect of provider size and enabled the creation of a more homogeneous basis for comparison. Nevertheless, the results reveal that structural differences in efficiency persist among practices, potentially related to differences in cost management, care organization, or labor productivity.
From a practical perspective, the combined results provide:
A diagnostic tool to identify inefficiencies in input utilization;
A basis for benchmarking, with efficient units serving as a reference for less efficient ones;
Support for targeted interventions, such as in human resource management, operational cost planning, or optimization of the service mix.
Overall, the findings confirm that systematic measurement of technical efficiency using multiple models yields valuable insights for performance management in healthcare organizations. They also reveal an untapped production potential, which may be crucial for the sustainable development of outpatient care services. Unlike some approaches that rely exclusively on a single method (eg, DEA), this study follows recommendations to combine both tools, as suggested in comparative EU studies. 3
As demonstrated in the study by Linna et al 21 which applied DEA to a sample of 228 health centers, the authors found average cost inefficiencies ranging from 20% to 30%, and technical efficiency scores between 0.42 and 1.00. The highest cost inefficiencies were observed in rural areas with higher unemployment and higher spending on primary care. Key factors influencing efficiency included input structure – a higher share of dentists increased technical efficiency, while higher material costs reduced overall performance. These insights provide an important reference point for assessing whether similar mechanisms affect the efficiency of outpatient dental care in the Czech Republic.
Similar to the study by Olsen et al 19 our research shows that the technical efficiency of dental practices is influenced not only by inputs and outputs, but also by the organizational context and external factors, which should be taken into account when evaluating performance.
In this context, there is a clear opportunity for further research on the technical efficiency of dental practices in the Czech Republic, particularly studies that consider the socioeconomic conditions of regions and their impact on efficiency.
The findings of Karolyi et al 22 are particularly relevant in this regard. Their study, based on automated data mining from public registers, mapped the distribution of over 10 000 dentists by region and the university where they obtained their education. The results show a marked regional concentration, especially in the capital city, and highlight potential disparities in service coverage, which may indirectly affect the efficiency of individual providers across the country.
Methodological Divergence Between DEA and SFA
The correlation between technical efficiency estimates obtained using SFA and DEA is weak but statistically significant. Both relationships are accompanied by narrow bootstrap confidence intervals, confirming the robustness of the correlation estimates. Although the correlations are statistically significant, their low values indicate methodological non-equivalence between the 2 approaches.
These findings can be interpreted as evidence that SFA and DEA assess technical efficiency in fundamentally different ways. While DEA uses a deterministic frontier without a random component and is sensitive to data extremes (especially in small samples), SFA incorporates stochastic noise and smooths the efficiency frontier based on a specified production model.
The differences between SFA and DEA likely reflect:
different assumptions about the distribution of random components;
sensitivity to model specification and returns to scale, and
different perceptions of the attainable performance frontier.
In contrast, the relationship between DEA_CRS and DEA_VRS shows a very strong correlation (r = .763), confirming the methodological similarity and a high degree of internal consistency within non-parametric approaches.
These findings suggest that SFA and DEA should not be considered interchangeable methods, but rather complementary tools that offer different perspectives on healthcare provider performance. Similar conclusions were drawn by Hill et al 23 who analyzed the technical efficiency of 121 dental practices within the NHS in England. They examined the impact of Dental Care Professionals on operational efficiency using 2 complementary methods: Data Envelopment Analysis and the SFA. DEA enabled the measurement of relative efficiency based on actual combinations of inputs and outputs, while SFA accounted for random deviations and data noise.
Temporal Dynamics of Technical Efficiency
The analysis of technical efficiency (TE) trends in Czech dental practices between 2017 and 2020 reveals several important patterns. During this period, the average values of all observed variables increased: material costs rose by 6.2%, personnel costs by 27.3%, and income by 19.5%. At the same time, variability across practices increased, suggesting differing rates of adaptation and growing heterogeneity in operational conditions.
This pressure for more efficient resource use was reflected in a moderate rise in the proportion of above-average efficient units, with the highest occurrence recorded in 2020. However, the number of fully efficient practices remained consistently very low and stable throughout the period.
There is also room for discussion regarding external conditions in 2020, which may have affected the efficiency of dental practices. In this context, the findings of Akbari et al 20 are particularly relevant for the Czech setting. The year 2020 coincides with the COVID-19 pandemic, which disrupted elective procedures, altered patient demand, and increased infection-control costs. These exogenous shocks may have influenced both revenue and cost structures, thereby affecting estimated efficiency scores. Consequently, temporal comparisons should be interpreted with caution, as part of the observed variation may reflect temporary systemic disturbances rather than structural performance changes. Their study identified different dynamics in service provision between publicly subsidized and private practices during the pandemic and confirmed that availability and cost are key factors influencing service utilization – an observation consistent with the robustness regression results presented in this study.
Regression Robustness Check
To verify the relationship between inputs and output, a regression analysis was conducted. The model confirms a strong and statistically significant association between cost inputs and revenue (Adjusted R2 = 0.778), supporting the internal consistency of the dataset used for frontier estimation. The regression serves as a complementary robustness check rather than a separate explanatory model of efficiency determinants.
The findings of this study have direct implications for the governance of outpatient health care, the design of reimbursement mechanisms, and the evaluation of provider performance. The results demonstrate that the choice of technical efficiency measurement method is not a neutral technical decision but one that fundamentally shapes performance interpretation and subsequent managerial and policy responses.
The weak concordance between SFA and DEA estimates indicates that the methods capture different components of inefficiency. While DEA identifies relative technical inefficiency based on observed input–output combinations, SFA separates inefficiency from random noise and unobserved external influences. In fragmented outpatient care settings – where providers operate under heterogeneous demand conditions, regional constraints, and institutional rules – exclusive reliance on a single approach may lead to biased or misleading conclusions.
For policymakers and payers, this implies that benchmarking frameworks based solely on one efficiency method may generate distorted signals when designing reimbursement schemes, monitoring performance, or introducing incentive-based instruments. Providers classified as inefficient under DEA may, in reality, be strongly affected by exogenous conditions that are partially accounted for in SFA. Conversely, high efficiency scores under SFA do not necessarily imply optimal internal resource utilization.
A combined application of DEA and SFA therefore represents a more appropriate analytical framework for decision support in outpatient care. It enables a clearer distinction between internal inefficiencies related to organization, labor allocation, and cost management, and inefficiencies driven by institutional or regional factors. Such differentiation supports more targeted interventions that go beyond cost containment and address organizational design, capacity planning, and workforce management.
A practical framework for integrating DEA and SFA results could involve a 3-step approach:
(1) identification of providers consistently classified as inefficient across both methods;
(2) differentiation between internal inefficiency (DEA-detected) and stochastic or contextual effects reflected in SFA residuals;
(3) integration of these findings into reimbursement design through conditional benchmarking or risk-adjusted performance bands.
Such an approach would require explicit decision rules and weighting schemes to ensure transparency and fairness. Future research should empirically test how combined efficiency signals can be translated into actionable policy instruments without generating unintended distortions.
From a managerial perspective, the results highlight the importance of systematic monitoring of cost structures and labor productivity in small outpatient practices. The observed dispersion between efficient and inefficient providers suggests the existence of substantial unused production potential that could be activated without increasing inputs–an issue of particular relevance in the context of workforce shortages and persistent fiscal pressure on health care budgets.
Limitations
This study has several limitations. First, the analysis relies exclusively on financial and administrative secondary data and does not incorporate quality indicators, case-mix adjustment, or patient–level outcomes. Consequently, the estimated scores reflect cost–revenue efficiency rather than value–based or clinical performance.
Second, the observation period (2017-2020) is relatively short and includes the COVID –19 pandemic year, which may have introduced temporary distortions in both cost and revenue structures.
Third, methodological assumptions may influence the results. DEA is sensitive to extreme observations and deterministic frontier construction, while SFA depends on distributional assumptions regarding the inefficiency term. These model–specific characteristics may affect estimated efficiency levels.
Finally, the empirical focus on one national outpatient context limits direct generalization to other healthcare systems with different reimbursement arrangements and institutional structures.
Conclusion
This study examined cost–revenue technical efficiency in fragmented outpatient care using dental practices as an empirical case of small, autonomous providers. By applying both Data Envelopment Analysis and Stochastic Frontier Analysis to a multi-year panel dataset, the findings demonstrate that efficiency estimates are highly sensitive to methodological specification and capture distinct dimensions of performance.
The divergence between parametric and non-parametric approaches confirms that these methods are not interchangeable. DEA primarily reflects relative technical performance based on observed input–output combinations, whereas SFA separates inefficiency from stochastic variation and external influences. Relying on a single method may therefore produce incomplete or potentially misleading signals for benchmarking and reimbursement design.
The results further indicate persistent heterogeneity in efficiency across providers, suggesting that internal organizational structures, cost management practices, and contextual conditions play a significant role in shaping performance outcomes. In fragmented outpatient systems, where small providers operate under diverse institutional constraints, efficiency measurement must be interpreted with caution and contextual awareness.
The principal contribution of this study lies in demonstrating the analytical value of combining DEA and SFA as complementary tools. However, effective policy application requires explicit decision rules, transparency in model selection, and careful consideration of contextual factors.
Future research should extend the framework by incorporating quality-adjusted outputs, patient–level indicators, and regional socioeconomic characteristics. Integrating these dimensions would allow for a more comprehensive assessment of value–based efficiency and strengthen the evidence base for performance–oriented health policy.
Supplemental Material
sj-docx-1-inq-10.1177_00469580261437001 – Supplemental material for Measuring Cost–Revenue Technical Efficiency in Fragmented Outpatient Care: A Comparative DEA and SFA Analysis
Supplemental material, sj-docx-1-inq-10.1177_00469580261437001 for Measuring Cost–Revenue Technical Efficiency in Fragmented Outpatient Care: A Comparative DEA and SFA Analysis by Iveta Vrabková and Dominik Bauer in INQUIRY: The Journal of Health Care Organization, Provision, and Financing
Footnotes
Ethical Considerations
This study complies with national research regulations and institutional standards governing the use of secondary administrative data. The analysis relies exclusively on publicly available registry data and financial statements of healthcare providers. No individual patient-level, clinical, or personally identifiable data were accessed or processed. In accordance with applicable legal and ethical guidelines, formal ethical approval and informed consent were not required.
Author Contributions
Iveta Vrabková: Conceptualization, methodology, supervision, writing – original draft, writing – review and editing. Dominik Bauer: Data collection, formal analysis, visualization, writing – original draft.
Funding
The authors disclosed receipt of the following financial support for the research, authorship, and/or publication of this article: This article has been produced with the financial support of the European Union under the REFRESH – Research Excellence For REgion Sustainability and High-tech Industries project number CZ.10.03.01/00/22_003/0000048 via the Operational Programme Just Transition. This article has been supported by project No. SP2025/069 “Factors of Efficiency in the Distribution and Accessibility of Healthcare Services, Faculty of Economics, VSB – Technical University of Ostrava”.
Declaration of Conflicting Interests
The authors declared no potential conflicts of interest with respect to the research, authorship, and/or publication of this article.
Data Availability Statement
The data used in this study are derived from publicly available administrative registries and financial statements. Access to registry data is subject to national regulations of the Czech Republic. Processed data supporting the findings of this study are available from the corresponding author upon reasonable request*.
AI Use Disclosure
The authors used generative AI tools for language editing and stylistic refinement. All scientific content, analysis, and interpretation were developed by the authors, who take full responsibility for the manuscript.
Supplemental Material
Supplemental material for this article is available online.
References
Supplementary Material
Please find the following supplemental material available below.
For Open Access articles published under a Creative Commons License, all supplemental material carries the same license as the article it is associated with.
For non-Open Access articles published, all supplemental material carries a non-exclusive license, and permission requests for re-use of supplemental material or any part of supplemental material shall be sent directly to the copyright owner as specified in the copyright notice associated with the article.