
Abstract
Objectives
The growth in global healthcare capacity has led to increased healthcare costs and a deterioration in the finances of universal health insurance. Hospitals must consider how to improve financial efficiency and service quality in order to survive and operate sustainably.
Methods
This study applies data envelopment analysis (DEA) and stochastic frontier analysis (SFA) to measure the financial efficiency of hospitals and to identify the factors and business strategies to improve profitability.
Results
The findings and recommendations show that (1) the DEA and SFA methods are similar and have reference values; (2) financial efficiency should be improved by reducing medical costs; (3) the quality of medical staff should be improved and manpower reduced; and (4) information, computerisation, and human intelligence in healthcare and management should be enhanced.
Conclusions
In terms of practical applications, this study recommends the promotion of smart healthcare to improve the efficiency and quality of healthcare services, as well as the introduction of artificial intelligence and big data analysis to optimise the use of healthcare manpower. Electronic medical records can be used to reduce the wastage of resources and labour costs, a medication management system can be established, and changes to the procurement system can be made to reduce inventory and improve the efficiency of medical equipment use. It is hoped that this study will provide reference materials and applications for healthcare organisations to improve their operational efficiency and strategies.
Keywords
Introduction
As a result of increasing life expectancy and the capacity of elderly care, healthcare systems around the world are facing a twofold problem of increasing demand and supply costs. 1 Recent statistics from the United Kingdom suggest that the aging population alone is likely to increase demand for healthcare by 3.3% over the next 15 years. 2 As people's incomes rise and medical technology advances, so do expectations of a high-quality and affordable healthcare system. The aging population is also increasing the demand for healthcare, all of which have prompted governments to increase taxes, reduce other local spending, and promote more efficient ways of producing healthcare in order to fund universal healthcare and meet the growth in demand.3,4 It is also common for the government to assume responsibility and relief when hospitals are in financial crisis. In particular, when public hospitals run into financial deficits, they are heavily subsidised by the government. However, this also undermines the policies that hospitals want to reform in order to improve the efficiency of their services. 5 Agrawal and Conway 6 suggested that healthcare should have the threefold aim of better health, better care, and lower costs. These are essential components and goals for reforming healthcare policy. It is a fundamental strategy that can be used to save the healthcare system and make it sustainable and efficient. Cleverley 7 and Gapenski 8 have shown that the operational efficiency of a hospital can affect its financial performance. The higher the operating efficiency, the higher the expected profitability, which in turn allows hospitals to make profits to invest in equipment and manpower, and increases the competitiveness of hospitals in the healthcare market. This will in turn enable the hospital to earn profits to invest in hospital equipment and manpower, and increase its competitiveness in the healthcare market.
According to the statistics on the numbers of public/private hospitals published by the Ministry of Health and Welfare of Taiwan 9 between 1989 and 2020 (see Figure 1). In the 25 years from 1995 to 2020, the number of public hospitals has decreased by 14 and the number of private hospitals has decreased by 200 (a 34% decrease). In addition, the tightening of health insurance premiums in Taiwan in recent years has led to a number of policies and measures to reduce expenditure. For example, the institutionalised impact of the increased chance of premium rejection from health insurance and the rationalisation of outpatient services (a reduction in the number of outpatient clinics) has left incorporated hospitals, which do not have government assistance, with uncertainty and the risk of closure of medical services. In the face of the strong competitiveness of public hospitals with inherent advantages and government subsidies, how to improve the financial efficiency of non-profit proprietary hospitals (NPPHs) has become an important factor for the survival and development of hospitals.

Numbers of public and private hospitals in Taiwan from 1989 to 2020.
Over the past 50 years, the methods used to measure efficiency can be roughly divided into mathematical programming methods and econometric methods. Data envelopment analysis (DEA) is the most common method used in mathematical programming to estimate production frontiers. Stochastic frontier analysis (SFA) is the most representative method used in econometric methods to estimate production frontiers. 10 DEA is recognised as a powerful tool for performance analysis and benchmarking, and evaluations are used across a wide range of industries and functional areas, including healthcare.11–13 Simar and Wilson 14 advocated that DEA is the most convenient and effective tool for measuring efficiency in hospitals, making it one of the most commonly used methods for measuring efficiency in hospitals. The difference between DEA and SFA is that DEA is mostly used to examine the relative efficiency of each study object. SFA, on the other hand, explores the absolute efficiency and interrelationship between the impact factors of inputs and production (cost) efficiency.
In study of hospital efficiency using the DEA approach. Nunamaker 15 was the first to apply DEA to the medical field, where the cost of hospitalisation was the output and the three inputs were the elderly and children, female patients, and other days of hospitalisation. Seventeen hospitals were analysed for the relative efficiency of care. The study found that over 60% of the hospitals were inefficient. Sherman 16 was the second to apply DEA to the evaluation of hospital efficiency. The number of doctors and surgeons, the number of hours worked by allied staff, the cost of medical materials, and the total number of beds in the year were inputs, and the number of days in the hospital for insured elderly people, the number of days in the hospital for uninsured elderly people, the number of nurse trainees, and the number of inpatient trainees were outputs. Stefko et al. 17 used DEA to measure the regional efficiency of healthcare institutions in Slovakia between 2008 and 2015. The study selected five inputs: number of beds, number of medical staff, number of medical equipment, number of magnetic resonance (MR) equipment, and number of computed tomography (CT) equipment. It had two outputs: number of beds used and average time of care. The results of the study showed that a gradual increase in the number of MRs, CTs, and medical equipment to the inputs did not have a significant impact on the technical efficiency of the health facility. Lin et al. 18 used DEA to measure the operational efficiency of 19 medical centres/hospitals in Taiwan. The five inputs used were total beds, total physicians, total equipment, net fixed assets, and emergency transfers for hospital stays longer than 48 hours. The outputs included surplus or deficit in funding, length of stay, total relative value units of outpatient services, inpatient services, self-funded income, etc. The results of the study showed that the technical efficiency of medical centres/hospitals was 96%, the pure technical efficiency was 99.1%, and the scale efficiency (SE) was 96.8%, with private medical centres outperforming public medical centres/hospitals.
In the study of hospital efficiency using the SFA methodology, Rosko 19 measured the impact of environmental stress on hospital inefficiency in 616 hospitals between 1990 and 1999. The findings showed that the average inefficiency rate decreased from 14.35% in 1990 to 11.42% in 1998, and increased to 11.78% in 1999. Goudarzi et al. 20 used SFA to evaluate the efficiency of Kermanshah University of Medical Sciences Hospital between 2005 and 2011. Outputs included number of admissions. Inputs included numbers of doctors, nursing staff, active beds, and outpatient admissions. The study showed that the average efficiency of hospitals was 63%, leaving 37% room for improvement. Furthermore, it was suggested that reducing hospital manpower would reduce hospital costs and improve hospital performance. Goodarzi et al. 21 used both DEA and SFA to measure the efficiency of hospitals of Kermanshah University of Medical Sciences during the period of 2001–2007. The same results were obtained for DEA and SFA. The technical efficiency of the hospital was 95%, and staff costs accounted for the majority of fixed costs. The reduction of redundant human resources would reduce hospital costs and healthcare costs.
In general, measuring the efficiency of hospitals by the number of inputs and outputs is very difficult and complex. In recent years, both DEA and SFA methods have been used to assess the performance of hospitals and other healthcare providers. DEA is a non-parametric technique that uses linear programming to measure frontier production function. DEA measures the relative efficiency of multiple inputs and outputs and is often used in not-for-profit organisations. SFA is a parametric technique, a theory of econometric models, and the theories of microeconomics, which requires the use of a combination of data (panel data) to measure production (cost) function with regard to hypothesis or statistical tests. Therefore, SFA is often applied in the evaluation of the efficiency of profit-making organisations. The DEA approach measures the efficiency of other hospitals using the observed best practitioners relative to all hospitals, but it does not provide any statistical tests to confirm the results. In terms of measuring the efficiency of hospitals, the SFA method uses a constructive production function or cost function to measure and rank hospitals. 22 SFA can be used to detect differences in inefficiencies between hospitals. 19
In addition, Fazria and Dhamanti 23 examined a total of 586 past research articles from 23 countries and found that the five most common input factors used to assess the efficiency of hospitals were number of beds, medical staff, non-medical staff, medical technicians, and operating costs. The most common output factors were the number of inpatient admissions, number of operations, number of emergency visits, number of outpatient attendances, cost of care, and number of days in the hospital. This study found that when hospital efficiency is measured, non-financial data is often used to measure the productivity of hospitals. The choice of inputs and outputs is crucial to the estimation of hospital efficiency. In general, inputs should include all necessary resources, while outputs are the main objective to be managed. Some studies suggest that the main inputs for efficiency assessment of hospital costs are labour of medical staff and nurses and other operating costs (including the fast-growing costs of medical supplies and drugs),13,24,25 while the outputs are mainly medical income.
Today, however, the healthcare industry is faced with increasing costs for medical labour, medical drugs, and medical materials. In many countries, healthcare systems and hospitals are facing problems with operating costs and financial difficulties. Therefore, this study applies both DEA and SFA methods and collects data from NPPHs to measure the financial efficiency of hospitals, as well as the differences between the empirical findings of the two methods. This study aims to measure the financial and operational efficiency of hospitals in order to explore the important factors influencing the financial efficiency of hospitals, and to propose relevant recommendations and improvement strategies to enhance the financial efficiency and quality of healthcare in hospitals.
Methodology
Efficiency is the measurement of the operational performance of a decision making unit (DMU) and the scope for improvement of the DMU's operations. Efficiency is a matter of measuring the best efficiency of input and output under the goal of maximum output or minimum cost. Farrell 26 was one of the first to explore efficiency measurement. He cited the work of Debreu 27 and Koopmans 28 to define a simple measure of efficiency that could deal with a situation where there are multiple inputs. He believed that a firm's efficiency consists of two components: technical efficiency, which represents a firm's ability to achieve maximum output with a given mix of inputs, and allocative efficiency, which reflects the optimum input ratio for a firm at a constant relative price. The combination of these two components can be used to measure a firm's total economic efficiency. Farrell 26 suggested that efficiency could be measured either non-parametrically or parametrically, and his proposed efficiency measure became a pioneer of the frontier approach. 29 The non-parametric method, DEA, is the most commonly used method, while the parametric method, SFA, is the most representative, and both methods are often used to measure the efficiency of hospitals in various ways.
DEA method
Since Farrell 26 proposed a non-parametric approach to measure technical efficiency, only a few researchers have considered it. It was not until Charnes, Cooper, and Rhodes (CCR) 30 proposed a mathematical model of DEA based on Farrell's 26 concept of technical efficiency that the theoretical status of the non-parametric approach to efficiency was established. The CCR model assumes output-oriented production and constant returns to scale (CRS). Subsequently, Banker, Charnes, and Cooper (BCC) 31 removed the restriction on CRS from the CCR model and proposed that their BCC model assume variable returns to scale (VRS), that is, a partial increase in inputs does not result in a relative increase in output. These two models are now recognised by academics as the most influential in the field of DEA. 32 Total economic efficiency in the input-oriented considers the reduction of input costs and is therefore also known as cost efficiency. Output-oriented aggregate economic efficiency considers the increase in revenue from the output and is therefore also known as revenue efficiency.


As this will produce an infinite set of solutions when actually solved, the equation is converted to a linear programming model, that is, the denominator is set to 1 to facilitate the solution, as in Coelli et al.
29
:


When u0 = 0, it represents CRS;
When u0 > 0, it represents decreasing returns to scale (DRS); and
When u0 < 0, it represents increasing returns to scale (IRS).
SFA method
The SFA method was developed by Aigner et al.
33
and Meeusen and van den Broeck.
34
The main concept is to connect the most efficient input and output combinations of the firm to be evaluated into a productivity frontier and to assume that not all firms evaluated are efficient. Only firms at the production frontier of efficiency are technically efficient. This study uses the Cobb–Douglas stochastic frontier production functions proposed by Battese and Coelli
35
for continuous data across time. The Cobb–Douglas stochastic frontier model takes the form
29
:

Data and empirical model
Samples and data sources
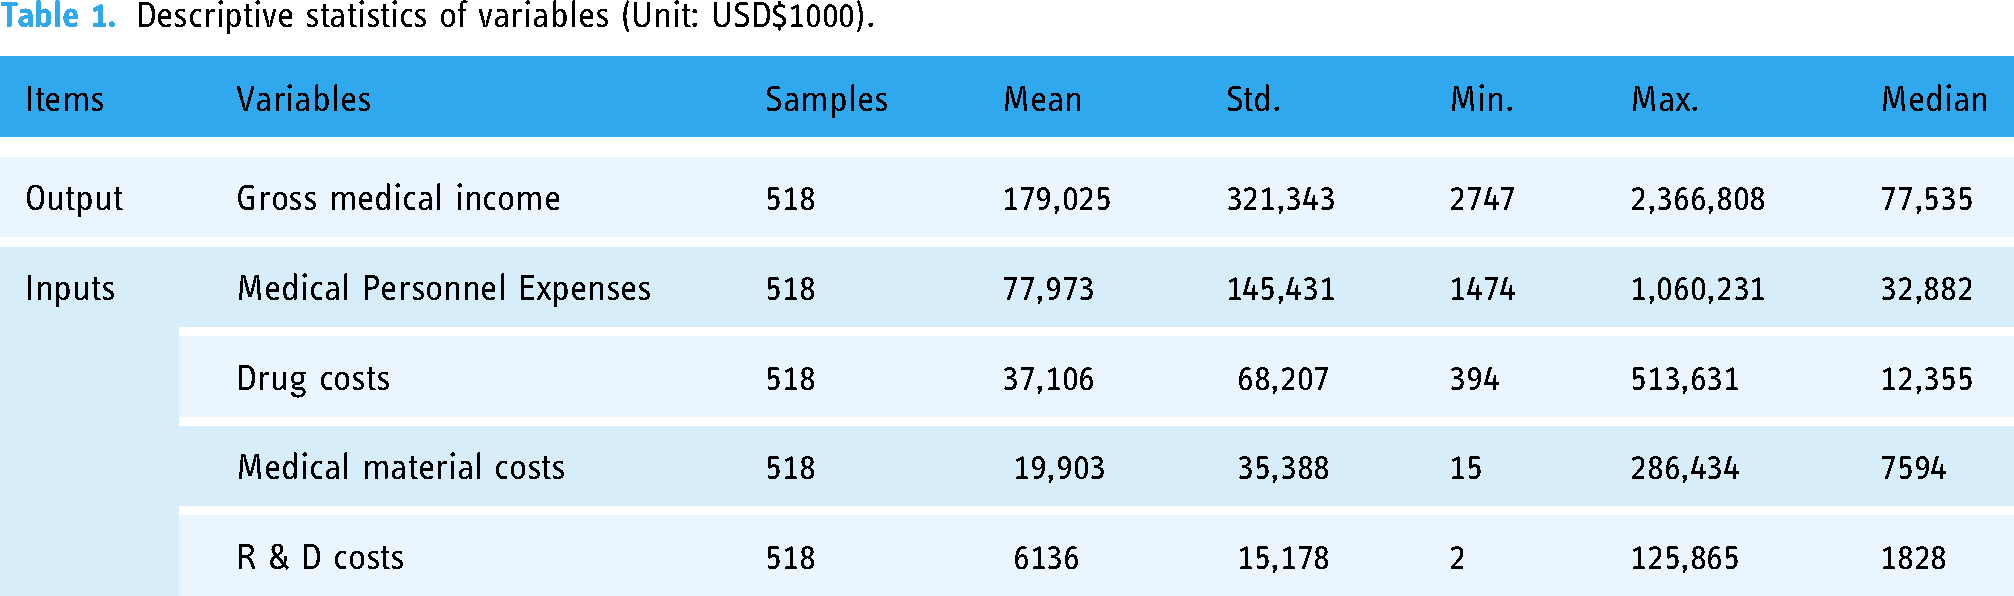
The sample for this study was collected from 53 NPPHs from the Ministry of Health and Welfare (MOHW) 9 in Taiwan from 2005 to 2020, excluding incomplete data from the previous two years, data from hospitals that are closed down, and missing data. The data for this study was obtained from 37 hospitals over a 14-year sample period from 2007 to 2020, with a total sample size of 518. The financial statements of hospitals in Taiwan are audited by an accountant and approved by the MOHW before being made public. The financial statements contain information on three main items: medical revenues, medical costs, and operating expenses. Medical revenues include emergency and outpatient services; medical costs include personnel costs, drug costs (DCs), medical device costs, and depreciation; and operating costs include marketing, management, and research and development costs incurred in the provision of medical services. 9
In this study, one output was selected, gross medical income (GMI), and four inputs were selected: medical personnel expenses (MPEs), DCs/expenses, medical material costs (MMCs), and research and development (R & D) costs. As the sample period for this study is 14 years, the 2020 price index is used as the base period for the conversion of deflators. The Taiwan dollar is converted into US dollars based on the average exchange rate against the US dollar for each year.
Variables
This study focuses on the financial characteristics of hospitals, selecting input and output financial data for efficiency analysis, and examining the financial performance of hospitals in terms of operating costs in order to reduce costs and improve operational strategies. The use of financial statement data provides a direct insight into the profitability and expense profile of a hospital, as profitability is what determines the viability of a business, that is, whether a hospital can generate sufficient remuneration to continue to operate. This study differs from previous studies that used the numbers of medical staff, beds, and patients to determine efficiency, but we have no way of knowing whether the hospital is losing money and going out of business.
This study uses both DEA and SFA to measure efficiency analysis. In the DEA method, one output factor, GMI, and four input factors, MPE, DC, MMC, and R & D, were selected as the data for analysis. The SFA method was also used to construct the Cobb–Douglas stochastic frontier function model with the same data as the DEA, and to investigate the difference between general and religious NPPHs, which are funded by religious groups, and to measure whether there is a difference in their operational efficiency. The statistics of the variables in this study are shown in Table 1.
Descriptive statistics of variables (Unit: USD$1000).
Empirical model of DEA
This study used the CRS and VRS input-oriented DEA models to estimate the technical efficiency of each hospital. The SE (= CRS/VRS) was obtained by subtracting the CCR from the BCC. The study data were used to estimate the technical efficiency of 37 hospitals based on the DEA methodology over a period of 14 years using one output, GMI, and four inputs: MPE, DC, MMC, and R & D. The computer software used for calculation was DEAP Version 2.1, which is freely available from Coelli. 36
Empirical model of SFA
This study relies on the Cobb–Douglas stochastic frontier model proposed by Aigner et al.
33
and Battese & Coelli
35
uses the same data as the DEA approach to develop an SFA model to measure inefficiency indicators in hospitals. The output term (GMI) and input terms (MPE, DC, MMC, and R&D) of the DMU are substituted in Equation (4), which can be converted to Equation (5). Calculations were made using the Frontier Version 4.1 computer software, which is available free of charge from Coelli.
37
The empirical model is:
Results and discussion
Annual average efficiency analysis and discussion
Table 2 and Figure 2 present the estimated DEA and SFA annual average efficiency values for 37 hospitals from 2007 to 2020 (a total sample period of 14 years). In terms of the DEA results, 10 hospitals with a technical efficiency of 1 in terms of CRS are relatively efficient hospitals. In terms of pure technical efficiency for VRS, 16 hospitals have an efficiency value of 1 and are relatively efficient hospitals. In terms of SE, 14 hospitals have an SE of 1, which indicates that these hospitals have the best operational performance and capacity at the most appropriate scale of production. In the RTS column, 26 hospitals are shown as ‘DRS’, which means that the hospital is in a state of decreasing scale and the input resources should be suitably reduced. Two hospitals, A13 and A16, show ‘IRS’, which means that the hospital is experiencing incremental growth in scale and that additional inputs could increase the scale of operation. The BCC VRS model is a measure of pure technical efficiency for hospitals, which prevents the scale of production from affecting the DEA efficiency measure. Table 2 shows that the pure technical efficiency values (VRSTE) for BCC are greater than the technical efficiency values (CRSTE) for CCR, which indicates that, with the exception of the hospitals with a technical efficiency of 1 for CCR, the efficiency performance of all hospitals is affected by the scale of production or production technology. There are 16 hospitals with an efficiency of 1 in the input-oriented BCC model. This figure is seven more than the nine hospitals using the CCR model, which indicates that the seven hospitals are purely technically efficient due to economies of scale. In addition, the total annual average efficiencies for CRS, VRS, and SE are 0.91, 0.96, and 0.95, respectively. This indicates that the technical efficiency, pure technical efficiency, and SE of all hospitals are good, but there is still room for improvement at 9%, 4%, and 5%, respectively. Among the sample hospitals in the reference peer group, the hospitals that could provide the reference target and reference frequency were Hospital A24 (a total of twenty times), Hospital A7 (thirteen times), Hospital A22 (eight times), Hospital A5 (seven times), Hospital A30 (six times), Hospital A1 (five times), Hospital A15 (four times), Hospital A14 and A31 (three times each), Hospital A10 and A35 (two times each), and Hospital A18 (one time). The more times a hospital is peer-referenced, the more relatively efficient it is and the more robust it is measured to be. This allows other hospitals to review the input and output reference values of peer hospitals of their own size to improve their own operational efficiency.
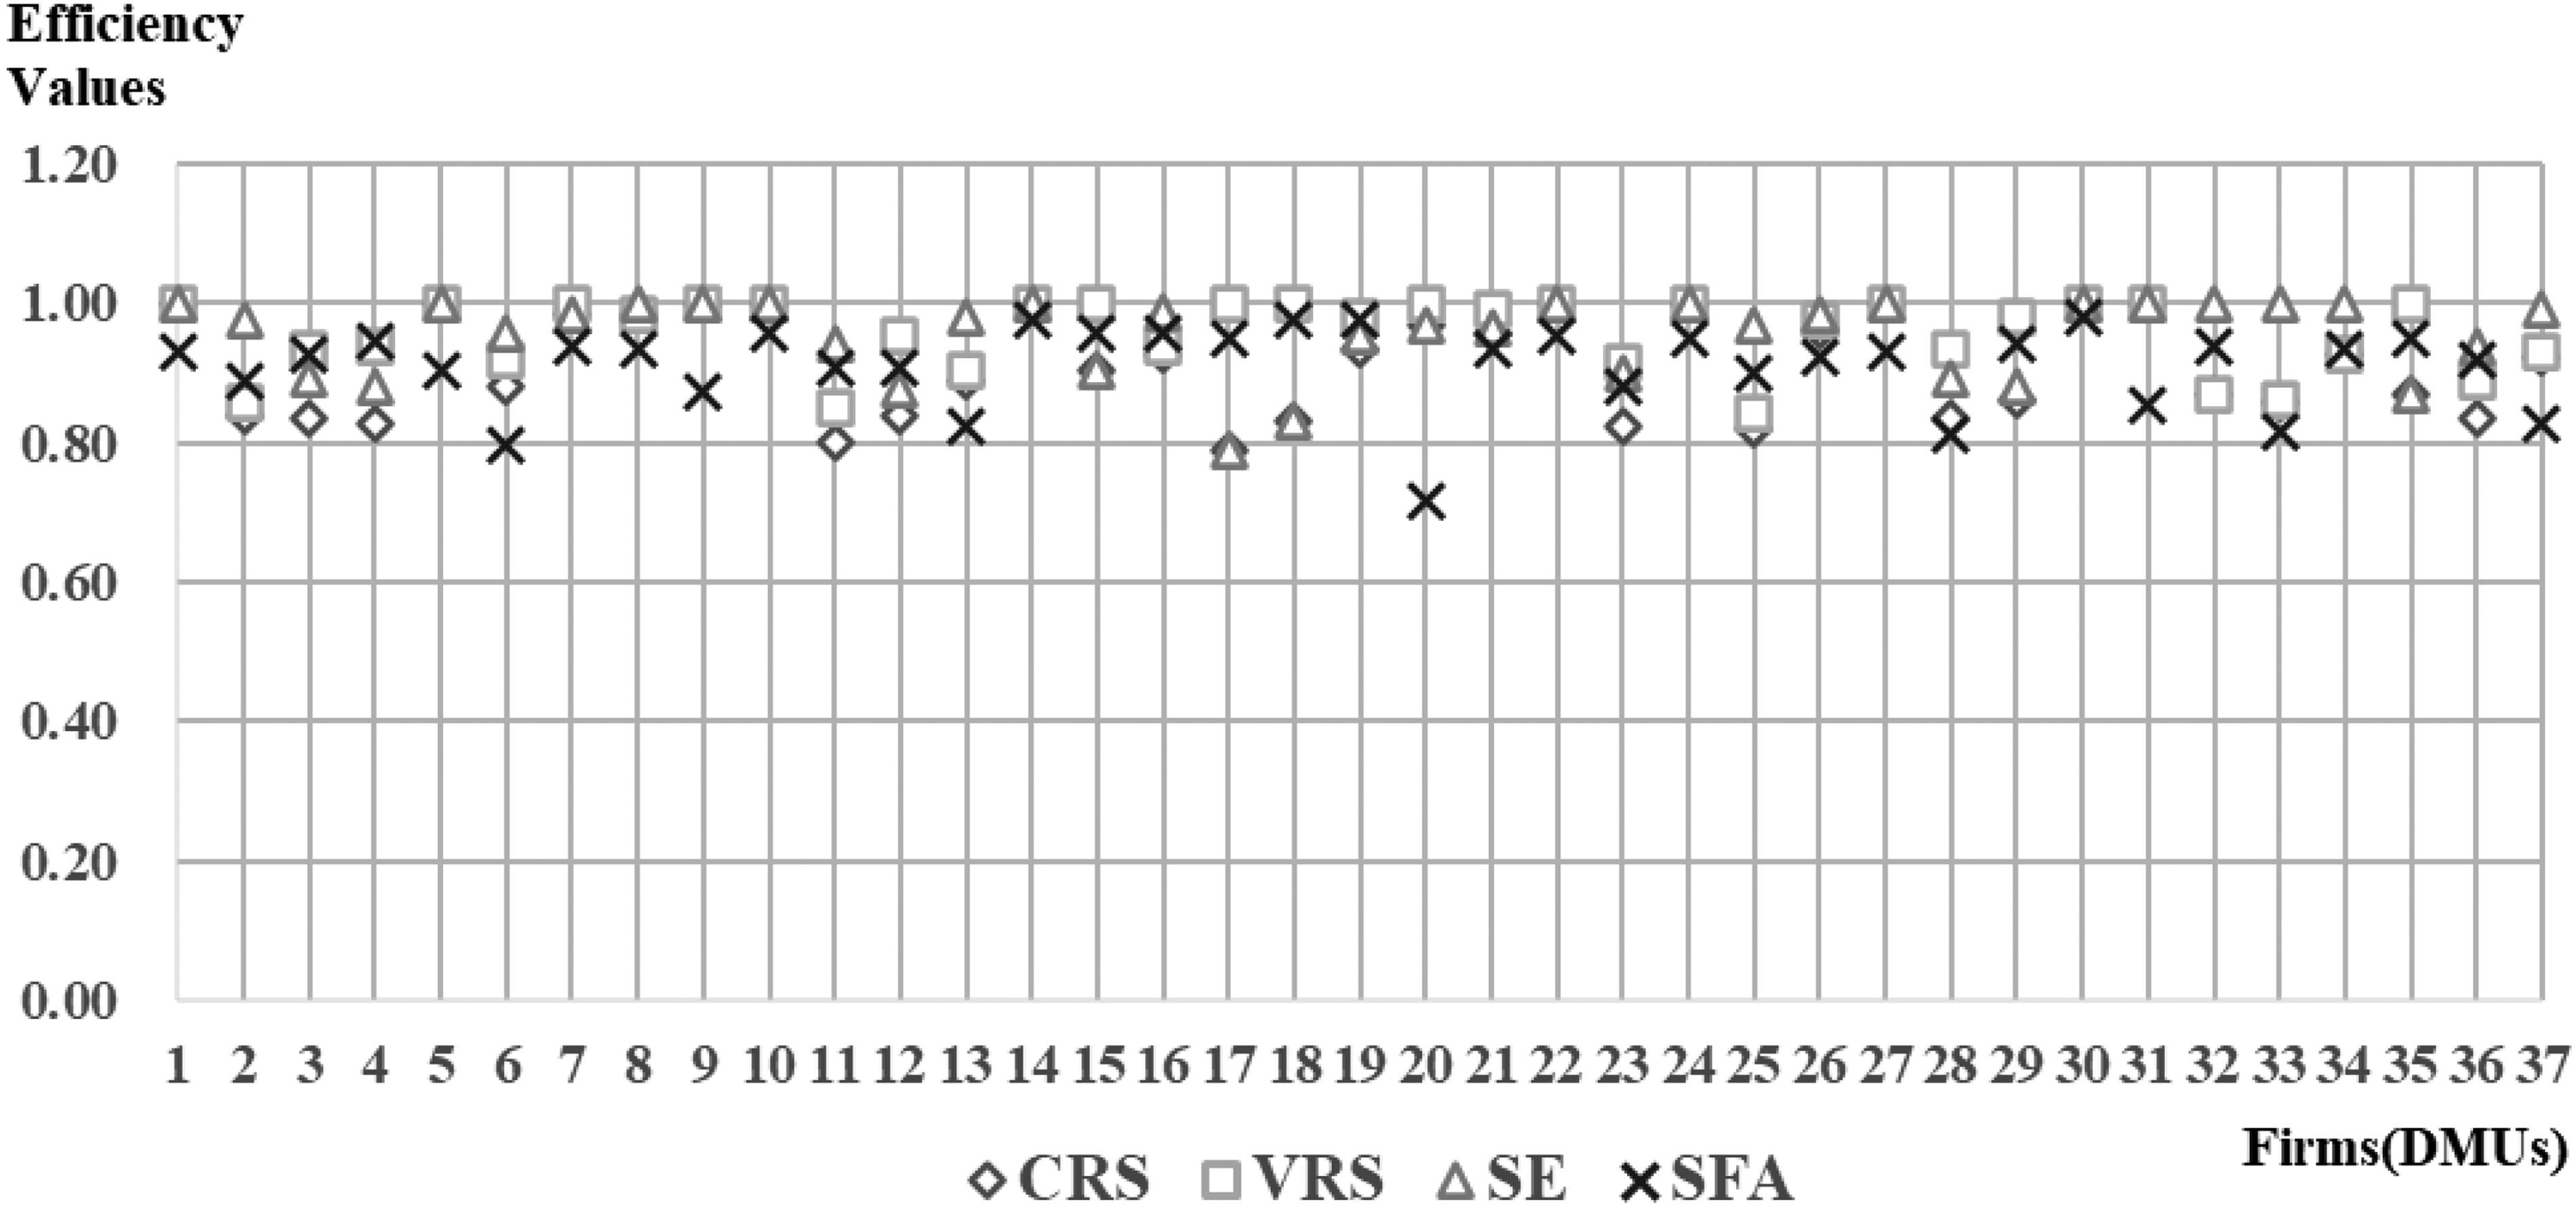
Distributions of the average annual efficiencies of DEA and SFA for each hospital.
Estimates of the average annual efficiencies of DEA and SFA for each hospital.

Note: 1. CRSTE = technical efficiency from CRS DEA.
2. VRSTE = technical efficiency from VRS DEA.
3. SE = scale efficiency = CRSTE/VRSTE.
DEA: data envelopment analysis; SFA: stochastic frontier analysis; DMU: decision making unit.
The SFA estimates in Table 2 show that the hospitals with the highest-ranked efficiency of 0.98 for the sample period were A14, A18, A19, and A30 (four hospitals in total). The hospitals with the second-highest efficiency of 0.96 were A10, A15, A16, and A22 (four hospitals in total). The third-highest-ranked hospitals with efficiency values of 0.95 were A4, A17, A24, and A35 (four hospitals in total). This means that these 12 hospitals are performing relatively well. The average SFA efficiency value of 0.91 shows that NPPHs have excellent financial efficiency, but there is still room for improvement at 9% overall.
In addition, Table 2 and Figure 2 show that there is only a very small difference between the average efficiency values of DEA and SFA. Among the individual hospitals, the best DEA efficiency was 1. Using the SFA, there were eight hospitals in common that had better efficiencies of 0.95 or more. This indicates that the DEA and SFA findings are both very similar and of good reference value. However, in terms of efficiency and ranking, SFA takes the absolute efficiency of all hospitals in the sample, while DEA takes the relative efficiency of each hospital. Therefore, SFA is more accurate than DEA. Furthermore, after examining separately whether the hospitals established were general or religious NPPHs, the differences in average efficiency values were not significant, suggesting that the financial efficiency of NPPHs did not differ depending on the nature of their establishment.
Analysis and discussion of DEA slack variables
The DEA slack variable represents the amount of input that should be reduced or the amount of output that should be increased in order to achieve the same resource efficiency as the relatively inefficient hospitals. Slack variable analysis can be used to provide a direction and magnitude of improvement for inefficient hospitals for both reference and application. In Table 3, the slack variables for inefficient hospitals show that three hospitals had to reduce their medical staff costs by an average of US$513,509, two hospitals had to reduce their medical product costs by an average of US$104,778, 12 hospitals had to reduce their MMCs by an average of US$414,382, and 14 hospitals had to reduce their research and development costs by an average of US$571,691. This study used the slack variables to identify inefficiencies in output due to the high costs of medical materials and research and development costs.
Slack variables for inefficient hospitals (Units: US$1000).

DMU: decision making unit.
Analysis and discussion of the SFA method estimation results
In this study, the SFA method was used to generate the results using the maximum likelihood estimation method, as shown in Table 4. Table 4 shows that the inefficiency indices for hospital inputs such as MPE, DC, and MMC, which are all relevant to the GMI of the hospital, have a highly significant positive correlation while R & D has a significant positive correlation. This means that expenditure on these inputs should be reduced first, particularly the higher estimates of medical staff costs (estimate = 0.4569) and pharmaceutical costs (estimate = 0.3332), followed by a reduction in the cost of medical materials (estimate = 0.1121).
Estimates of the stochastic frontier function.

log likelihood function = 189.7692
Note: 1. ***, **, and * represent significance at the 1%, 5%, and 10% levels, respectively.
2.
There are large and persistent differences in healthcare expenditure and outcomes. In the United Kingdom, for example, long-term records show that 10% of hospitals with the lowest risk of death due to health service variation are 21% lower than the U.K. average. 1 First, the healthcare system should provide better doctors and nurses to reduce the number of less-skilled medical staff, and to streamline, professionalise, and make more efficient the work and medical practice by informing the practice, tests, and consultations. Table 2 uses the second-most efficient hospital in the SFA (number A10) as an example. Hospital A10 uses artificial intelligence (AI) to predict when patients will arrive for emergency care and the number of patients at peak times to ensure that medical staff and supplies are sufficient to meet the demand and uses AI to optimise staff scheduling and bed arrangements for a smoother emergency process. 38 Second, the construction and updating of electronic medical records and standards can reduce the cost of space and time wasted on paper medical records. In hospital number A10 and A15, for example, electronic medical records can be used to reduce the waste of paper resources and can be integrated with AI programmes to control the safety of patients’ medication. When doctors prescribe too high a dose of medication, the computer system will alert them to avoid medical errors and enhance the professionalism and efficiency of care.38,39 The third recommendation is the application of AI to the database of imaging medicine and diagnostic accuracy. With the help of medical robots, the load on medical manpower can be reduced and efficiency improved, and overall medical staff costs reduced. In addition, according to data collected by this study, the cost of medical manpower in private hospitals in Taiwan accounts for 51.59% of the total cost of medical services. Second, the remaining 50% of the total cost of care is spent on medical equipment and consumable pharmaceutical and MMCs. Therefore, many studies suggest that the efficiency of healthcare should be improved and maintained by finding and combining suppliers who can provide low-cost and high-quality medical equipment and supplies.40–42 This study suggests that medical devices and drug management systems should be enhanced to reduce costs and that a knowledge management system of physician usage patterns should be developed that incorporates big data to adopt specific purchasing strategies to reduce inventory. It may even be possible to review how medical supplies are actually used by healthcare professionals to improve the efficiency of investment and use of medical equipment. 38
Conclusions
This study measured 37 NPPHs with a total sample size of 518 for the period of 2007 to 2020. The methodology was based on the CRS and VRS input-oriented DEA models, and the Cobb–Douglas stochastic frontier model, in order to measure the inefficiency of a hospital. The difference between the DEA and SFA methods is that DEA measures technical inefficiency based on the actual output being less than the frontier output. Meanwhile, SFA uses production functions and estimates the values of individual parameters by means of the best approximation, and ignores the effect of random factors on output. The results also do not have the same efficiency of 1 for multiple DMUs as in the case of DEA. However, DEA measures multiple outputs and inputs and eliminates the need to construct production functions to estimate the ease of efficiency, thus making the use of DEA methods more common, extensive, and convenient than SFA methods for studying hospital efficiency.
The empirical results of this study gave the following findings. (1) The overall operating efficiency of the NPPHs was excellent and reached at least 91% on average, with room for improvement of approximately 5% to 9%. (2) The average efficiency values of DEA and SFA differed only marginally. (3) When we compared general and religious NPPHs, we found that there was little difference in the average efficiencies, which indicates that there is no difference in operational efficiency according to how the hospitals are established. (4) The results of the SFA show that the inefficiency indices of three input factors, namely, medical personnel costs, DCs, and MMCs, have a highly significant positive correlation, and according to the data obtained from this study, these three factors also account for almost all of the total medical costs. Hospitals should actively reduce their expenditure in these three areas to significantly improve efficiency. (5) The DEA and SFA methods are similar and have reference values.
Based on the findings of this study, the following strategies for improving healthcare are recommended. (1) Medical personnel costs can be reduced appropriately to enhance financial efficiency. However, in order to avoid excessive reduction in manpower and resulting in overloading of medical staff, it is recommended that the quality of the overall medical staff should be improved and that information on the practice, tests, and consultations should be streamlined to make work and medical practice more streamlined, professional, and efficient. (2) Informative electronic medical records and standards should be constructed and updated, which can reduce the space and time costs wasted on paper medical records. (3) AI can be applied to the database and diagnostic accuracy of imaging medicine. Medical robots can be used to reduce the load on medical manpower and increase efficiency. This is a new trend in the future of healthcare. (4) In the area of pharmaceuticals, it is proposed to strengthen cost management and implement stock control and prescription management, and to reduce costs and improve financial performance by purchasing directly from pharmaceutical companies and reviewing the use of pharmaceuticals. (5) The cost of medical devices should be appropriately reduced to enhance efficiency, and suppliers that can provide low-cost, high-quality medical devices and related supplies should be identified and integrated. (6) R & D in the field of combined imaging medicine and intelligent robotics should be encouraged in order to enhance medical technology and efficiency. In recent years, the vision for healthcare in Taiwan has been to promote ‘smart healthcare’ to improve the efficiency and quality of medical services. In terms of practical applications, AI will be actively implemented and combined with big data analysis to predict the number of patients arriving at hospitals, in order to optimise manpower and the quantity of medical drugs and materials, thereby smoothing out healthcare services and processes. Secondly, the use of electronic medical records stored in the cloud reduces the wastage of resources and eliminates the need for huge storage space and the processing and labour costs required to access the records. In addition, medication management systems can be developed to reduce prescription errors and integrate with purchasing strategies to reduce inventory. The actual frequency of use of medical devices can even be reviewed to improve the efficiency of investment and use of medical equipment. It is hoped that the results of this study can be used as a reference for healthcare organisations to improve their business strategies and efficiency.
Footnotes
Acknowledgements
Declaration of conflicting interests
The author declared no potential conflicts of interest with respect to the research, authorship, and/or publication of this article.
Funding
The author received no financial support for the research, authorship, and/or publication of this article.
Ethical approval
Does not apply. This article does not contain any studies with human participants or animals performed by any of the authors.
Guarantor
JSW.