
Abstract
Inappropriate drug use is a significant global health issue, particularly in low-resource settings. This systematic review evaluates drug utilization across healthcare facilities in Nepal, a low-resource setting, using WHO core prescribing indicators to identify areas for improvement. A systematic review was conducted by searching literature in PubMed, Embase, CINAHL, INRUD bibliography, NepJOL, NepMed, and Google Scholar. Original studies assessing at least one WHO prescribing indicator in healthcare settings of Nepal were included. Eligible studies were analyzed descriptively and through proportional meta-analysis using a random-effects model. Eighty-eight studies were identified involving 2108 healthcare facilities and 60 191 patient encounters. The average of three drugs per encounter (95% CI: 2.5-3.2) was determined. Generic prescribing occurred only in 21.8% (95% CI: 15.6%-28.8%) prescriptions, showing a decline trend. Antibiotics were prescribed in 64.4% (95% CI: 57.7%-70.8%) encounters, with higher prevalence in secondary and tertiary care settings. Injectables were prescribed in 22.9% encounters (95% CI: 12.2-35.8). Drugs prescribed from WHO and Nepal essential medicine lists accounted for 53.0% (95% CI: 41.1-64.7) and 54.4% (95% CI: 47.7-60.9), respectively. The evaluation of drug utilization in Nepal suggested that the standards for WHO core prescribing indicators were not met, including overuse of antibiotics, underuse of essential medicines, and minimal generic prescribing. Targeted interventions, including prescriber education, policy reforms, enhanced monitoring, and regular prescription audits, are essential to promote rational prescribing and improve drug-related outcomes, including an opportunity to reduce antimicrobial resistance.
Keywords
Introduction
Inappropriate drug use is a global challenge and causes significant health and economic impacts. Evidence suggests that more than half of all patients receive suboptimal treatment.1,2 This is particularly exacerbated in low-resource settings by constrained economic resources, weak health systems and a lack of regulated drug policies.1,3 Effective drug utilization studies are crucial for ensuring safe, efficient, and equitable healthcare delivery, particularly in low-resource settings.4 -6 The World Health Organisation (WHO) emphasizes rational drug use to ensure patients receive medications based on their clinical needs, in the right dosages, and at the lowest possible cost to both individuals and communities.7,8 Such approach can have a significant role in overcoming negative consequences associated with the irrational use of drugs, such as drug resistance, adverse drug reactions (ADRs), financial burden, and overall decline in the quality use of drugs.8 -10
WHO has developed prescribing indicators, core and complementary prescribing indicators, to assess the drug use pattern, evaluating the rationality and quality of prescriptions, and identify drug use problems globally.2,11,12 These indicators enable regular drug use surveys, comparisons between facilities, regions, and countries, and measure the impact of interventions. 12 The WHO’s core prescribing indicators, which include the average number of drugs prescribed per encounter, percentage of drugs prescribed by generic name, percentage of encounters with an antibiotic prescribed, percentage of encounters with an injection prescribed, and percentage of drugs prescribed from essential medicine lists or formularies, are highly standardized and were applied across different healthcare settings.12,13 Reference values for each of the core prescribing indicators have been suggested though an international standard has not yet been empirically established. 14 In settings where healthcare systems are often under-resourced, these indicators offer valuable insights into prescribing behaviors and highlight opportunities for improvement.
Nepal, a low-resource representative country in South Asia, operates primary healthcare services through seven provincial and 753 local governments.15,16 Government provides basic health services at tertiary, secondary, and primary levels. Primary level (primary healthcare centers, health posts, sub-health posts, urban health centers and primary healthcare outreach clinics) provide basic healthcare services free of cost, while tertiary (regional and central hospitals) and secondary-level (district hospitals) care providers charge for their services. 16 Private sectors, mostly located in urban or major cities, also offer primary, secondary, and tertiary level services. Out-of-pocket expenditure has been the largest source of healthcare funding in Nepal, which accounts for more than half of all health expenditures in Nepal despite the implementation of health insurance program. 17 Data indicates that 11.1% of households still face catastrophic health expenditure. 18
Limited studies have reported the drug utilization pattern in a global, 19 regional 20 and national context.21,22 All these studies reported variable patterns of drug utilization across the countries and reported inconsistency in data. To our knowledge, no systematic synthesis of literature has been performed to provide the drug utilization pattern in Nepal using WHO core prescribing indicators. Therefore, this review aimed to quantitatively summarize the published studies that assessed drug utilization across various healthcare settings in Nepal using at least one WHO core prescribing indicator and identify areas for improvement.
Methods
Protocol and Registration
This systematic review and meta-analysis was conducted in compliance with the Preferred Reporting Items for Systematic Review and Meta-Analysis (PRISMA). 23 The protocol for the systematic review has been published in PROSPERO (2021: CRD42021219634) and is available at https://www.crd.york.ac.uk/PROSPERO/view/CRD42021219634.
Eligibility Criteria
Observational studies, interventional studies or mixed method studies published in the English language; assessing drug utilization in healthcare facilities of Nepal- including hospitals, health posts, sub-health posts, and primary healthcare centers; and reporting at least one WHO prescribing indicator were included in this review. Studies without a total number of patient encountered, case series, case reports, qualitative studies, reviews and studies focusing on medication or prescription errors or of community setting or using prescriptions as a sampling unit were excluded.
Study Retrieval Process
Studies were searched in seven databases from inception to June 2023: PubMed, Embase, Cumulative Index to Nursing and Allied Health Literature (CINAHL), INRUD bibliography, NepJOL, NepMed, and Google Scholar. Keywords and controlled vocabulary (Medical Subject Heading or MeSH terms for PubMed and CINAHL; Embase Subject Heading for Embase) were used with appropriate Boolean logics, synonyms and limiters. A detailed search strategy is provided in Supplemental S1 Table. A reference list of relevant studies in the full-text stage was also explored to identify additional potentially relevant studies that might have been missed by electronic databases searches. Two reviewers (RA, RSP) independently screened the studies for the title, abstract and full text. Studies for data extraction were selected with consensus, and any conflict was resolved by a third reviewer (SS).
Data Extraction
A pre-specified data extraction form was developed and used to extract data on study characteristics (study title, journal, year of publication); methods (design, study population, study setting, sample size, data collection approach); and outcomes (WHO core prescribing indicators). Data was extracted by one author (RA) and independently verified by two authors (RSP, SS). For interventional studies, only baseline data was extracted. For studies with multiple settings, data were extracted separately for each setting.
Data Analysis
The unit of analysis for this review was the study setting within each study rather than the individual study. Each different setting of a study was treated as a single data point with equal weight irrespective of the sample size. A data point is defined as a measurement of a specific medicine use indicator at a specified time for a specific provider in a specific setting. 24 A study could contribute to multiple data points when the study setting differed in terms of the characteristics of the healthcare facility. If the same study reported multiple data points for same study group within same period, only their mean value was used for descriptive analysis. 24
In this study, six medicine use indicators were analyzed—(1) average number of drugs prescribed per encounter, (2) percentage of drugs prescribed by generic name, (3) percentage of encounters with an antibiotic prescribed (PEAP), (4) percentage of encounter with an injection prescribed (PEIP), (5) percentage of drugs prescribed from WHO essential medicine list (EML), and (6) percentage of drugs prescribed from Nepal EML. A descriptive approach was employed to analyze the data, as in the previous review. 20 The average number of drugs prescribed per encounter was summarized using a median and 95% confidence interval, while the remaining indicators were subjected to a proportional meta-analysis using previously published methods.25 -27 A random-effects model with DerSimonian and Laird variance estimator was used to pool the proportions. 25 The proportion estimates were transformed using the Freeman-Tukey double arcsine transformation. 25 Knapp-Hartung adjustments was used to calculate the confidence interval and the prediction interval around the pooled effect. 26 Heterogeneity between studies was assessed by Cochran’s Q test and I2 statistic. 25 Publication bias was assessed using funnel plots and Egger’s regression test of funnel plot asymmetry. 26 Sub-analysis was conducted for healthcare facility characteristics (level, location, administration, and type), data collection duration, prescription period, study quality, drug categories studied, disease condition studied, and INRUD methodology followed (Supplemental S2 Table). Additionally, a subset meta-analysis was also done with the studies not targeting a specific drug or drug class and a specific disease condition. Further subgroup analysis of this subset meta-analysis was also done. Results were presented in forest plots with 95% confidence intervals. The pooled proportion or median value was compared with the WHO-recommended reference values for each indicator. Descriptive analysis was performed using IBM SPSS version 27 (IBM Analytics Division), and meta-analysis was performed using R statistical software version 4.3.2 (R Development Core Team, 2023) with package meta version 7.0-0. 28
Critical Appraisal of Included Studies
A 14-point scoring system developed by Ofori-Asenso et al was used to assess the quality of the included studies incorporating the WHO recommendations on investing drug use in health facilities. 20 Each criterion in the checklist is allocated a score of 1 point or 0 point. The total score obtained for each study was converted into percentages and classified as high (≥70%), moderate (69%-51%) and low (≤50%). 20 The critical appraisal focused only on the criteria relevant to the indicators that were assessed in the study. Critical appraisal was done by one author (RA) and independently verified by two authors (RSP, SS).
Results
Study Identification and Retrieval
A total of 10 484 studies were identified through database searches. After removing duplicates, 9855 studies were screened for title and abstract, 200 studies for full-text review and 88 studies were included in this review (Figure 1). Reference tracking of the eligible studies at full-text stage yielded no additional studies. The full list and general characteristics of included studies are shown in Supplemental Table A and B in S1 Appendix.
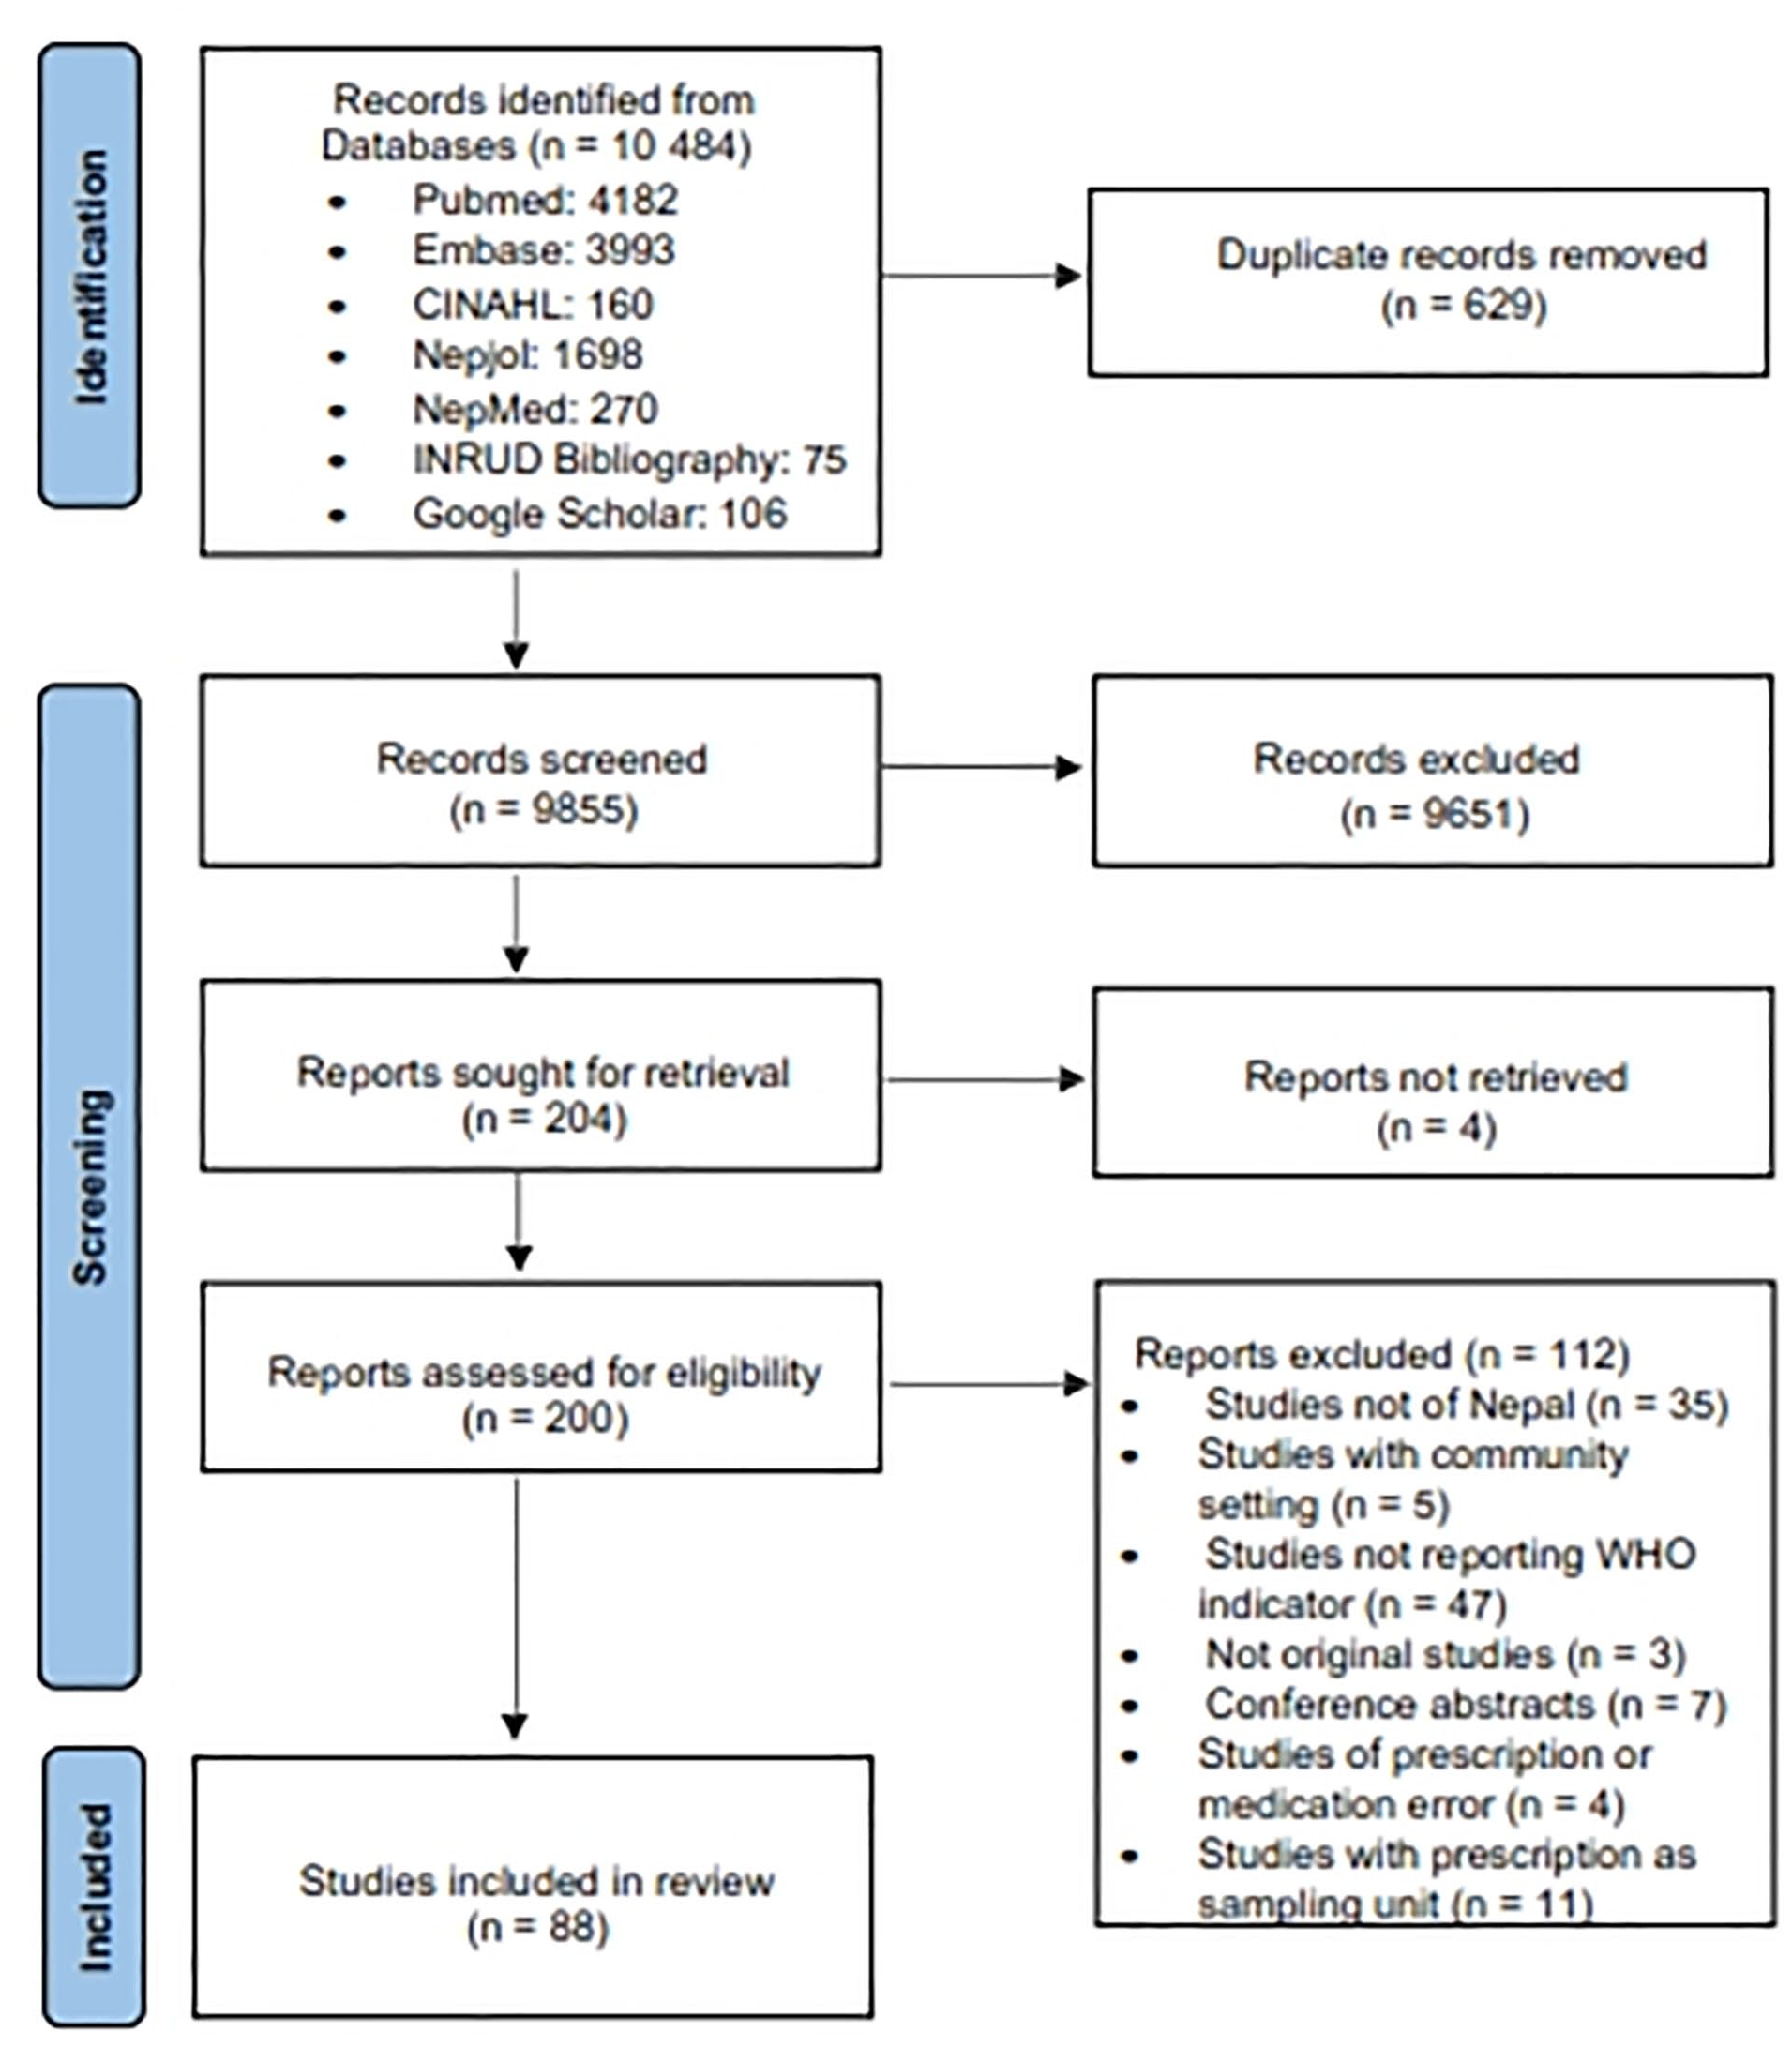
Flow diagram of screening process as per PRISMA 2020.
Characteristics of Included Studies
The characteristics of the included studies (n = 88) are illustrated in Table 1. Most studies were descriptive cross-sectional (73.8%), used purposive sampling method (67.1%) and performed prospectively (77.8%). Majority of the studies investigated general patient encounters (63.6%) and unspecified categories of drugs (55.7%). The total number of encounters investigated in the studies ranged from 38 to 9845, with most studies (68.2%) reported encounters of 100 to 500.
Descriptive Characteristics of Included Studies (n = 88).
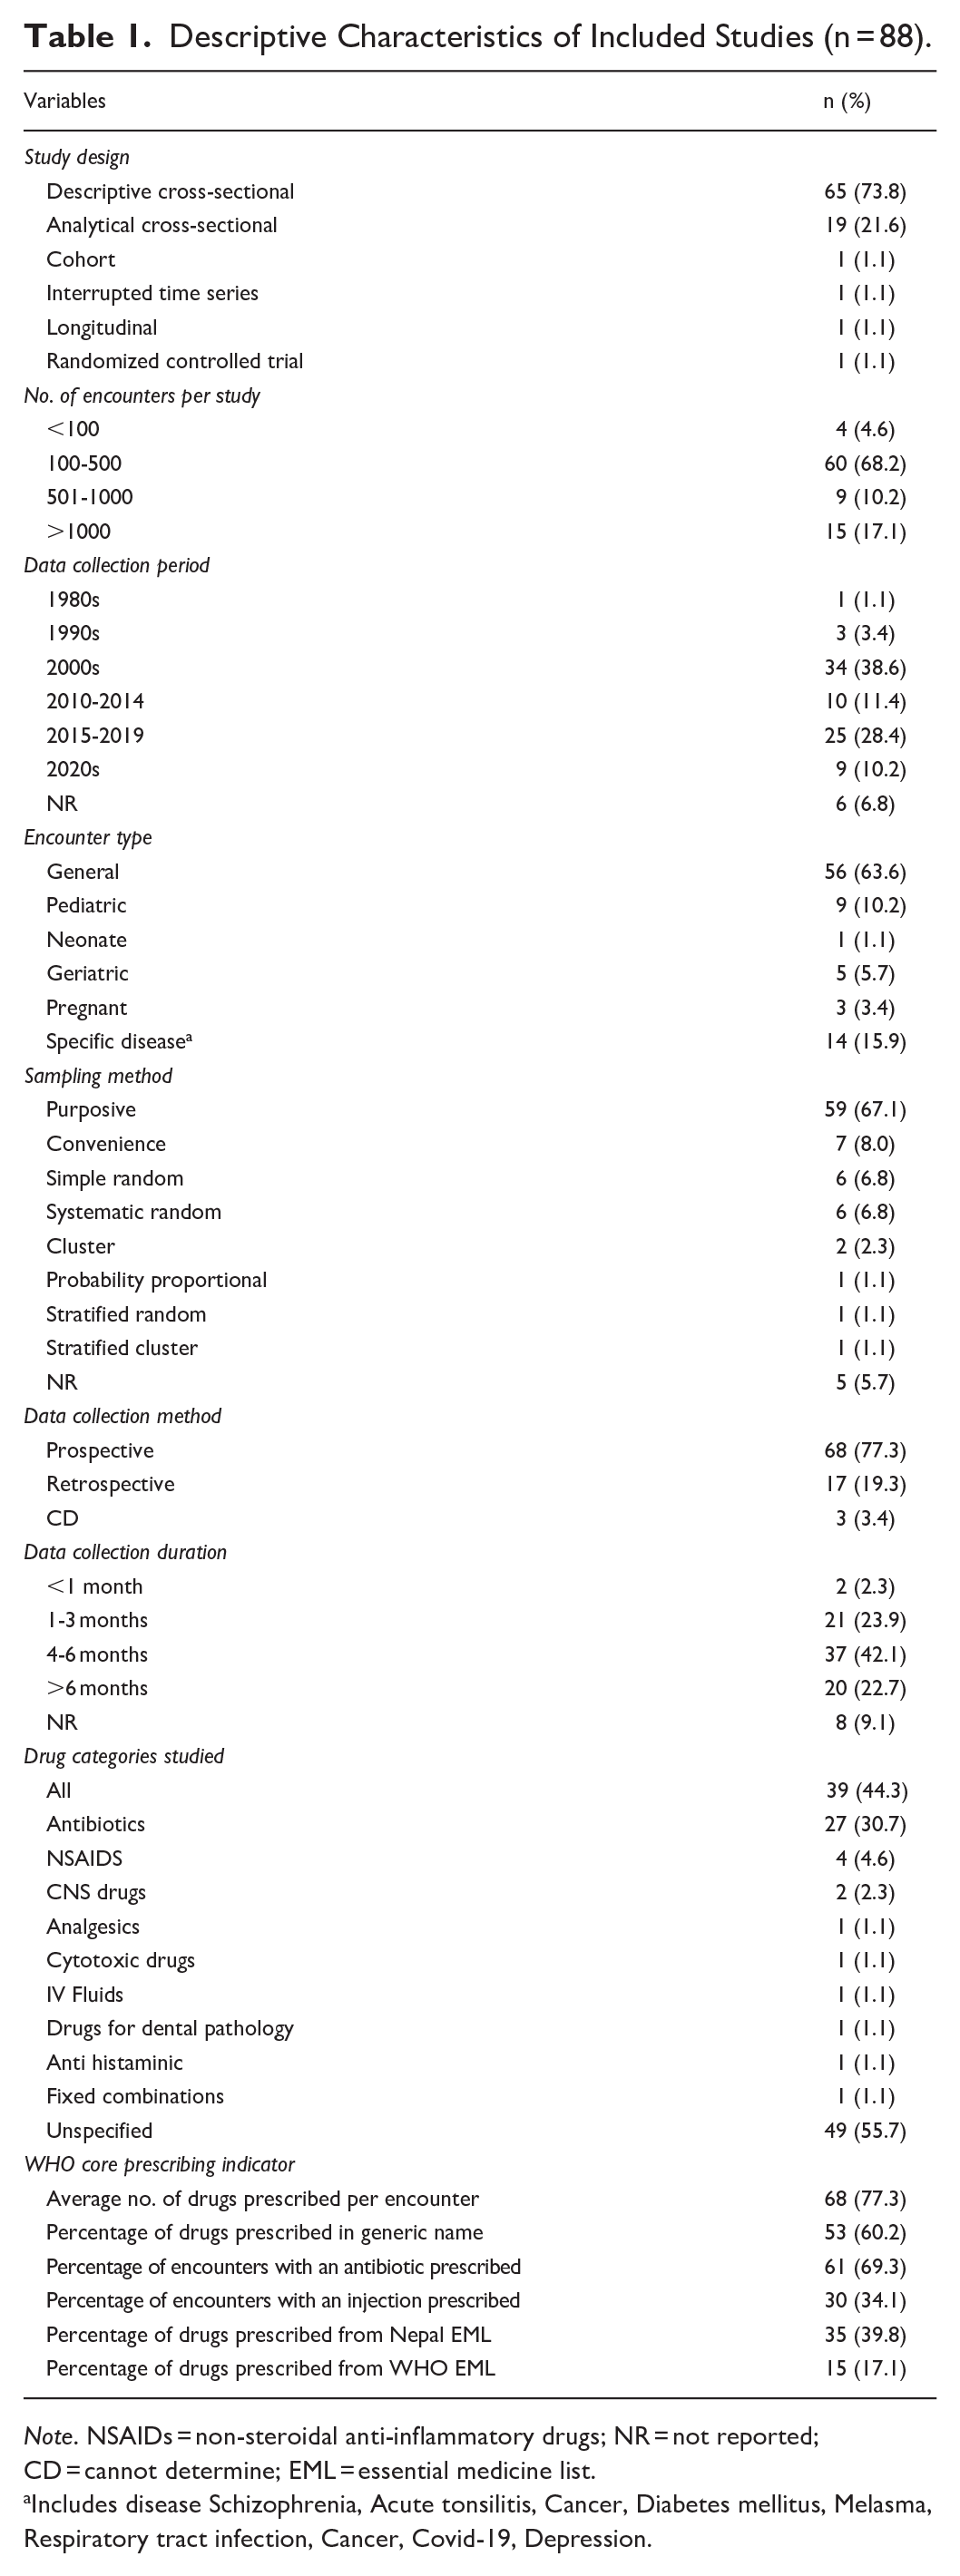
Note. NSAIDs = non-steroidal anti-inflammatory drugs; NR = not reported; CD = cannot determine; EML = essential medicine list.
Includes disease Schizophrenia, Acute tonsilitis, Cancer, Diabetes mellitus, Melasma, Respiratory tract infection, Cancer, Covid-19, Depression.
A total of 2108 healthcare facilities were investigated in all the included studies and most of them were public (58.2%). Out of 2108 healthcare facilities, 1955 were studied in 2 national surveys (survey I = 963 healthcare facilities and survey II = 992 healthcare facilities) and the remaining 153 facilities in 86 studies (Supplemental Figure A in S1 Appendix). Of the 153 healthcare facilities, 51.6% and 41.8% healthcare facilities provided tertiary care and primary care respectively.
“WHO prescribing indicators” were identified as outcomes by 43.2% of studies (n = 38), while remaining studies (n = 50) either reported or provided data to compute any one of WHO core prescribing indicators. Only eight studies (9.1%) provided data on all the six WHO core prescribing indicators, and 29 studies (32.9%) reported only one of the indicators. See Table 1 for more details on studies reporting each indicator.
Trends of Drug Utilization Studies
The earliest study was conducted in 1989, 29 followed by another study in 1997. 30 The remaining studies were published after 2000, with an average of 3.7 studies per year. Publications were high during the 2000s (3.3 studies per year) which declined in the 2010s (2.5 studies per year) and dramatically increased in the 2020s (9.3 studies per year). The trend of drug utilization studies conducted in Nepal has been visualized in Supplemental Figure B in S1 Appendix.
Geographic Distribution of the Studies
The geographical distribution of included studies across Nepal is presented Figure 2. Two studies31,32 were conducted nationwide as a part of multinational studies. Most of the studies were conducted in Gandaki Province (35, 39.8%), followed by Bagmati Province (22, 25.0%), Koshi Province (16, 18.2%), and Lumbini Province (8, 9.1%) while only one study was conducted in Karnali Province and no study was reported from Sudurpaschim Province and Madhesh Province. Specific provincial or district locations were not indicated in three studies.33 -35

A choropleth showing distribution of drug utilization studies across Nepal.
Publication Bias Assessment
The funnel plot of findings of all the five WHO prescribing indicators was symmetrical (Supplemental Figures A-E in S2 Appendix). Egger’s test of funnel plot asymmetry showed no statistically significant asymmetry for the percentage of drugs prescribed in a generic name (P = .5899, Supplemental Figure F in S2 Appendix) and the percentage of drugs prescribed from Nepal EML (P = .4376, Supplemental Figure G in S2 Appendix). However, Egger’s test showed statistically significant asymmetry for PEAP (P < .0001, Supplemental Figure H in S2 Appendix), PEIP (P = .0479, Supplemental Figure I in S2 Appendix) and percentage of drugs prescribed from WHO EML (P = .049, Supplemental Figure J in S2 Appendix).
Critical Appraisal of Included Studies
The critical appraisal of studies showed that 56.8% (n = 50), 31.8% (n = 28) and 11.3% (n = 10) studies had moderate, high and low quality, respectively (Supplemental Table C and Figure C in S1 Appendix). A smaller sample size and methodological inadequacy to properly specify how medicines were counted and classified (criteria 4, 8, 9, 11, 13) were identified as the major non-compliance criteria. As per the WHO recommendation, the suggested sample size is 600 or more 12 , but more than three-fourths (77.3%) of the included studies had a sample size less than 600.
WHO Drug Use Indicators
This review obtained 283 separate data points from the 88 studies (Supplemental Figure D in S1 Appendix) for the six WHO drug use indicators, which assessed a total of 2108 healthcare facilities and 60 191 patient encounters.
Average Number of Drugs Prescribed Per Encounter
An average number of drugs prescribed per encounter was derived from 68 studies based on 72 data points. These studies assessed 43 069 patient encounters from 138 healthcare facilities. The summary of the average number of drugs prescribed per encounter based on various sub-groups is shown in Table 2. The median number of drugs prescribed per encounter was 2.9 (95% CI: 2.5-3.2). An average number of drugs prescribed per encounter was higher in secondary level HCF (4.1, 95% CI: 3.9-4.3) compared to primary (1.8, 95% CI: 1.5-2.5) and tertiary (2.9, 95% CI: 2.6-3.5) levels. Almost a similar number of drugs were prescribed per encounter in private (2.9, 95% CI: 2.5-4.3) and public (2.8, 95% CI: 2.2-3.3) healthcare facilities. A higher number of drugs were prescribed per encounter in hospital inpatient department (IPD; 5.4, 95% CI: 4.5-7.7) compared to outpatient (OPD) and emergency departments (ED).
Summary of Average Number of Drugs Prescribed per Encounter Across Included Studies (n = 53).

Note. NR = not reported; OPD = outpatient department; IPD = inpatient department; ED = emergency department; HP = health post; SHP = sub health post; PHC = primary healthcare center; HCFs = healthcare facilities; CI = confidence interval.
95% CI not calculated due to only 1 data point.
Not reporting OPD, IPD, or ER.
Percentage of Drugs Prescribed in Generic Name
The percentage of drugs prescribed in generic names of drugs was identified from 53 studies using 56 data points that evaluated 26 196 patient encounters across 122 healthcare facilities. The pooled percentage of drugs prescribed in generic name was 21.8% (95% CI: 15.6%-28.8%, I2 = 99.8%; Figure 3). Sub-group analysis (Table 3) showed no significant variation (P > .05) in the generic prescribing by duration of study and prescription period. Significantly higher generic prescribing was reported in primary healthcare facilities (P < .0001), in higher quality (P < .05), in community-based healthcare facilities (P < .0001) and in primary healthcare center (P < .0001). No significant variation was observed in generic prescribing between studies focusing on specific diseases or drugs, and this result was also valid for pooled percentages from a subset meta-analysis (Table 3). Subgroup analysis of subset meta-analysis showed similar results (Supplemental Figure A of S5 Appendix). However, this subset analysis showed that generic prescribing in public healthcare facilities (30.8%, 95% CI: 14.7%-49.9%) was almost double to that in private healthcare facilities (16.7%, 95% CI: 11.1%-23.2%) (P < .01). Also, a significant decreasing trend of generic prescribing from 2000s to 2020s was observed (P < .0001).

Forest plot of percentage of drugs prescribed in generic name across studies.
Meta-Analysis of 5 WHO Prescribing Indicators.

Note. NR = not reported; HCFs = healthcare facilities; OPD = outpatient department; IPD = inpatient department; ED = emergency department; HP = health post; SHP = sub health post; PHC = primary healthcare center; CI = confidence interval; EML = essential medicine list; INRUD = the international network for rational use of drugs. Bolded p values indicate significant differences.
No studies.
Not reporting OPD, IPD, or ER; P-value determined by Q test.
Result of subset meta-analysis taking only the studies not targeting a specific drug or drug class and a specific disease condition.
Percentage of Encounters With an Antibiotic Prescribed (PEAP)
The percentage of encounters with an antibiotic prescribed (PEAP) was reported in 61 studies, with 68 data points. These studies assessed 37 032 encounters across 2092 healthcare facilities. Proportional meta-analysis generated a pooled value of 64.4% PEAP (95% CI: 57.7%-70.8 %, I2 = 99.4%; Figure 4). Sub-group analysis (Table 3) showed significantly higher PEAP in secondary healthcare facilities, followed by tertiary and primary levels (P < .0001). Higher PEAP were reported in the IPD, followed by ED and significantly lower PEAP in health posts (P < .0001). A fluctuating trend of PEAP has been reported over the years, with the highest PEAP during the 1990s, lower in the 2010-2014, and lowest during the 2000s. A slight increase in PEAP was reported in the 2020s. PEAP was significantly different between studies focusing on specific drugs or disease conditions and that not specific to any drug or disease condition. Subset meta-analysis produced a lower pooled PEAP of 46.6% (95% CI: 39.9%-53.3%). This subset meta-analysis revealed a lower PEAP of 45.3% in tertiary healthcare facilities as compared to 51.6% in primary healthcare facilities, with no studies from secondary healthcare facilities, contrast to original meta-analysis’s findings (Supplemental Figure B of S5 Appendix). In addition to this, a significant larger difference in PEAP was observed between public (57.6%, 95% CI: 50.1%-64.8%) and private healthcare facilities (37.3%, 95% CI: 27.2%-48.0%) (P < .01).

Forest plot of PEAP across studies. PEAP, Percentage of encounters with antibiotic prescribed.
Percentage of Encounters With an Injection Prescribed (PEIP)
The percentage of encounters with an injection prescribed (PEIP) was reported in 30 studies that generated 32 data points. The studies evaluated 17 287 encounters across 43 healthcare facilities. The pooled PEIP was 22.9% (95% CI: 12.2%-35.8%, I2 = 99.7%; Figure 5). Sub-group analysis (Table 3) showed significantly higher PEIP in hospital ED and IPD compared to other types of healthcare facilities (P < .0001). Higher PEIP was reported in tertiary healthcare facilities compared to primary (P < .0001). Although an increase in PEIP had been reported over the recent years, the difference was not significant (P > .05). No significant variation was observed in PEIP between studies focusing on specific diseases or drugs. Subgroup analysis of the subset meta-analysis also showed no significance compared to the original meta-analysis (Supplemental Figure C of S5 Appendix).

Forest plot of PEIP across studies. PEIP, Percentage of encounters with injections prescribed.
Percentage of Drugs Prescribed From EML of WHO and Nepal
Fifteen studies containing 17 data points determined the percentage of drugs prescribed from WHO EML. These studies evaluated a total of 11 070 encounters across 18 healthcare facilities. The pooled percentage of drugs prescribed from WHO EML was 52.9% (95% CI: 41.1%-64.7%, I2 = 99.8%; Figure 6). Sub-group analysis (Table 3) showed no significant variation (P > .05) in the percentage of drugs prescribed from WHO EML by the methodological quality of the study and data collection duration. Compared to tertiary healthcare facilities, primary levels reported a significantly higher percentage of drugs prescribed from WHO EML (P < .0001). Subgroup analysis of the subset meta-analysis showed no significance difference compared to the original meta-analysis (Supplemental Figure D of S5 Appendix).

Forest plot of percentage of drugs prescribed from WHO EML and Nepal EML across studies.
Thirty-eight data points on the percentage of drugs prescribed from Nepal EML were derived from 35 studies that assessed 19 597 encounters from 90 healthcare facilities. The pooled percentage of drugs prescribed from Nepal EML was 54.4% (95% CI: 47.7%-60.9%, I2 = 99.6%; Figure 6). Sub-group analysis (Table 3) showed no statistically significant variation (P > .05) in the percentage of drugs prescribed from Nepal EML by the methodological quality of the study, data collection duration and prescription period. Compared to tertiary healthcare facilities, primary levels reported a significantly higher percentage of drugs prescribed from Nepal EML (P < .05). A significantly higher percentage of drugs were prescribed from Nepal EML in health posts and sub-health posts compared to other types of healthcare facilities (P < .0001). Although a gradual decrease in the percentage of drugs prescribed from Nepal EML had been reported over the recent years, the difference was not significant (P > .05). Subgroup analysis of the subset meta-analysis showed no significant difference compared to the original meta-analysis (Supplemental Figure E of S5 Appendix).
Discussion
This systematic review is probably the first to simmarize drug utilization pattern across different level of healthcare facilities in Nepal using WHO core prescribing indicators. Our findings suggest that patients were prescribed an average of three drugs on each visit to a healthcare facility in Nepal. Antibiotics were prescribed in more than two-thirds of the prescriptions, while one-fifth of prescriptions consisted of injectables preparation. About half of the drugs were prescribed from Nepal EML and WHO EML, but only one in five drugs were prescribed by their generic name.
Average Number of Drugs Prescribed Per Encounter
This review showed that the average number of drugs prescribed across HCF in Nepal was 2.9 drugs per prescription, which was higher than the WHO-recommended 2.0 drugs per prescription. 14 This finding was consistent with the findings from lower-middle-income countries (LMICs)2,19 and African countries. 20
Polypharmacy (use of 5 or more medicines) is one of the global issues and is increasing in South Asian countries, including Nepal.36 -38 This review identified several studies30,33,39 -51 reporting polypharmacy with an average of nearly 12 medicines prescribed per encounter. 44 Findings of this study align with previous studies reporting the presence of polypharmacy with potentially inappropriate medication prescribing, particularly in older adults in Nepal.52 -54 Implementing strategies to reduce polypharmacy and closely monitoring the average number of drugs per encounter may mitigate some of the challenges associated with polypharmacy, such as medication errors, medication non-compliance, risk of drug-drug interactions, drug-related hospital readmission, hospital stays, and healthcare costs.12,19,55,56 Possible strategies for improving prescribing and reducing polypharmacy include an educational intervention for prescribers, and developing and establishing guidelines for appropriate prescribing practices. Additionally, pharmacist-led and/or physician-led interventions such as assessment of drug regimens, medication reviews and involvement of patients in developing treatment plans and rational deprescribing efforts are crucial for improving the quality use of medicines and reducing polypharmacy.57,58
Percentage of Drugs Prescribed in Generic Name
The WHO strongly advocates for the generic prescribing of drugs, yet this study’s results revealed that only one-fifth of medicines in Nepal were prescribed by their generic name. This finding showed that Nepalese prescribers have a very low preference for generic prescribing as compared to other LMICs.2,19 and African countries 20 Our findings suggest that generic prescribing was higher in government-owned primary healthcare facilities compared to secondary and tertiary care hospitals. In the context of Nepal, the primary healthcare facilities only provide government-supplied limited free medications, while secondary and tertiary healthcare facilities provide a wider range of medications, subsequently, hospitals remain a suitable setting for pharmaceutical companies to promote their brands. 59 The WHO emphasises generic prescribing due to its numerous advantages, including ease of identification of drugs, facilitates communication of drug information, reducing medication errors 19 , and improving patient safety,60,61 reducing the medication prices and cost of treatment62,63 and lowering investment in the research and development process of generic medicines. 64 Despite these advantages of generic drug prescribing, our findings showed a declining trend in generic prescribing, indicating a growing preference for brand prescribing in Nepal. Branded-generic prescribing is highly prevalent in LMICs, including Nepal. This seems to be largely influenced by pharmaceutical promotions65 -67 and limited implementation of generic prescribing and generic substitution policies. Low generic prescribing is further contributed by the inadequate laboratory and regulatory system to ensure the therapeutic equivalence of available generic medicines to promote generic prescribing in Nepal.61,68 -71
Percentage of Encounters With an Antibiotic Prescribed
This review demonstrated that the overall percentage of encounters with an antibiotic prescribed across HCF in Nepal was higher (64.4%) than the WHO-recommended threshold value for antibiotics (<30%). 14 Similar studies reported lower use of antibiotics in African countries (46.8%), 20 in LMICs (50.0%), 2 and in South Asia (49.1%). 24 Variations in study sites, study settings and study time in these studies might need to be considered. In this study, most of the studies included in the initial meta-analysis specifically focused on antibiotics (36.8% of studies), which resulted in a higher pooled percentage of encounters with an antibiotic prescribed. However, subset analysis with studies not focusing on specific drugs or disease conditions showed a decreased antibiotic encounters (46.6%). Overall, this review indicates a probable misuse and overuse of antibiotics in all healthcare facilities, particularly in hospital IPD and secondary care centers.
Misuse and over-prescribing of antibiotics is a common global problem with potentially dire circumstances. 19 Importantly, poor systems to control overuse or inappropriate use of antibiotics have also been documented in many developing and South Asian countries including Nepal.72 -77 In the Global Burden of Disease region of South Asia, Nepal has the second highest age-standardized mortality among five countries, with 6400 direct deaths and additional associated 23 200 deaths due to antimicrobial resistance in 2019. 78 Irrational antibiotic use has predominantly contributed to increased antibiotic resistance79 -81 and contributed to increased resource utilization, higher costs of treatment, frequent use of broad-spectrum empiric therapy, and increased morbidity and mortality.82,83 Studies suggest that low health literacy levels and poor socio-economic status are responsible for limited public knowledge about antibiotics and improper use of antibiotics, thus causing irrational use of antibiotics.84 -86 Though data on prescriber-related contributing factors to the excessive use of antibiotics in Nepalese settings is lacking, there is strong evidence suggesting healthcare workers have good knowledge of the proper use of antibiotics. 87 Key challenges for rational antibiotic use in Nepal include scarcity of trained workers in rural areas of healthcare facilities and lack of antibiotic use and antibiotic stewardship guidelines. 81
This study provided a representation of antibiotic utilization in Nepal which highlighted the urgent need to review the prescribing practices and policies to ensure the appropriate use of antibiotics. We also found that the proportion of antibiotics prescribed in the 2020s remains similar to in the 1980s despite a decrease in the incidence of communicable infectious diseases.88,89 This data indicates that antibiotics are increasingly used in Nepal and might be one of the major contributors to antimicrobial resistance. 81
Various approaches to optimize antibiotic use have been proposed and studied with varied levels of effectiveness. 90 Of the interventions, prescription auditing, feedback and education programs for prescribers and effective implementation of antibiotic stewardship programs were found to be effective in improving antimicrobial use.91,92 Moreover, controlling over the counter sales of antibiotics in the community pharmacy, ensuring political commitment to meet the threat of antibiotic resistance, promoting the use of essential drug lists and regulatory and policy changes at the national level can also improve the proper use of antimicrobial agents.93 -95
Percentage of Encounter With an Injection Prescribed
We found that the overall percentage of encounters with an injection prescribed in Nepal was 22.9%, and this was almost consistent with the WHO standard <20.0%.14,20 Our finding was consistent with the findings from LMICs (21.7%), 2 and from the African countries (25.0%). 20
Wise use of injectable preparation and standardized injection practice is essential to avoid the associated risks, such as nerve damage or paralysis, blood-borne diseases, or infection caused by needle reuse or in the absence of sterilization techniques; and higher costs of injectable drugs and need for skilled human resources.96 -98 This review showed injectable preparation prescribing was high in the ED and IPD compared to the outpatients. This is possibly due to the treatment of more severe cases or patients in ED and IPD compared to those in outpatient departments. Notably, there has been a relative rise in injectable preparation prescriptions in Nepal from the 2000s to the 2020s, suggesting the need for monitoring and prescription auditing to prevent irrational use of injectable preparation.
Percentage of Drugs Prescribed From EML of WHO and Nepal
Essential medicine list refers to the list of medicines that have proven safe, efficacy, relevant and cost-effective to the public and community. 99 Prescribing from EML reduces the cost and improves the healthcare outcome.99,100 The overall percentage of drugs prescribed from the EML across HCF in Nepal was very low (53.0% from WHO-EML and 54.4% from Nepal-EML) as compared to the WHO-recommended optimal value of 100.0%. 20 Prescribing from EML of WHO and Nepal was lower compared to the pooled data reported from the WHO African countries (88.0%), 20 and LMICs (81.7%). 2 This study showed that prescribing from EML was significantly associated with the type (higher in health post, sub-health post, primary healthcare center—all are government-owned), level (higher in primary-level), and administration (higher in public) of healthcare facilities. The government of Nepal provides free essential medicine in the primary level of healthcare centers—health post, sub-health post and primary healthcare center. However, private hospitals and secondary or tertiary care level centers have a higher number of prescribers and have dedicated pharmacy outlet that provides a larger extent of medication where non-EML medicines are also required to be purchased and prescribed for the patient who comes to these hospitals. The lower use of EML in private and higher-level (secondary to tertiary) healthcare centers in Nepal reflects the lower promotion of EML in these facilities.
The probable reasons for less use of EML might be due to inadequate utilization and monitoring of treatment guidelines, wider availability of non-EML over essential medications in private pharmacies, lack of awareness about EML’s importance, promotion of non-EML medications, and lower trust in marketed EML quality.101 -105 Similarly, the low prescribing of EML in government-owned primary healthcare facilities could be the consequence of the frequent unavailability of essential medicines due to poor logistic management.106,107 Furthermore, the possible inferior qualities of available essential medicines in government healthcare centers may also reduce the likelihood of EML promotion.108,109 There might also be a need to revisit the EML for its applicability and adequate utilization in the treatment of diseases based on currently available evidence.
Strength and Limitation
This is the first comprehensive review encompassing all the studies reporting at least one WHO core prescribing indicator on prescribing practice in Nepal. It provided a picture of medication utilization in Nepal with a detailed pattern based on types, locations, administration, and levels of healthcare facilities. This review has certain limitations too that need to be taken into consideration in interpreting the findings. Meta-analysis of the average number of drugs prescribed per encounter could not be done due to a lack of sufficient data in the included studies. The sub-group analysis of pooled data of indicators based on the data collection period should be carefully interpreted, as these do not reflect the year of publication. The WHO prescribing indicators record exactly what is prescribed, dispensed and communicated to patients, it does not provide the reason for the prescription. 11
Conclusions
This study is the first attempt to summarize drug use patterns in Nepalese healthcare facilities. This review highlights that drug utilization in Nepal based on the WHO core prescribing indicator is generally unsatisfactory and requires improvement in the prescribing practices. Overuse of antibiotics, under-prescribing of drugs from EML and minimal generic prescribing were the major concerns. Variations in prescribing indicators according to healthcare facilities’ location and type suggest a more targeted intervention, such as education intervention for prescribers, effective implementation of generic prescribing policy, drug utilization review and monitoring, and routine prescription auditing and intervention could be beneficial for improving rational prescribing, reducing medication costs and improving healthcare outcomes in Nepal.
Supplemental Material
sj-docx-7-inq-10.1177_00469580251347136 – Supplemental material for A Systematic Review on Evaluation of WHO Core Prescribing Indicators Across Healthcare Facilities in Low Resource Asian Setting: A Case of Nepal
Supplemental material, sj-docx-7-inq-10.1177_00469580251347136 for A Systematic Review on Evaluation of WHO Core Prescribing Indicators Across Healthcare Facilities in Low Resource Asian Setting: A Case of Nepal by Rohit Agrawal, Rajeev Shrestha, Ramesh Sharma Poudel and Shakti Shrestha in INQUIRY: The Journal of Health Care Organization, Provision, and Financing
Supplemental Material
sj-pdf-1-inq-10.1177_00469580251347136 – Supplemental material for A Systematic Review on Evaluation of WHO Core Prescribing Indicators Across Healthcare Facilities in Low Resource Asian Setting: A Case of Nepal
Supplemental material, sj-pdf-1-inq-10.1177_00469580251347136 for A Systematic Review on Evaluation of WHO Core Prescribing Indicators Across Healthcare Facilities in Low Resource Asian Setting: A Case of Nepal by Rohit Agrawal, Rajeev Shrestha, Ramesh Sharma Poudel and Shakti Shrestha in INQUIRY: The Journal of Health Care Organization, Provision, and Financing
Supplemental Material
sj-pdf-2-inq-10.1177_00469580251347136 – Supplemental material for A Systematic Review on Evaluation of WHO Core Prescribing Indicators Across Healthcare Facilities in Low Resource Asian Setting: A Case of Nepal
Supplemental material, sj-pdf-2-inq-10.1177_00469580251347136 for A Systematic Review on Evaluation of WHO Core Prescribing Indicators Across Healthcare Facilities in Low Resource Asian Setting: A Case of Nepal by Rohit Agrawal, Rajeev Shrestha, Ramesh Sharma Poudel and Shakti Shrestha in INQUIRY: The Journal of Health Care Organization, Provision, and Financing
Supplemental Material
sj-pdf-3-inq-10.1177_00469580251347136 – Supplemental material for A Systematic Review on Evaluation of WHO Core Prescribing Indicators Across Healthcare Facilities in Low Resource Asian Setting: A Case of Nepal
Supplemental material, sj-pdf-3-inq-10.1177_00469580251347136 for A Systematic Review on Evaluation of WHO Core Prescribing Indicators Across Healthcare Facilities in Low Resource Asian Setting: A Case of Nepal by Rohit Agrawal, Rajeev Shrestha, Ramesh Sharma Poudel and Shakti Shrestha in INQUIRY: The Journal of Health Care Organization, Provision, and Financing
Supplemental Material
sj-pdf-4-inq-10.1177_00469580251347136 – Supplemental material for A Systematic Review on Evaluation of WHO Core Prescribing Indicators Across Healthcare Facilities in Low Resource Asian Setting: A Case of Nepal
Supplemental material, sj-pdf-4-inq-10.1177_00469580251347136 for A Systematic Review on Evaluation of WHO Core Prescribing Indicators Across Healthcare Facilities in Low Resource Asian Setting: A Case of Nepal by Rohit Agrawal, Rajeev Shrestha, Ramesh Sharma Poudel and Shakti Shrestha in INQUIRY: The Journal of Health Care Organization, Provision, and Financing
Supplemental Material
sj-pdf-5-inq-10.1177_00469580251347136 – Supplemental material for A Systematic Review on Evaluation of WHO Core Prescribing Indicators Across Healthcare Facilities in Low Resource Asian Setting: A Case of Nepal
Supplemental material, sj-pdf-5-inq-10.1177_00469580251347136 for A Systematic Review on Evaluation of WHO Core Prescribing Indicators Across Healthcare Facilities in Low Resource Asian Setting: A Case of Nepal by Rohit Agrawal, Rajeev Shrestha, Ramesh Sharma Poudel and Shakti Shrestha in INQUIRY: The Journal of Health Care Organization, Provision, and Financing
Supplemental Material
sj-xlsx-6-inq-10.1177_00469580251347136 – Supplemental material for A Systematic Review on Evaluation of WHO Core Prescribing Indicators Across Healthcare Facilities in Low Resource Asian Setting: A Case of Nepal
Supplemental material, sj-xlsx-6-inq-10.1177_00469580251347136 for A Systematic Review on Evaluation of WHO Core Prescribing Indicators Across Healthcare Facilities in Low Resource Asian Setting: A Case of Nepal by Rohit Agrawal, Rajeev Shrestha, Ramesh Sharma Poudel and Shakti Shrestha in INQUIRY: The Journal of Health Care Organization, Provision, and Financing
Footnotes
Acknowledgements
We appreciate the efforts of all the researchers whose studies were included in this systematic review and meta-analysis.
Author Contributions
Study concept and design—RA & SS. Screening and quality assessment—RA, RSP, & SS. Data extraction and analysis—RA & SS. Interpretation of data for the work—RA, RS, RSP, & SS. Drafting the manuscript—RA & RS. Critical revision of the manuscript for important intellectual content—RA, RS, RSP, & SS. Overall project supervision—SS. All authors gave final approval of the version to be published and agreed to be accountable for all aspects of the work ensuring the integrity and accuracy.
Funding
The author(s) received no financial support for the research, authorship, and/or publication of this article.
Declaration of Conflicting Interests
The author(s) declared no potential conflicts of interest with respect to the research, authorship, and/or publication of this article.
Data Availability Statement
All data relevant to the study are included in the article or uploaded as Supplementary Document.
Supplemental Material
Supplemental material for this article is available online.
References
Supplementary Material
Please find the following supplemental material available below.
For Open Access articles published under a Creative Commons License, all supplemental material carries the same license as the article it is associated with.
For non-Open Access articles published, all supplemental material carries a non-exclusive license, and permission requests for re-use of supplemental material or any part of supplemental material shall be sent directly to the copyright owner as specified in the copyright notice associated with the article.