
Abstract
To analyze, understand, and measure the COVID-19 vaccination outlook in a developing country as Nigeria; and the non-clinical analysis, diagnosis, treatment and management of COVID-19, and other Viral Diseases, using Data/Machine Learning (ML)/Artificial Intelligence (AI), Analytical Tools, and Methodologies. Using current and historical data from validated open source data stores, analysis was carried out on COVID-19 vaccination and related economic, demographic, and geo-climatic data for a developing country, Nigeria and selected countries from all continents of the world. The methodical and data-driven analyses were carried out using the following Data/Artificial Intelligence (AI) methodologies and algorithms: Excel Data Analytics, Multivariate Linear Regression Analysis method in Machine Learning (ML) Engineering, Symptom Mapping Analysis, Gray System Analysis. The COVID-19 vaccinations expectedly does reduce the number of active COVID cases and the amount or number of vaccinations for a developing country as Nigeria is affected by a good number of economic, demographic, and geo-climatic factors; and so COVID-19 vaccinations strategies must be unique to a country and categories of countries and take into account influencing factors not only limited to number of active COVID cases. The strategies (including vaccinations roll-out) to eliminate COVID-19 can be better understood and managed for increased productivity and faster success rate in the fight against COVID-19. Medical practitioners can provide even more efficient diagnosis and treatment of viral diseases; and also patients can carry out personalized cost effective diagnosis and treatment/management of viral diseases, with also the advises of medical practitioners.
Keywords
Questions and Answers
1. What do we already know about this topic?
We already know that vaccinations are the currently the most effective way to combat COVID-19.
2. How does your research contribute to the field?
Usage of data analysis, analytics, symptom mapping technique, and machine learning/artificial intelligence concepts and algorithms to diagnose and recommend treatment for viral diseases and also predictively manage COVID-19 vaccinations roll-out in a developing country as Nigeria.
3. What are your research’s implications toward theory, practice, or policy?
It supports better precision in medical practice, broader theory in medical treatment and aids medical practitioners to carry out more efficient diagnosis and treatment of viral diseases with the aid of data driven technologies.
Introduction
The authentic documentation of viral diseases and pandemics has been on from even before the common era (BCE). Take for example the great plague of Athens that occurred around 430 BCE; so such problems are not new. It therefore as always must require consideration of the complexities of planning for, responding to, and mitigating a pandemic global shock and reveal extensive interdependencies even among countries, including sustaining and protecting national sovereignty, and enabling the continuous growth of individual households, economies, and commercial activities needed for society to be productive. 1
Other documented pandemics have been caused by typhus, measles, smallpox, tuberculosis, malaria and yellow fever, and systems must also be put in place to guard against potential pandemics from viral infections to even the dangerous threat of synthetic bioterrorist agents. Therefore, strategies, technologies, equipments, and personnel must continually be improved and optimized to proactively and effectively combat these potential diseases and pandemics successfully and ensure that humanity continues to thrive. 1 The spread of the corona virus that caused the severe acute respiratory syndrome (SARS) was also declared a pandemic and the global response to it must continually be effective and efficient and can teach a number of lessons about disease reporting, the international response and economic consequences of a new and unexpected communicable disease. 1 For our generation, the greatest global test of healthcare leadership is the COVID-19, and few jurisdictions were prepared to effectively manage this crisis; therefore, worldwide interdependency has been highlighted and necessitated by COVID-19, and as also stated by Dr Tedros Adhanom Ghebreyesus, the Director-General of the World Health Organization (WHO), “The greatest threat we face now is not the virus itself, it’s the lack of global solidarity and global leadership.” 2
Therefore, the increasing challenge of modern medicine to continually improve to meet up with the evolving viruses, viral diseases, and other forms of human diseases; requires urgent and a thorough approach for the good of humanity. For a data-driven world of ours, innovative measures to analyze and recommend effective and efficient systems, approaches, techniques, and methods to combat viral diseases in a cost providing cost effective, efficient, intelligent, and safer manner becomes highly important, for a more improved health system for countries, especially developing countries, that are limited in terms of adequate resources. Therefore, innovative issues and measures must be applied in vaccination production and distributions, which have been identified as a most potent method to curb viral diseases and of current interest, the corona virus. With the distribution of vaccines ongoing and with its accompanying challenges; It is therefore also pertinent to highlight the need for further optimization of vaccines distribution especially to poorer regions of the world and priority population; in addition to advancements in medical and healthcare practices using modern tools in data, AI, and associated technologies to provide efficient alternatives and complementary diagnostics, treatments (including fruits as/natural medicine 3 ), and management procedures to advance the fight against the pandemic and ensure herd immunity is reached quickly, for the greater good of humanity. This will ensure a proactive evolving healthcare system excellently positioned for the present and the future.
The aim of this research work is to measure, investigate, and analyze factors and data driven techniques that can aid in the efficient diagnosis, and treatment of viral diseases; and also how predictive analytical systems can be used in the management of vaccination against COVID-19; thereby aiding medical personnel, processes, policy decision makers to optimize the healthcare systems for both urban and rural communities; with the use of modern analytical tools.
Literature
Emergence of COVID-19
The corona virus or rather COVID-19 virus outbreak was initiated from the Hunan seafood market in Wuhan city of China and spread rapidly. Live animals are usually sold at this market and there are various animal types, including bats, frogs, snakes, etc. The National Health Commission of China released some extra and important details about the virus in January 2020; with initial suggestions that it could be viral pneumonia. Specialized sequence-based analysis confirmed that it is the coronavirus (a novel type) and by investigating further, it was then known that there could be human to human transmission of the virus.4-8
There are recorded more than 10 million cases with infections of the SARS-CoV-2 in more than 200 countries and above 500 000 deaths as on July 1, 2020 (Figure 1).

Early global coronavirus disease chart 2019 (COVID-19) (Wiersinga et al 9 ).
COVID-19 and Nigeria
After South Africa, Nigeria is the second most-affected African country in terms of recorded confirmed COVID-19 cases and death as of 7 June 2020. The CI of COVID-19 was lower in Nigeria than some African countries and well higher in the United States and many European countries.10-13
There was substantial variability in COVID-19 incidence among the states in Nigeria. Although most research works, surveys and analysis on the disease has been on adults, there has not been so much known about the effects on the pediatric population, particularly in most parts of sub-Saharan Africa. With more study of COVID-19 in children within Lagos state (which has the highest amount of cases in the country); cases of human spread of the virus amongst children similar to the cases reported by Dong et al in China, has been reported and confirmed.11,14-17
The huge difference of the severity of the disease between Nigeria and other parts of the world has been of interest and discussed with several probable reasons given for such situation, reasons cutting across from health to socioeconomic, geographical, and heritage.18-20
COVID-19 Vaccination Drive
It is widely agreed and accepted that COVID-19 vaccines are the best way to prevent COVID-19, just like other major viruses, even as development of various treatment methods are still ongoing. Being a preventable viral disease, the control and transmission of COVID-19 as an infection is already clear around the world. Most countries however, are implementing various control and eradication measures, thereby creating difficulties in identifying the benefit of these varying measures.
A key priority therefore globally, will be to identify, analyze, and confirm the combined measures; though in varying geographies, politics, economies; that can effectively and efficiently control the infection and minimize societal and economic disruptions.21-26
With the start up and continuous distribution of the now available COVID-19 vaccines, this offers great hope going forward toward the eradication of the virus. Therefore, it is pertinent to analyze and forecast how quickly vaccines can be distributed across the world and as needed to ensure that the virus is eliminated effectively and efficiently; since we are dealing with a global pandemic. Table 1 shows COVID-19 and vaccinations related geographical and economic data of some selected countries across continents of the world.
COVID-19 Vaccination and Demographic Data of Selected Countries (2022).

Source. Live Web portals: date—24 and 25 January, 2022.
Conceptual Model for the Prediction of COVID-19 Vaccinations in Nigeria
As a developing country, it is understood that the number of vaccinations delivered is less than that of developed countries due to a good number of factors. How rich a country is (GDP per capita) influences the rate of vaccinations within a country, but like most things in real life; there could be other factors unique to a country that would also influence the number of vaccinations achieved. Therefore, predicting or being able to predict the number or amount of vaccinations that can be delivered is a key step toward the effective and efficient strategy needed to combat the COVID-19 virus, especially for a developing country with limitations in funds, infrastructure, and sometimes personnel. For a country as Nigeria, to obtain a more robust, precise prediction, our predictive model incorporates independent variables or factors which can influence the dependent variable which is the number of vaccinations; these independent variables are: Total COVID-19 cases (per 1000) (

Conceptual model of independent variables affecting number of vaccinations in Nigeria.
Human Viral Disease
Human diseases may be classified into 2 broad categories, which are “Congenital diseases” (Present since birth) and “Acquired diseases” (Develop after birth). Viral disease fall under acquired diseases and are classified as communicable diseases, which are diseases that are spread from one diseased person to another through contaminated food, water or contact or through insecticides, and animals. These are caused by different causative agents (pathogens). 27
A virus is the main causative agent of viral diseases and it is a microorganism only capable of reproduction within living cells.
The link between environmental quality and health is critical. Over 10% of all preventable ill-health today is said to be due to poor environmental standards—bad housing, overcrowding, indoor air pollution, poor sanitation, and unsafe water. Globally, it is said that 6 infectious diseases, including pneumonia and measles, cause over 90% of deaths due to infection. At least half, in some cases nearly all, of the deaths could have been avoided with affordable interventions such as childhood and adult vaccination and the adoption of the integrated management of childhood illnesses strategy (IMCI). Given that seriously ill children often suffer from more than 1 condition at the same time, the IMCI approach is to offer combined therapy. This includes oral rehydration solutions to treat diarrhea, antibiotics to treat pneumonia, vitamin and mineral supplements, immunization, breastfeeding, and improved general nutrition (Infections and infectious diseases: A manual for nurses and midwives in the WHO European Region, WHO; 2001).
Hence, an improved data driven, intelligent analysis, diagnosis and cure of viral diseases is pertinent, as such diseases are very common in developing countries and also globally. Such exploratory and exhaustive symptoms of viral diseases presents a template of datasets that can be referenced in this research work for the intelligent and efficient diagnosis of the associated viral diseases of such symptoms. Therefore, these symptoms datasets are at the “heart” of the symptom mapping viral disease diagnostics approach investigated and described in the research work. For this intelligent data driven approach, this list of viral diseases symptoms are a crucial dataset to intelligently analyze, map and describe specific viral diseases for a more efficient, cost effective and precise medical approach, that can also be very effective for rural and remote needs.
Methodology
Our methods for this research activity revolved mainly around the various data analysis, data analytics, data science, and machine learning processes to carry out the necessary studies and obtain results. Furthermore, for such various methodical analysis; data acquisition, data cleaning, data wrangling are among key preliminary steps to ensure that the required data is importantly used for such analysis.
Data Collection and Preparation
At this point, we collect data across several themes in relation to COVID-19, other viral diseases and the topic areas for the processes of analysis (Figure 3). The data collection and preparation process for this non-clinical analysis follows the important steps:
Step 1: Acquire data from validated open access data stores and live data web portals
Step 2: Clean the data, label it appropriately, wrangle it, and make it fit for purpose
Step 3: Store the data and partition them accordingly for use
Step 4: Feed the data into the particular analysis tool, model, and process as required.
Step 5: Prepare and specify how results will be reported.

Data mining sources and analysis process flowchart.
Statistical Correlations Analysis
Are statistical assumptions that will first be examined to investigate statistical relationships between variables and how these variables influence and affect other variables.
Pearson correlation
A Pearson product-moment r correlation is conducted to assess the relationship between variable 1 and variable 2.
Pearson
Simple Moving Average (SMA) Time Series Forecast
Time series is a collection or sequence of observations recorded at regular time intervals, which may have hourly, daily, weekly, monthly, or even annual frequency of observations. Time series analysis is about understanding aspects of the nature of the series, so as to create meaningful and accurate forecasts with the information from the series. A moving average method is used to estimate the trend-cycle, as a key step in the decomposition process.
Assuming an additive decomposition, then we can write

Where: yt is the data, St is the seasonal component, Tt is the trend-cycle component, and Rt is the remainder component, all at period t.
Also, a moving average of order m, can be defined as:

Where: m = 2k + 1, is the estimate of the trend-cycle at time t; and is obtained averaging the time series values within k periods of time t. Therefore, the average eliminates some of the randomness in the data, leaving a smooth trend-cycle component. This component can be called an m-MA, meaning a moving average of the order m.
Multivariate Linear Regression Model
The multivariate machine learning (ML) model using Python programming language was incorporated for the dependent variable to be determined using the independent variables. The Regression model is chosen, as it is evident that the factors or variables changes linearly with time change.
A multivariate ML regression model is defined by the equation:

Where: Y is the dependent variable values matrix; m1. . .m N are the coefficients (weightings) of the independent variables values (X matrices).
Symptom Mapping Analysis
For this approach to non-clinical medical diagnosis, treatment, and management; the focus is to be able to provide adequate diagnosis, treatment, and management of viral illnesses in a cost effective and timely manner. The analytical background for this is described:
By applying the set theory of pure mathematics:

Where:


Where: Viral/virus symptoms or symptoms of all viruses in viral symptoms subsets X and Y are:
Therefore, symptoms are then matched to specify particular viral disease(s)

In relation to the symptoms, the viral diseases for each subset of symptoms are thus:

Where: Viral diseases of viral symptom subsets X, Y, . . . and N are
Thus, for example, the treatments of the viral diseases can be defined as follows:

Where: Known and current treatment subsets for the earlier defined viral diseases are
Furthermore;

Where:
Therefore, the optimal treatment

Also, for
Where:
For the range of the number of minimal treatment(s) for the optimal treatment of a viral disease:

Where:
Also:
Gray System Analysis
A gray system means that a system in which part of information is known and part of information is unknown. For real life scenarios where the meanings of the criteria are different and there exists much difference among the values of variables/or factors observed; the fixed weight clustering method is applied in such a situation (Figure 4).
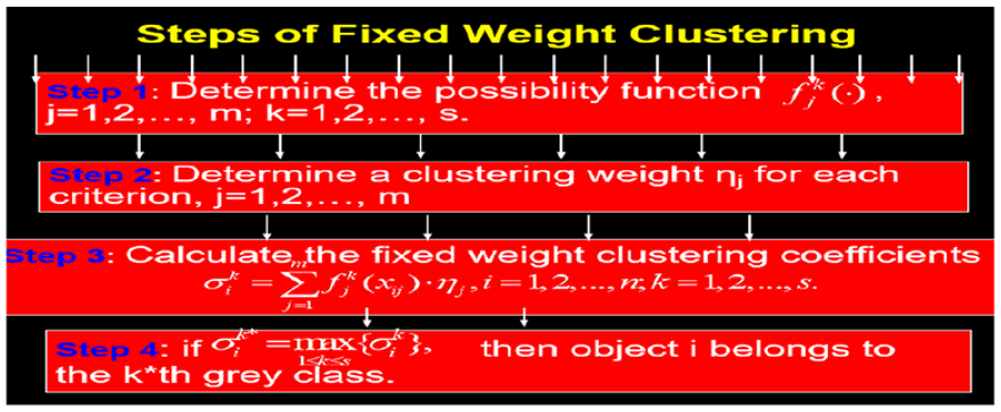
Fixed weight clustering algorithm of gray system analysis.
Results
Correlation Test
Pearson correlation tests
As shown by the obtained and analyzed figures using the R statistical software; the Pearson coefficient is of the range −1.0 to +1.0; and so the obtained values shows that there is a moderate to strong associations in the positive and negative directions between the independent variables. The highest coefficient value in the positive direction is between VAR1 and VAR3, indicating a strong positive correlation between VAR1 and VAR3. Also, the minimum coefficient value in the negative direction is between VAR3 and VAR4, indicating a very strong negative correlation between the variables VAR3 and VAR4. Furthermore, there is a reasonable negative correlation between VAR2 and VAR3 as expected, since they are related in derivations and in the real world. These correlations values also confirm the quantitative nature of the datasets in addition to their qualitative properties; and also indicate that there is a linear relationship between the independent variables as obtained and analyzed.
From the obtained data and analyzed results in Table 3; the relationships between the variables are described using the Pearson test. For the association value between VAR2 and VAR3 indicates a negative association/relationship between Population amount and the GDP per capita, which of course is expected, since the GDP per capita obtained is a derivative of the Population of a Country. Furthermore, the association value between VAR1 and VAR4 also indicates a significant negative association/relationship between the number of active COVID cases and the temperature of a region/country; which implies that COVID cases tends to increase in areas or seasons of lower temperature and decrease in regions or seasons of higher temperature; thereby adding more credence to the argument of the relationship between COVID cases and temperature. Also, the association value between VAR1 and VAR5 also indicates a slight positive association/relationship between the number of active COVID cases and the humidity of a region/country; which implies that COVID cases tends to slightly increase in areas or seasons of higher humidity and decrease in regions or seasons of lower humidity; thereby supporting the suspicion that COVID cases are somewhat related to the humidity of a region or country.
Correlation Statistics of Independent Variables (Pearson Correlation).
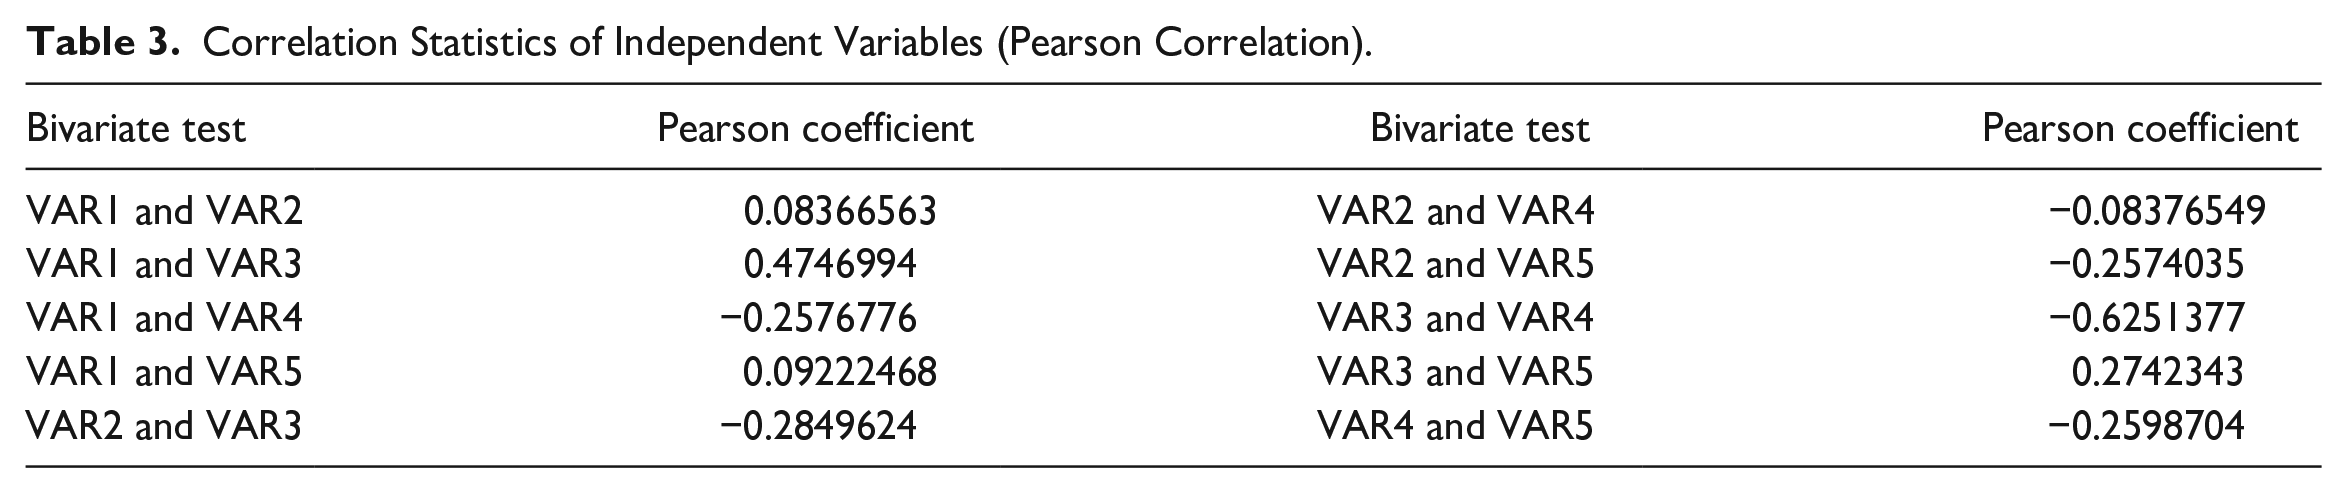
Additionally, the coefficient values between independent variables obtained as an indication of the relationships between the variables are classified as either statistically significant or not statistically significant, as indicated by the coefficient values within the range of −1 to +1; with the values closer to either +1 or −1 as being more strongly correlated or statistically significant (positively or negatively). Therefore, the result answers the question, that indeed, there is a significant statistical relationship between some of the independent variables. This further suggests that certain independent variables affecting the amount of vaccinations are correlated and influence each other, and further implies that analyses, strategies, management processes and systems for effective vaccination creation, distribution, and management, must take into account influences between variables as it affects the predicted amount vaccinations needed in a region or country. However, there is no significant statistical relationship between all the independent variables.
COVID-19 and Economy of Countries
As also highlighted in the literature, COVID-19 metric and cases vary across countries having different economic, geographical, climatic, and health priorities; which of course should be considered when analyzing and understanding the best ways to respond to, manage, and treat COVID-19 and other viral diseases effectively.
The chart in Figure 5, shows the COVID-19 (rate of vaccinations, active COVID-19 cases) data, population and economic (GDP) data of about 17 countries selected across the continents of the world (Table 1). From the chart, we further confirm that the richer countries with higher GDP per capita, have greater rates of vaccinations, which is expected as these vaccines are mostly produced in richer countries and are expensive for developing or underdeveloped countries. Also, lower income persons are shown to be more vulnerable to COVID-19 deaths, due to inability to procure adequate vaccinations and also a disproportionate percentage of COVID-19 hospitalizations and deaths occur in lower-income and minority populations. 9 Additionally, the rate of vaccination for developing/underdeveloped countries was shown to be less than 10% and that of developed countries being at over 60% to 70% on the average, indicating a large discrepancy of vaccination capabilitites, which is inimical to the fight against COVID-19, which is a global pandemic.

Chart of COVID-19 and economic data of selected countries.
Furthermore, the plot also confirms that COVID-19 cases are not uniformly spread across countries and do not follow a linear relationship with population size or growth; as some more populated countries are shown to even have lesser COVID-19 cases and vice versa (Figure 5). This therefore, indicates that some other factors could affect the surge in COVID-19 cases, which is independent of population size.
COVID-19 and Climate of Countries
As explained earlier in the literature, COVID-19 cases have been shown to be affected by climatic conditions, and this also contributes to the varying spread and symptoms presence across regions, continents, and countries. The analysis with respect to COVID-19 and how it is affected by how warm, cold, or humid a location is or can be, is also of importance, as this can influence how effective vaccination strategies and management of such virus will be.
The chart in Figure 6, shows the COVID-19 (rate of vaccinations, active COVID-19 cases) data, average annual temperature, and humidity data of 17 countries selected across the continents of the world (Table 1). From the chart (Figure 6), we further confirm that countries with higher average temperature, tend to have lesser COVID-19 cases, and for countries with lesser average temperature, there tends to be increase in COVID-19 cases; except where they are balanced by a greater percentage of vaccination rates, which of course leads to a reduction in active COVID-19 cases. Additionally, the rate of active COVID-19 cases increases by a minimum of 20% for every average of 10°C or more drop in temperature, inferring the prevalence of COVID-19 in more regions with lower temperature conditions. Also, such rate increase in active COVID-19 cases across the countries researched is shown to be further visible by an average of 5% to 10% following increases in humidity of about 10% and above. Furthermore, for humidity, there is no direct relationship with COVID-19 cases, but what is shown is that COVID-19 cases are active in the presence of medium to higher humidity levels. In general, research has shown that geographic regions and weather variables could influence the investigated research outcomes between weather and COVID-19. 29

Chart of COVID-19 data and climatic conditions of selected countries.
Time Series Forecast of COVID-19 Vaccinations in Nigeria
From the data obtained for vaccines distribution for a developing country as Nigeria, a time series forecast is obtained to show daily COVID-19 vaccinations from 5th of March 2021 to 22nd of January 2022, to understand and analyze latest COVID-19 vaccinations daily figures.
The simple moving average method (SMA) is used for the forecast and values at (per 1000) are analyzed in Figure 7 for also the train/actual historical data. The accuracy of the forecast can be seen and both trends indicate a peak point of vaccinations between September to October 2021 (Figure 7). The total number of COVID-19 vaccinations during this period of analysis is deduced at about 8.86 million vaccinations; which is understandably low compared with developed countries of greater GDP per capita and which also have a larger COVID-19 cases number; but it is a reasonable progress considering the start of the vaccines campaign began just in 2021 for Nigeria. Additionally, the forecast which declined continuously within a month toward the end of the year 2021; begin to show signs of picking up at the beginning of 2022 with a monthly increasing rate, which curiously indicates and infers that an increase in vaccination drive is expected within Nigeria, as a means to combat COVID-19 globally. Also, the well fitting time series plot, indicates that the daily COVID-19 number of vaccinations can also be predicted and continuously monitored for a data-driven analysis as it relates to combating COVID-19 and ensuring there are adequate amount of vaccinations, as an effective and efficient way of eliminating the virus, both within the country and globally.

Time series forecast of daily COVID-19 vaccinations in Nigeria (from 05/03/2021 to 22/01/2022).
Prediction of COVID-19 Vaccinations Considering Various Independent Factors
As stated earlier in the previous section, a multivariate linear regression model with independent variables (Total COVID-19 cases, Population, GDP per capita [USD], Average annual temperature [°C], and Average annual humidity [%]) (Table 1) representing influencing factors, were used to predict the number of vaccinations in the study case country Nigeria; where also the Ordinary Least Square Regression (OLS) model was used for the analysis and the plot below obtained.
As shown on the plot (Figure 8), we see the scatter plot attaining a linear predictive outcome confirming the acceptable accuracy of our model and confirming a linear predictive relationship between the variables of influential factors that are independent and the dependent variable, which is the predicted number of vaccinations needed. The resultant plot in Figure 8 indicates the prediction of number of vaccinations in Nigeria, for a specific time period form independent variables (

Predicted number of COVID-19 vaccinations in Nigeria using a Multivariate Regression model.
Results of Multivariate Regression Analysis Model for Predicted Number of COVID-19 Vaccinations in Nigeria.

Note. Durbin-Watson: 1.959; Skew: 0.497; Kurtosis: 3.316. 97.5% confidence interval of parameters/coefficients (0.975).
As shown in Table 4; from the P values, the independent variables are all statistically significant (ie, can be included in the model); as all the P-values are below 0.05, and which means in this case the null hypothesis can be rejected. In this case, these values further confirm that the set of independent variables do indeed influence or affect the number of vaccinations in a country (Table 4). For the Durbin-Watson value of 1.969, this is almost at the ideal value of 2; and indicates that there is no autocorrelation between the independent variables. Furthermore, for a further analysis, such independent variables which have a greater influence on the dependent variable can be separated from other variable and another model can be created to analyses how much such variables affect the dependent variable. All these aid adequate and effective management of water resources as some variables can be effectively tuned or adjusted while keeping other variable(s) constant and thereby greatly influencing the amount of vaccinations in a region/country greatly in a cost effective manner without spending so much on adjusting all variables per time or in acquiring every sample variables.
Viral Diseases Symptoms Mapping Chart
As a first step in the non-clinical symptom mapping management and treatment procedure and system, a simple symptom mapping chart analytically/intelligently identifying and matching each virus symptom(s) and the corresponding associated viral disease(s) (including COVID-19) uniquely identified, is shown.
For the chart in Figure 9, it is for common viral diseases in Lagos, Nigeria and their associated symptoms; but here the symptoms are that of COVID-19 and the matching chart confirms it as the identified viral disease. The chart (Figure 9) shows how analytically the symptom(s) across different viral diseases (including COVID-19) are aligned or rather matched with the respective unique viral diseases. Additionally, the unit magnitude (ie, 1) of the symptom mapping chart, indicates the uniqueness of each symptom as it relates to the specific viral diseases. For the magnitude of 3 as shown, this is due to the summation of the common symptom for Hepatitis A, B, and C respectively. Furthermore, the intensity/compactness of aggregation or as shown, the amount of most compacted colored distribution of the unique symptoms indicates the most likely viral disease being investigated or tested (ie, in this case COVID-19); while the least compacted distribution, indicates the least likely viral disease. This intelligent, analytical and data driven distribution is as a result of the symptom mapping algorithm.

Symptom mapping chart of viral diseases of COVID-19 symptoms: Lagos, Nigeria.
Viral Disease and Treatment
Following up from the symptom mapping chart (Figure 9), the next step in this unique analytical, intelligently driven non-clinical viral disease management system approach, is the matrix of mapping viral diseases with the minimal number of treatments possible.
From the above table (Table 5), and using the
Viral Diseases and Corresponding Matched Optimal Treatments.
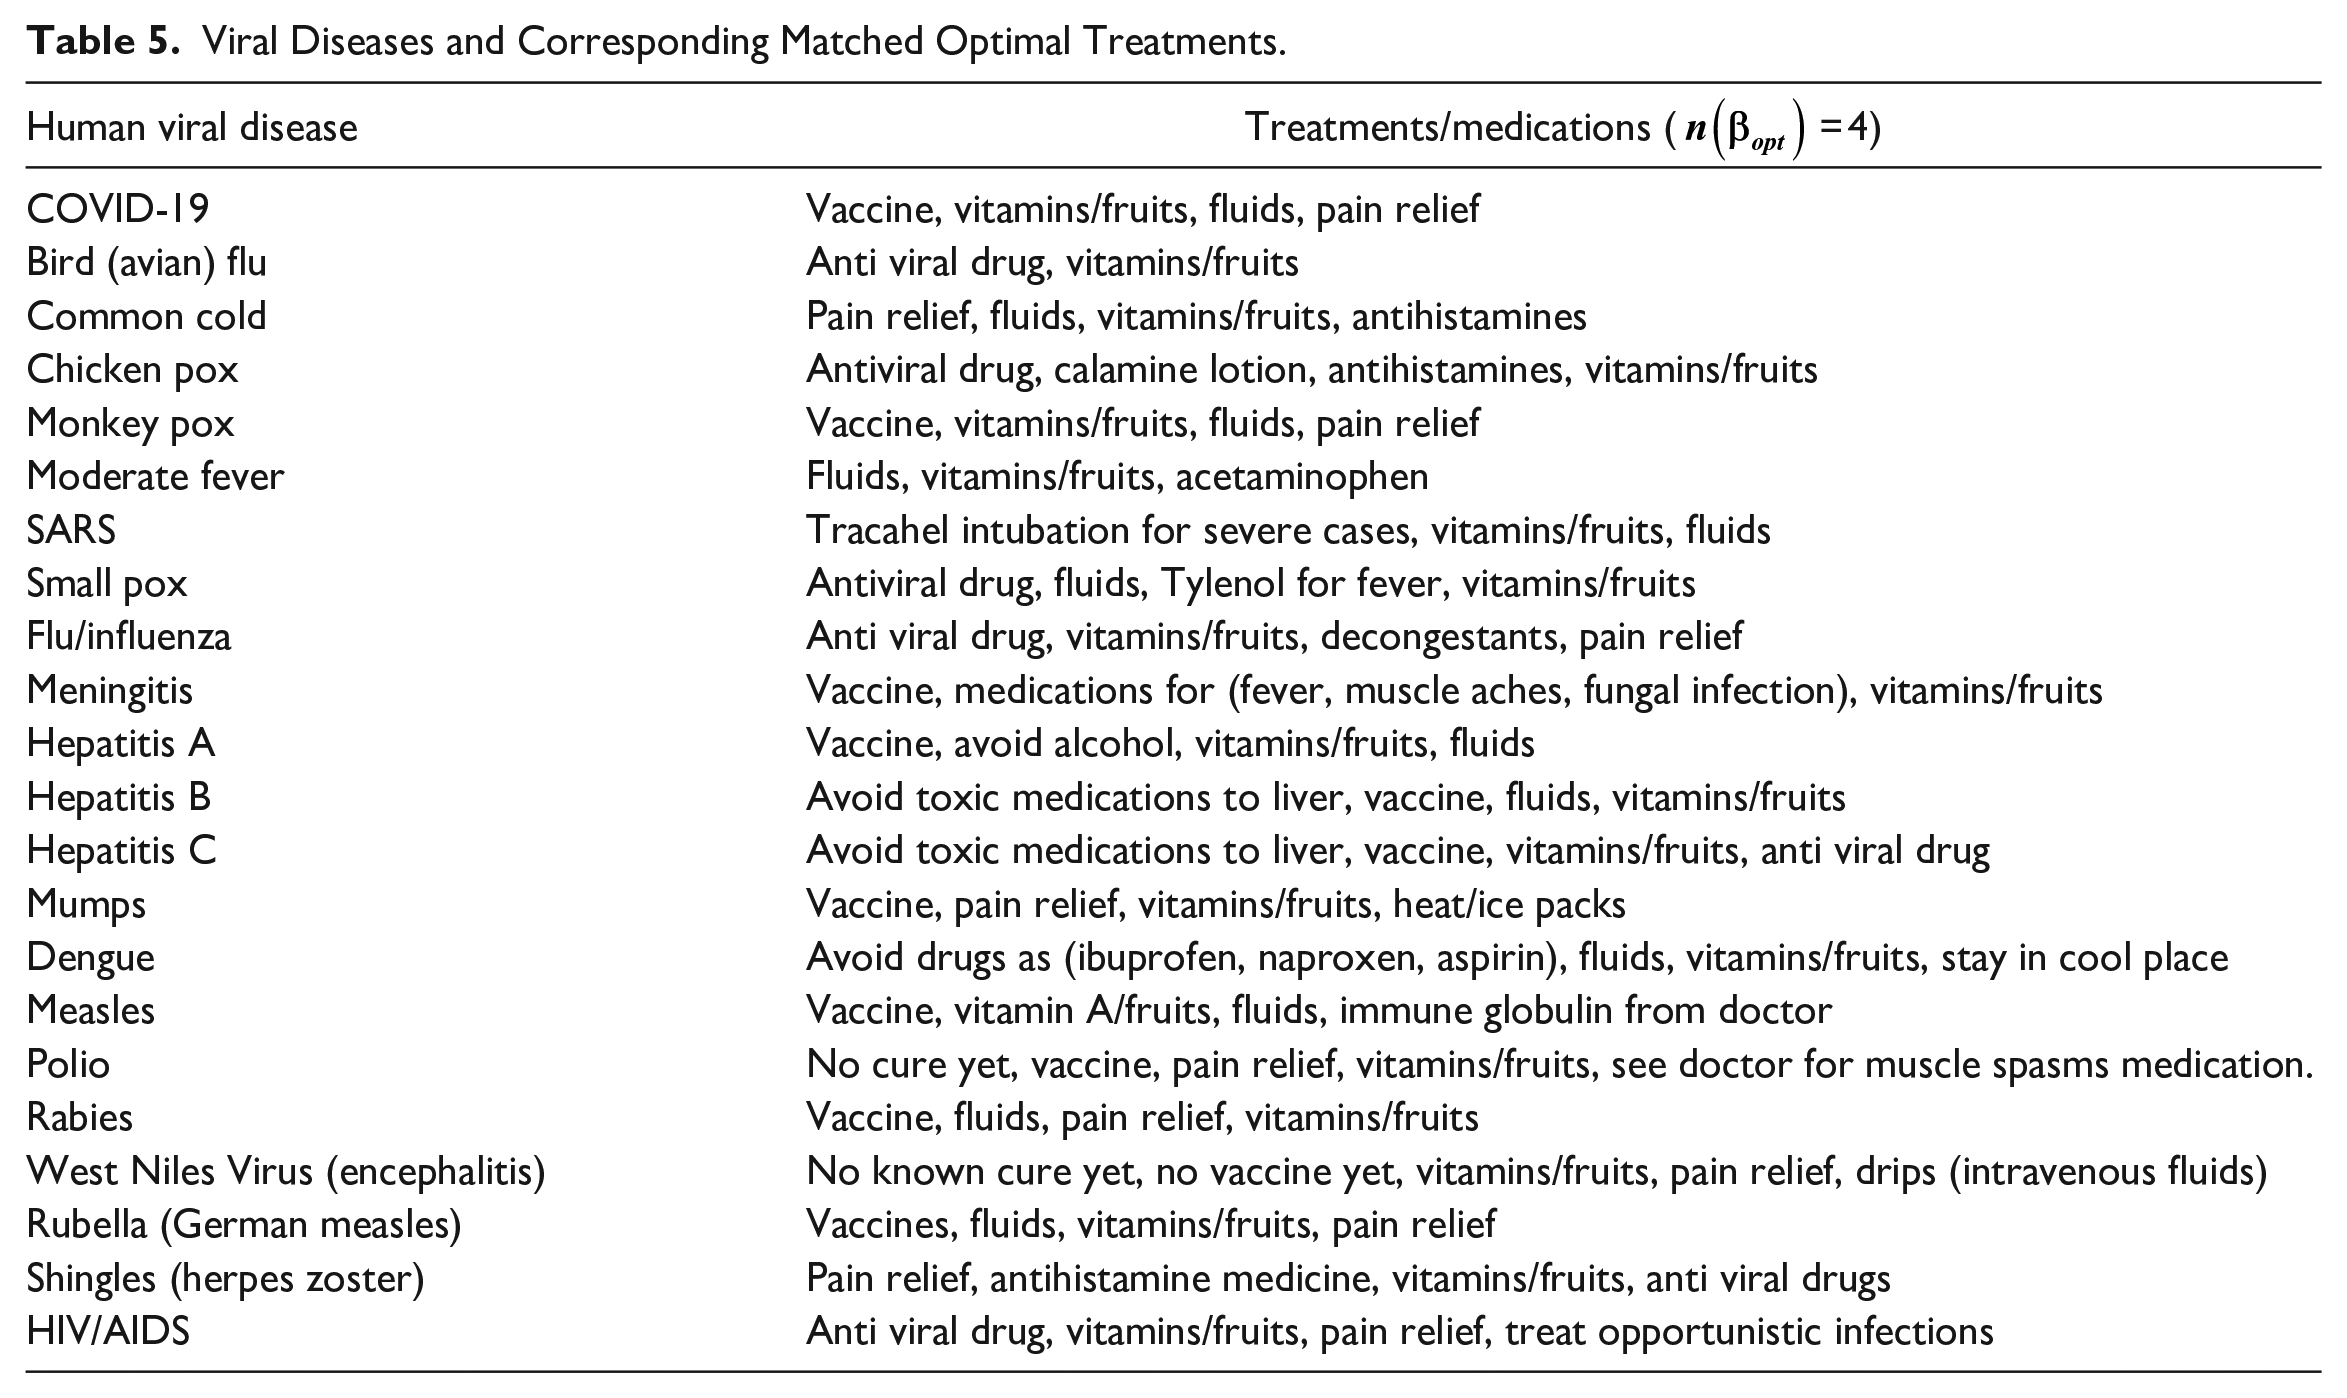
As shown in Table 5, as a result of the analysis using the analytical procedures from equations (1) to (10), the viral diseases are shown to mapped to their respective number of minimal treatments, including notably vaccines which are recommended for viral diseases, indicating its effectiveness; and further implying that vaccines production, optimization, and distribution should feature as a priority and be on the increase to address most viral diseases as needed in developing and developed countries. Furthermore, the significance and importance of specific medications like pain relievers, vitamins, and in some cases anti viral drugs; are highlighted to be commonly effective in the treatment of most viral diseases. These analytically derived results in Table 5, points to the fact that for an efficient and effective treatment for viral diseases, especially where there is limited medical personnel; such intelligently determined treatments can be cost effectively, quickly, and precisely determined and administered from the data driven analysis of the symptoms and identification of specific viral diseases.
Gray Analysis of Countries COVID-19 Data
As earlier described in this paper, the gray system of analysis described in Figure 4 is applied here to analyze and categorize countries in relation to their respective COVID-19 data (rate of vaccinations [%], active COVID-19 cases [per 10 000]), some climatic (average annual temperature [°C], average annual humidity [%]) and economic metrics (GDP per capita); as a key step to effectively and efficiently manage the virus and its associated treatment strategies and procedures; it can also be applied to other illness eradicating strategies. Here, the following Gray Analysis parameters were used to carry out the required analysis:
From the methodical analysis of the selected countries (Table 1), using the gray system fixed weight clustering method; for the results obtained in Table 6, the maximum values (max(
Gray Analysis Results of Categories of Selected Countries Based on Incomplete Information Available.

Source. Using data from Table 1.
Discussion
There is no doubt that the rate of vaccinations is crucial to eliminating a good number of viral diseases, especially the COVID-19 virus and its variants; and requires an efficient and effective national and global strategy that is influenced by unique economic, geographic, and climatic conditions; thereby, confirming that strategies to effectively fight COVID-19 and effective global equitable distribution of vaccines must be carried out uniquely within countries taking into account peculiar situations and circumstances of countries with also the needed vital supports continuing from richer countries to other countries as needed (Figure 6).
Some research works have also confirmed the effect of climate on COVID-19 cases and showed relationships between the temperature of a region and cases of COVID-19 (Figure 7), and so it’s vital to consider this factor as strategies for the effective treatment and management of COVID-19 has to take into account the unique climatic conditions of countries in the world, distribution of substantial community outbreaks of COVID-19 along restricted latitude, temperature, and humidity measurements was consistent with a virus that is typical of a respiratory related nature and that occurs seasonally. Adequate creation of models of the weather makes it likely possible to have an estimate of regions that could likely be at risk of community spread of COVID-19 in the near future and this will enable efforts to be more concentrated on excellent surveys and containment processes. 25
For the COVID-19 case study of a developing country as Nigeria; estimating and/or forecasting the number of vaccinations given (Figure 7), and or will be needed is an important step in the process of eliminating COVID-19, due to the bit of uncertainty that financial, demographic limitations provide. Though there are minimal cases compared to the global numbers, having also a large population presents the challenge of ensuring that adequate vaccines are made available, but at the same time will be needed, so as not to waste any which could be a huge financial loss and health loss to other countries who needs the vaccines more; since the pandemic is a global one. Therefore, there is the need to properly understand how much vaccines are administered and how much can be needed in the near future, to ensure an effective and efficient elimination of COVID-19. With the needed financial backing, the number of vaccinations can be increased as needed for greater vaccines distributions and to cover the populace within a shorter time period, to ensure further effective fight against the COVID-19 virus and its variants.
Furthermore, this work modeled a scenario similar to a real life situation, where not only the economic strength of a country affects the amount of vaccinations provided or will be needed, but also other important factors (Figure 8). Our obtained results provided further insights that for a more precise estimation or prediction of the number of vaccinations needed in a developing country as Nigeria; other independent variables or factors will need to be considered within the model, as such factors do influence the number of vaccinations provided or administered. Therefore, for developing countries, unique generic strategies to combat COVID-19 and other viruses, should involve the creation of a multi dimensional (ie, multi variable factors consideration) predictive testing and vaccination approach, that cuts across both rural and urban communities; that also involves the use of remote diagnostics treatment techniques using data driven technologies as described. This approach taking into account the socio-economic nature and challenges of such countries and will ensure that testing, diagnosis, and treatments/vaccinations will be carried out efficiently and effectively at minimal cost; by also involving volunteer ad hoc medical personnel trained on the use of such efficient, effective, and simplistic data driven procedures and technologies, in line with the philosophy of modern “personalized medicine.” For politically, laws, policies, and structures will need to continually be enacted and reviewed to make the healthcare response systems less decentralized, robust, and flexible (also involving the aid of technology), so as to reach also remote rural persons needing medical attention quickly and effectively. This will also culminate to a more sustainable society and reduce the high mortality rate which is usually associated with developing or less developed countries.
The unique symptom matching analytical approach to viral disease diagnosis, treatment, and management (Figure 9) enables more efficient non-clinical diagnosis of viral diseases via symptoms definitions and thereby, reducing the costs of tests and timings of tests used to identify potential viral disease with precision; to therefore enable timely and accurate treatment, especially in developing and under developed countries where there could be limitations in terms of medical facilities, finance, and personnel. This analytical system (Table 5) could even be further advanced by collaboration with healthcare practitioners, incorporating information for more diseases and having additional layers of analytical diagnosis; which will increase the field of coverage of such uniquely important technique and also improve precision of results. 28
As shown, few analytical tools, methodologies, and processes were employed to carry out a non-clinical analysis of approved data sets, this further enhances the argument that technology, data science, AI, and all other associated modern technologies can be used in healthcare to effectively and efficiently make sense out of huge amount of data that is captured for analysis, and also contributes to an even more collaborative, productive, and proactive healthcare industry. Several algorithms, of which some are used in this work can be employed to analyze data from many sources, including information on the spread of communicable diseases like COVID-19, the distribution of vaccines, genomic data from living cells, and even handwritten doctors’ notes, including preventative medicine, where even predictions of outbreaks of contagious diseases, their scale and when and where they would occur due to unique geographical and demographic situations; can be determined and addressed proactively. Technology, data science and AI can make it possible to create tools that can spot patterns across huge datasets far more effectively than traditional analytics processes, leading to more accurate predictions and ultimately better patient outcomes. These of course contributes to the modern and future field of medicine called personalized medicine and genomics; where modern technologies, AI, data sciences, can ensure a more personalized approach to medicine and healthcare, resulting in treatments that can be tailored right down to the unique individual level considering every demographic, geographic, health history, symptoms, allergies, side effects, etc; and unique need of the individual for optimal recovery. Also, genomic and the use of technology to intelligently map genomes individually, is particularly useful for creating personalized medicine. Genomic also has a major sub-field which is about the design of health related or focused diet plans in a bespoke manner and based on varying or different genetic factors; this sub-field is known as nutrigenomics. The analyzed sample mapping technique, COVID-19/viral diseases diagnosis/treatment/management analytics of this work; gives an indication of what can be possible in relation to such modern approaches to medicine and healthcare. 31
Additionally, with the very useful results obtained and the huge potential of this research work; by having the required data sets, infrastructure and personnel expertise; a proposed data/AI based viral disease analysis and management system is shown in Figure 10:

Proposed data/AI based viral disease analysis and management system.
Limitations and Recommendations of Study
This research study was focused on the data driven analyses of the vaccination drive and viral disease diagnosis and treatment as it relates to specific regions and countries. Though a thorough analysis of selected various factors affecting amount of vaccination and viral diseases, there were also a few limitations within the scope of this study. In terms of data acquisition, the datasets used were from approved and dedicated data stores, repositories and databanks; which in some cases were not fully complete with respect to certain regions or countries; thereby limiting further extensive regional or country based analyses; for example, in specific environments, up to date COVID-19 measurement and demographic data not being readily available provides a challenge in carrying out additional specific comparative and informative analyses for unique locations. Additionally, the data analysis did not involve sample surveys from respondents which could further add more perspectives to the study; as this was during the COVID-19 recovery season.
Furthermore, with respect to the predicted amount of COVID-19 vaccinations, a non-exhaustive list of key variables were considered and analyzed in relation to socio economic, demographic, weather, and COVID-19 cases influencing COVID-19 vaccinations. However, some other variables were not part of this analysis; variables such as that relates to age distribution, political, and policy frameworks, which would provide even more analysis that can provide additional insights on how such factors also influence the COVID-19 vaccination drive within a country.
This unique symptom mapping analytical technique and proposed data/AI viral disease management system can be further investigated, with potential applications to a variety of medical conditions and diseases, so as to further explore and extend the potentials of this system. This technique and system promises greater insights with respect to further developments in the field of precision and personalized medicine.
Conclusion
Healthcare systems are a key driver and important indicator of development for a sustainable society, and it is vital for the continuous improvement of developed and developing countries to bridge the gap of development and contribute greatly to our world. Therefore, innovative measures, processes, systems, and technologies must continually be used to improve the healthcare systems, equip healthcare professionals, to provide a broad based, dynamic, responsive, ubiquitous and efficient healthcare systems, and profession needed by our modern world.
This analytical research work which was carried out between October 2021 to February 2022 as a pertinent analytical step during the roll out of COVID-19 vaccinations; measured and analyzed the COVID-19 vaccination drive and possible non-clinical solutions and techniques to diagnose, treat/manage COVID-19, and other human viral diseases using data analytics and AI/ML tools within the context of a developing country (Nigeria) and also for some selected countries across the world. Datasets from trustworthy and recognized data stores, portals, and sources were used for this study’s research work; and as a result, it can be correctly assumed that the datasets are reliable and credible. Data-driven analytical methodologies, techniques, and theories were employed to measure, analyze, investigate, deduce, predict, and draw meaningful conclusion in this research work; to ensure that the objective and the aims of this research were effectively met and important results, observations, inferences, and conclusions were actualized.
The results obtained can serve as a solid background to even more work in these areas and expand research beyond the scope of this work, to create more results that can serve to further improve healthcare globally in a cost effective and efficient manner, using modern analytical and data-driven intelligent solutions. The area of precision and personalized medicine with the use of Artificial Intelligence, Machine Learning, and Data Analytical tools are a frontier in medicine this research contributes to; and such future of medicine will ensure that medical practices and professionals are better equipped to provide a more robust healthcare for now and the future.
Footnotes
Acknowledgements
I am currently a PhD student on a fully funded Presidential Scholarship from the Chinese Government. The author would like to sincerely thank my PhD Supervisor for her helpful and insightful feedback that have also contributed to this manuscript.
Declaration of Conflicting Interests
The author declared no potential conflicts of interest with respect to the research, authorship, and/or publication of this article.
Funding
The author disclosed receipt of the following financial support for the research, authorship, and/or publication of this article: I am currently on a PhD Scholarship from the Chinese Government. No specific finding for this research work.
Patient Consent
No consent was needed as this was a non-clinical data driven research.