
Abstract
Vaccination for the COVID-19 pandemic has raised serious concerns among the public and various rumours are spread regarding the resulting illness, adverse reactions, and death. Such rumours can damage the campaign against the COVID-19 and should be dealt with accordingly. One prospective solution is to use machine learning-based models to predict the death risk for vaccinated people by utilizing the available data. This study focuses on the prognosis of three significant events including ‘not survived’, ‘recovered’, and ‘not recovered’ based on the adverse events followed by the second dose of the COVID-19 vaccine. Extensive experiments are performed to analyse the efficacy of the proposed Extreme Regression- Voting Classifier model in comparison with machine learning models with Term Frequency-Inverse Document Frequency, Bag of Words, and Global Vectors, and deep learning models like Convolutional Neural Network, Long Short Term Memory, and Bidirectional Long Short Term Memory. Experiments are carried out on the original, as well as, a balanced dataset using Synthetic Minority Oversampling Approach. Results reveal that the proposed voting classifier in combination with TF-IDF outperforms with a 0.85 accuracy score on the SMOTE-balanced dataset. In line with this, the validation of the proposed voting classifier on binary classification shows state-of-the-art results with a 0.98 accuracy.
Introduction
The last two decades have witnessed many pandemics like SARS (Severe Acute Respiratory Syndrome), MERS (Middle East Respiratory Syndrome), COVID-19 (coronavirus disease 2019 ), etc. Recently, COVID-19 infected approximately 308 million people in 223 countries leading to 5.492 million deaths as of 12 January 2020 1 . The ongoing COVID-19 pandemic impacted the individual, as well as, the public life of human beings on a global scale, and containing it seems to be very difficult in the near future. Although, it possibly can be confined like other viruses, such as HKU1, NL63, 229E, and OC43, however, the substantial human and financial loss remains the main concern 2 . Precautionary measures against COVID-19, such as sanitation procedures, physical distancing, personal hygiene, mask usage, disinfection of the surfaces, and frequent hand washing are essential to reduce its spread. However, the case fatality ratio (CFR), a measure of mortality among infected cases, continues to increase 3 . Facilitating a safe return to normal life along with minimization of the COVID-19 resurgence requires the immunity against COVID-19 4 which is aimed by several developed vaccines like Moderna, Pfizer (BioNTech), and Johnson & Johnson, etc. 5 As of December 2020, several vaccines have been administered with different efficiency and immunity against COVID-19, as shown in Figure 1.

Efficacy of COVID-19 vaccines.
Similar to vaccines for other diseases, COVID-19 vaccines have been reported for several side effects. Reports of adverse side effects following the doses of COVID-19 vaccination are submitted to VAERS (Vaccine Adverse Event Reporting System). From 1 January 2021 to 19 March 2021, a total of 5351 adverse events have been reported to VAERS. The adverse side effects range from mild to severe such as fever, pain, diarrhoea, fatigue, blood pressure, chills, muscle pain, headache, and pain at the injection site and are shown in Figure 2(a). Similarly, several COVID-19 positive cases are reported after being vaccinated. Further include dizziness and severe allergic reactions. Blood clotting, cardiac problems, and resulting deaths are also reported following adverse events such as cardiac arrest, abdominal pain, etc. as shown in Figure 2(b). There is also a theoretical risk that vaccination could make infection severe by enhancing the respiratory disease 6 . Such adverse reaction and death reports make it significantly important to analyse the data regarding the adverse effects of COVID-19 vaccines and report reactions with a higher probability of fatality to assist healthcare professionals in prioritizing the cases with adverse effects and provide timely medical treatment.

Word cloud of reported adverse reactions, (a) side effects following the doses of COVID-19 based on reports submitted to Vaccine Adverse Event Reporting System (VAERS), and (b) side effects of death cases post COVID-19 vaccine.
The ML (machine learning) is the self-regulated discovery of potentially valid or useful knowledge and novel hidden patterns from dataset 7 . ML models operate by revealing relationships and patterns among the data instances in single or multiple datasets. ML has been widely applied in the healthcare sectors for its applications in simulating health outcomes, forecasting patient outcomes, and evaluating medicines 8 . In recent years, ML has also been extensively used in the diagnosis and prognosis of many diseases like COVID-19, as immense data is being generated regarding COVID-19 on an everyday basis, which can be analysed to predict the COVID-19 case and devise corresponding policies to contain the pandemic. In the same vein, data associated with adverse events reports post-COVID-19, gathered by VAERS was made public on 27 January 2021 which motivated current research.
This study demonstrates an enhanced ML-based prediction system to analyse the adverse events associated with the COVID-19 vaccine and predict individuals with symptoms that might cause fatality so that healthcare professionals can treat the individuals beforehand. It helps medical experts critically monitor vaccinated individuals with death risks. This study makes the following major contributions:
This study advocates a systematic approach to investigate the adverse events following the COVID-19 vaccine for possible death leading symptoms. The prognosis of three significant events including ‘not survived’, ‘recovered’, and ‘not recovered’ is made in this regard. A novel vote-based ER-VC (Extreme Regression-Voting Classifier) is devised which combines ET and LR under soft voting criterion to increase the prediction accuracy. Extensive experiments are carried out for performance analysis concerning many machine learning models like RF (Random Forest), LR (Logistic Regression), MLP (Multilayer Perceptron), GBM (Gradient Boosting Machine), AB (AdaBoost), kNN (k Nearest Neighbours), and ET (Extra Tree Classifier). In addition LSTM (Long Short Term Memory), CNN (Convolutional Neural Network), and BiLSTM (Bidirectional LSTM) are also implemented for appraising the performance of the proposed approach. To analyse the influence of data balancing, the performance of ML models is analysed and compared by integrating SMOTE (Synthetic Minority Oversampling Technique) for predicting the survival of vaccinated individuals.
The structure of this research is organized into five sections. Section ‘Related work’ represents the previous works related to this study. Later, the proposed approach, ML models, and dataset description are provided in Section ‘Material and methods’. Section ‘Results and discussion’ provides the analysis and discussion of the results. In the end, the study is concluded in Section ‘Conclusion’.
Related work
The COVID-19 pandemic inflicted substantial economic and human losses worldwide. With unusual symptoms, the disease is difficult to treat based on previous methods used for treatment. However, the strong infrastructure of electronic health records and advanced technologies in recent times has helped in conducting several research studies and exploration of its treatment. The data repositories of COVID-19 patients’ symptoms and track records are maintained efficiently by medical and government institutions to explore health risks. Laboratory tests, radiological reports, and patients’ symptoms have been analysed using ML models by many researchers. Early studies, mostly focused on disease diagnoses and predicting the death rate of COVID-19 patients based on statistical models 9 . After some time, hospital records of patients are mostly used to identify potential risks 10 .
The exacerbated outbreak of the COVID-19 pandemic and its potential risk to human lives necessitated different medical research laboratories and pharma industries to start developing the COVID-19 vaccine at a fast pace. For providing herd immunity to people, there was a need for a safe and effective vaccine in a short time 11 . At the end of 2020, 48 vaccines were available at the clinical trial phase, and three vaccines including Pfizer, Moderna, and AstraZeneca completed this phase in the US 12 . During the first phase, millions of health professionals were vaccinated, then populations at higher risk, such as people older than 65 years are covered 13 .
Severe outcomes leading to the death risk of COVID-19 patients are associated with different pre-existing medical conditions and comorbidities14,15. Approximately more than 40% of patients hospitalized with COVID-19 had at least one comorbidity 16 . In a similar study, the authors analysed comorbidities between survivor and non-survivor patients 17 . Common diseases included diabetes mellitus, cardiovascular disease, chronic obstructive pulmonary disease, hypertension, and kidney-related diseases. Various other biomarkers such as C-reactive protein, high level of ferritin, white lymphocyte count, blood cell count, procalcitonin, and d-dimer are related to health risks and are increasing the mortality rate of COVID-19 patients 18 . These biomarkers and other symptoms could offer advantages in predicting death risks.
Various types of deep learning architectures have also been employed for different tasks. For example, the bidirectional neural network is proposed by Onan 19 that uses a group-wise enhancement mechanism for feature extraction. By dividing features into multiple groups, important features from each group can be obtained to increase the performance. Similarly, a bidirectional LSTM model is presented by Onan and Korukoğlu 21 that combines term weighting using inverse gravity moment with trigrams. Ensemble models are also reported to produce better results for sentiment analysis tasks22,23. Such models utilize different ensemble schemes, clustering, and feature extraction approaches for increased performance. For example, Onan 24 devises a feature extraction approach for sentiment analysis while Onan et al. 25 follows a hybrid ensemble model using the concept of consensus clustering. Similarly, Onan26,27 adopts ensemble models for sentiment analysis and opinion mining 28 . Along the same lines, topic modelling is focused on using ensemble models by Onan29,30. The topic of sarcasm detection is covered by Onan 31 by following a hybrid model approach while Sadiq et al. 32 investigates aggression detection. The authors have explored many ML-based techniques using patients’ symptoms and laboratory reports during hospitalization 33 . Researchers are diligent in defeating COVID-19 by exploring ways of COVID-19 detection 34 and devising frameworks to control the spread of disease 35 . Researchers applied an ML model to electronic health records to predict the mortality rate of COVID-19 patients 36 . However, the non-infected population is getting benefits from vaccination. Because of heterogeneity among the population due to demographic categories, risk patterns regarding COVID-19 disease and vaccine are difficult to predict. Different factors are involved in predicting death risks such as unique health history, obesity, cancer history, hereditary diseases, and different immunity levels. Medical professionals are striving to allocate resources and provide help in maximizing the survival probability.
This study makes a significant contribution toward maximizing the survival rate of vaccinated people by predicting the probability of fatal outcomes beforehand by analysing the post-vaccination symptoms. We leveraged growing electronic records and advanced predictive analytical methods to predict the risk associated with the side effects of COVID-19 vaccines.
Material and methods
This study works on the highly accurate prognosis of death risk patients in addition to recovered and not recovered cases concerning the adverse events reported after the second dose of the COVID-19 vaccine. Experiments in this research can be categorized into two stages where Stage I deals with the multiclass classification of adverse events as ‘not survived’, ‘recovered’, and ‘not recovered’ while Stage II or validation stage is concerned with the binary classification of the adverse reactions into ‘survived’ and ‘not survived’. This section contains a brief description of the dataset utilized in this study, as well as, the proposed methodology adopted for classification tasks.
Dataset description
This study utilizes the COVID-19 VAERS dataset acquired from Kaggle which is an open repository for benchmark datasets 37 . The dataset contains the adverse events reported by individuals after the COVID-19 vaccine along with details related to the particular individuals 38 . It consists of a total of 5351 records and 35 variables, details of which are given in Table 1. The study is concerned with investigating the death risk of vaccinated individuals by analysing the adverse events. On that account, we utilized only three variables such as ‘RECOVD’, ‘DIED’, and ‘SYMPTOM_TEXT’ for multiclass classification and two variables including, ‘DIED’ and ‘SYMPTOM_TEXT’ for binary class classification. The variable ‘DIED’ comprises two classes involving ‘survived’ and ‘not survived’ corresponding to 4541 and 810 records, respectively. Whereas, the variable ‘RECOVD’ comprises three target variables, including ‘recovered’, ‘not recovered’, and ‘recovery status unknown’ corresponding to 1143, 2398, and 1810 records, respectively. Some of the ‘DIED’ cases are regarded as ‘not recovered’ while some belong to the ‘recovery status unknown’ category as shown in Figure 3(a). The correspondence between the ‘DIED’ and ‘RECOVD’ features shows that a portion of the cases which did not recover from COVID-19 did not survive after being vaccinated. Figure 3(b) reveals that adverse events leading to the death of the vaccinated individuals comprise 15% of the dataset which shows that there is an unequal distribution of class in both binary class and multiclass distribution. For an effective analysis, we disregarded the records which correspond to ‘recovery status unknown’ except for the ones which belong to the ‘not survived’ category in the multiclass classification.

Dataset visualization, (a) correspondence between the categories related to ‘DIED’ and ‘RECOVD’ features, and (b) class distribution.
Description of data attributes of COVID-19 World Vaccine Adverse Reactions dataset.

Problem statement
Consider an individual
Proposed methodology
In this study, ML-based techniques are utilized for the analysis of adverse events caused by the COVID-19 vaccine. Figure 4 shows an architecture of the methodology adopted for the diverse range of experiments which is followed by each prediction model.

Architecture of the methodology devised for prognosis of death risks.
This study mainly follows multiclass classification which involves classifying adverse reactions as ‘not-survived: vaccinated individuals that died due to adverse reactions’, ‘recovered: vaccinated individuals that recovered from COVID-19’, and ‘not recovered: individuals that were tested positive of COVID-19 after vaccination’. In line with this, we integrated two data attributes including ‘RECOVD’, and ‘DIED’ as the target class, and one attribute ‘SYMPTOM_TEXT’ as a feature set in our experiments. The ‘RECOVD’ data attribute has three values including
Data count after implementation of synthetic minority oversampling approach (SMOTE) in accordance with each target variable.

To reduce the training and generalize the learning patterns for the classifiers, we integrated two feature extraction techniques including BoW (Bag of Words), TF-IDF (Term Frequency-Inverse Document Frequency), and GloVe (Global Vectors). Afterwards, data is split into train and test sets with a ratio of 0.8–0.2. The number of train and test records corresponding to multiclass and binary classification is given in Table 3. Furthermore, ML classifiers, such as LR, ET, RF, GBM, AB, KNN, MLP, and proposed voting classifier learn the patterns regarding the target variable from the train set. Trained models are then tested on the unseen test data and evaluated under the criteria of accuracy, precision, recall, and F1 score.
Data split count corresponding to training and test sets.
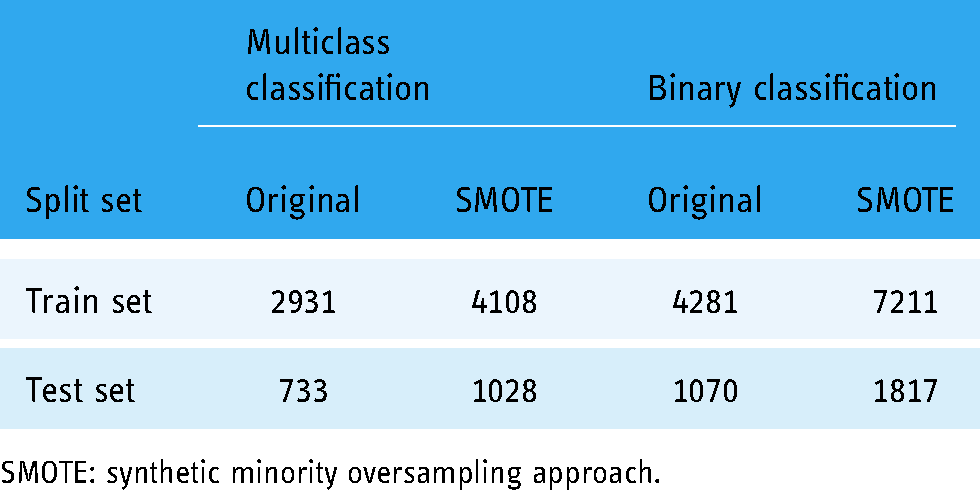
SMOTE: synthetic minority oversampling approach.
Data preprocessing
Data preprocessing aims at enhancing the quality of the raw input data to extract meaningful information from the input data. It is followed by the preparation of input data which includes cleaning and organization of the raw data to effectively build and train the ML-based classifiers. In the current study, various steps are taken to clean, normalize and transform the ‘SYMPTOM_TEXT’. We removed irrelevant data, including punctuation, numeric, and null values from the input data. ML classifiers are prone to case sensitivity, for their efficient training we normalized the case of text by converting the text into lowercase. Afterward, we performed stemming using PorterStemmer(), and NLTK (Natural Language Tool Kit) function, for the conversion of verbs into their root forms. As the last step of preprocessing, we removed stop words that are the most frequent in the text and are not significant for the classification.
Feature extraction
Feature extraction is a technique that involves the extraction of significant and effective features from the preprocessed data for improved performance of predictive models on the unseen data. It follows the procedure of transformation of arbitrary data and finding features that are correlated with the target variable. ML classifiers guided by feature extraction technique tend to produce more accurate results 39 . Two feature extraction techniques including BoW, TF-IDF, and GloVe are utilized in this study.
BoW is the vectorization of text data into numeric features. It represents the word frequency within the text regardless of the information concerning its structure or position in the text. This technique considers each word as a feature 40 . It does not regard the number of times different terms appear in a document. A term’s presence in a corpus is the only factor that affects its weight.
TF-IDF quantifies a word in a document by computing the weight of each word which in turn shows the significance of a word in that text
41
. The weight is determined by combining two metrics, TF (Term Frequency) which is a measure of the frequency of a word in a document, and IDF (Inverse Document Frequency) which refers to the measure of the frequency of a word in the entire set of documents. Here document can be considered as ‘SYMPTOM_TEXT’ in the dataset. TF-IDF for the frequency of a word 
GloVe generates word embeddings of the given ‘SYMPTOM_TEXT’ by mapping the relationship between the words. This is mainly done by aggregating the global co-occurrence matrices which provide information regarding the frequency of word pairs occurring together. Similar words are clustered together and different words are discarded based on the co-occurrence matrix of a corpus. Rather than training on the entire sparse matrix or individual context windows in a large corpus, the Glove model takes advantage of statistical information as exclusively nonzero elements in a word-word co-occurrence matrix 42 .
Data sampling
When a target variable is distributed unevenly in a dataset, it leads to a misleading performance by the ML models. The reason for this is that ML models learn the decision boundary for the majority class with more efficacy than the minority class. Therefore, showing poor performance in the prediction of minority class results in ambiguous and misleading results. Hence, changing the composition of an imbalanced dataset is one of the most well-known solutions to the problem of classifying an imbalanced dataset 43 . It can be done in two ways: undersampling or oversampling. Undersampling randomly reduces the majority class size and is mostly utilized when there is an ample amount of data instances whereas, oversampling arbitrarily duplicates the minority class and is effective when implemented on a small dataset. Since we have a limited number of records in our dataset, therefore, oversampling is the best fit for the proposed framework. One of the oversampling techniques is SMOTE 44 which is utilized in the current study.
A SMOTE selects the data samples which are relatively close in the feature vector space and draws a line between those data samples
45
. It then generates synthetic data samples by finding
ML classifiers
Supervised ML classifiers are utilized in this study for the prediction of target variables from the data. Implementation of ML classifiers is done in Python language using the ‘scikit learn’ module. ML classifiers are trained on data samples from the training set and tested using a test set that is unknown to the classifiers. ML classifiers integrated in this study are briefly discussed here and their corresponding hyperparameter settings are given in Table 4.
Hyperparamter settings of supervised machine learning classifiers.

RF: Random Forest; LR: Logistic Regression; MLP: Multilayer Perceptron; GBM: Gradient Boosting Machine; AB: AdaBoost, kNN: k Nearest Neighbours; ET: Extra Tree Classifier.
Random Forest is a tree-based ML classifier that integrates aggregated results obtained by fitting many decision trees on randomly selected training samples. Each decision tree in RF is generated based on selection indicators such as Gini Index, Gain Ratio, and Information Gain to select an attribute. It is a meta-estimator that can be used both for regression and classification tasks 46 .
AdaBoost also referred to as adaptive boosting is an iterative ensemble technique and is a good choice for constructing ensemble classifiers. Combining numerous weak learners into strong learners, it generates robust results. It is trained on weighted examples and provides optimized output by minimizing the error rate at each iteration 47 . AdaBoost adjusts weight with respect to the classification results at each iteration. If the classification results are correct, weights for the training samples are increased while the weights are decreased for those samples which are misclassified. AdaBoost performs better due to its diversity of expansion, that is, it contains diverse classifiers.
Extra Tree Classifier is a collection of several de-correlated decision trees built from random sets of features extracted from training data. Each tree selects the best feature by computing its Gini Importance. ET incorporates averaging to control overfitting and enhance predictive accuracy 48 .
Logistic Regression is a statistical ML classifier that processes the mapping between a given set of input features and a discrete set of target variables by approximating the probability using a sigmoid function. The sigmoid function is an S-shaped curve that restricts the probabilistic value between the discrete target variables as defined in equation (3). It works efficiently for classification tasks
49
.

Multilayer Perceptron is an extensive feed-forward neural network that consists of three layers-input, output, and hidden layer. MLP works by receiving input signals which need to be processed at the input layer and performing predictions at the output layer. The hidden layer is the significant computational mechanism of MLP, which is situated in the middle of the input layer and the output layer. MLP is designed to map a nonlinear relationship between input and its corresponding output vector 50 .
Gradient Boosting Machine is a boosting classifier that builds an ensemble of weak learners in an additive manner which proves to be useful in enhancing the accuracy and efficiency of the learning model. It employs gradient (two or more derivatives of a similar function) to identify the error in the preceding weak learner. Each weak learner in GBM attempts to minimize the error rate of the previous weak learner. It does so by integrating loss function with the gradients. It efficiently handles the missing values in the data 51 .
K-nearest neighbours is a straightforward ML classifier that maps the distance between a dependent variable and a target variable by adopting a particular number of k samples adjacent to the target variable. For classification, kNN predicts by considering the majority votes of the neighbouring data points for the prevalent target variable 52 .
Proposed extreme regression-voting classifier
ER-VC is a voting classifier that aggregates the output predictions of ET and LR to generate a final output. LR determines the significance of each feature of trained samples along with providing the direction of its association with less time consumption. This makes LR a good fit for our proposed voting classifier. Consequently, ET has been selected due to its randomizing property which restrains the model from overfitting. The foundation of the proposed classifier is building an individual strong model instead of discrete models with low accuracy results. It incorporates similar hyperparameter tuning of respected classifiers as described in Table 4. ER-VC is supported with soft voting criteria such that, it generates a final prediction by averaging the probability

Framework of extreme regression-voting classifier.
The working of the proposed ER-VC classifier is illustrated in Algorithm 1. We can compute the target class for the weights assigned to predictions 

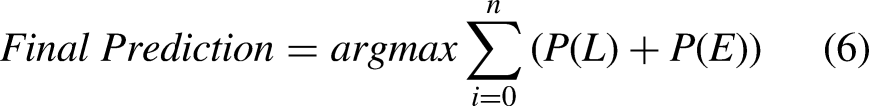
Algorithm for proposed Extreme Regression-Voting Classifier (ER-VC)

Evaluation criteria
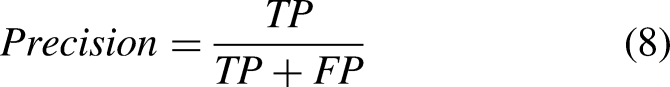
When a model is proposed, it is crucial to evaluate its performance. Four outcomes are produced by ML models when tested with a test set, these outcomes include TP (True Positive), TN (True Negative), FP (False Positive), and FN (False Negative). TP shows the correctly predicted positive instances, TN shows correctly predicted negative instances, FP are wrongly predicted positive instances, and FN is wrongly predicted negative instances. Using these outcomes we evaluated the efficacy of our proposed framework regarding the accuracy, precision, recall, and F1 score. Where accuracy is the measure of correctness of the model, precision is the measure of the proportion of correctly predicted positive instances, recall is the measure of correctly identified positive instances, and F1 score is the harmonic mean of precision and recall. Mathematical formulas of the aforementioned evaluation parameters are given here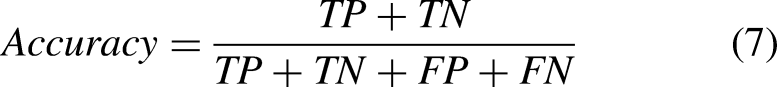


Results and discussion
Extensive experiments have been performed using different scenarios for the prediction of three significant events in COVID-19 vaccinated people. In each scenario, ML models are trained to utilize three feature representation methods on an imbalanced and SMOTE-balanced dataset. Feature representation methods, including TF-IDF, BoW, and GloVe have been chosen as they show remarkable results in text classification. Accordingly, we selected the most relevant ML models to classify symptoms. Machine learning models include RF, LR, MLP, GBM, AB, kNN, ET, and ER-VC. Experiments are performed to identify the most effective combination of feature extraction methods with ML models to classify symptoms into ‘recovered’, ‘not recovered’, or ‘not survived’.
Results for scenario 1
At first, experiments have been performed on an imbalanced dataset using TF-IDF, BoW, and GloVe. Results of the proposed voting classifier are compared with the other baseline classifiers in terms of multiclass classification. Results presented in Table 5 show that LR achieves the highest results with a 0.73 accuracy score using TF-IDF on the imbalanced dataset. However, ER-VC achieved a 0.72 accuracy score, which is the second-highest among all classifiers. It can be noticed that RF, ET, and MLP achieve a 0.71 accuracy value. Moreover, AB shows the worst result with a 0.64 accuracy value using TF-IDF on the imbalanced dataset. AB often cannot generalize well in the case of an imbalanced dataset.
Classification results of machine learning models using TF-IDF without SMOTE.

RF: Random Forest; LR: Logistic Regression; MLP: Multilayer Perceptron; GBM: Gradient Boosting Machine; AB: AdaBoost, kNN: k Nearest Neighbours; ET: Extra Tree Classifier; TF-IDF: Term Frequency-Inverse Document Frequency; SMOTE: Synthetic Minority Oversampling Approach; ER-VC: Extreme Regression-Voting Classifier.
Results presented in Table 6 indicate that using BoW as a feature representation method improves the results of most of the classifiers on the imbalanced dataset. From Table 6, it can be observed that BoW does not improve the performance of MLP and kNN. The proposed voting classifier, ER-VC achieves a 0.74 accuracy score using BoW which is 2% higher than what is achieved by TF-IDF using an imbalanced dataset.
Classification results of machine learning models using BoW without SMOTE.

RF: Random Forest; LR: Logistic Regression; MLP: Multilayer Perceptron; GBM: Gradient Boosting Machine; AB: AdaBoost, kNN: k Nearest Neighbours; ET: Extra Tree Classifier; BoW: Bag of Words; SMOTE: Synthetic Minority Oversampling Approach; ER-VC: Extreme Regression-Voting Classifier.
Table 7 shows the results of ML models when combined with GloVe features for the classification of an imbalanced dataset. A significant drop in the performance of ML classifiers can be observed. However, MLP yields the highest accuracy score of 0.65 whereas, the proposed ER-VC model does not perform well and acquired a 0.60 accuracy with GloVe features.
Classification results of machine learning models using GloVe without SMOTE.

RF: Random Forest; LR: Logistic Regression; MLP: Multilayer Perceptron; GBM: Gradient Boosting Machine; AB: AdaBoost, kNN: k Nearest Neighbours; ET: Extra Tree Classifier; GloVe: Global Vectors; SMOTE: Synthetic Minority Oversampling Approach; ER-VC: Extreme Regression-Voting Classifier.
Results for scenario 2
The second scenario deals with the problem of imbalanced class distribution by the implementation of SMOTE. Data instances of the minority class are increased by oversampling to make a balanced dataset. Afterwards, ML models have been trained using TF-IDF, BoW, and GloVe on SMOTE-balanced datasets. The results of ML models using TF-IDF are presented in Table 8. It can be seen that SMOTE significantly improves the performance of ML models. As revealed by the results, SMOTE contributes to improving the models’ classification results, and six out of eight models achieved higher than 80% results. SMOTE increases data instances of minority class by considering their distance to the
Classification results of machine learning models using TF-IDF with SMOTE.

RF: Random Forest; LR: Logistic Regression; MLP: Multilayer Perceptron; GBM: Gradient Boosting Machine; AB: AdaBoost, kNN: k Nearest Neighbours; ET: Extra Tree Classifier; TF-IDF: Term Frequency-Inverse Document Frequency; SMOTE: Synthetic Minority Oversampling Approach; ER-VC: Extreme Regression-Voting Classifier.
Furthermore, the ML models are trained on the BoW feature representation technique. The performance of the models is compared in terms of classification results. Results shown in Table 9 prove that ML models using BoW do not achieve as robust results as achieved using TF-IDF on the SMOTE-balanced dataset.
Classification results of machine learning models using BoW with SMOTE.

RF: Random Forest; LR: Logistic Regression; MLP: Multilayer Perceptron; GBM: Gradient Boosting Machine; AB: AdaBoost, kNN: k Nearest Neighbours; ET: Extra Tree Classifier; BoW: Bag of Words; SMOTE: Synthetic Minority Oversampling Approach; ER-VC: Extreme Regression-Voting Classifier.
Finally, ML models are combined with GloVe features for the classification of adverse reactions. The results reveal an overall decrease in the performance of ML models as shown in Table 10. However, a significant improvement in the results can be observed on the SMOTE-balanced dataset as compared to the performance of ML models when integrated with GloVe features on imbalanced data. Consequently, it proves that the BoW and GloVe feature representation techniques are not very effective in improving the performance of the models on the SMOTE-balanced dataset. However, SMOTE significantly improves the performance of ML models in classifying adverse events as ‘not-survived’, ‘recovered’, and ‘not recovered’.
Classification results of machine learning models using GloVe with SMOTE.

RF: Random Forest; LR: Logistic Regression; MLP: Multilayer Perceptron; GBM: Gradient Boosting Machine; AB: AdaBoost, kNN: k Nearest Neighbours; ET: Extra Tree Classifier; GloVe: Global Vectors; SMOTE: Synthetic Minority Oversampling Approach; ER-VC: Extreme Regression-Voting Classifier.
Performance analysis of ML models using different features
Figure 6(a) presents the accuracy comparison of ML models using BoW, TF-IDF, and GloVe without SMOTE while Figure 6(b) shows the performance comparison of ML models using BoW, TF-IDF, and GloVe using the SMOTE-balanced data. It can be observed that a substantial improvement in the accuracy of ML models occurred when they are trained using the SMOTE data.

Performance analysis of ML models, (a) accuracy using TF-IDF, BoW, and GloVe without SMOTE, and (b) accuracy using TF-IDF, BoW, and GloVe using SMOTE. TF-IDF: Term Frequency-Inverse Document Frequency; BoW: Bag of Words; GloVe: Global Vectors; SMOTE: Synthetic Minority Oversampling Approach.
Figure 7(a) presents the accuracy comparison of ML models using TF-IDF with and without SMOTE, Figure 7(b) presents the accuracy comparison of ML models using BoW with and without SMOTE while Figure 7(c) shows the accuracy comparison of ML models using GloVe with and without SMOTE. It shows that the results obtained by using BoW on the SMOTE-balanced dataset are better than the results achieved by using BoW on the imbalanced dataset. On the other side, the results of the models using BoW on the SMOTE-balanced dataset are 4% lower than the results obtained by using TF-IDF on the SMOTE-balanced dataset.

Performance analysis of ML models, (a) accuracy using TF-IDF with and without SMOTE, (b) accuracy using BoW with and without SMOTE, and (c) accuracy using GloVe with and without SMOTE. TF-IDF: Term Frequency-Inverse Document Frequency; BoW: Bag of Words; GloVe: Global Vectors; SMOTE: Synthetic Minority Oversampling Approach.
Performance comparison with deep neural networks
To substantiate the performance of the proposed voting classifier, it is also compared with deep learning models. We have used three deep learning models for experiments including LSTM 53 , CNN 54 , CNN-LSTM 56 , and BiLSTM 55 for comparison purposes. Layered architecture and hyperparameter values are presented in Figure 8. The architecture of these models is based on the best results and optimized hyperparameters.

Layered architecture of the deep neural networks.
The same training and test split ratios are used for deep learning models. The deep learning models are used for experiments considering both the original and the SMOTE-balanced datasets. The training and testing accuracy curve of the used deep learning models is shown in Figure 9.

Accuracy measure of deep neural networks with respect to each epoch.
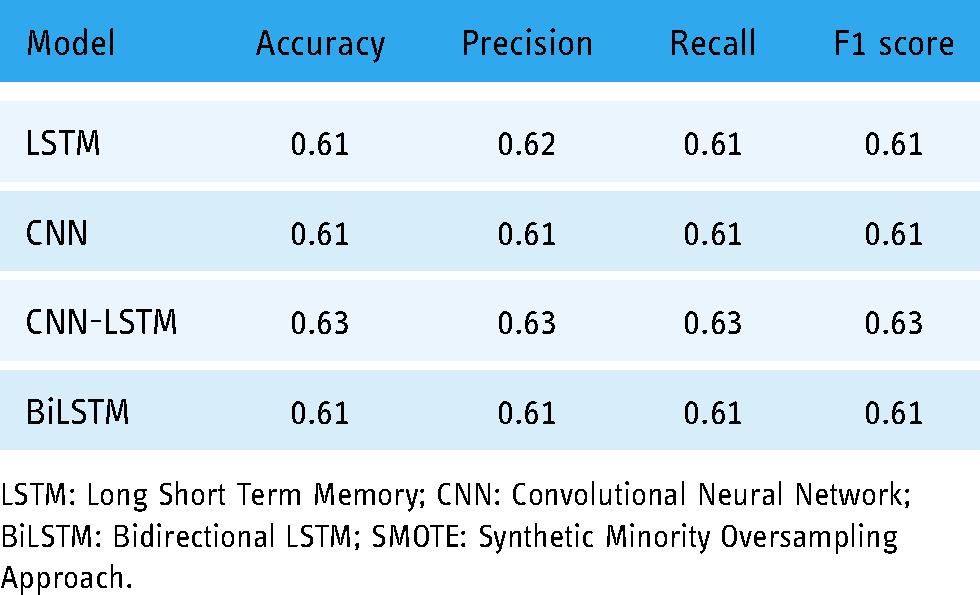
Classification results of deep learning models with and without SMOTE are presented in Table 11. It can be observed that LSTM achieves the highest result with a 0.70 value of accuracy, precision, recall, and F1 score without using SMOTE. CNN has shown the lowest result on the imbalanced dataset. Given the small size of training data available for the deep neural networks, the performance is not good. However, using the SMOTE-balanced dataset, CNN-LSTM has achieved the highest accuracy score of 0.82 followed by similar precision, recall, and F1 score. LSTM and CNN have yielded 0.81 accuracy, precision, recall, and F1 scores. However, these values are lower than the proposed model, namely ER-VC. Despite that, results for deep learning models confirm that SMOTE has significantly improved the performance of CNN-LSTM, LSTM, and CNN models while BiLSTM has achieved similar results with and without SMOTE.
Classification results of deep neural networks without SMOTE.

LSTM: Long Short Term Memory; CNN: Convolutional Neural Network; BiLSTM: Bidirectional LSTM; SMOTE: Synthetic Minority Oversampling Approach.
Results with data splitting prior to SMOTE
To show the significance of the proposed model, this study also deployed another approach where SMOTE technique is used with a training set only. The data is split into training and test subsets and SMOTE is applied only to the training set to balance the samples of different classes. The results of machine learning models given in Table 12 reveal a drop in the performance of learning models; however, the proposed model ER-VC still shows better results with this approach. ER-VC outperforms other models with a 0.75 accuracy score in comparison with all other used models.
Results of machine learning models with data split before applying SMOTE.

RF: Random Forest; LR: Logistic Regression; MLP: Multilayer Perceptron; GBM: Gradient Boosting Machine; AB: AdaBoost, kNN: k Nearest Neighbours; ET: Extra Tree Classifier; GloVe: Global Vectors; SMOTE: Synthetic Minority Oversampling Approach; ER-VC: Extreme Regression-Voting Classifier; TF-IDF: Term Frequency-Inverse Document Frequency; BoW: Bag of Words.
Table 13 presents the results of deep learning models when trained with SMOTE-balanced data and tested with original data. A notable decline in the performance of models is discerned. However, in this case, as well, the performance of deep learning models did not exceed the performance of our proposed ER-VC classifier.
Deep learning models’ results with data splitting prior to SMOTE.
LSTM: Long Short Term Memory; CNN: Convolutional Neural Network; BiLSTM: Bidirectional LSTM; SMOTE: Synthetic Minority Oversampling Approach.
Validation of proposed approach for binary classification
The current study validates the proposed ER-VC model by predicting the survival status of the vaccinated individuals. In accordance with this, we integrated ‘SYMPTOM_TEXT’ as features and ‘DIED’ as the target class. It involves a total of 5351 data instances among which 810 are labeled as
Classification results of proposed ER-VC model for binary classification.

GloVe: Global Vectors; ER-VC: Extreme Regression-Voting Classifier; TF-IDF: Term Frequency-Inverse Document Frequency; BoW: Bag of Words.
Figure 10 demonstrates the number of instances predicted correctly following the given target variable. It can be observed that ER-VC wrongly predicted only 30 instances from a total of 1817 instances when integrated with TF-IDF features as shown in Figure 10(a). Contrarily, Figure 10(b) shows that ER-VC in combination with BoW features made 64 wrong predictions out of 1817 instances. Whereas, in the case of GloVe features, the wrong predictions totals 162 which shows its poor performance in binary classification as presented in Figure 10(c). BoW generates features irrespective of their importance concerning the target class whereas TF-IDF with its ability to extract features that are significant relative to the analysis excels in its performance. This resulted in an effective and robust prognosis of death risks following the COVID-19 vaccine using the proposed ER-VC model combined with TF-IDF features.
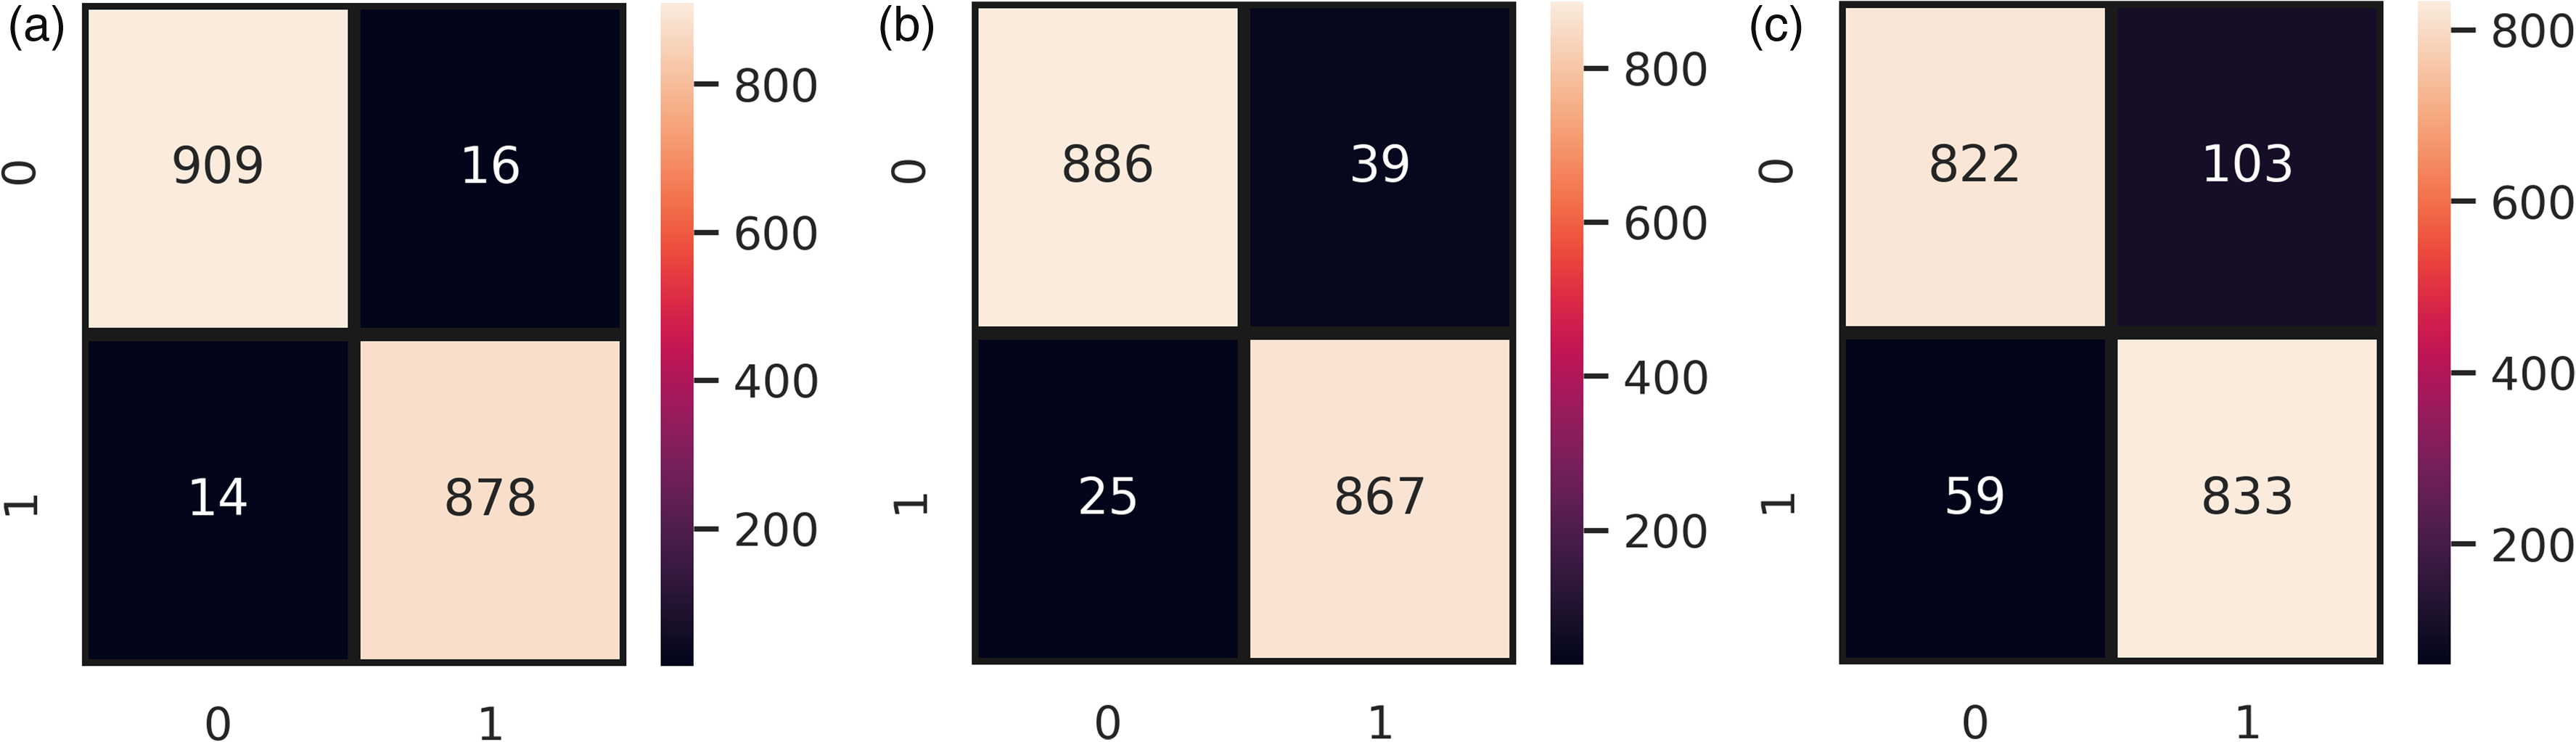
Confusion matrix of ER-VC concerning binary classification, (a) ER-VC with TF-IDF, (b) ER-VC with BoW, and (v) RT-VC with GloVe. GloVe: Global Vectors; ER-VC: Extreme Regression-Voting Classifier; TF-IDF: Term Frequency-Inverse Document Frequency; BoW: Bag of Words.
To further show the significance of the validation, we also conducted experiments by applying SMOTE on the training set only for the binary classification. Table 15 shows that the performance of the model follows a similar trend as shown in Table 14.
Classification results of proposed ER-VC model for binary classification with SMOTE-balanced train set.

GloVe: Global Vectors; ER-VC: Extreme Regression-Voting Classifier; TF-IDF: Term Frequency-Inverse Document Frequency; BoW: Bag of Words; SMOTE: Synthetic Minority Oversampling Approach.
Conclusion
The COVID-19 vaccine has caused different symptoms and adverse reactions in different individuals, ranging from mild to severe, and many deaths have also been reported post-COVID-19 vaccination. Analyzing the post-vaccination symptom can play an important role to understand the relation between different symptoms and fatality, thereby helping the health professionals escalate serious patients and take timely precautionary measures. This study proposes a framework to analyze the adverse events caused by the COVID-19 vaccine leading to death so that health professionals are alerted beforehand. The proposed model predicted three significant events including ‘not survived’, ‘recovered’, and ‘not recovered’ based on the adverse events followed by the second dosage of the COVID-19 vaccine. Keeping in view the data imbalance, experiments are performed using the original dataset, as well as, the SMOTE-balanced dataset. The efficacy of the proposed voting classifier ER-VC is investigated in comparison with many well-known machine learning using TF-IDF, BoW, and GloVe, and deep learning models. After extensive experiments, it is concluded that BoW and GloVe are not effective for the classification of COVID-19 vaccine symptoms. TF-IDF, on the other hand, has shown significant improvement in the classification of vaccine symptoms when it is applied to the SMOTE-balanced dataset. Experimental results proved that the proposed voting classifier surpassed other models with a 0.85 accuracy score using TF-IDF on the SMOTE-balanced dataset. Moreover, the comparison concerning the benchmark state-of-the-art deep neural networks confirms the performance of ER-VC better is significantly better than deep learning models. Furthermore, the effectiveness of the proposed model has been proved by experiments for binary classification where the model shows robust results with a 0.98 accuracy score. Machine learning models and deep neural networks tend to perform better given a larger dataset, therefore, in the future, we plan to incorporate a larger dataset for more accurate results.
Footnotes
Contributorship
Eysha Saad (ES) and Saima Sadiq (SS) conceived the idea and performed analysis. Ramish Jamil (RJ) and Furqan Rustam (FR) performed the data curation and formal analysis. Arif Mehmood (AM) and Gyu Sang Choi (GSC) provided the resources and software. Imran Ashraf (IA) supervised the work. SS, RJ, and FR conducted experiments. ES wrote the initial manuscript, IA did the write-review & editing. All authors reviewed the manuscript.
Declaration of Conflicting Interests
The authors declare that there is no conflict of interest.
Ethical approval
Not Applicable.
Funding
This work was supported in part by the Basic Science Research Program through the National Research Foundation of Korea (NRF) funded by the Ministry of Education under Grant NRF-2019R1A2C1006159 and Grant NRF-2021R1A6A1A03039493.
Guarantor
Not applicable.