
Abstract
This article examines inequalities in the spatial accessibility of childcare between high- and low-status neighbourhoods in the city of Vienna and asks (i) whether specific public and non-profit provider types contribute to these inequalities and (ii) which factors may cause these inequalities in a mainly tax-funded childcare system. For our analysis, we combine data on the location and characteristics of childcare providers with spatially granular information on demand and neighbourhood characteristics. The results show that two provider types – church-related and independent non-profit providers – are mainly responsible for the higher accessibility of childcare in neighbourhoods with higher socio-economic status. Specifically independent providers charge significantly higher prices and offer more special services in these high-status areas. Public funding of a large part of the production costs, therefore, seems insufficient to ensure equal access in all neighbourhoods. These findings suggest that the exclusive comparison between public, private non-profit and private for-profit providers often found in the literature may be too narrow.
Introduction
Childcare facilities are an important social infrastructure that is crucial both for parents’ participation in the labour market (e.g. Müller and Wrohlich, 2020) and for early childhood development (e.g. Brilli et al., 2016). This is particularly true in urban areas, where more children live in single-parent households, where parental labour force participation has increased relative to rural areas (Rodgers, 2018) and where informal childcare provided by relatives is often less accessible (Compton and Pollak, 2014). As a result, governments in all developed countries have been seeking to expand childcare services in recent decades in order to increase attendance rates, but also to eliminate socio-economic inequalities in the use of childcare (OECD, 2019). To achieve this, two dimensions of provision that have a large impact on the (unequal) use of childcare are particularly important: the choice of funding mode and that of accredited institutional providers.
Summarising the literature on this topic, a system with more private funding and a higher share of private providers leads to greater inequalities in childcare use across socio-economic groups (Van Lancker and Ghysels, 2016). Regarding the choice of institutional providers of childcare, the literature usually distinguishes between public, non-profit and for-profit facilities. Non-profit and public institutions are regarded as advantageous for equitable provision compared to for-profit providers, which are more likely to create inequalities in childcare supply (e.g. Owens and Rennhoff, 2014). However, recent research indicates that inequality in spatial accessibility to childcare in urban areas exists even in a tax-funded system with public and non-profit provision only. Spatial accessibility is the ratio of places offered to the number of children residing in a given neighbourhood. According to Pennerstorfer and Pennerstorfer (2021), Vienna’s high socio-economic status neighbourhoods offer more childcare places per child than lower socio-economic status neighbourhoods, whereby this inequality in spatial accessibility is caused by non-profit providers. But why do non-profit providers locate their facilities predominantly in neighbourhoods with a high socio-economic status, even though public funding, which covers a large fraction of production cost, is the same in all neighbourhoods? And do all non-profits behave the same? These questions are particularly pressing from a policy perspective, as childcare has been shown to be especially beneficial for children from disadvantaged backgrounds (e.g. Felfe and Lalive, 2018). Lower spatial accessibility of childcare services in low-status neighbourhoods therefore suggests that taxpayers’ money is spent inefficiently.
Vienna thus represents a paradoxical case of a universal childcare system, with a high share of public funding and no for-profit provision, but considerable inequalities in spatial accessibility of childcare. We argue that the mere differentiation between public, for-profit and non-profit provision is not detailed enough when it comes to explaining these inequalities. This is due to the immense heterogeneity within provider types, particularly among non-profit providers, ranging from big chains to church-related associations and parent-led cooperatives. These non-profit provider types may differ in multiple ways – by having different target groups (e.g. children with a certain religious affiliation), offering different services (e.g. alternative pedagogical approaches) or a varying need for parental involvement in childcare service production (e.g. cooking meals, cleaning facilities) (Leviten-Reid, 2012). Some may seek to provide services that go beyond the usual offer at higher prices (e.g. bilingual education, alternative pedagogy, lower child-to-staff ratio), which we denote as ‘special services’ henceforth. These aspects influence the providers’ location choices in cities by choosing neighbourhoods where they find the appropriate conditions as well as the demand for the specific services they offer. Thus, an analysis that only differentiates between public, non-profit and for-profit institutions may not fully capture the complexities of childcare accessibility disparities. Due to the small catchment areas of childcare centres (Hotz and Xiao, 2011), in particular in urban markets (Pennerstorfer and Pennerstorfer, 2019), a spatially uneven distribution of services will also lead to unequal use of services by children from different socio-economic backgrounds.
Against this backdrop, this article scrutinises inequalities in spatial accessibility of childcare within a city across various types of public and non-profit providers in a tax-funded childcare system, and how accessibility is related to the socio-economic status of the neighbourhood. We ask, first, whether specific types of providers (i.e. public providers, chains of non-profit providers, church-related non-profit providers as well as independent non-profit providers) contribute to such inequalities in spatial accessibility. In the second part of the empirical analysis, we investigate factors that may cause these inequalities, namely quantitative differences in local demand and resources as well as demand heterogeneity.
For our analysis, we use data on the supply and demand of childcare for children aged 0–5 years in the city of Vienna, Austria. We combine information on the spatial location of all childcare centres and on prices and other provider characteristics with demand indicators and neighbourhood characteristics. Data on the spatial distribution of children and on socio-economic indicators of the resident population are available at a very granular level (i.e. at the level of 250 m grid cells), which allows for an accurate and flexible definition of catchment areas and neighbourhoods.
We find that two types of non-profit providers in particular are linked to higher accessibility of childcare in neighbourhoods with higher socio-economic status. By accounting for the heterogeneity among providers, which is hardly done in the existing literature, we thus contribute to a better understanding of the location decisions of providers in urban areas. Additionally, we find a possible explanation for these location choices: some providers behave more market-like than others in a system that is largely tax-funded. Our results suggest that equal public funding for childcare across all neighbourhoods does not make it sufficiently attractive for some providers to locate in socio-economically weaker areas where relying on additional parental contributions is much less feasible.
Explaining spatial inequalities in (non-profit) childcare provision
A multitude of reasons may explain inequalities in childcare use across countries, regions and neighbourhoods, and among children from different socio-economic backgrounds (Pavolini and Van Lancker, 2018; Van Lancker and Ghysels, 2016). In this paper, we focus on the spatial accessibility of childcare, which is particularly important for socio-economically disadvantaged groups and therefore plays a key role in ensuring equal use of childcare. Longer travel between home and childcare facilities, which must be done twice a day, incurs transportation costs (especially time). This presents logistical challenges for parents (McLean et al., 2017), with shorter distances not only being safer and more convenient, but also cheaper (Lee and Jang, 2017). Equal access to services for equal needs, regardless of where one lives, aligns with the principle of territorial justice (see e.g. Boyne and Powell, 1991). This is especially important for welfare services, as their proximity often determines their use.
According to theories on the spatial distribution of (non-profit) service providers, providers are located either where the need for their services is greatest or where the most resources (to provide these services) are available. The conditional demand heterogeneity hypothesis (Zuhlke, 2022) combines both approaches and argues that service delivery most likely occurs in places where those exerting demand also have access to resources. Starting with the demand for services, theories on the existence of non-profit organisations hypothesise that such organisations emerge to fill a gap resulting from public failure (Weisbrod, 1977). Accordingly, non-profit childcare providers locate in places where there is a quantitative undersupply of public provision, as this is where the need is greatest. Consequently, non-profits reduce inequality in spatial accessibility of services. Weisbrod’s (1977) theory was later modified to focus on qualitative undersupply. In this view, non-profits respond primarily to citizens’ demand heterogeneity. For example, parents may seek alternatives to a uniform pedagogical concept in public childcare facilities (e.g. James, 1987). In contrast to the considerations above, a heterogeneity in preferences could actually amplify spatial inequalities in supply if groups having such preferences are unevenly distributed spatially. If parents in high-status neighbourhoods exercise particular preferences (e.g. bilingual childcare), this could explain a higher density of non-profit providers offering such services in these neighbourhoods.
Turning to resources, the location of non-profit providers may also depend on spatial variations in the availability of necessary resources, such as funding or human resources. According to the resource dependence theory, organisations locate where significant resources are available (e.g. Grønbjerg and Paarlberg, 2001). This positive relationship is found to weaken when non-profits receive a larger share of their funding from the government (e.g. Clifford et al., 2013). Local variations in funding availability should therefore not matter significantly in a largely tax-funded childcare system. However, they could matter if tax funding is insufficient to cover provider costs, in particular if parents in high-status neighbourhoods demand special services. In addition to financial resources, local differences in the availability of human resources may also play a role in explaining where non-profits locate (e.g. Grønbjerg and Paarlberg, 2001). In the present context, human resources include the co-founding of a childcare centre by parents or the regular volunteer work that many non-profit organisations rely on (Leviten-Reid, 2012). Prerequisites for providing such human resources, such as skills, time and social networks, are unevenly distributed across socio-economic groups and therefore vary between neighbourhoods (Musick and Wilson, 2008).
As mentioned, the conditional demand heterogeneity hypothesis (Zuhlke, 2022) combines both explanatory approaches, indicating that the location choice of childcare facilities is influenced by the number of children in a particuar neighbourhood, their parents’ preferences regarding educational institutions and the distribution of resources in the respective neighbourhood. Accordingly, we argue that non-profits are more likely to respond to demand heterogeneity in neighbourhoods where more resources are available. While empirical evidence on childcare facilities is limited, this pattern has been documented in numerous studies for the spatial distribution of schools. Edmark (2019), for instance, shows for Sweden that privately provided independent schools were more likely to choose locations with a larger share of students with highly educated parents. In many countries, parental choice has led to ‘the perpetuation of inequality’ (Cordini et al., 2019) and students in private schools more often come from a background of high income and high socio-economic status (e.g. Figlio and Stone, 2001).
In our analysis, we thus take both the demand and supply of childcare into account. For the demand side, these are the number of children and the heterogeneity of their parents’ preferences, in terms of both quantity (i.e. the age when children start attending childcare) and the type of service (such as bilingual education). In terms of available resources, these are the parents’ ability to pay higher prices and to volunteer regularly. While these factors may determine the quantity of supply and the composition of types of providers across neighbourhoods of different socio-economic status, they may not apply to all types of providers equally. Rather, different types of non-profits could behave differently depending on their target group, size, pre-existing infrastructure (such as parish property) or ideological and pedagogical orientation. Non-profit childcare providers that are small and rely on volunteering, or those founded by parents, may be better able to offer special services that meet the heterogeneous preferences of parents. Larger providers with many branches, in contrast, may be less able to do so and offer standardised services, but may profit from economies of scale.
Childcare provision in Vienna
Cross-country comparison shows that childcare systems vary greatly, especially with regard to two supply-related aspects: funding, that is, the way childcare is financed, and the provider structure, that is, the institutions that provide the service. Funding can range from a universal system, largely financed by taxes, to a system financed privately by the users (i.e. the parents), with more disadvantaged groups usually receiving public subsidies. The latter system is therefore described as a targeted system (OECD, 2006). The provider structure can include public and private for-profit as well as private non-profit providers of childcare services.
Vienna constitutes an example of a universal childcare system. The range of formal childcare is very diverse and includes crèches and kindergartens as well as mixed-age facilities. It is provided either by public facilities operated by the City of Vienna or by licensed private non-profit facilities. While about 43% of all 0–2 year olds in Vienna attend formal childcare, 89% of all 3–5 year olds do (Statistik Austria, 2021), partly reflecting that attendance is mandatory for children in the last year before they start school at the age of six in Austria.
The system of formal childcare is mainly publicly funded. Specifically, private non-profit providers receive a monthly subsidy per child from the city government. In addition, non-profit operators also receive a subsidy for administrative costs, which increases with the size (measured as number of places) of the provider. For-profit operators, on the other hand, are not eligible for public funding, which is why there are no for-profit childcare facilities in Vienna (Stadt Wien, 2023). This implies that full-day attendance is basically free of charge for parents. They only have to pay for meals. Some childcare centres, however, offer special services (e.g. bilingual childcare) and if parents choose such a childcare centre, they have to bear the additional costs.
The number of childcare centres amounts to 1477, providing around 94,000 places in Vienna in 2020 (see Table A1 in Online Appendix A). About one third of all places is provided by the City of Vienna and two-thirds by non-profit providers, which can be classified into three different types. The first category, so-called ‘chains’, consists of two large providers, each operating a chain of 144 and 83 childcare centres respectively. The second category, ‘church-related providers’, comprises a total of 144 Catholic and Protestant childcare centres. Many of them are located on parish property, influencing their location choice. The third category, which includes all 742 remaining non-profit providers, is labelled ‘independent non-profits’. In this category we find childcare providers operating between one and 24 childcare centres at various locations, but 42% of them operate only one centre with a single group, corresponding to a capacity of between 15 and 25 places.
Data and method
To answer our first research question, whether socio-economic inequalities in spatial accessibility of childcare are associated with different provider types, we take children as units of analysis. For each child, we assess the spatial accessibility of childcare and analyse how this accessibility is related to neighbourhood status and how different types of providers exacerbate or mitigate spatial inequalities in provision. To investigate factors that may cause these inequalities (our second research question), we first assess whether differences in demand are important. One may argue that spatial accessibility in high-status neighbourhoods may be higher due to higher demand for this service, because more affluent and better educated parents may have higher opportunity costs of time and higher labour participation rates. This argument might be plausible for toddlers (children under three), as only 43% of them attend formal childcare. However, 89% of all children between the ages of three and five attend a childcare centre, which is compulsory for children in their last year before starting school. Consequently, the demand for childcare for these older children should be proportional to the number of children and thus independent of the socio-economic status of the parents or the neighbourhood. We therefore examine whether spatial accessibility is related to neighbourhood status in a different way for younger children than for older children. In a further step, using childcare centres (more specifically, places in childcare centres) as units of analysis, we examine whether different types of providers are more responsive to local resources or demand heterogeneity in neighbourhoods with a higher socio-economic status. Although non-profit providers are not profit-maximising, they have to cover their costs and meeting this necessary requirement is influenced by parents’ resources and preferences. Taking the perspective of (particularly non-profit) providers allows us to analyse their behaviour and thus contributes to a better understanding of the sources of inequality in the spatial accessibility of childcare.
We combine different types of data to address these questions. All data are available at the level of exact locations or at the level of 250 m grid cells. Based on these data, we (a) derive a measure of spatial accessibility for each child, (b) use information on prices, parental volunteering requirements (i.e. parental resources) and special services (i.e. demand heterogeneity) for each place in each childcare centre and (c) calculate neighbourhood characteristics for children and childcare facilities. Finally, we (d) describe how we link these variables in the empirical analysis.
(a) Spatial accessibility: To derive a measure of spatial accessibility, we apply a variant of the two-stage flowing catchment area (2SFCA) method, first proposed by Radke and Mu (2000) and Luo and Wang (2003). In a nutshell, spatial accessibility measures the ratio between supply (the number of places) and demand (the number of children) in a child’s neighbourhood. The data on spatial distribution of demand (children) were collected by Statistics Austria in 2020 and are available at the grid cell level. Statistics Austria places regional statistical grid units over the entire territory of Vienna. The grids are independent of administrative boundaries and the size of one grid cell is 250 m × 250 m. As these data include demographic information on the residential population, we can identify the number of children under six years residing in each grid cell to measure local demand accurately. In 2020, 118,520 under six-year-olds lived in Vienna. Data on supply was provided as open government data by the city government (Stadt Wien, 2020) and includes the exact location (address), size (number of places) and type of provider of each childcare centre in Vienna for the year 2020. To relate children with childcare centres, we supplement the childcare centres’ addresses with coordinates to link the centres’ locations to grid cells and thus to demand. 1
The measure of spatial accessibility is calculated in two steps: First, we compute the degree of potential coverage of centre
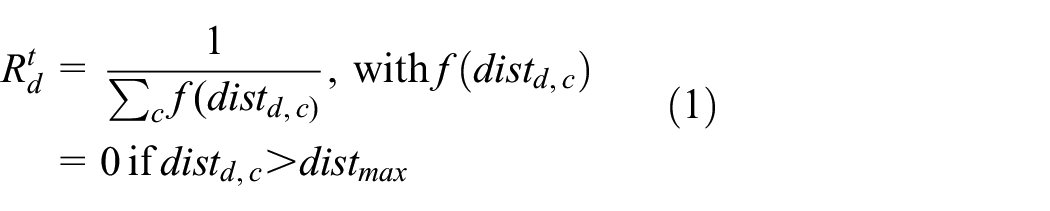
In the second step, we aggregate the number of childcare centres of type t within 500 m of child
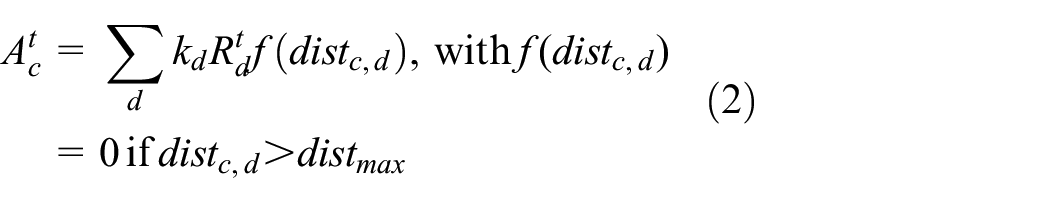
The indicator of spatial accessibility
(b) Information on prices, parental volunteering requirements and special services To collect this information, we contacted all childcare centres by phone or email between 1 October 2020 and 30 April 2021. More precisely, we asked about monthly prices for parents by category (e.g. costs for meals, extended opening hours), whether parents were required to volunteer on a regular basis (e.g. cleaning facilities, cooking meals) and whether the centre offered special services. Of all the childcare centres 71% provided this information to us, accounting for 80% of all places. The information was collected separately for different groups at a single childcare centre (e.g. services for children aged 0–2, for children aged 3–5 and for heterogeneous age groups), especially because prices can differ for different groups. We aggregate all monthly payments to obtain a comprehensive price indicator. Summary statistics, provided in Table A3 in Online Appendix A, show that parents have to pay about 134 Euros per month on average. Average prices are highest for independent providers (205 Euros) and lowest for public childcare centres (68 Euros). Note that all public centres charge the same price, while price differences are largest for independent providers. Centres run by chains or churches charge prices in between, in terms of both average prices and price dispersion. Regarding human resources, we observe whether a regular volunteer engagement of all parents is required at least once a month. It is striking that 5% of independent non-profits require regular parental volunteer engagement, whereas none of the other types of providers do so. To evaluate demand heterogeneity, we observe whether the childcare centre offers special services. While public childcare centres do not provide special services, they are offered by 9% of chains, 7% of church-related providers and as many as 38% of all independent providers (see Table A3 in Online Appendix A).
(c) Neighbourhood characteristics: To derive an indicator of the socio-economic status of a neighbourhood, we use data on education of the residential population. We focus on education rather than income because Alm Fjellborg and Forsberg (2023) show that pre-school segregation is more strongly related to education than income, especially in urban agglomerations. Data on the highest formal educational attainment is provided at the 250 m grid cell level for the year 2018. We define the neighbourhood by drawing a circle with a 500 m radius around each child and each childcare centre, respectively. We thus consider all grid cells to be part of a child’s or centre’s neighbourhood, if the airline distance between (the centroids of) the two grid cells is 500 m or less. The socio-economic status of a neighbourhood is defined as the share of residents with a university degree or equivalent, among those who are over the minimum working age of 15. In addition, we include the share of residents born in Austria, in (other) EU countries and outside the EU, the female employment rate and information on public transport infrastructure within the neighbourhood as indicators for (potential) demand (applying the same definition of neighbourhood). Details of these control variables can be found in Online Appendix A.
(d) Empirical approach: To address the first research question, we use children as the unit of analysis and evaluate the spatial accessibility

The variable
To address our second research question, which aims to investigate factors that may cause the results from equation 3, we perform the previous analysis separately for younger and older children, as the demand for childcare should only be related to the socio-economic status of the parents of younger children. Additionally, we examine whether and how childcare centres respond to differences in demand and available resources across neighbourhoods. One way of responding is through location choice, resulting in different types of providers being located in neighbourhoods of different socio-economic status (selection effect). This response is directly visible in the regression results of equation 3. In addition, even childcare centres of the same provider type may respond to the available resources and local preferences by demanding more resources from parents (by charging higher prices or requiring volunteer work) or by offering special services more often in high-status neighbourhoods. Therefore, for each of the three outcome variables (i.e. prices, parental volunteering and offered special services), we evaluate for every place g of childcare centre d of provider type t,

where
Results
Neighbourhood status and spatial accessibility of childcare by provider type
Are certain types of providers spread more unevenly across the city than others, even if we control for the spatial distribution of children? The regression results on socio-economic inequalities in spatial accessibility of childcare by provider type are reported in Table 1. When investigating the accessibility to childcare centres of any type of provider (first column), neighbourhood status and accessibility are positively and significantly (at the 10% level) related, indicating that children living in neighbourhoods with a higher share of residents with a university degree have a higher accessibility of childcare. Splitting the measure of spatial accessibility by different provider types (columns 2–5) shows that the accessibility of childcare centres run by the church or by independent providers increases with the socio-economic status (SES) of the neighbourhood, whereas public providers are more easily accessible in lower status neighbourhoods. Neighbourhood SES and accessibility of chain providers, however, are not significantly related. There is little effect on the relationship between neighbourhood SES and spatial accessibility when control variables are excluded (see Table C1 in Online Appendix C), and the results are not sensitive to alternative catchment areas, distance decay functions or neighbourhood definitions (see Tables C2–C5 in Online Appendix C).
Accessibility and neighbourhood status: Main results.
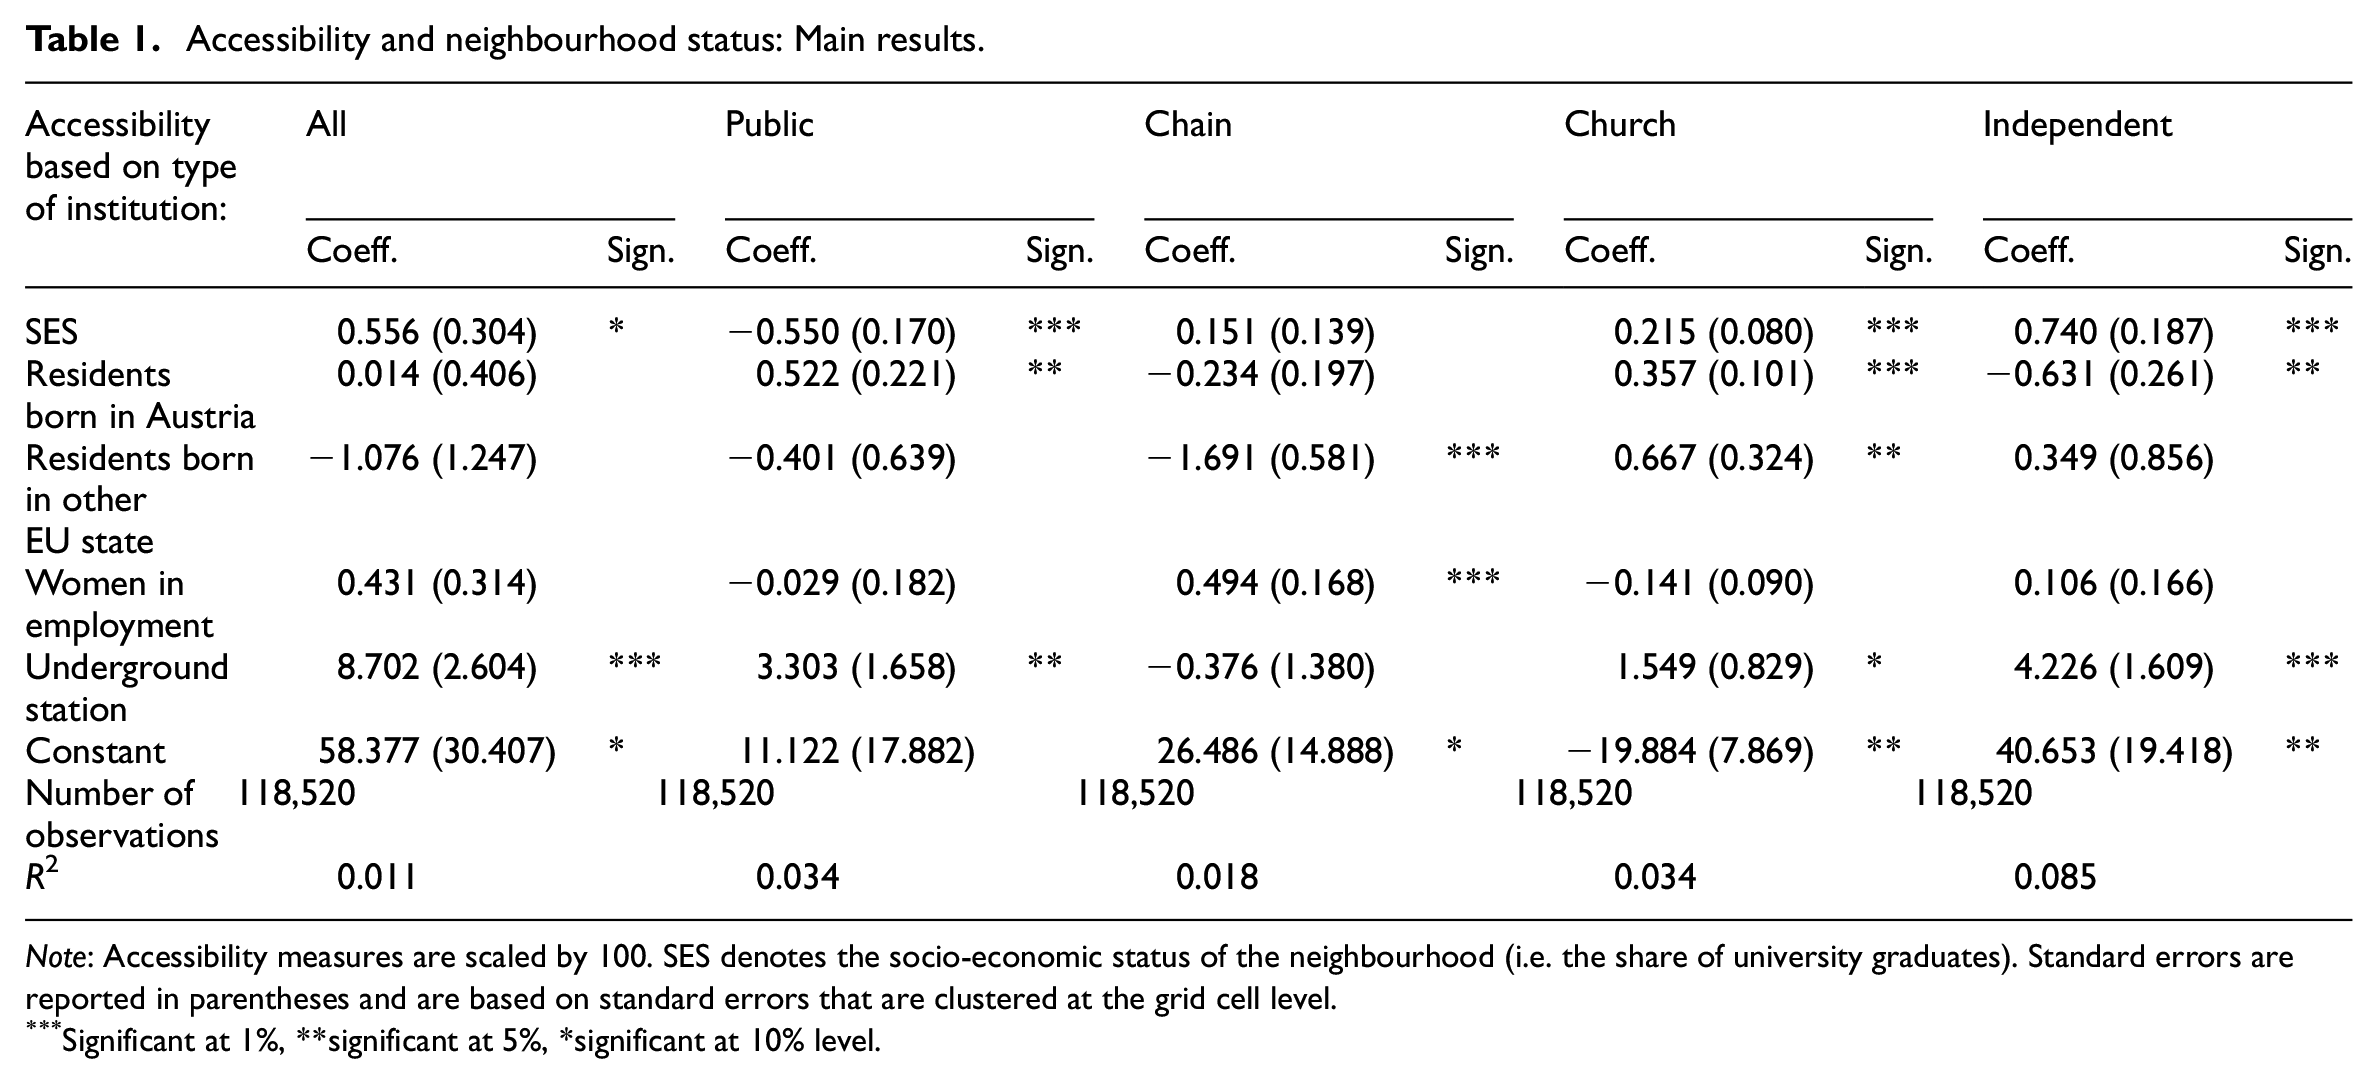
Note: Accessibility measures are scaled by 100. SES denotes the socio-economic status of the neighbourhood (i.e. the share of university graduates). Standard errors are reported in parentheses and are based on standard errors that are clustered at the grid cell level.
Significant at 1%, **significant at 5%, *significant at 10% level.
While Table 1 clearly shows which types of providers contribute to the inequality in spatial accessibility of childcare, the magnitude of the contribution is more difficult to discern because spatial accessibility is an index, making the size of the coefficients difficult to interpret. To illustrate the magnitude of the results, we compare the expected values of spatial accessibility between neighbourhoods with high and low SES. To do this, we calculate expected values of spatial accessibility – both for all centres and separately for each provider type – based on the observed SES in the neighbourhood of the children’s residence, the mean values of all control variables and the parameter estimates reported in Table 1. We define high- and low-status neighbourhoods by taking specific percentiles of the upper and the lower part of the distribution of the share of residents with a university degree in the neighbourhood (i.e. the SES variable) and plot the ratios of spatial accessibility between high- and low-status neighbourhoods in Figure 1.
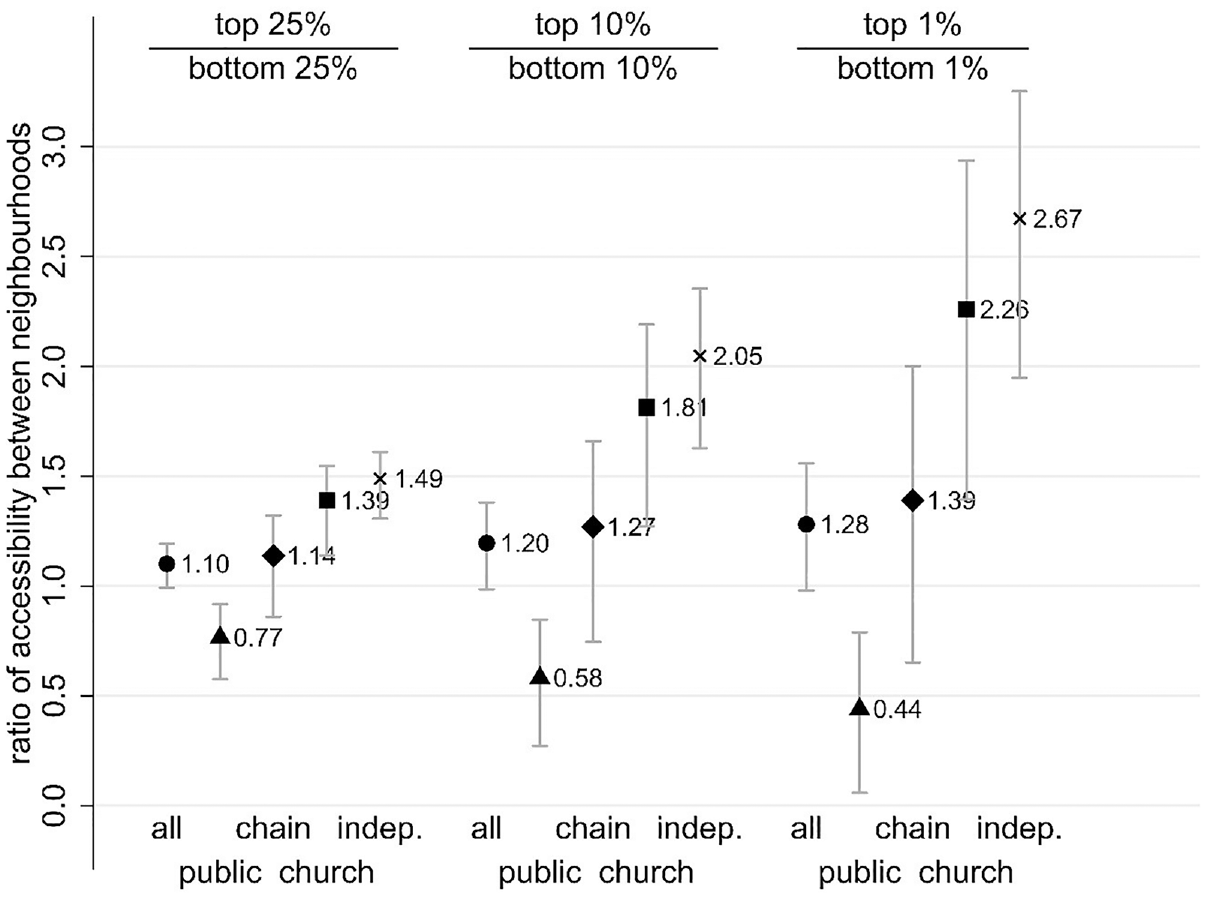
Ratio of expected spatial accessibility between neighbourhoods of high and low socio-economic status.
For the first column of Figure 1, we define the 75th and 25th percentiles as high-status (top 25%) and low-status neighbourhoods (bottom 25%), respectively. The results show that the ratio equals 1.10 for all providers, indicating that spatial accessibility is 10% higher in the high-status neighbourhoods. This figure increases to 20% if we compare the top 10% to the bottom 10% neighbourhoods (second column), and even further to 28% if we compare the top 1% to the bottom 1% of all neighbourhoods (third column of Figure 1). Investigating accessibility of the different provider types reveals that public providers are less accessible in high status neighbourhoods, with a ratio between ‘top’ and ‘bottom’ neighbourhoods of 0.77, which is significantly smaller than 1. Comparing the top 25% to the bottom 25%, we thus find that accessibility of public institutions is 23% lower in high-status neighbourhoods. This indicates that they have a countervailing effect to the overall better accessibility there. Second, we find that all types of non-profit providers contribute to overall inequality, but certain types contribute more than others. Chain suppliers display only a moderately and not statistically significantly higher accessibility in high-status neighbourhoods (14% higher accessibility in the top 25% of all neighbourhoods compared to the bottom 25%). Church-related and independent providers, however, contribute to the overall inequality to a greater (and statistically significant) degree. Spatial accessibility of church-related providers is 39% higher for the top 25% as compared to the bottom 25% of all neighbourhoods. For independent providers, this amounts to even 49%. Turning to the second and third columns of Figure 1, we see that these two numbers increase quickly. As shown in the third column of Figure 1, accessibility of independent providers is 167% higher in the top 1% of all neighbourhoods than in the bottom 1%.
Factors that may cause inequalities in spatial accessibility
In this second part of the empirical analysis, we examine factors that may cause the spatial inequalities identified above. To do so, we first check whether socio-economic inequalities in spatial accessibility might be driven by quantitative differences in demand between socio-economic groups. Even if better educated and more affluent parents have a higher demand for childcare services, these differences should only affect the results for toddlers, as almost all children aged three and over are in formal childcare. However, we find similar results for both age groups, in particular for public and independent non-profit providers. For these two provider types, the spatial accessibility in high- relative to low-status neighbourhoods is almost identical for both age groups. These results are displayed and discussed in Online Appendix B only, for reasons of brevity (see Figure B1, Tables B1 and B2). The similar results for both age groups suggest that possible differences in demand are not a plausible explanation for the better accessibility in higher socio-economic status neighbourhoods.
Second, we analyse whether childcare centres in higher-status neighbourhoods demand more resources from parents. To do so, equation 4 is estimated, restricting the coefficients to be the same for all provider types. By doing so, we can analyse whether childcare supply varies between neighbourhoods of different SES. The results, displayed in Table B3 in Online Appendix B for brevity, show that childcare centres in higher-status neighbourhoods charge significantly higher prices (at the 1% significance level), are more likely to require parental volunteering (at the 10% level) and to offer special services (at the 1% level). These positive correlations might be due to the observation that provider types which are on average more expensive and more likely to require volunteer work and to offer special services (in particular independent providers) are more often located in neighbourhoods with a higher socio-economic status (selection effect).
Third, to examine whether childcare centres (even of the same provider type) behave differently, depending on the neighbourhood status, we first focus on prices and regress the monthly prices on neighbourhood characteristics, as described in equation 4. The parameter estimates (see Table B4 in Online Appendix B) show that the price of all public providers is the same, namely 68.23 Euros (see also Table A3), which is the cost of the meals only. Likewise, prices charged by chains are independent of the neighbourhood status, while the relation between neighbourhood status and prices is significantly positive for both church-related and independent providers. While the increase is moderate for church-related providers, it is more substantial for independent ones: a 10 percentage point increase in the share of residents with a university degree is associated with a price increase of 16.32 Euros per month for church-related providers (statistically significant at the 5% level) and 50.77 Euros per month for independent providers (statistically significant at the 1% level).
To emphasise the magnitude of the estimated parameters, we display the predicted values of the dependent variable (monthly prices) at varying levels of neighbourhood status in Figure 2, while all other neighbourhood characteristics are set to their mean values. The graphical illustration shows that public childcare centres are cheaper than all non-profit providers for all levels of neighbourhood status: even at low levels of education (i.e. 5% university graduates), non-profit providers are between two and 2.5 times as expensive. For church-related and especially independent childcare providers, the gap widens as the socio-economic status of the neighbourhood increases: childcare centres related to churches and independent providers are about three times and nearly five times as expensive as public childcare centres, respectively, if neighbourhood SES is very high (i.e. 45% university graduates).
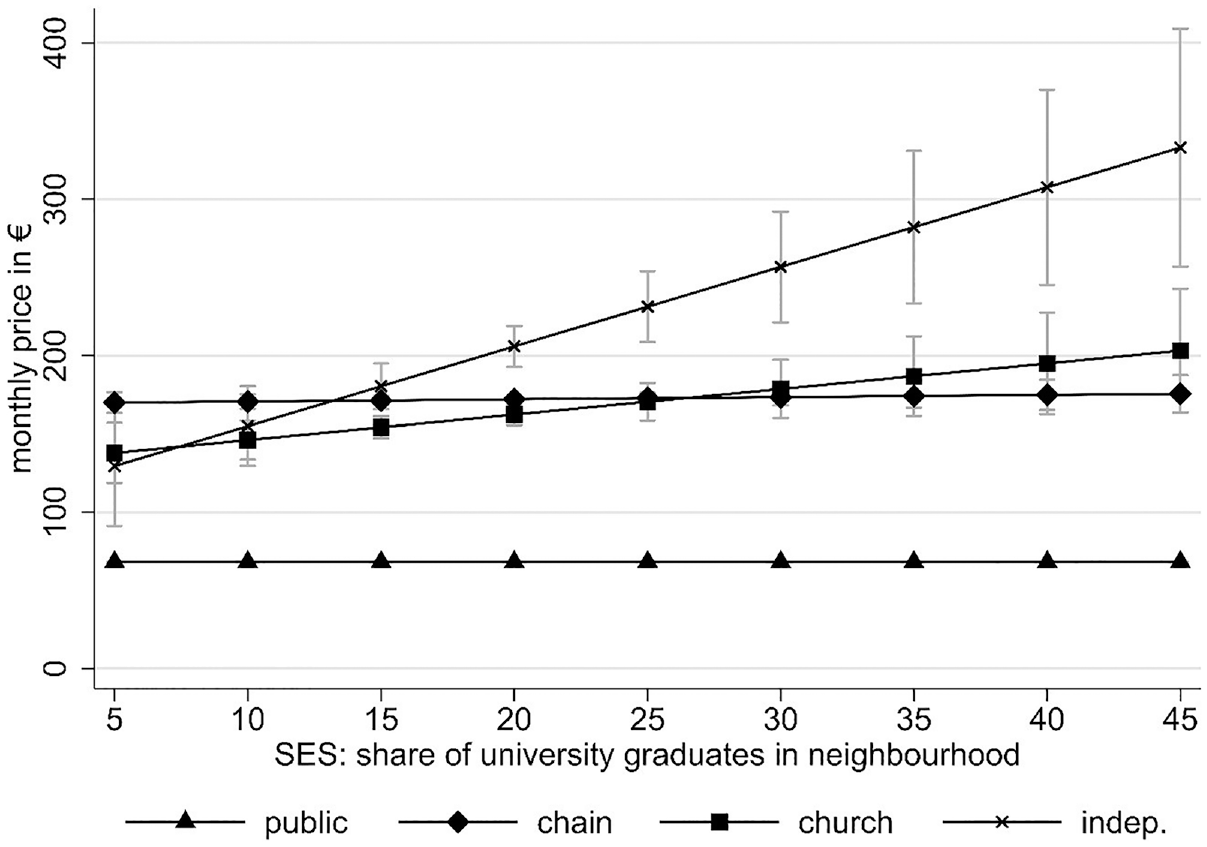
Expected monthly prices for childcare by neighbourhood status.
To investigate whether the need for volunteering or the provision of special services within a provider type is related to neighbourhood status, we restrict the sample to independent providers, as only (mainly) independent providers require volunteering (offer special services). The corresponding results, reported in Table B5 in Online Appendix B, show that neighbourhood status is positively and significantly related to special services, but not to parental volunteering. This suggests that independent providers are even more likely to provide special services if they are located in high-status neighbourhoods. We do not find this pattern for parental volunteering.
Summing up, these results suggest that quantitative differences in demand cannot explain higher accessibility to childcare in high status neighbourhoods. Instead, we find that childcare centres in high-status neighbourhoods demand more financial and human resources from parents, but also provide special services more often. This result can be partly explained by the observation that provider types that require the most resources and provide the most heterogeneous services (especially independent providers) locate more often in these areas. Additionally, we find that childcare centres of the same provider type behave differently by charging higher prices and offering more special services in high-status neighbourhoods.
Discussion
This article scrutinises inequalities in the spatial accessibility of formal childcare between public and different types of private non-profit providers. While we find that the observed inequalities are linked to the location of non-profit providers in neighbourhoods with higher socio-economic status, not all non-profit providers behave the same. To a large extent, it is the independent and church-related non-profit providers that contribute to these inequalities, whereas chain non-profit providers are spread relatively equally across the urban space. Given that services are mainly funded by taxes and that public funding is the same for all locations, it is initially puzzling that some non-profits behave in a qualitatively similar way to providers in a fully demand-financed system (e.g. Noailly and Visser, 2009), namely by concentrating in high-status areas. However, public funding is not the only source of revenue. Those types of non-profit organisations that on average charge the highest prices are most likely to require volunteering and offer special services, that is, the independent ones, are predominantly located in high-status neighbourhoods and thus shape the supply of childcare there. Even within the group of independent non-profits, prices are higher and special services are more likely to be offered in high-status neighbourhoods, where residents can more easily afford additional costs and – most likely – have more heterogeneous preferences regarding the type of service. This aligns with the conditional demand heterogeneity hypothesis (Zuhlke, 2022), which states that non-profits emerge where they find both sufficient resources and demand heterogeneity. At the same time, these results suggest that public funding is not sufficient for all non-profit providers to ensure childcare that satisfies (qualitative and quantitative) demand in all neighbourhoods.
A limitation of our study is that we only measure the potential demand and not the actual one. Due to data restrictions, it is not possible to combine socio-economic and residential information of parents with their actual choice of childcare centres. Such data would enable an analysis of the consequences of inequality in spatial childcare provision. Do parents of children in socio-economically worse-off neighbourhoods accept longer commuting times or do they not take up formal childcare places? Does a different composition of provider types in these areas influence pre-school segregation? In addition, future research should also take further quality differences of childcare into account when evaluating inequalities in childcare provision across space.
One can also question the direction of causality. Is the accessibility of childcare higher because a neighbourhood has a high socio-economic status, or is it the other way round – highly educated parents move to neighbourhoods with a high supply of childcare? We argue that the former explanation seems more plausible, as time-series data show that the average educational levels of residents in a neighbourhood hardly change, with a correlation of 0.98 between the status in 2011 and 2018. More importantly, we believe that the question of causality is of secondary importance in this analysis. Even if households do move to areas with higher childcare provision, the main problem remains: there is unequal spatial access to childcare, as some households may be more mobile and therefore better able to respond to this inequality than others.
The aim of this study is to better understand the location decisions of non-profit childcare providers in a tax-funded childcare system in urban areas. Based on our findings, in order to reduce inequalities in spatial accessibility of childcare, we propose either a general increase in public funding or one only for small providers, as they receive lower subsidies for administrative costs in the current system. Alternatively, the funding mechanism could be changed in a way that facilities in low-status neighbourhoods receive higher funding, as it seems that high-quality services can only be provided when additional resources (which otherwise must be provided by parents) are available. In addition, the city government could either increase public provision or seek to increase the supply of chain non-profit providers to reduce inequalities in accessibility.
Our results underline the importance of public providers because of their balancing effect. In cities with lower public childcare provision, the negative effects of the strategic behaviour of non-public actors on low SES groups would be greater, because the public sector could not compensate to the same extent as in Vienna. Of course, the results we find for the non-profit sector in Vienna do not necessarily apply to other cities in the same way, in the sense that church-related and independent childcare providers create spatial inequalities. Nevertheless, the case study for Vienna provides important conclusions for other cities – regardless of the funding system that is in place. First, the results show that the usual exclusive comparison of public, private non-profit and private for-profit providers is not detailed enough, as not all non-profit providers behave in the same way. Instead, their capacity, the additional resources they rely on or their ideological motives are relevant. While some provider types behave similarly to public institutions, others act in a more market-oriented manner, similar to for-profit or non-profit providers in a demand-financed system. A second important conclusion that can be generalised is that, in addition to the choice of which organisations are accredited, both the level of public funding (whether it is sufficient to cover costs) and the exact mode of public funding (depending on the resources available in different urban areas) are important tools for governments to achieve policy goals such as universal coverage and equal access in all neighbourhoods.
Supplemental Material
sj-docx-1-usj-10.1177_00420980241258298 – Supplemental material for Unequal access to childcare in cities: Is equal public funding sufficient?
Supplemental material, sj-docx-1-usj-10.1177_00420980241258298 for Unequal access to childcare in cities: Is equal public funding sufficient? by Astrid Pennerstorfer, Dieter Pennerstorfer and Michaela Neumayr in Urban Studies
Footnotes
Acknowledgements
The authors would like to thank Moritz Hörl for his assistance in preparing the dataset and the City of Vienna (Magistratsabteilung 10) for supporting data collection.
Declaration of conflicting interests
The author(s) declared no potential conflicts of interest with respect to the research, authorship, and/or publication of this article.
Funding
The author(s) disclosed receipt of the following financial support for the research, authorship, and/or publication of this article: The project was financed by the Jubiläumsfonds of the City of Vienna for the WU Vienna University of Economics and Business. The authors would also like to thank four reviewers and the editor for their valuable and constructive suggestions to improve the article.
Supplemental material
Supplemental material for this article is available online.
Notes
References
Supplementary Material
Please find the following supplemental material available below.
For Open Access articles published under a Creative Commons License, all supplemental material carries the same license as the article it is associated with.
For non-Open Access articles published, all supplemental material carries a non-exclusive license, and permission requests for re-use of supplemental material or any part of supplemental material shall be sent directly to the copyright owner as specified in the copyright notice associated with the article.