
Abstract
Aramid fiber ropes are widely used, owing to their high strength and abrasion resistance. Calculating the contact force in these ropes at the interface of the strand–strand contact is essential in understanding their internal degradation and predicting their lifetime. The energy required to induce this degradation is the product of both the contact forces and displacements at the strand–strand interface. This paper presents a novel approach to measure and compute the contact force at the strand–strand interface inside three-strand aramid fiber ropes under tensile loading by using pressure films between strands to measure contact pressure and contact width. The contact forces, calculated from these measurements, enable us to validate an analytical model. The effects of the geometrical parameters of the rope, such as rope twist, strand twist, and the number of filaments in the strand, on the contact force between strands are also investigated. Our study shows that increasing rope twist increases contact force, while increasing strand twist decreases contact width and increases contact pressure for the same tensile load, resulting in similar contact forces. Additionally, increasing the number of filaments leads to higher contact forces for the same tensile load per unit linear density of the fiber. Overall, our research provides insight on the effect of rope size and construction on internal pressure and subsequent internal degradation phenomena in ropes at different scales.
Synthetic fiber ropes have gained significant attention in recent times, owing to their advantages over metallic cables, such as higher flexibility, a higher strength-to-weight ratio, a longer lifetime, and safer handling.1–3 Typical synthetic fibers in such ropes include polyamide, polyester, and aramid. Aramids are categorized into para-aramid and meta-aramid. Para-aramids excel in tensile strength, whereas meta-aramids possess exceptional heat and flame resistance.4,5 Para-aramid fibers are used to manufacture ropes that find widespread application in industry, such as heavy lifting, mining, and mooring, 6 prioritizing their reliability and robustness. Using aramid ropes is more energy-efficient, compared with steel ropes, owing to their lighter weight for comparable tensile strength. 7 Aramid fiber ropes have been used in such industries as the marine, aerospace, and defense industries, owing to their exceptional strength-to-weight ratio and resistance to degradation.8–10 The mechanical behavior of ropes constructed from aramid fibers, such as Twaron, has been studied extensively, to extend their lifetime and performance.7,11–16
Ropes are constructed in numerous ways but are primarily classified as braided and laid ropes. An example of a laid rope is the three-strand rope, which comprises three twisted strands. Each strand is composed of several twisted yarns, and each yarn consists of numerous filaments twisted together. Owing to this hierarchical and twisted structure of a three-strand rope, the filaments in the rope have varying paths in space with respect to the rope’s axis, subjecting them to variable stresses. Introducing strand twist allows for load transfer in fiber bundles, increasing the rope’s strength to some extent. However, introducing twist in the fiber bundles also introduces fiber obliquity, which is the angle at which the fibers are positioned relative to the longitudinal axis of the rope. For a twisted yarn, it is estimated that the strength of the rope diminishes as a function of the cosine squared of the twist angle at the yarn surface, known as the helix angle. 17 Various experiments with twisted filaments of materials such as polyamide and aramid have shown that there is an optimal value of twist, beyond which the strength of the yarn starts decreasing because of its obliquity.2,17,18
Choosing a rope–strand twist combination that results in torque-neutral ropes while minimizing strand–strand contact forces is essential. Optimizing these twist combinations can significantly reduce contact compressive forces at the strand interfaces, thereby decreasing fiber damage. This reduction in internal wear can extend the operational lifespan of the ropes, enhancing their durability and performance.
Singletary et al.15,16 tested the compression behavior of Twaron 2200 fibers, identifying three distinct regions of fiber behavior under transverse compression, defined by normal compression strain (%). They estimated that, at a maximum value of 80 MPa, poly(p-phenylene terephthalamide) (PPTA) fibers would enter a plastic yield region, without crack formation, between 20% and 45% strain. A third region is characterized by fibrillation and disbonding of the fibers. After fibrillation, the fibers can withstand transverse compression and friction-induced shear between the disbonded entities, but they lose their ability to support tensile loads. This highlights the importance of accurately modeling the forces at the strand interfaces as a crucial step in quantifying internal degradation. 6
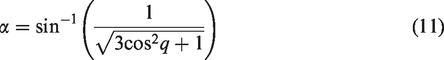
Three-strand ropes have commonly been modeled as double helix structures.13,19 Hsu 13 studied the various phenomena that occur in double twisted structures, focusing on fiber migration, internal normal forces in the rope’s cross-section, and how the orientation of the filaments changes across the strand. Rope twist and strand twist are key parameters that influence strand–strand contact pressure and thus determine the lifetime of a rope. 18 Higher rope twist results in a larger strand angle—the angle made by the strand axis with the rope axis—resulting in a higher component of force normal to the rope. Conversely, a higher strand twist generates higher inter-filament forces, increasing the packing density of the filaments in the strand. This results in strands with increased effective compression modulus. 20 Typically, the packing of filaments in the cross-section of a strand is geometrically represented as circles packed within a larger circle. For densely packed circles, studies have shown that a packing density of 0.87 can be reached. 21 Under normal loading, strand deformation mostly occurs as a result of filament migration within the strand.14,20 The resulting increase in the effective compression modulus results in higher contact pressures for the same normal force on the strand. 3 Analytical models can offer deeper insights into the mechanical behavior of twisted structures.
Both Batra 22 and Hearle 23 analytically modeled the mechanical behavior of twisted structures. Batra modeled a single twist structure—yarn—represented by a filament wound around a cylinder. The filament is geometrically represented as a helix. As the filament is loaded, a component of the force is generated in the normal direction as a function of the helix angle, location, and material properties of the filament. To calculate the total normal force in a strand, Batra assumed that the strand is filled with filaments in perfect packing and that the normal forces in the strand’s center result from the sum of contributions from each filament in each layer. The model’s inaccuracy arises from the fact that strands are not perfectly packed, so filaments might come into contact with up to six other filaments.
Hearle derived an analytical model to calculate normal pressure in twisted structures (yarns) in terms of tensile stresses on the yarn. He did this by dividing the yarn into equal elements and simplifying the structure by ignoring filament size. 23 Ultimately, Hearle 23 related the tensile stress on the rope axis to the normal stress on a layer of filaments in the strand, based on the radial location of the filament, material properties, amount of twist, and loading conditions. The models by Batra 22 and Hearle 23 do not account for double twist structures, such as ropes, where the strands are pre-twisted and then the rope is twisted, nor do they consider filament migration and strand flattening that occur at the contact points.
Later on, Hsu 13 expanded on Batra’s 22 and Hearle’s 23 models to study three-strand ropes with both rope and strand twists. Hsu 13 used Hearle’s 23 model to estimate the contact pressure within the strand and Batra’s 22 model to calculate the normal force applied by the strand. Hsu 13 then represented the normal force with two components, one for each strand–strand contact in a three-strand rope.
The contact forces and pressures obtained from Hsu’s 13 model have not, it seems, yet been validated experimentally. This is because measuring internal pressure in ropes is challenging, as pressure or strain sensors cannot be fitted into internal rope interfaces under loading without affecting the rope’s structure. In attempts to calculate contact pressure, Batra 22 and Batra et al. 24 placed a thin film between two identical silicone rubber yarns and determined the lateral force required to extract the films. Similarly, Ogata and Yoshida 25 introduced a thin metallic film between two identical polyamide-6 filaments to investigate the relationship between the yarn’s tension and the tape withdrawal force. These experiments approximated internal pressures for simplified strand-like structures indirectly by measuring the frictional force needed to remove a film from between these simplified strands, assuming a constant interfacial shear strength. However, these methods and assumptions introduce potential discrepancies, as direct pressure measurements were not utilized.
Pressure-sensitive films that change color in response to applied pressure have been employed to measure both contact area and contact pressure in such fields as biomedical and mechanical contacts.26–28 These findings indicate an overestimation of the actual contact area by 1.2–2.4% and an underestimation of the actual contact pressure by 8–14%. 27 Therefore, it is important to calibrate and standardize the pressure films accurately, for effective experimental measurements.
The existing literature indicates a clear research gap, owing to the lack of experimental studies and validated models for studying the effect of rope geometrical parameters, such as twist and size, on contact force in three-strand ropes. In this study, we aim to address this gap by experimentally investigating the effect of rope twist, strand twist, and the number of filaments on contact forces at the strand–strand interface, particularly in aramid three-strand ropes subjected to tensile loads.
Using calibrated pressure films, the contact pressure and contact width at the strand–strand interface were experimentally measured. The contact force between the strands was determined by multiplying the measured contact width by the contact pressure. The experimental results were then used to validate the model developed by Hsu. 13 Additionally, different combinations of rope size (number of filaments) with rope and strand twists were studied, and a scaling law was developed to calculate the contact forces in ropes of various sizes. Finally, the effectiveness of the analytical model in studying the effect of rope twist, strand twist, and the number of filaments on strand–strand contact force was evaluated.
The reason for using a three-strand laid aramid rope as the industrial specimen lies in its role as a fundamental case for comparing experimental results with the analytical model. Modeling twisted laid ropes as ideal helices is feasible, owing to their simpler geometry, and this provides a clear baseline for validating the analytical model. At a later stage, the methodology for measuring contact forces can be expanded using numerical or advanced analytical models to study more complex rope structures, such as braided ropes under different loading conditions.
Materials and methods
Preparation of rope samples
Three-strand rope samples composed of aramid fiber (Twaron 2200 1610f1000), with a varying number of yarns per strand, as well as with varying values of rope twist and strand twist, were selected for the tensile loading experiment. The linear density for each yarn measured in ambient conditions of temperature at 20°C and relative humidity at 65% is listed in Table 1 in dtex, which is a unit of measurement to express the linear density of a fiber: 1 dtex is equal to 1 g per 10,000 m of fiber length. Each yarn consists of 1000 filaments, and each filament has an average diameter of 12 µm.
Labeling of rope specimens with information about twist combinations
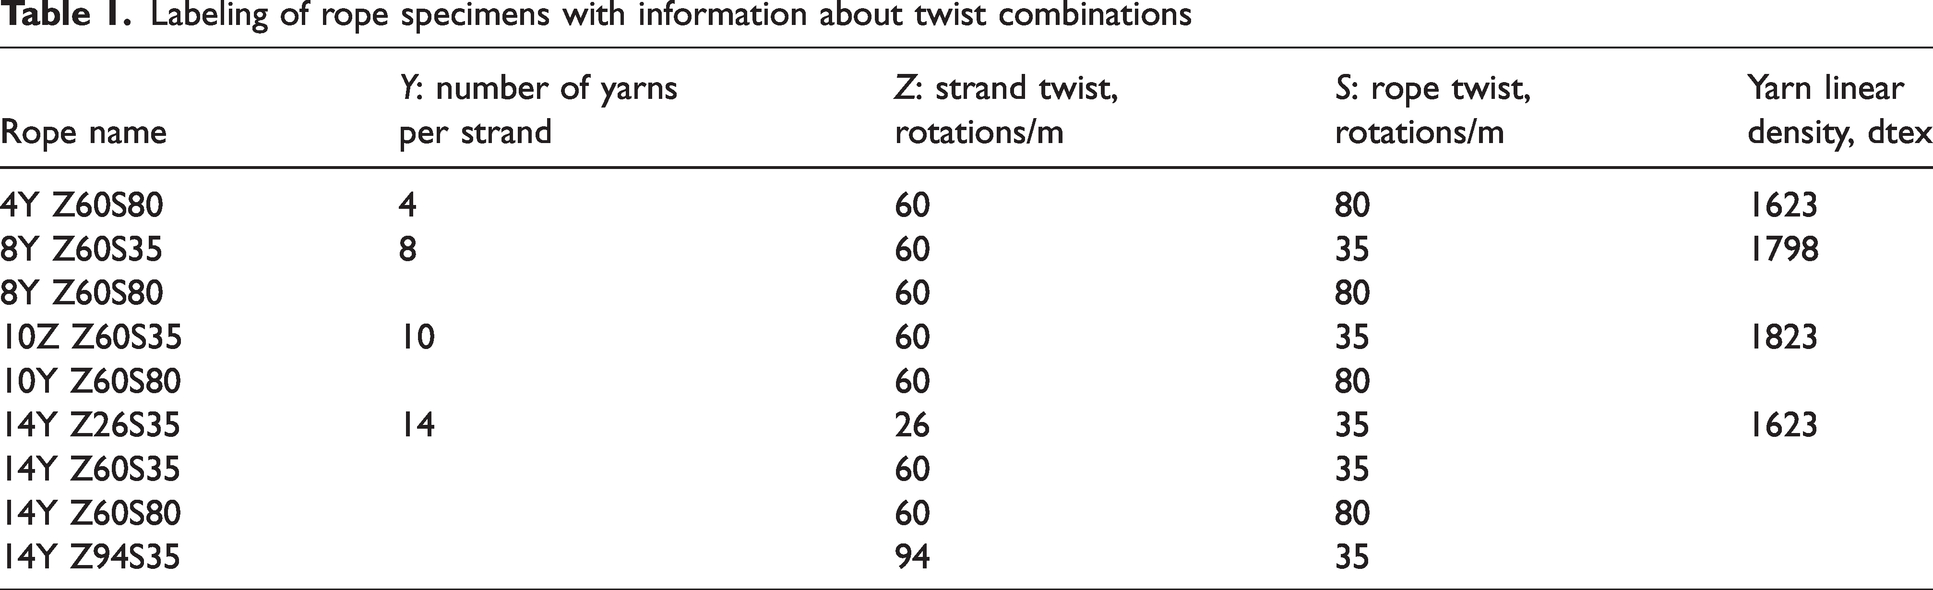
The ropes were carefully examined for any defects or damage that might affect the experimental measurements. A minimum of three ropes per twist combination were prepared and tested. A total of nine ropes, labeled based on their twist combinations and size, were tested, as listed in Table 1. The average breaking load for each yarn, as reported by the manufacturer, is 1.5 N/tex. Each yarn consists of 1000 filaments.
The main observation in samples with varying rope and strand twists, as shown in Figure 1, is that varying rope twists affect the angle that the strand makes with the rope’s axis (
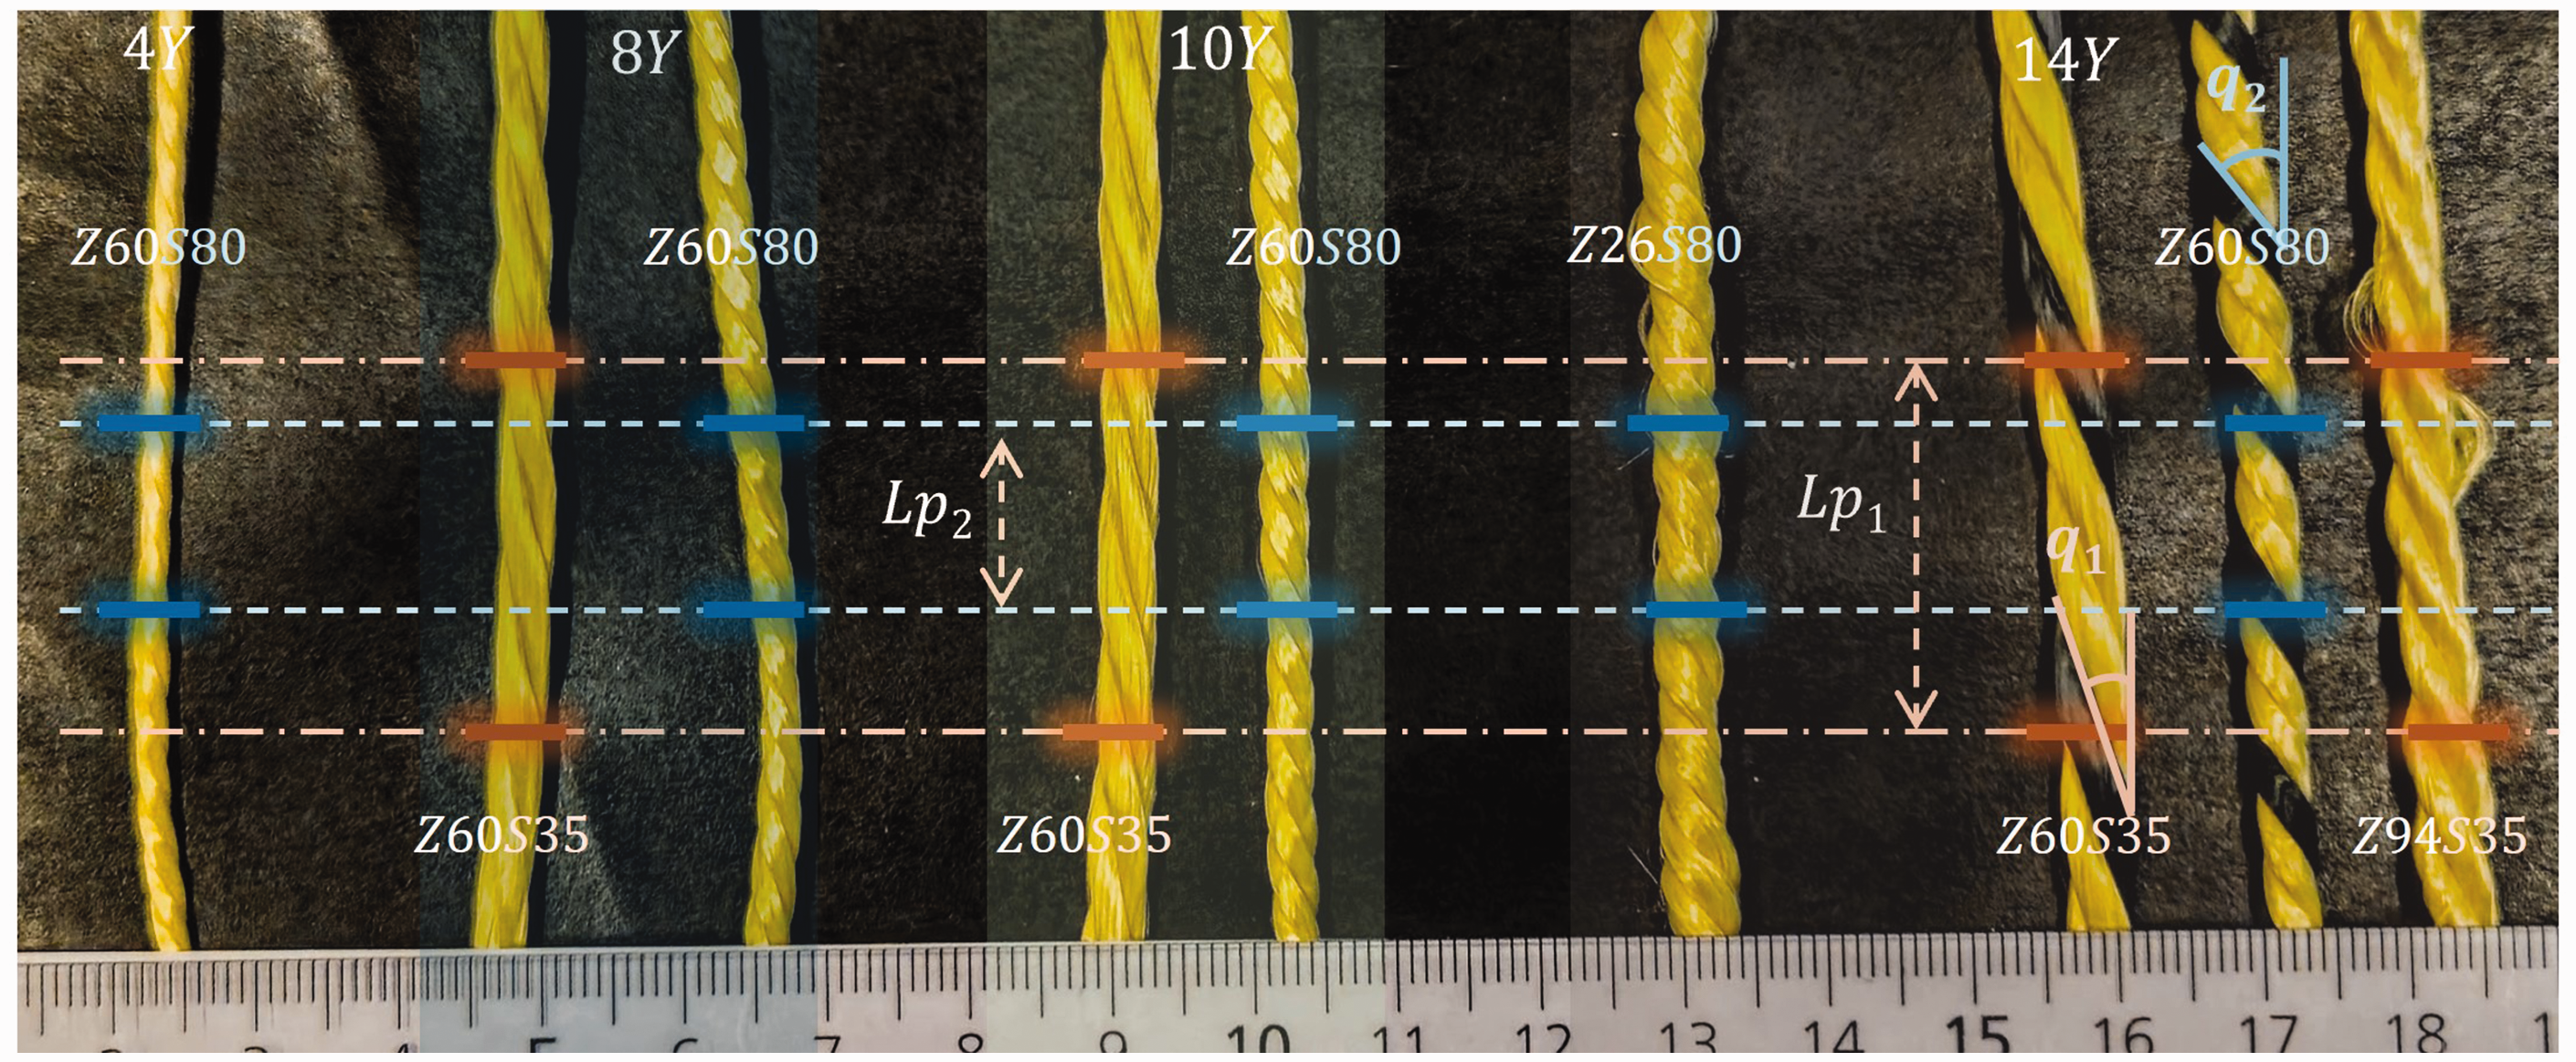
Various rope settings, as listed in Table 1. The images display the helix angle
Experimental setup for tensile loading
The rope is first spliced at its ends and each splice is inserted around a metallic pin supported by a U-shaped hook, as shown in Figure 2. The hooks are then gripped in a Zwick/Roell universal testing machine. The rope is then cycled at low load, to allow filaments to redistribute and settle, ensuring that no slipping occurs in the spliced region for experimental repeatability. Pressure films are then inserted between the strands, load is applied and held for 5 s, the rope is unloaded, and the pressure films are removed for analysis.
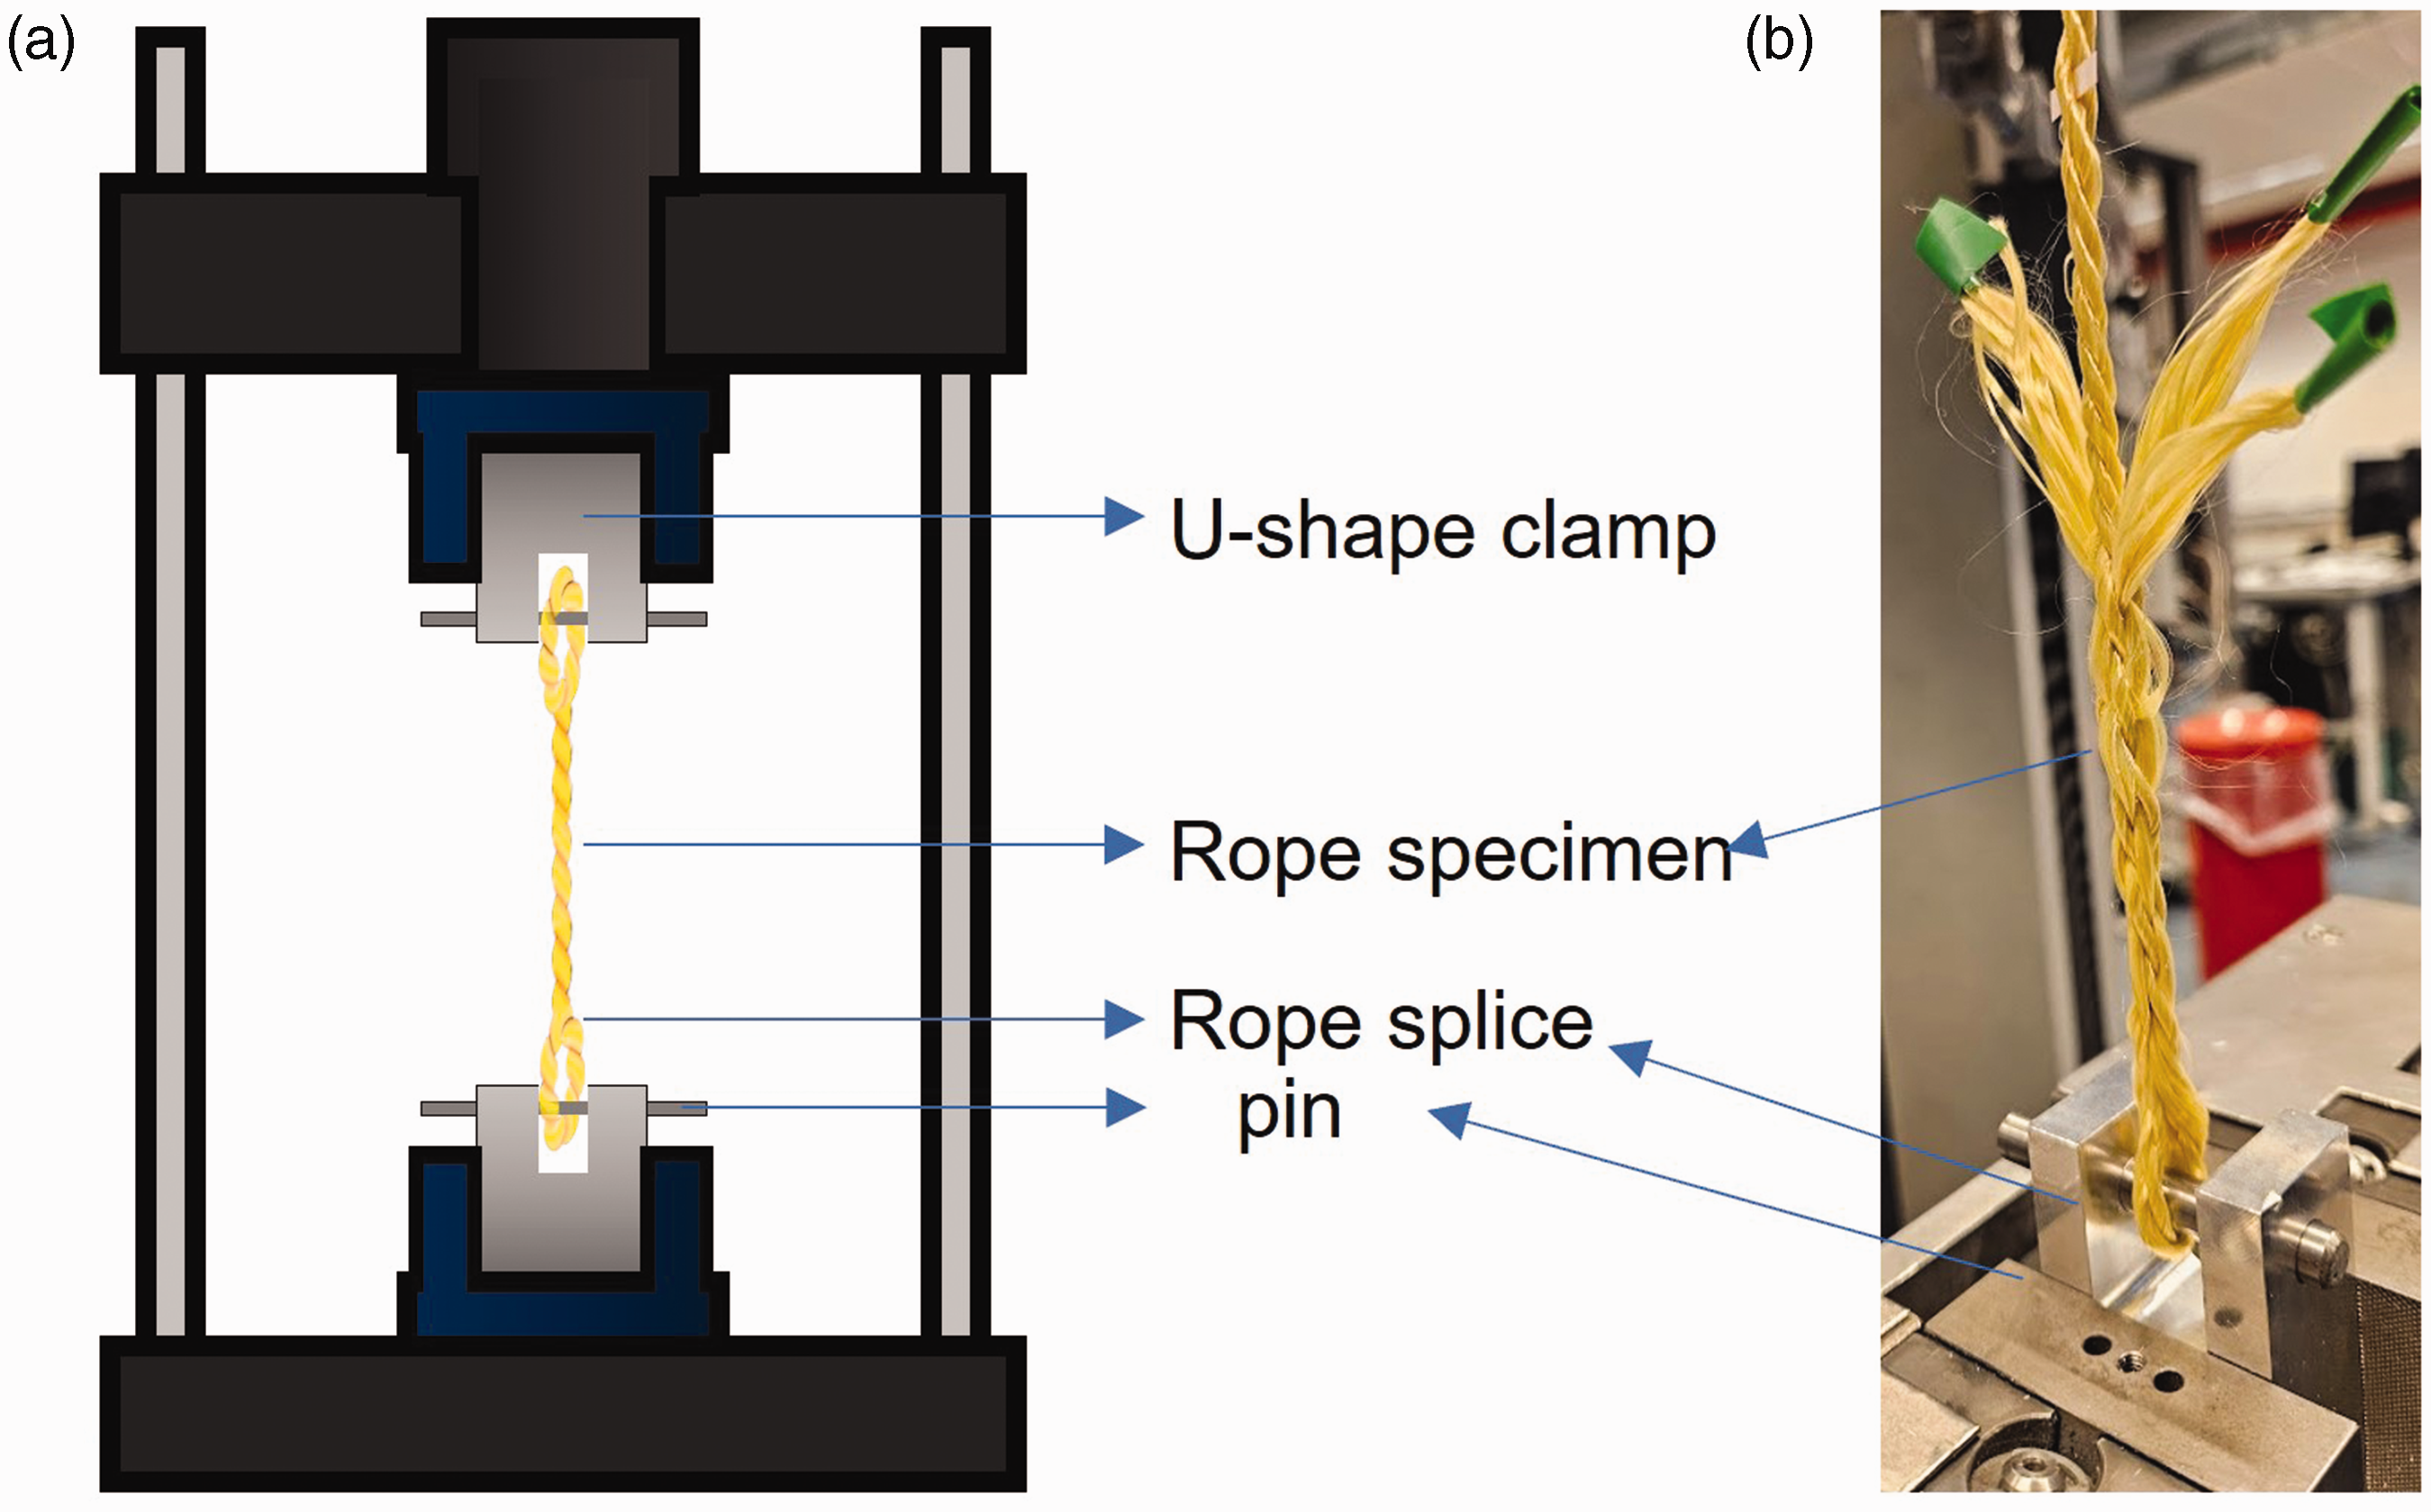
Universal tester, highlighting the important components: (a) drawing of arrangement and (b) photograph of actual test setup.
Analysis of pressure films
Pressure films change their color in response to applied pressure. The results can be analyzed directly to obtain pressure values. However, pressure films can be viewed as somewhat invasive, potentially affecting the system slightly. Nonetheless, it is important to note that the thickness of these pressure films is 110 ± 5 µm, which is significantly smaller than the mean diameter of the strands in the tested rope specimens, ranging from 0.9 to 1.7 mm. Lastly, these pressure films are sensitive to humidity. 29 According to the manufacturer’s catalog, 30 they operate under two distinct calibration curves based on humidity and temperature. Since our laboratory maintains a controlled temperature of 20°C, the films are unaffected by humidity as long as it remains above approximately 55%. All experiments were conducted under the aforementioned conditions. The pressure films provide pressure values with an accuracy of approximately ±10%. 30 To compare the experimental results with the analytical model, the measured contact pressure is multiplied by the corresponding measured contact width to convert it to contact load per unit length. Further details on the experimental setup and pressure film analysis can also be found in Allan et al. 31
Measurement of contact pressure
Pressure films are calibrated through an in situ setup, shown in Figure 3, wherein they are placed between two smooth sapphire blocks with a mean surface roughness Ra of 6.4 nm. Given the known dimensions of the sapphire blocks, and hence the contact area, it is possible to directly calculate the nominal contact pressure generated from the applied load.
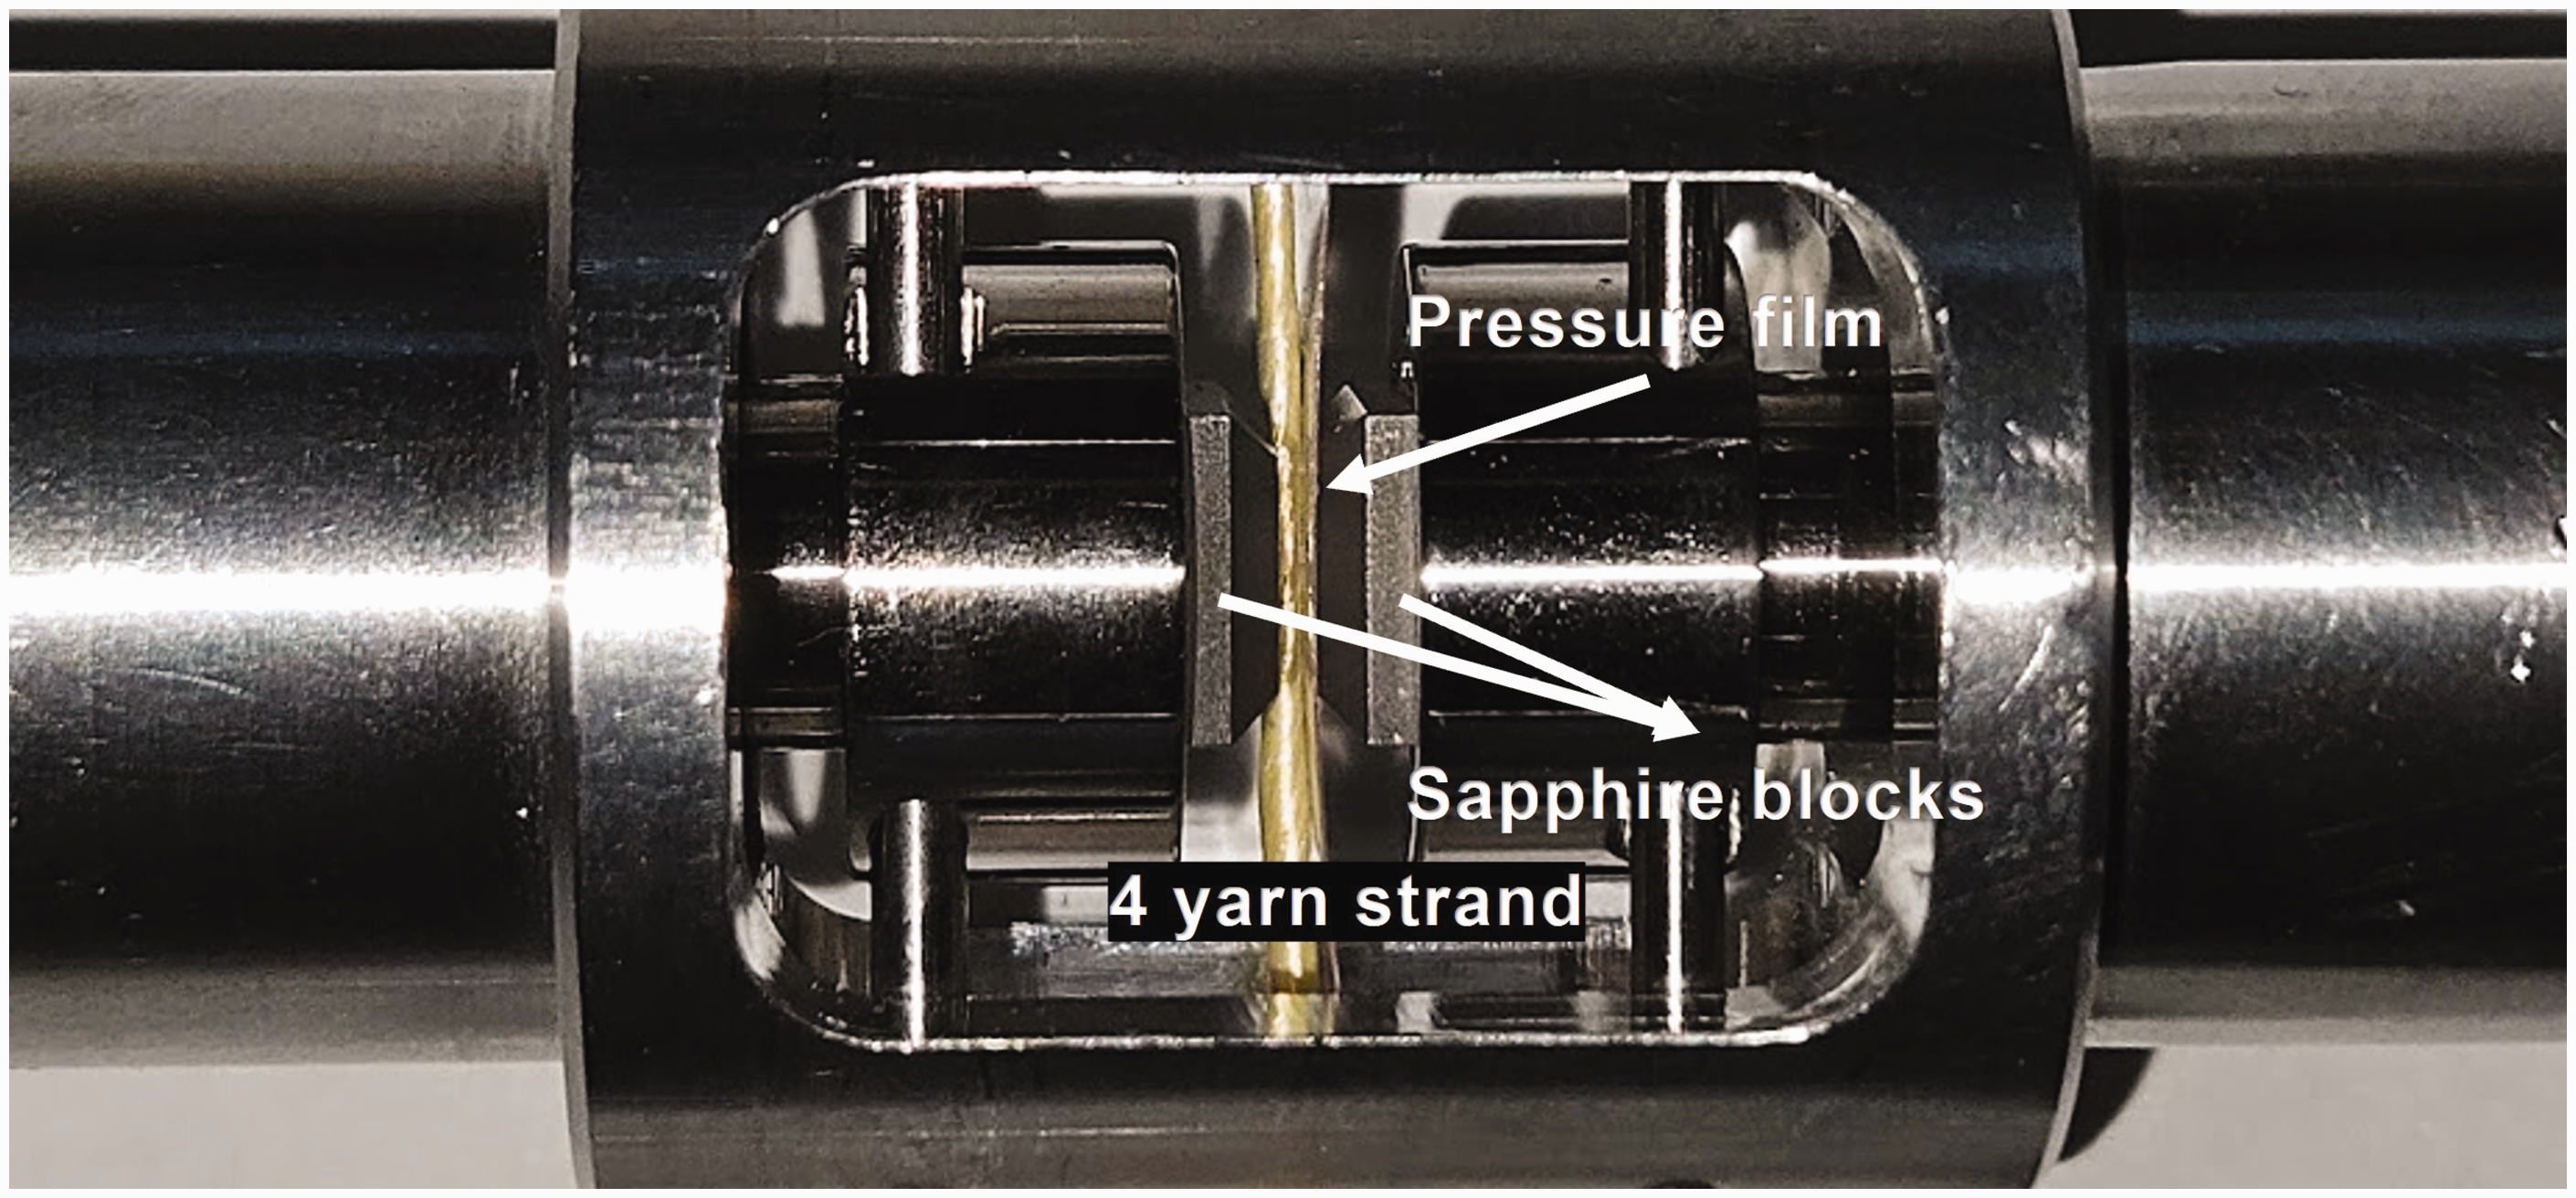
Compression test setup with Twaron rope compressed between two sapphire blocks.
The resultant colored pressure film is then scanned (Figure 4(a)) using a Xerox scanner with 600 dots/in, with all color adjustments switched off to ensure repeatability between different scans. The image is then converted to a grayscale image, as shown in Figure 4(b). Finally, an average gray value is computed, as shown in Figure 4(c). The individual pressures are then mapped to corresponding mean gray values using MATLAB.
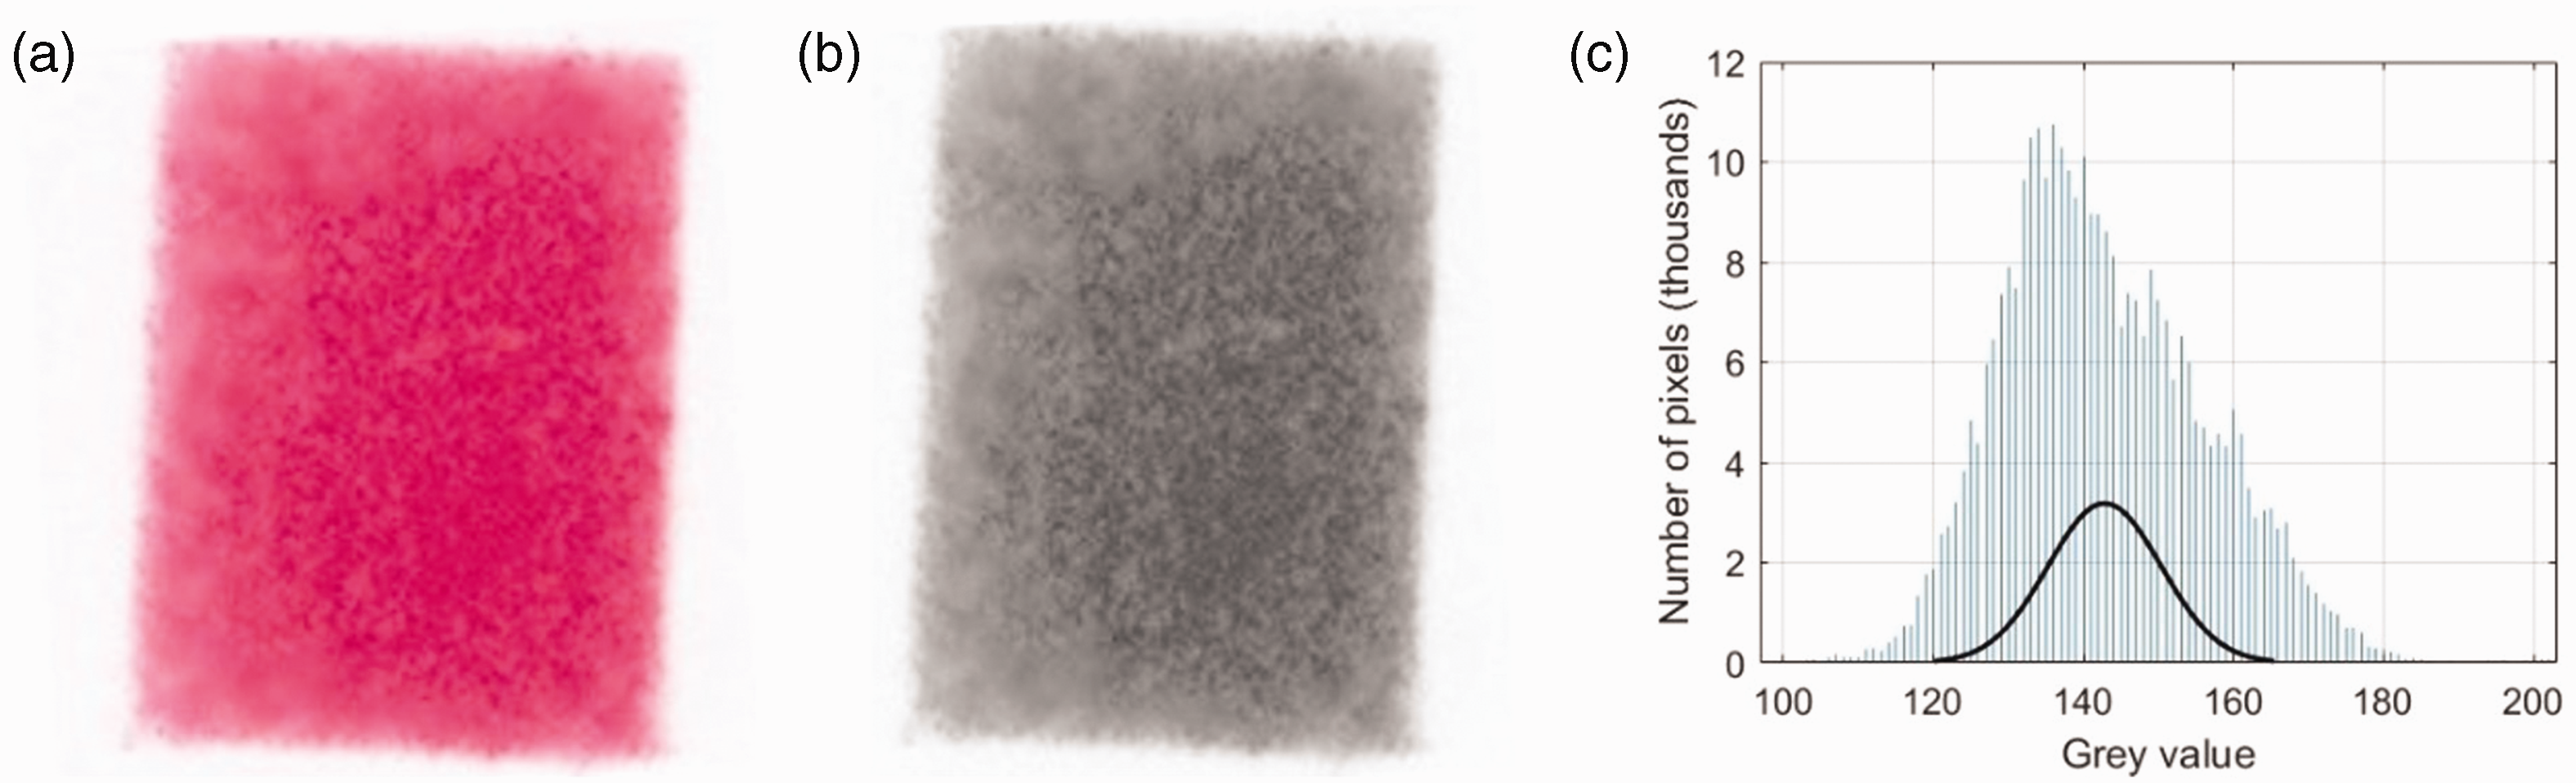
Pressure film analysis: (a) scanned pressure film after applying a pressure of 30 MPa; (b) converting image into grayscale image and (c) histogram of distribution of gray color.
Subsequently, a color–pressure curve is generated, as shown in Figure 5. The pressure films employed in our experiments are suitable for the range 10–50 MPa. Nevertheless, it can be observed from Figure 5 that, as the pressure approaches 40 MPa, the generated color stabilizes to a considerable extent, thereby compromising the precision of the results. At lower pressures (below 10 MPa), reduced accuracy in the results is also observed. In such cases, the films might not display any discernible coloration, potentially affecting the calculation of average pressure values. Therefore, pressure measurements will be restricted to values above 10 MPa and up to 40 MPa, as shown later in this paper.
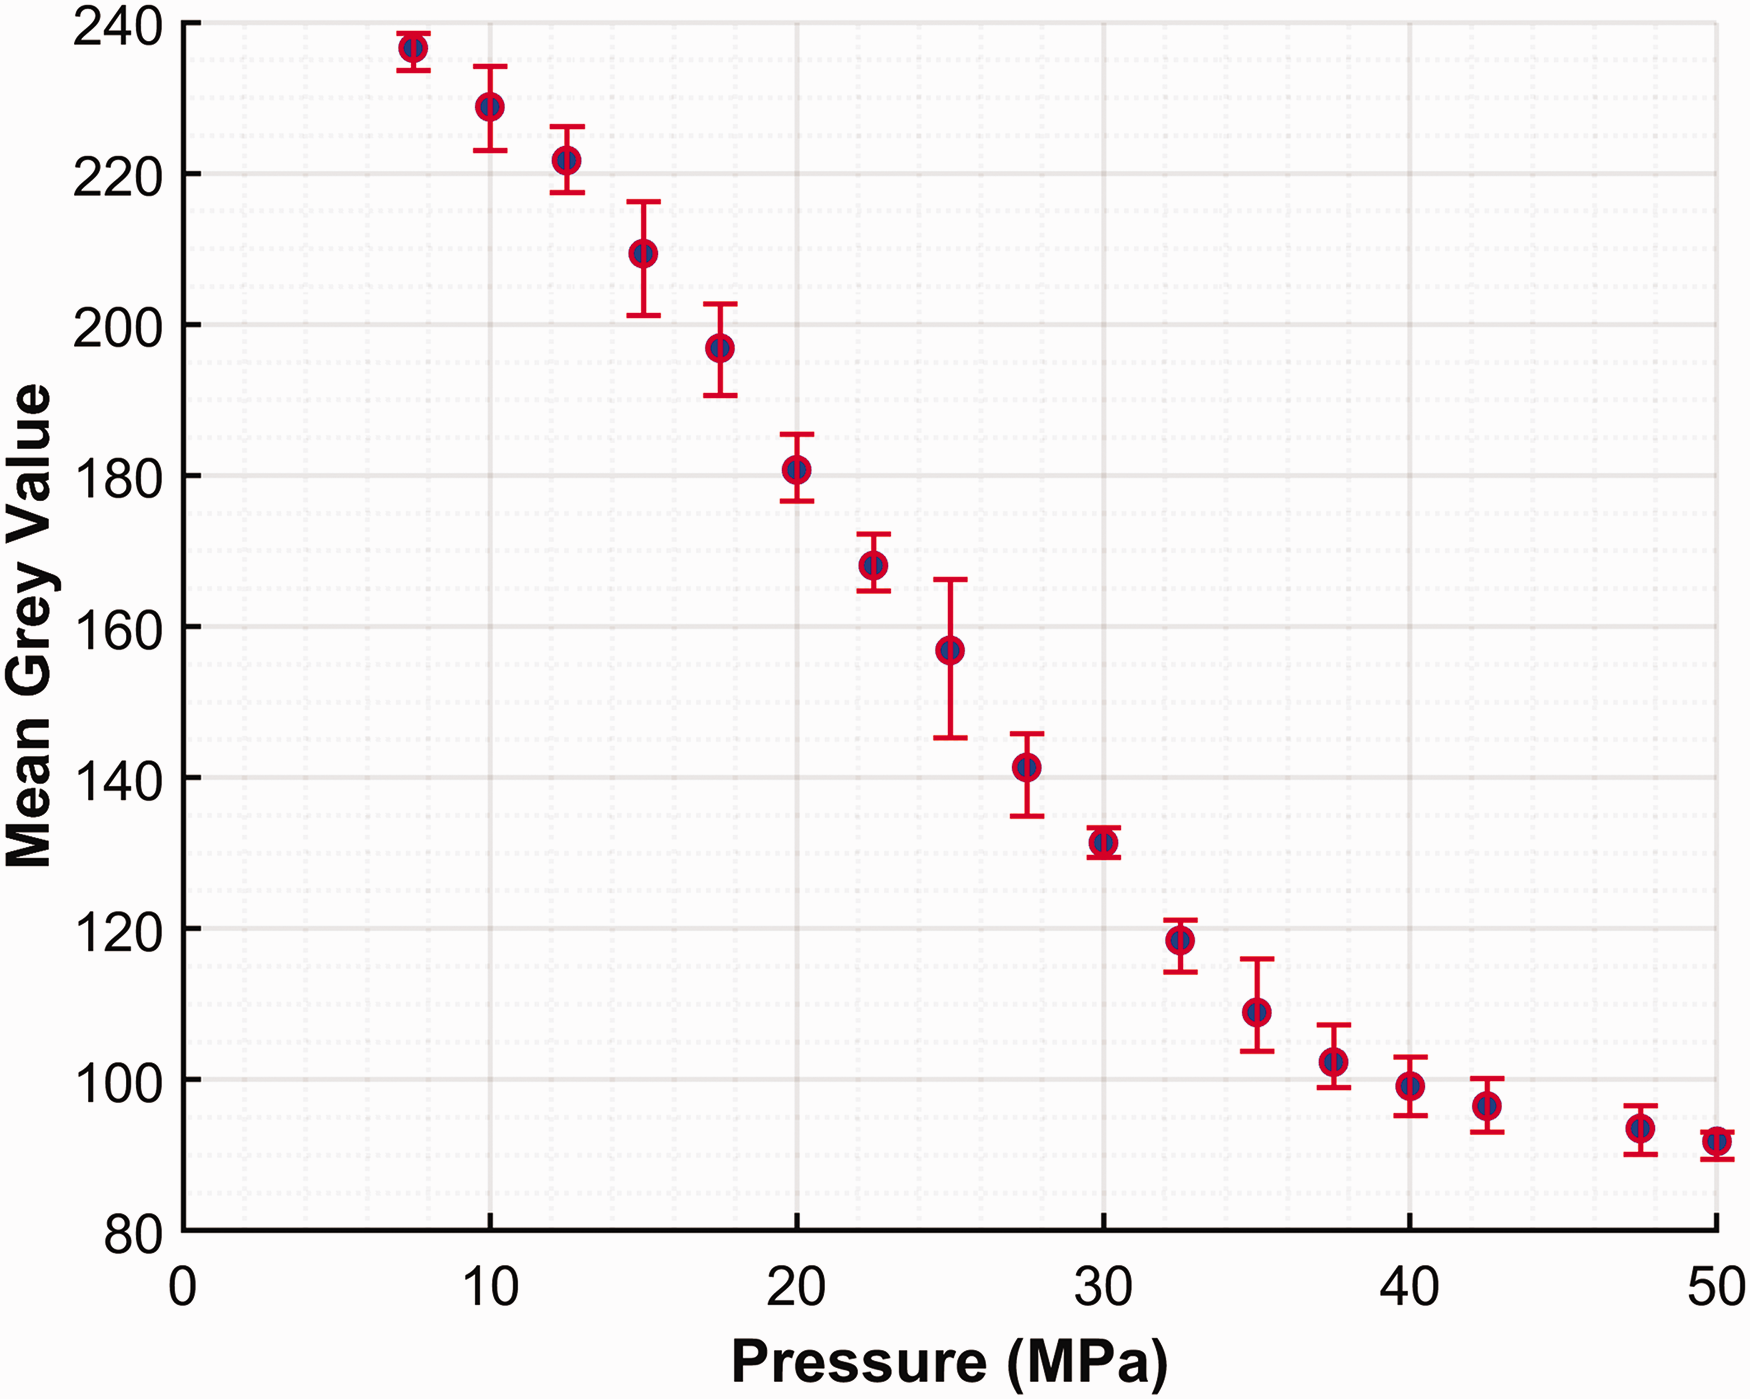
Pressure–gray calibration curve for pressure films.
Pressure films are then inserted between three strands of the rope before loading, as illustrated in Figure 6. This process is repeated twice, yielding four data points for each load (from two pressure films, each in contact at both strand–strand interfaces) for every rope specimen. The experiments include a minimum of two rope specimens for each load setting, resulting in at least eight data points for each load. After the tensile loading experiments, the pressure films are gently removed from the ropes. The films are scanned, and the resulting images are converted into a histogram with gray values. The mean gray value is calculated and then converted to pressure values using the calibrated pressure–color curve shown in Figure 5.
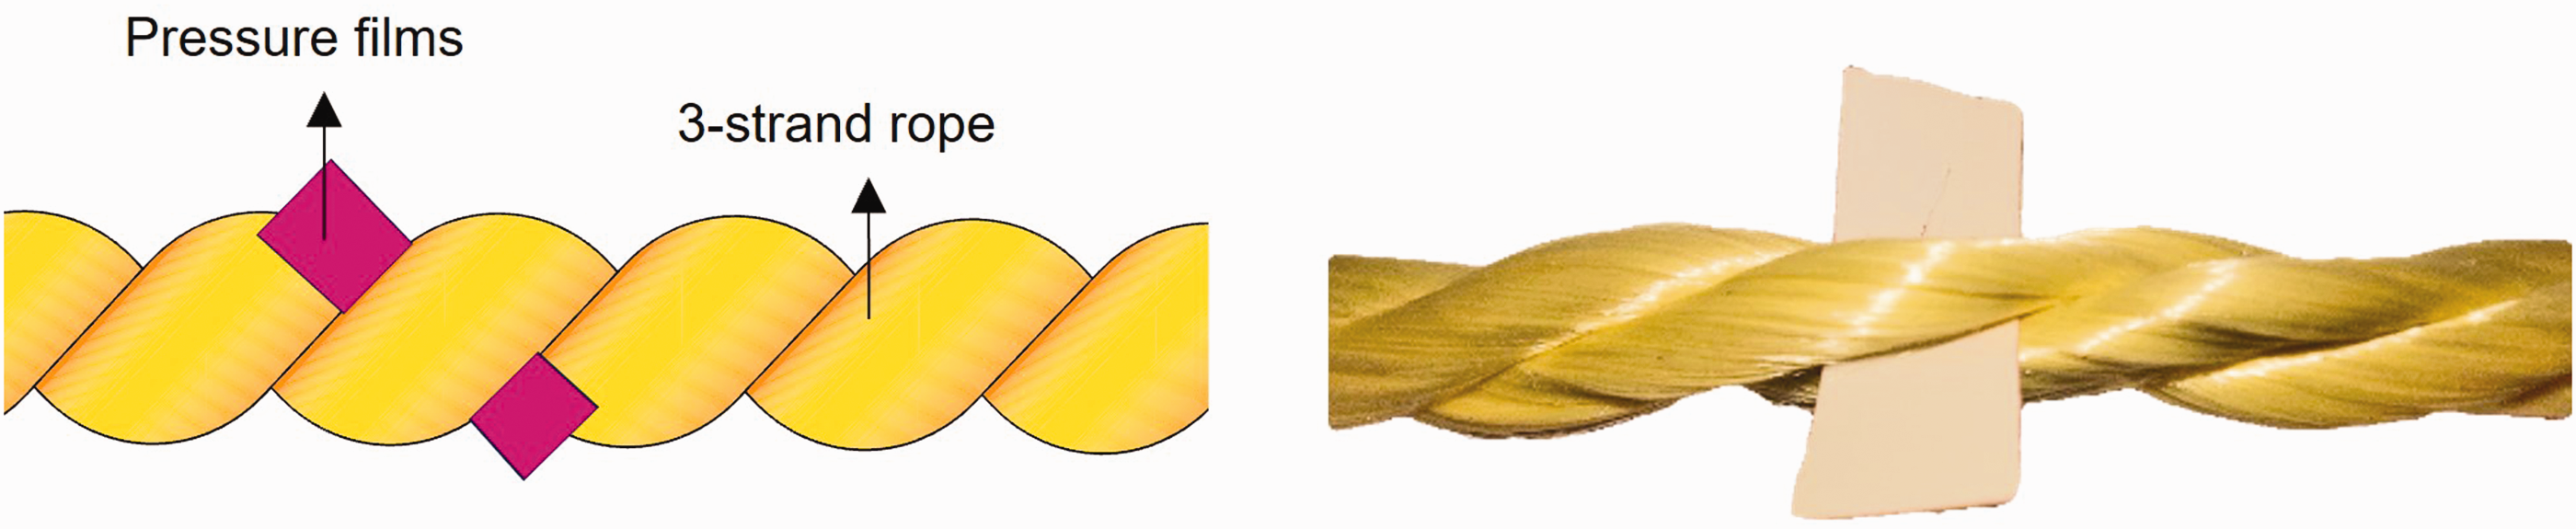
Three-strand rope with pressure film inserted prior to testing.
An example of the resulting pressure films for tests conducted on four rope specimens is shown in Figure 7. It can be observed that the specimen with the highest rope twist for the same applied load generated the darkest color, hence the highest pressure.
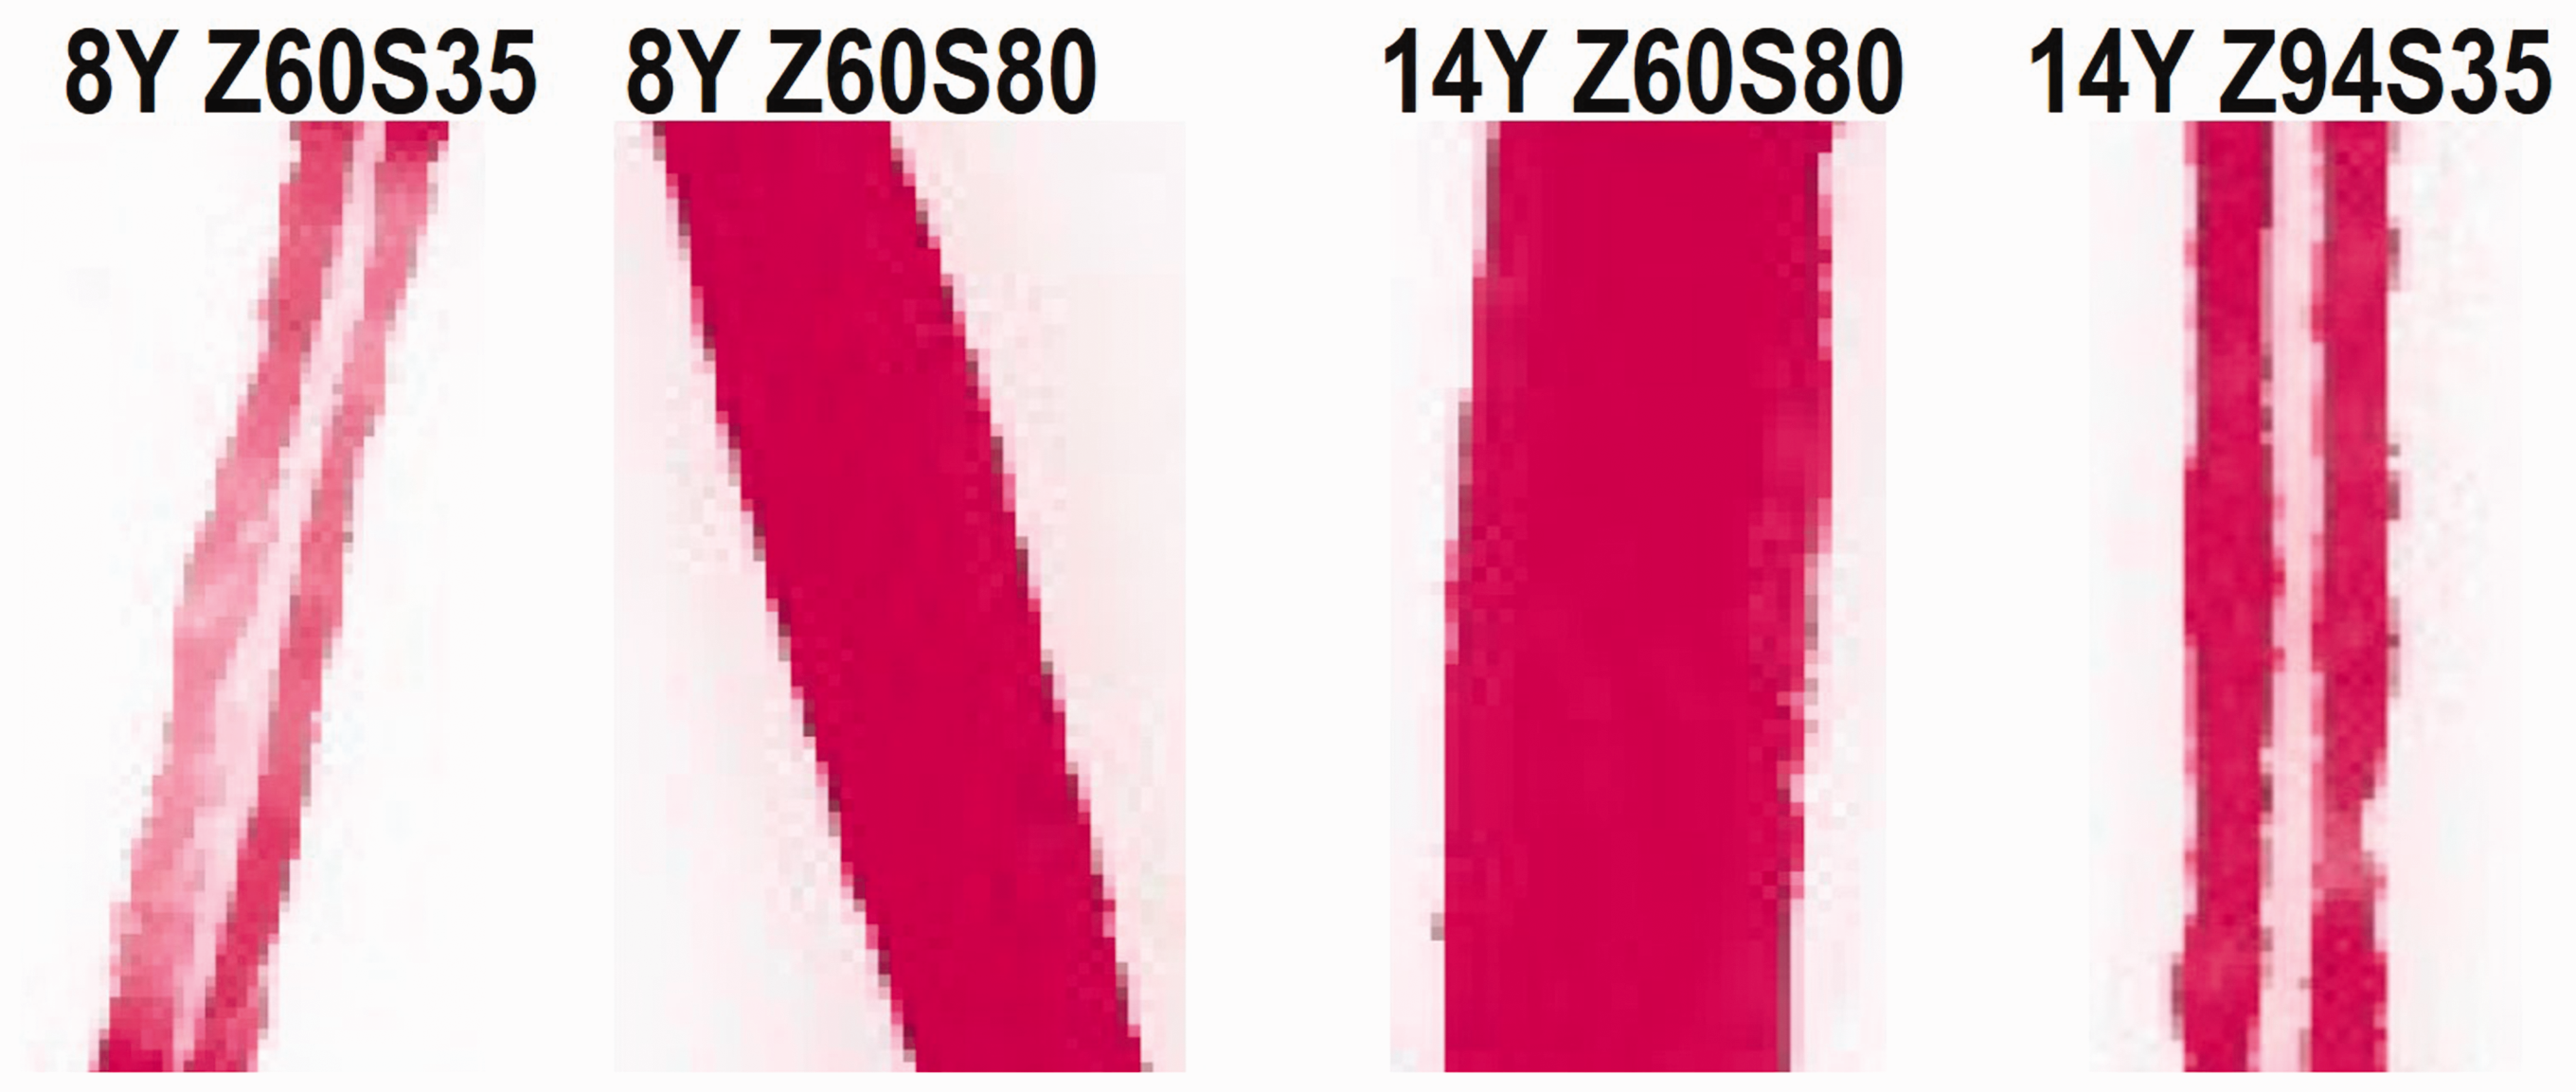
Scanned pressure films for a load of 3 kN applied to ropes with different twist settings.
Furthermore, specimens with higher strand twist, compared with rope twist, exhibit two distinct contact regions, corresponding to the two strand–strand contacts. This is because, in highly pre-twisted strands, owing to higher stiffness, the three strands do not merge at the interface. Figure 8 illustrates how the interfaces of the strands merge into a single contact region under higher loads, especially in ropes with smaller strand-to-rope twist ratios.
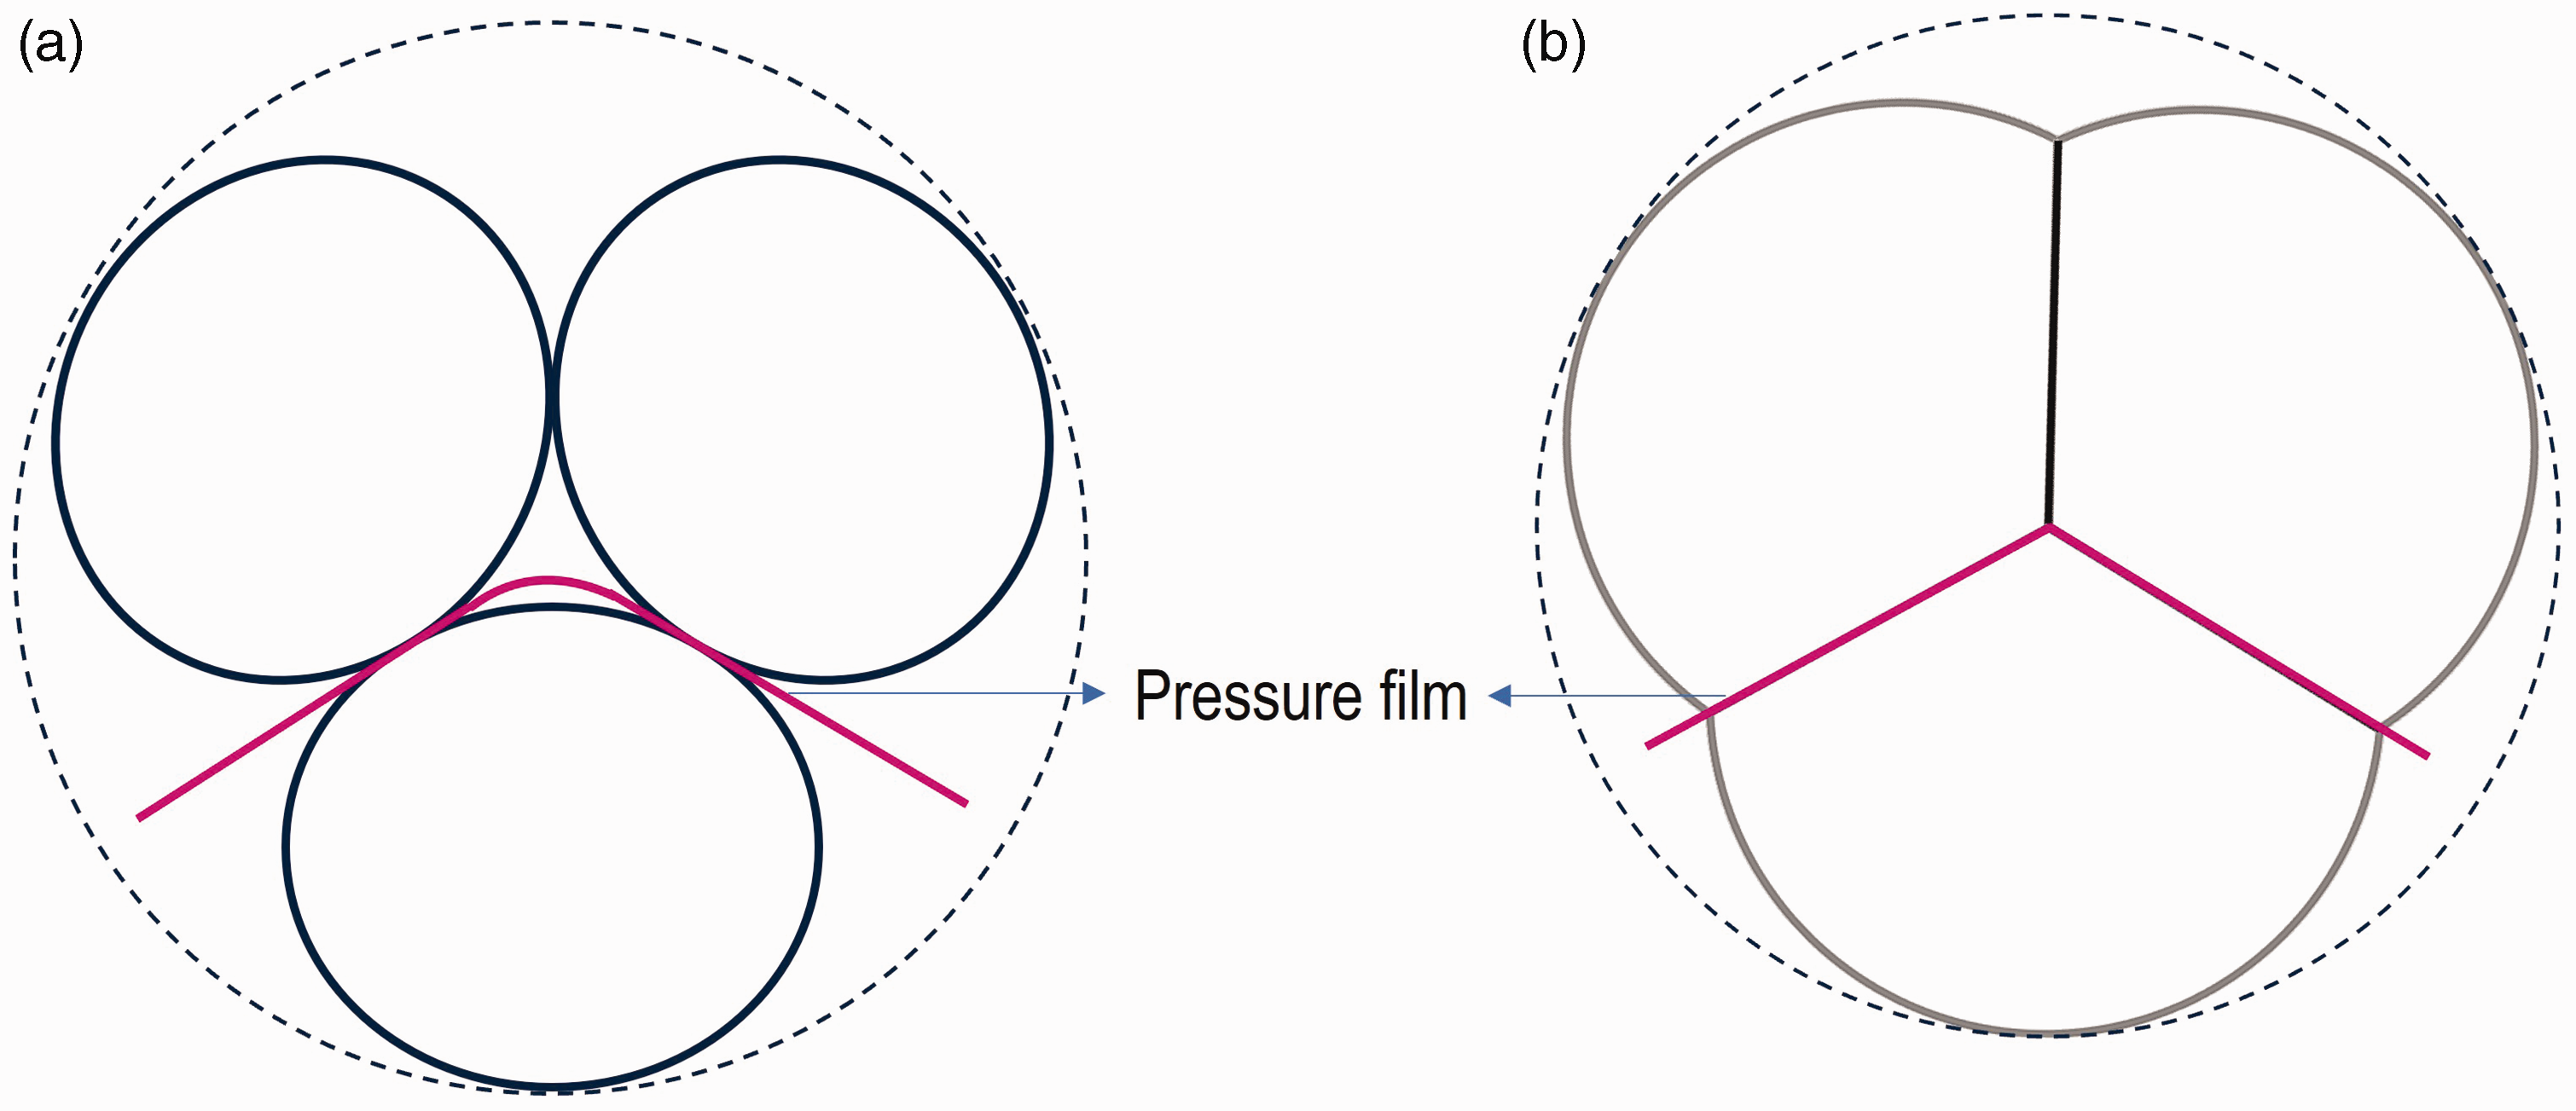
Cross-section of three-strand rope: (a) two distinct contact interfaces in a rope with a high strand twist and (b) single merged contact interface, owing to a lower strand twist.
Measurement of contact width
Pressure films are also used to measure the contact width at the strand–strand interface. Following a similar procedure to that previously mentioned, the pressure films are scanned using an optical microscope (VHX5000). Edge detection within the microscope’s software is used to measure the contact width for different specimen settings, allowing us to obtain the corresponding contact width for each measured pressure film, corresponding to each pressure measurement. Figure 9 shows an example of the effects of two different twist settings on the contact width. These results are further explained in the results section.
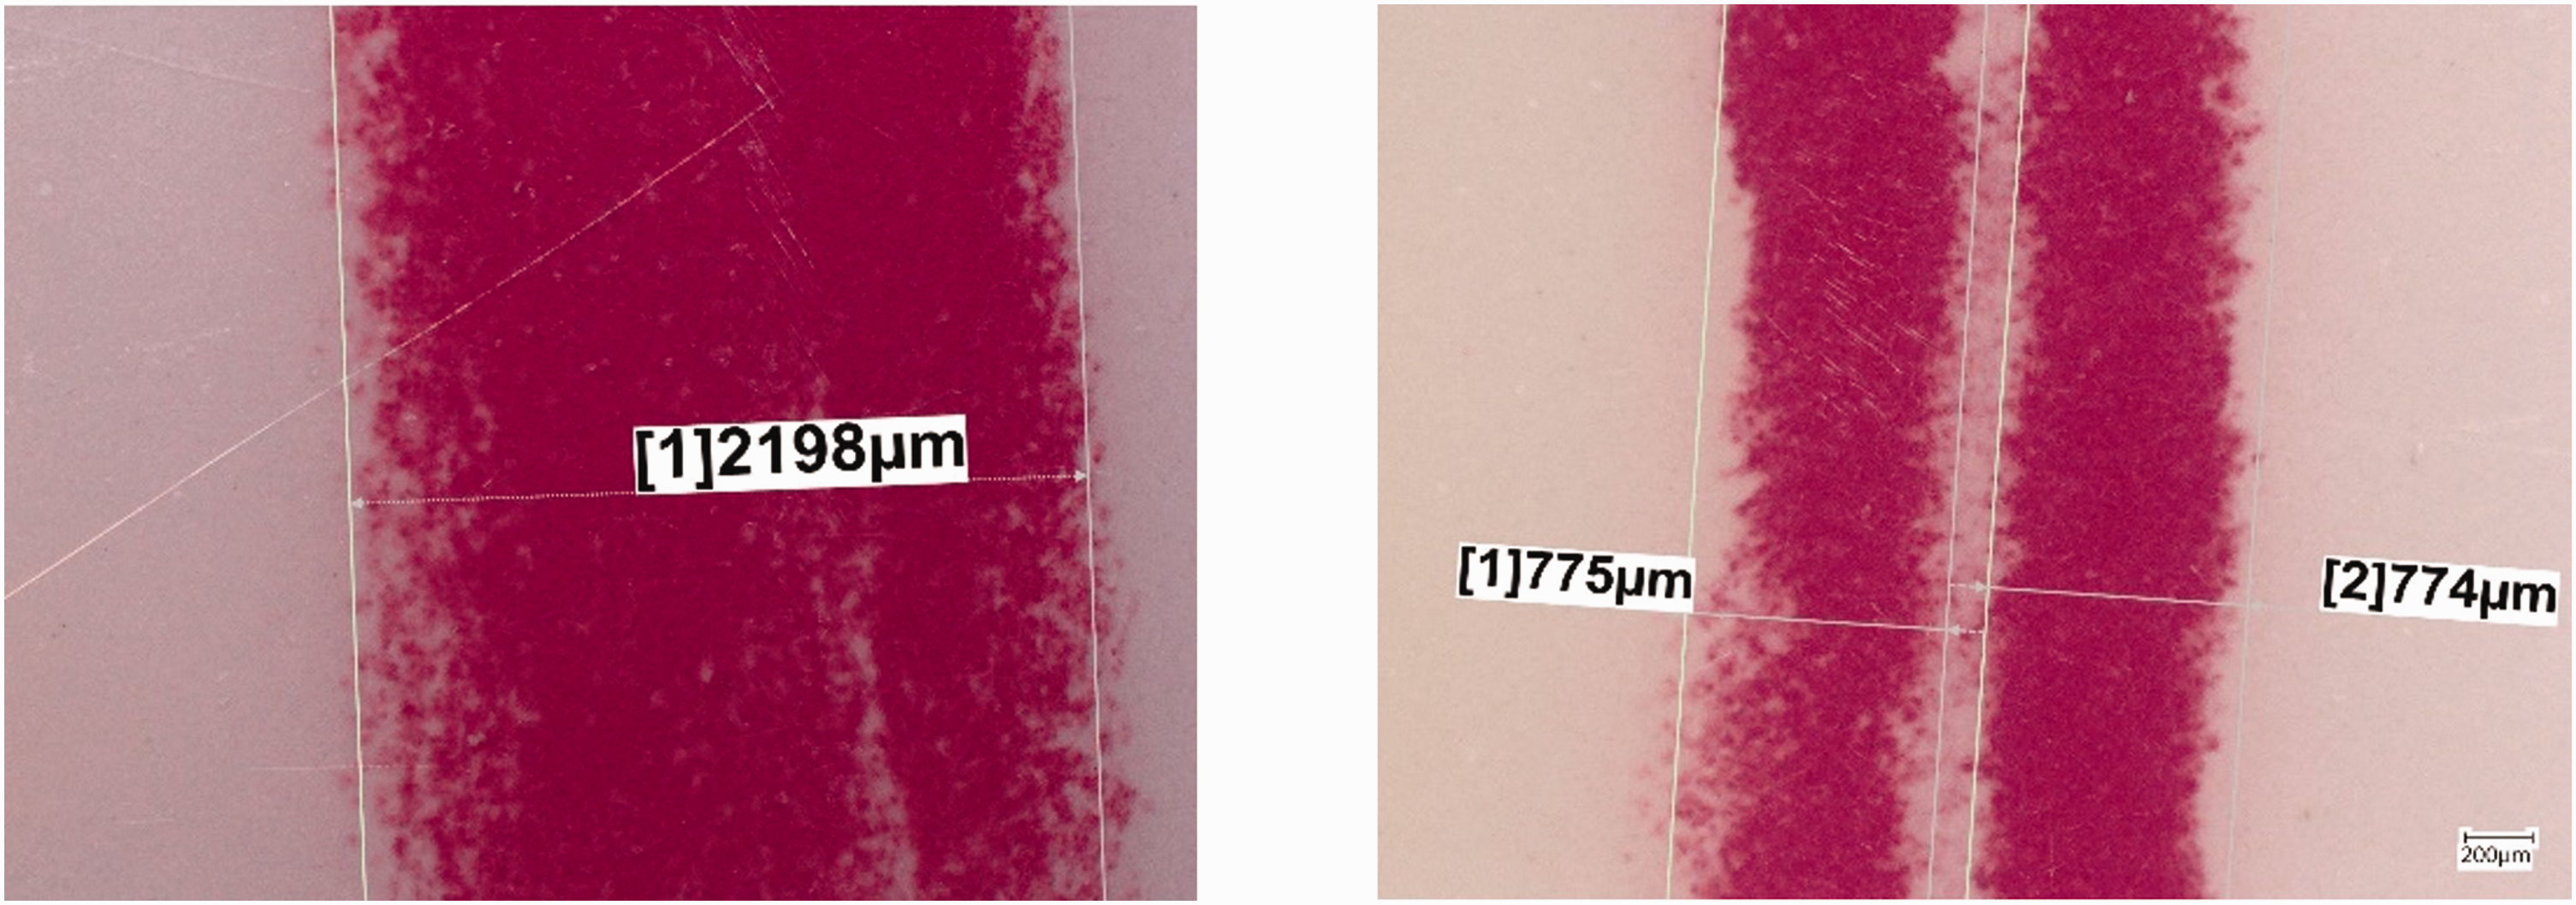
Optical micrographs for two different strand twists at an applied rope load of 3000 N.
Calculation of contact force
The contact force per unit length can be experimentally calculated by multiplying the measured average contact pressure by the corresponding measured contact width at the strand–strand interface, as determined from the pressure films. Initially, some experiments were conducted to validate both the contact pressure and the contact width developed on the pressure films when in contact with rope fibers. One Twaron strand with four yarns was twisted and inserted between two sapphire blocks, using the same setup explained previously and shown in Figure 3.
Subsequently, a high load was applied on the rope, and the resulting pressure film was analyzed to capture the contact dimensions, as shown in Figure 10(a). This allows us to calculate the nominal pressure in the pressure films from the applied compression force. Lastly, a series of known pressures are applied on the pressure films by the strand. The developed pressure films, with known applied pressures, are then analyzed using the calibration curve shown previously, which successfully predicts the applied pressures with good accuracy, as shown in Figure 10(b).
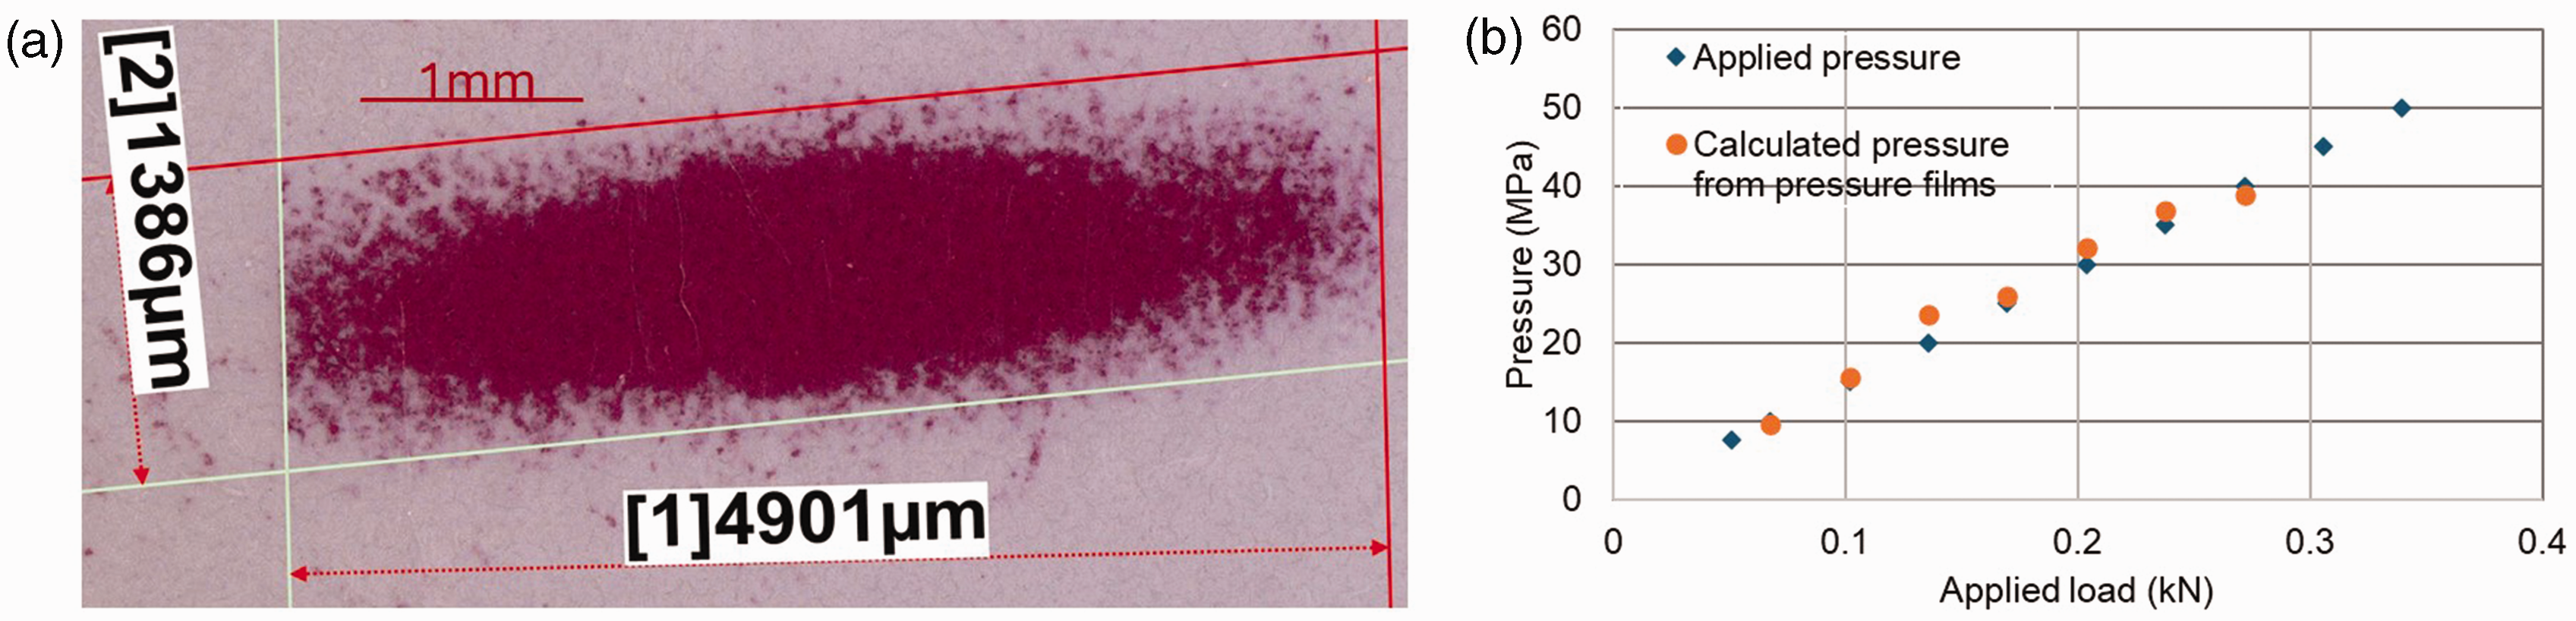
(a) Developed pressure film, resulting from compression between strand and sapphire block and (b) comparison between applied pressure and experimentally measured pressure obtained from the pressure films.
Theoretical background
The analytical model to compute the strand–strand contact force is developed based on force balance or equilibrium of a filament wrapped around a cylinder in a helical path, as illustrated in Figure 11.13,22,24 When a strand, represented by the helical cylinder B, is subjected to a load, and supported by a cylinder A (Figure 11), a normal contact force is produced between cylinders A and B. In three-strand ropes, this generated force is represented by two contact forces, one for each strand–strand contact.
32
Subsequently, the mean diameter of the strand and the helix angle of the rope were calculated based on a packing fraction of 0.7. The normal force per unit length generated by a filament helically wrapped around a cylinder can be expressed as
22
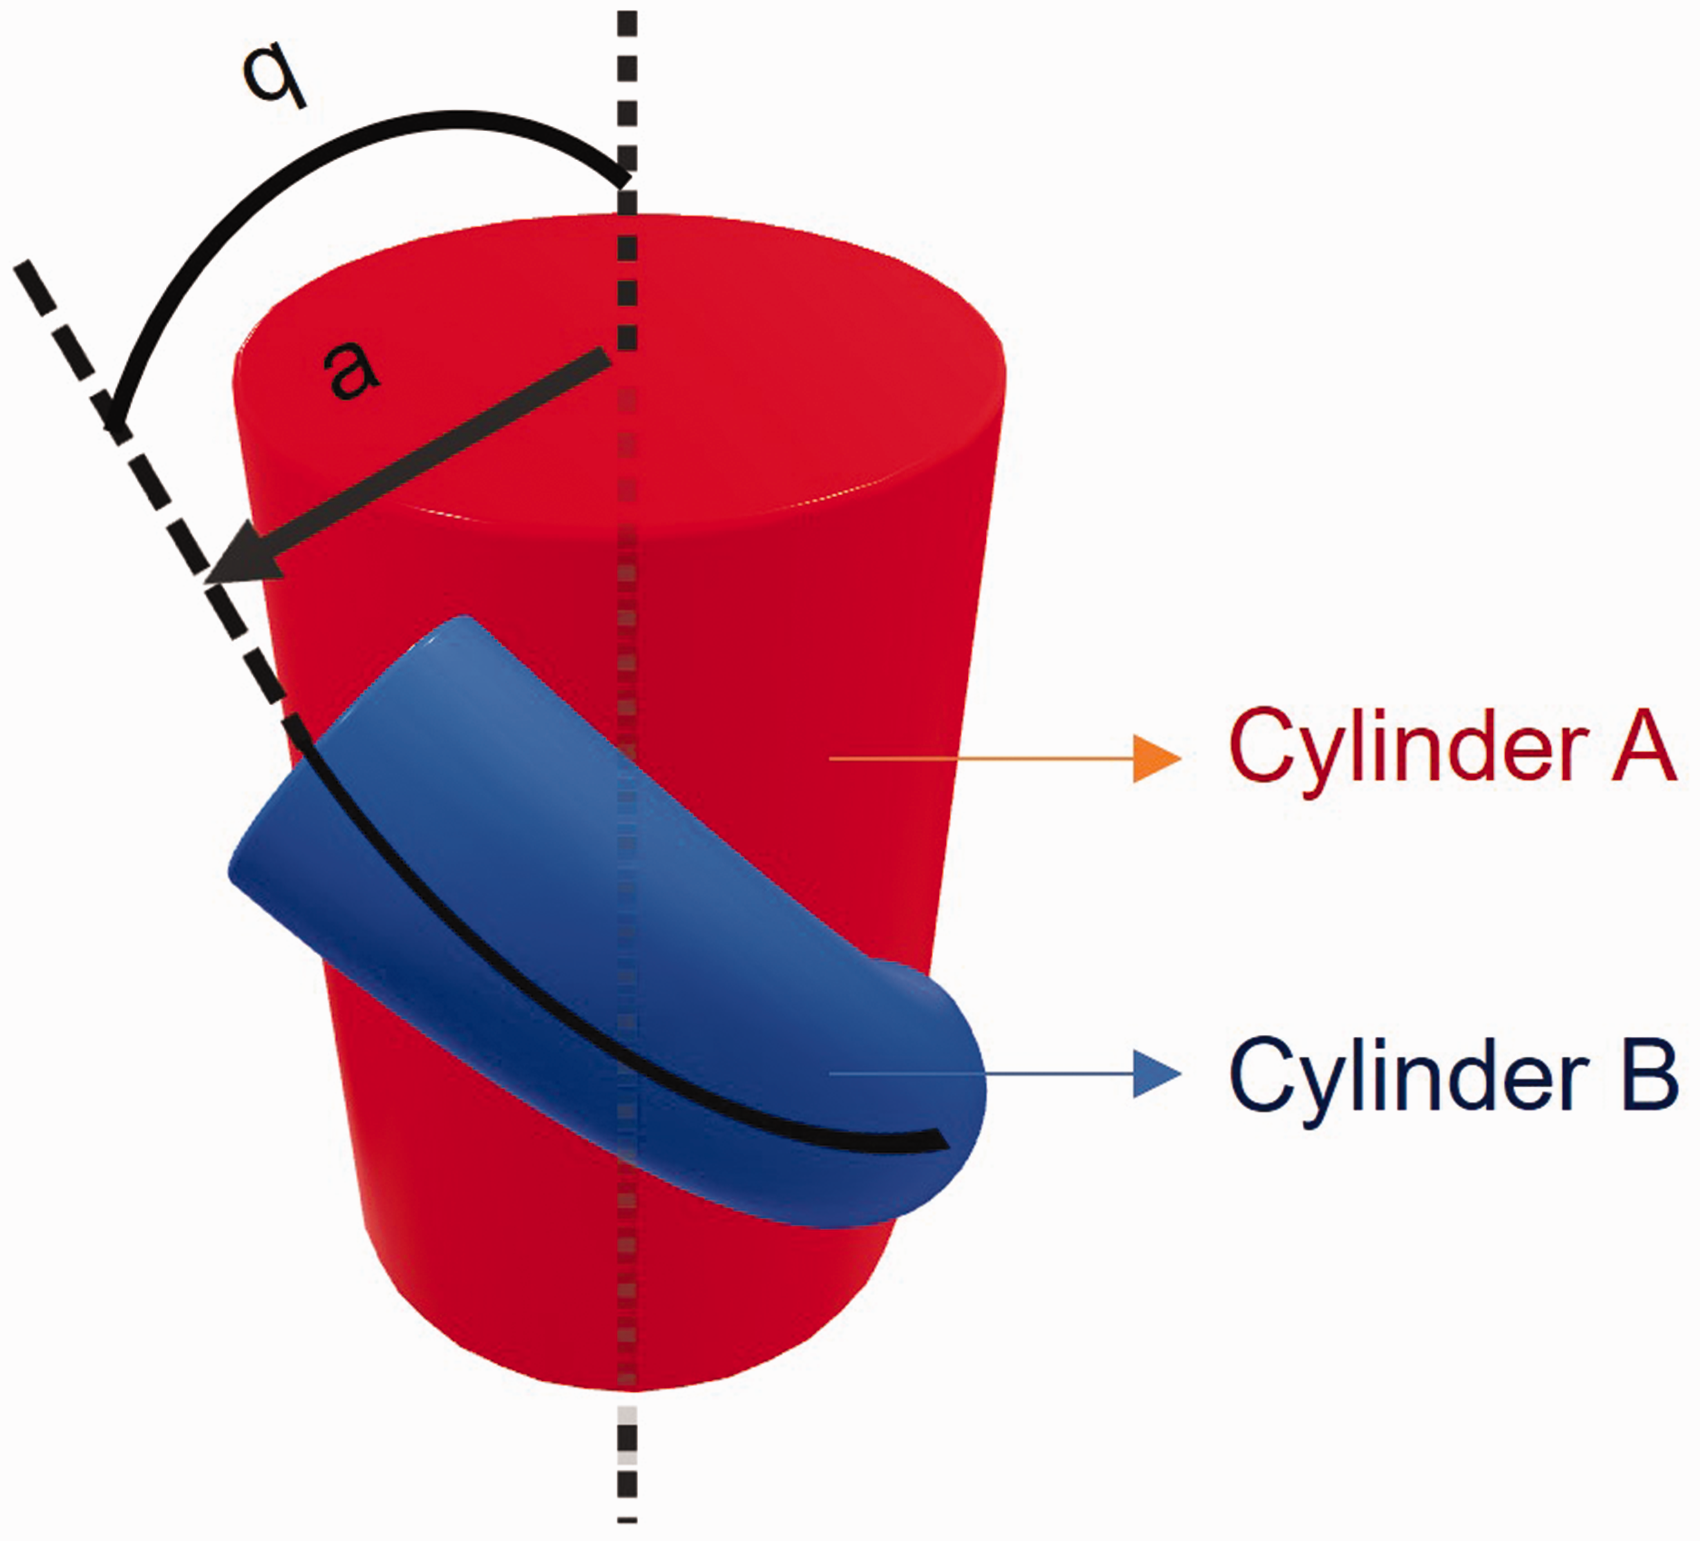
Cylinder B represents a filament that is helically wrapped around Cylinder A.
The model assumes the following:22,24
A fiber is wrapped around a cylinder in the form of a helix with a radius The fiber maintains constant tension. The fiber is elastic and is able to withstand both bending and torsional moments. The fiber–fiber contact follows Amontons’ law of friction.
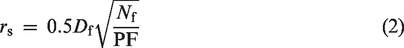
The strand’s radius is calculated as
The center points of the three strands are assumed to create an equilateral triangle. By following this assumption, the radial distance a from the center of the rope to the center of the strand can be calculated:

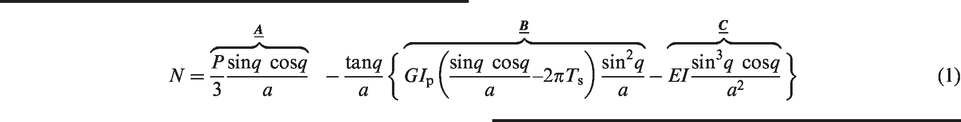
Figure 12 is a plot of the contact force per unit length (N) against the logarithm of the applied load (P) using equation (1). This plot considers only the tensile component (labeled A in equation (1)) to examine the sensitivity of the normal contact force to the A term. For this sensitivity study, a 14Y Z60S35 rope is used, assuming a normal modulus of elasticity of 1.6 GPa.15,16 It can be seen from Figure 12 that, above a certain threshold load (about 0.5 kN), the bending and torsional rigidity components do not make a significant contribution to the strand–strand normal force.
24
Therefore, in subsequent analyses, the following simplified equation is employed to compute the normal force:
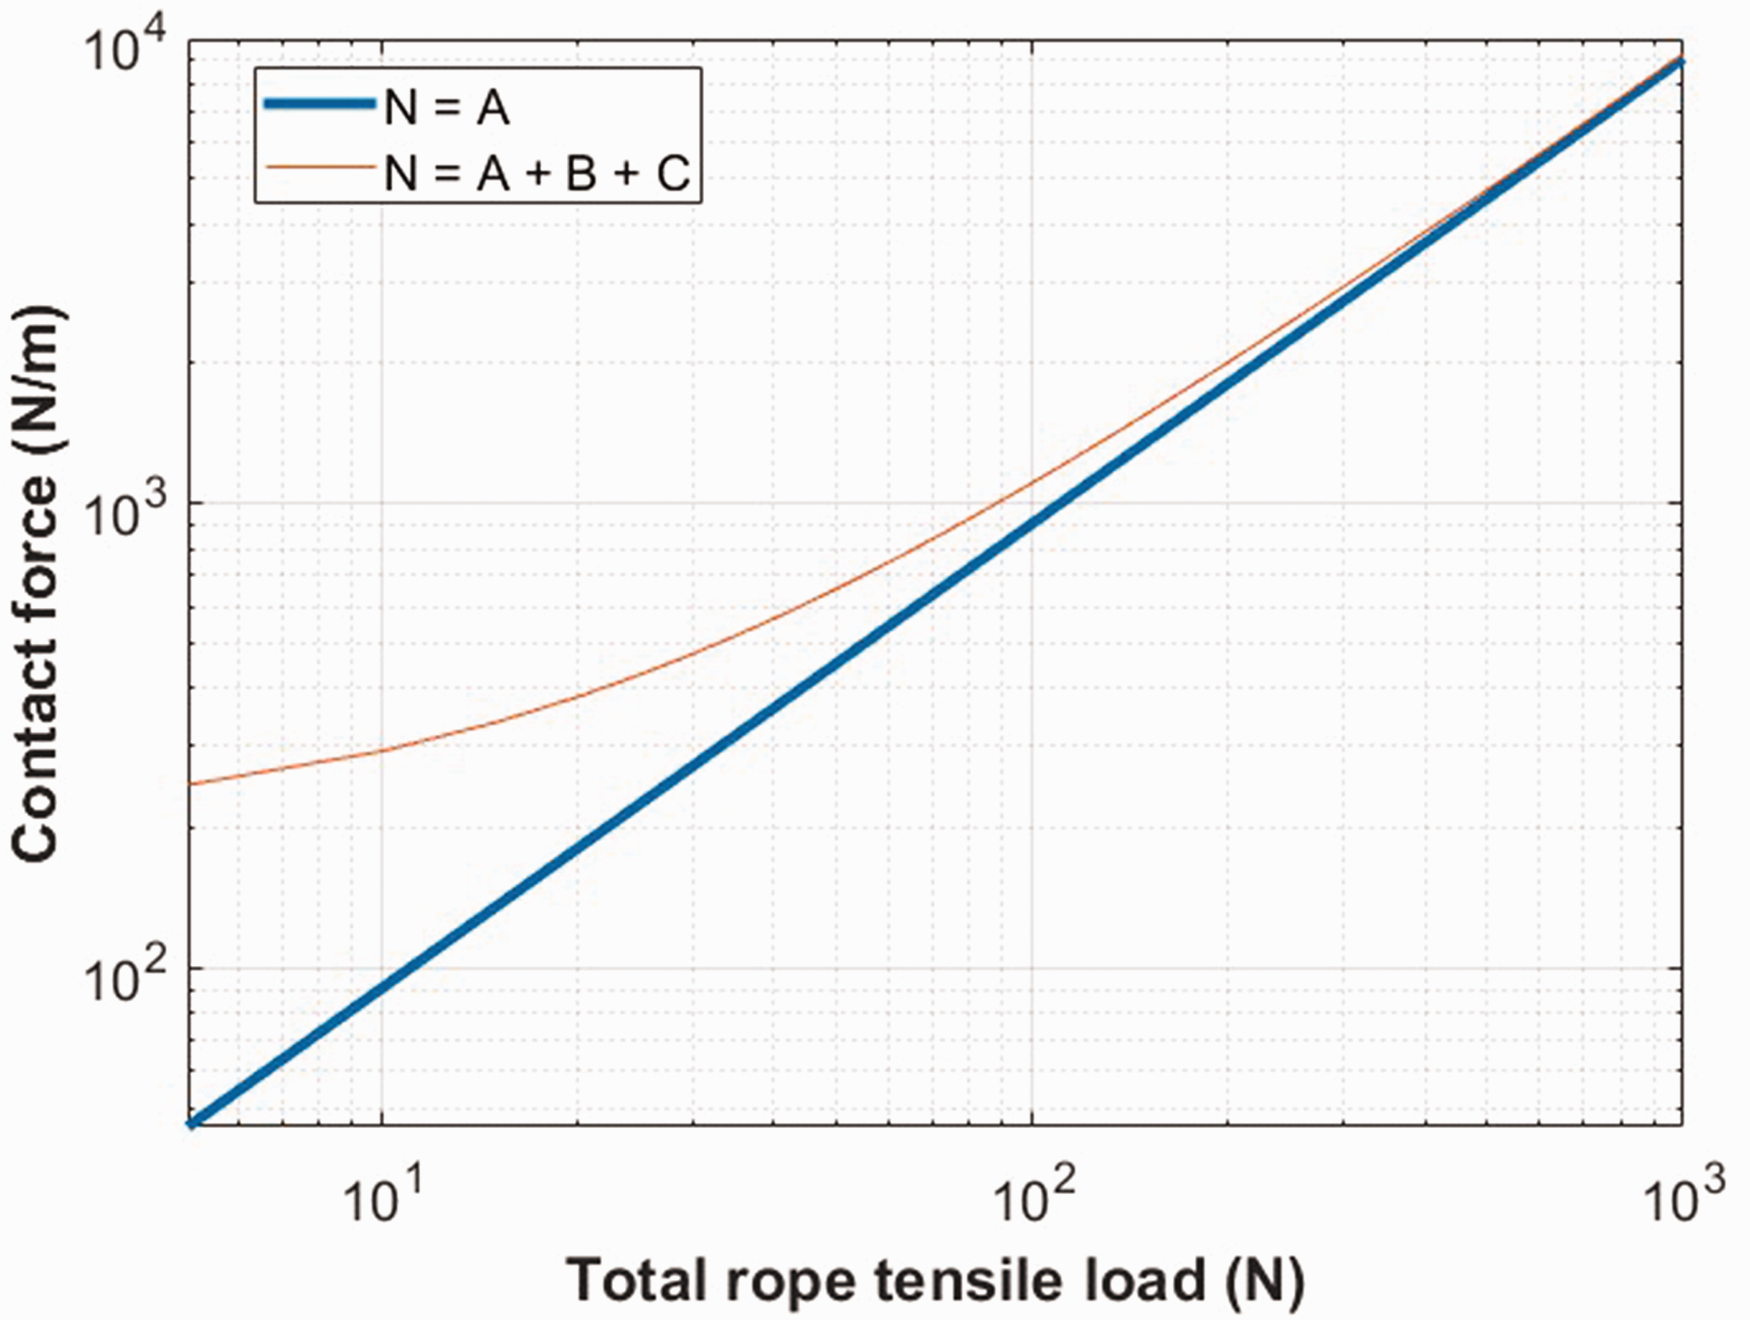
Effect of tension (A), bending (B), and torsional rigidity (C) components (based on equation (1)) on the contact force N/m in 14Y Z60S35 ropes.
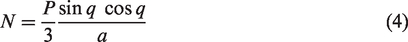
In three-strand ropes, the normal force 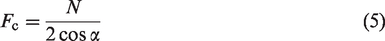


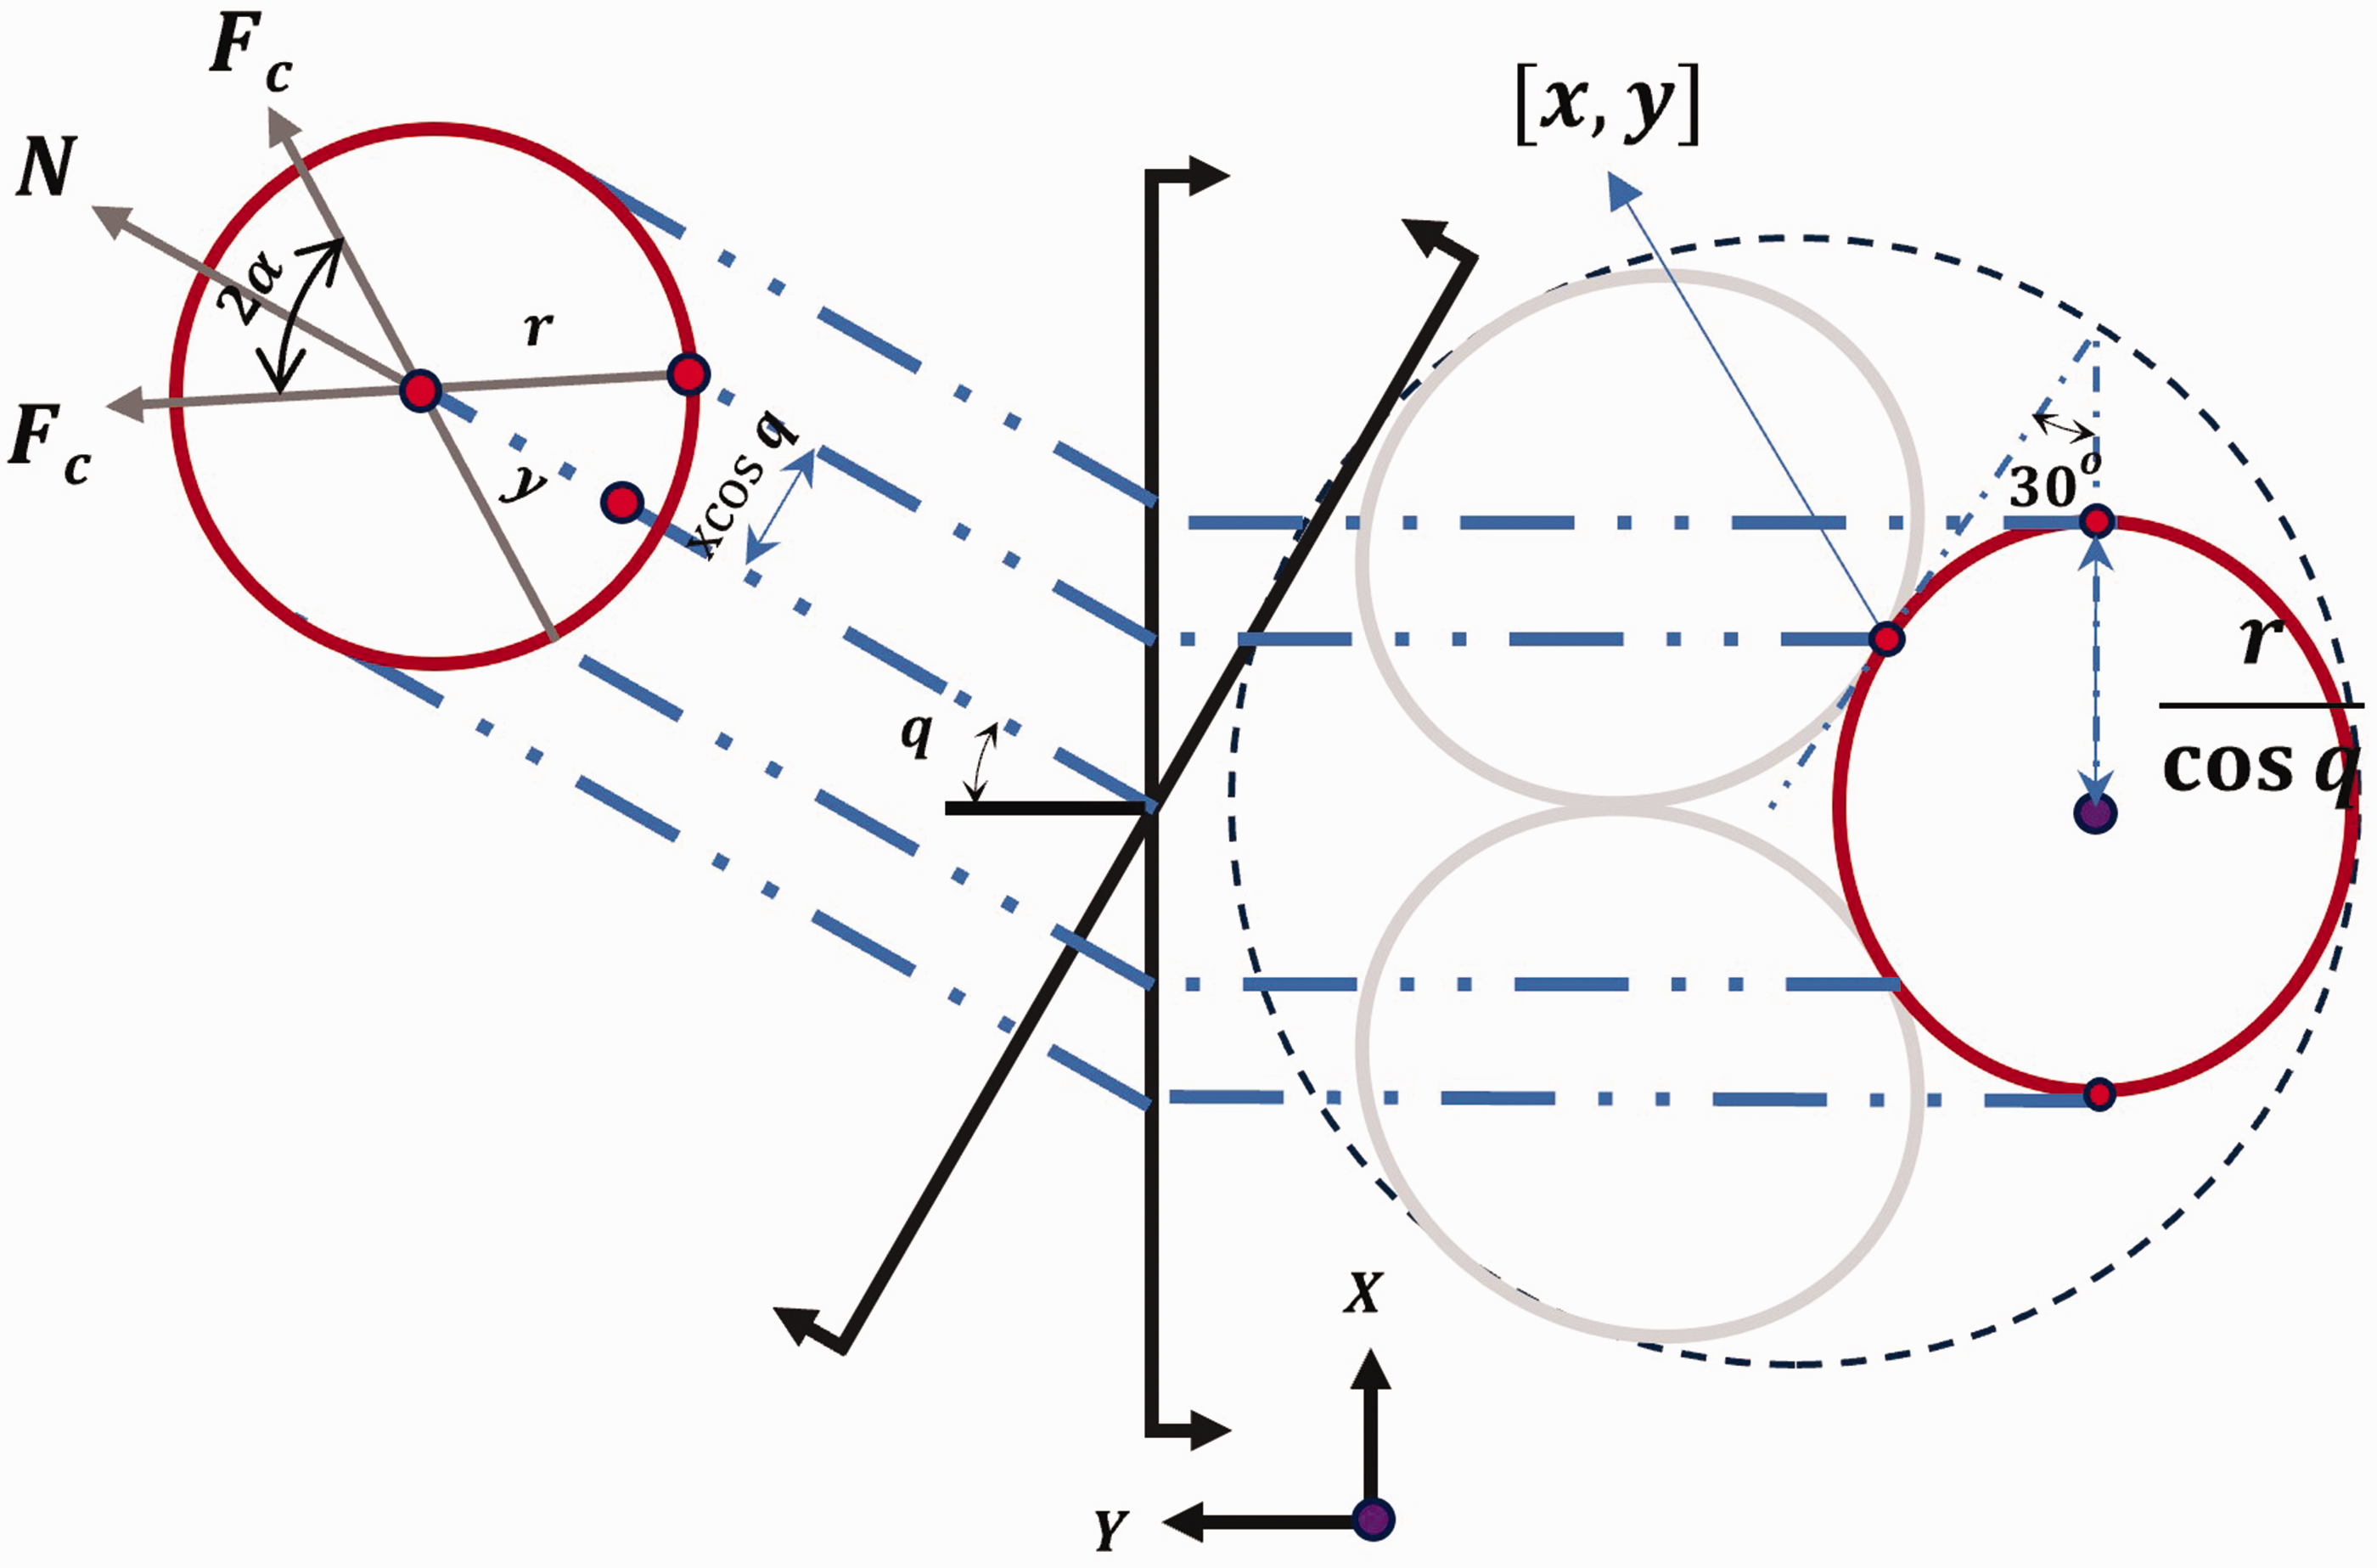
For the tangent line to the ellipse with angle 30°:
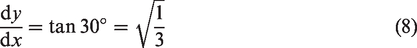
By substituting the value of dy/dx into equation (7), resulting in

By substituting in x/r from equation (9), α can be calculated as
And finally, the force Fc can be related to the applied load P as
13
The following assumptions were considered to adapt Batra’s
22
model for application in this study on three-strand ropes:
The strands are solid cylinders, whereas in actual fibrous ropes, each strand will consist of a number of filaments. The helix angle of the strand is aligned with the helix angle of a filament situated at the center of the strand. However, in real-world ropes, strands do not possess a single, uniform helix angle; it varies based on the location of the yarn within the strand. This variation becomes more pronounced during loading, as the three strands might undergo flattening and reorientation, affecting the rope’s helix angle and introducing geometric changes that influence its mechanical response. Nevertheless, the assumption of a uniform helix angle is considered suitable for laid three-strand ropes, as their well-defined helical geometry primarily governs load distribution and strand interactions. This assumption provides a necessary baseline for the theoretical model, enabling a systematic analysis of the behavior of the rope. Strand–strand contact is assumed to occur between two continuous surfaces. In reality, fibrous ropes exhibit a non-uniform, non-planar contact pattern, owing to interconnected fibers. The pressure films capture the nominal pressure distribution by averaging contact pressure over individual pixels. Validation of the calibration curve developed for the pressure films in the previous section confirms that the films consistently measure comparable pressures under identical loading conditions, supporting the validity of this assumption for the scale of analysis in this study.
Results and discussion
In this section, the effects of the number of filaments, strand twist, and rope twist on strand–strand contact pressure and contact width are discussed. Furthermore, the contact forces obtained from experimental measurements of contact pressure and contact width are compared with the contact forces computed by the analytical model explained in the previous section.
Contact width
In this section, the effects of rope twist, strand twist, the number of filaments, and the rope-to-strand twist ratio on contact width will be studied. For a strand under compression, it has been observed in the previous literature that the contact width exhibits a stepwise increase with normal loading, suggesting that filaments migrate layer by layer once the frictional force at the interface of each layer has been overcome. 20 In contrast, for ropes, both the strand’s tension and normal compression increase simultaneously during loading, potentially leading to a synergistic effect. A slight increase in contact width was observed at low loads, as shown in Figure 18, followed by stabilization, where the contact width remains consistent beyond a certain load threshold. The contact width is an indicator of how much the strand deforms at the interface, as represented in Figure 14, and is related to the strand’s normal stiffness.
Strand filled with circular filaments, illustrating how the contact width at the interface is developed.
Effect of strand twist
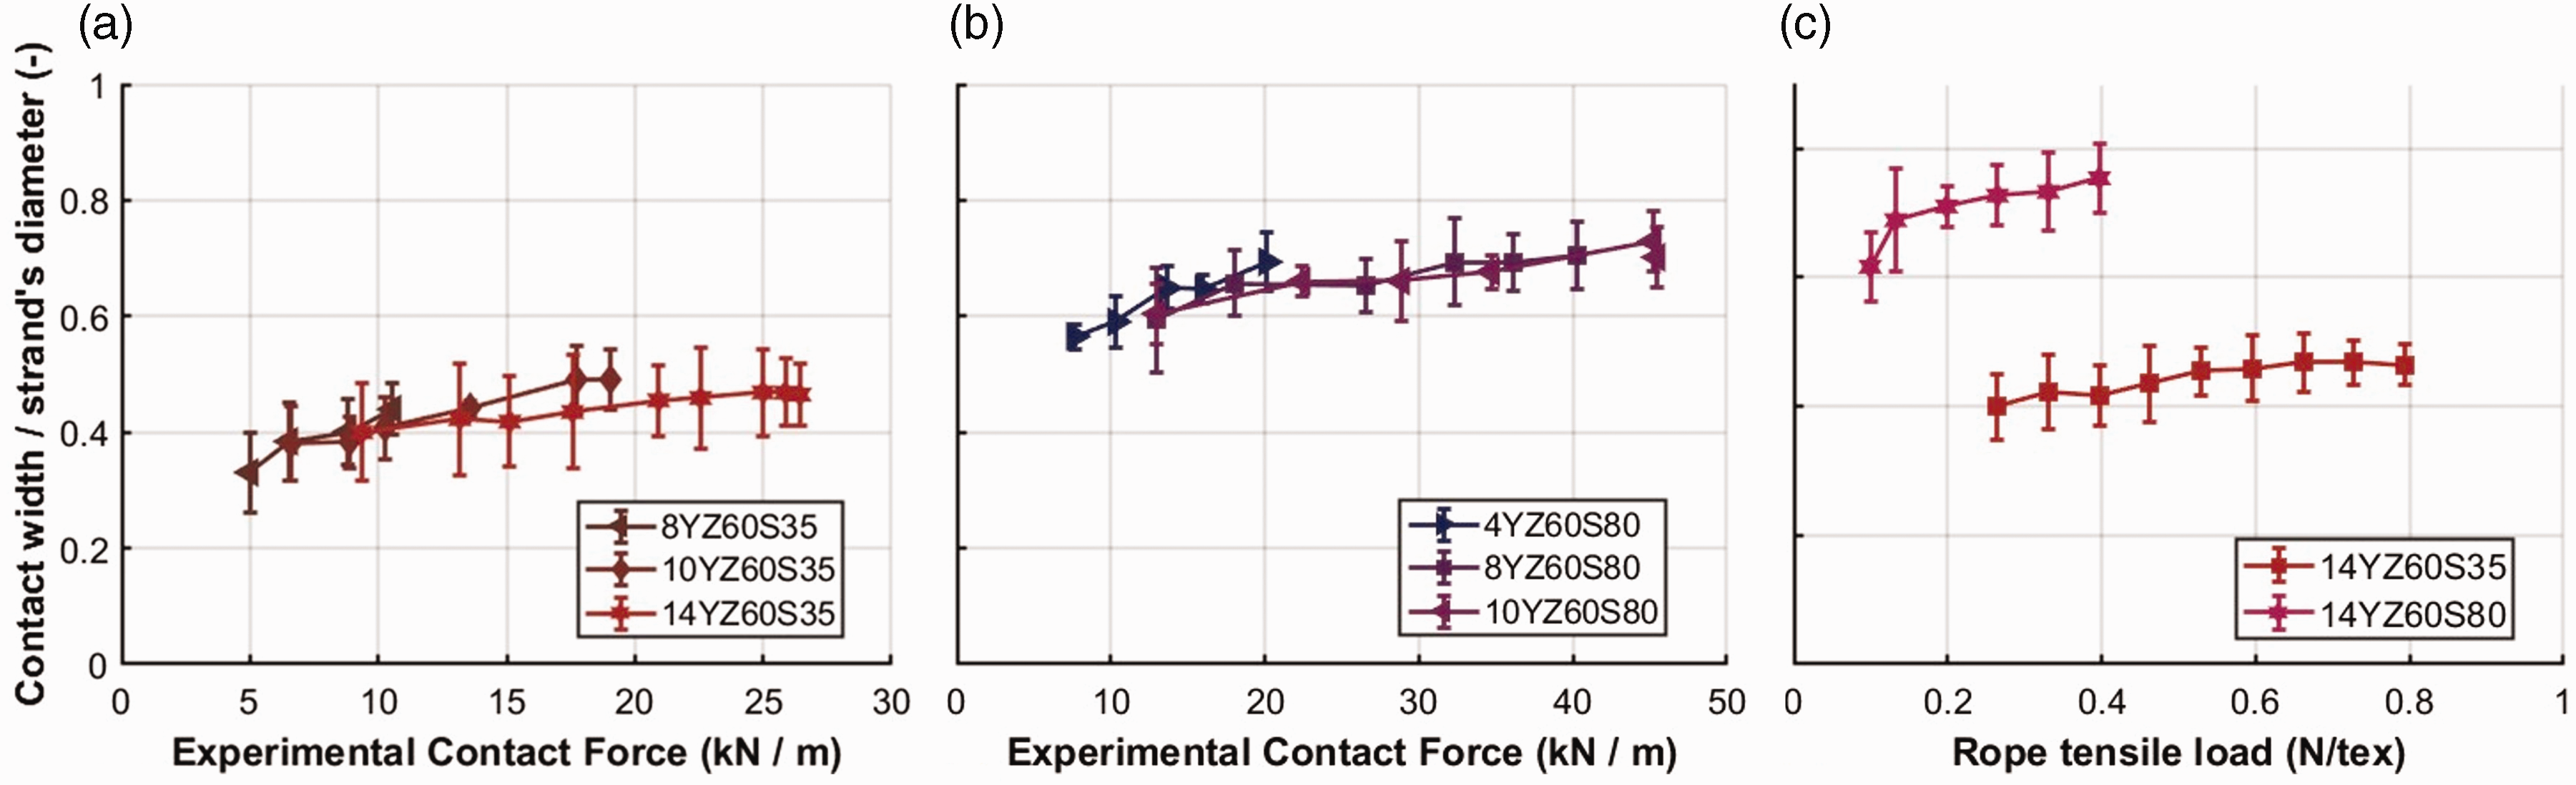
Figure 15 is a plot of the normalized contact width against the specific tensile load applied on ropes with varying strand twist. Increasing the strand twist leads to greater normal forces between filaments, resulting in two main effects: (1) it increases the frictional forces between the filaments, approximately following the Amontons–Coulomb law; 33 and (2) it increases the packing density of the strand, reducing the void space. Both of these effects make it harder for the filaments in the strand to slip and become more compact, resulting in stiffer strands that are more difficult to deform normally. 14 As a result, there is a decreased contact width for the same applied tensile load (N/tex), as illustrated in Figure 15.
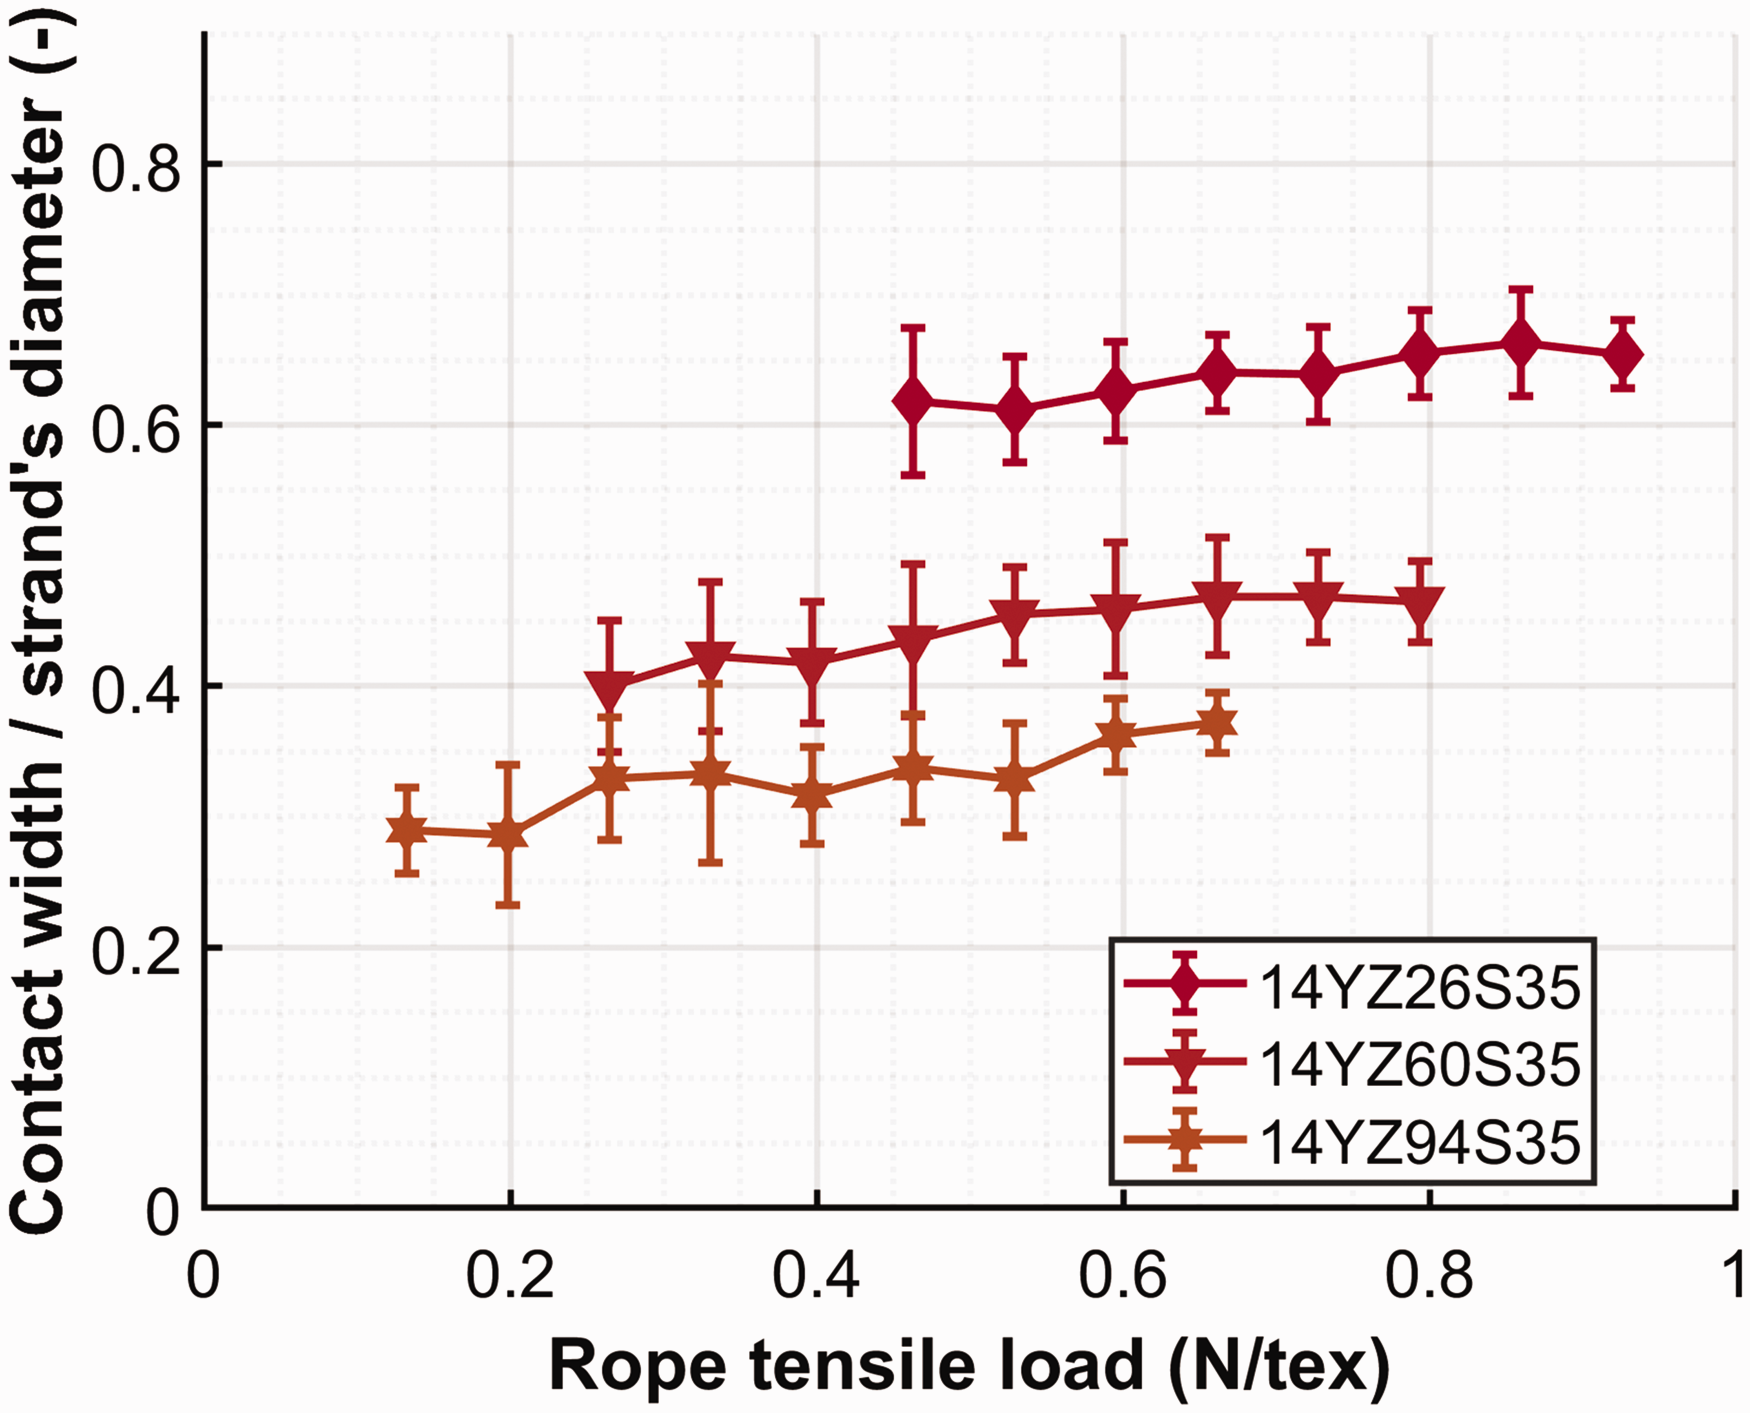
Experimental measurement of contact width using pressure films, highlighting effect of strand twist for 14 yarns/strand ropes.
Effect of rope twist
Figure 16 is a plot of the normalized contact width against the specific tensile load applied to ropes with varying degrees of rope twist. The data show that, as the rope twist increases, the measured normalized contact width increases. This occurs because a higher rope twist increases the force component at the strand–strand contact interface, leading to a higher normal deformation in the strands.
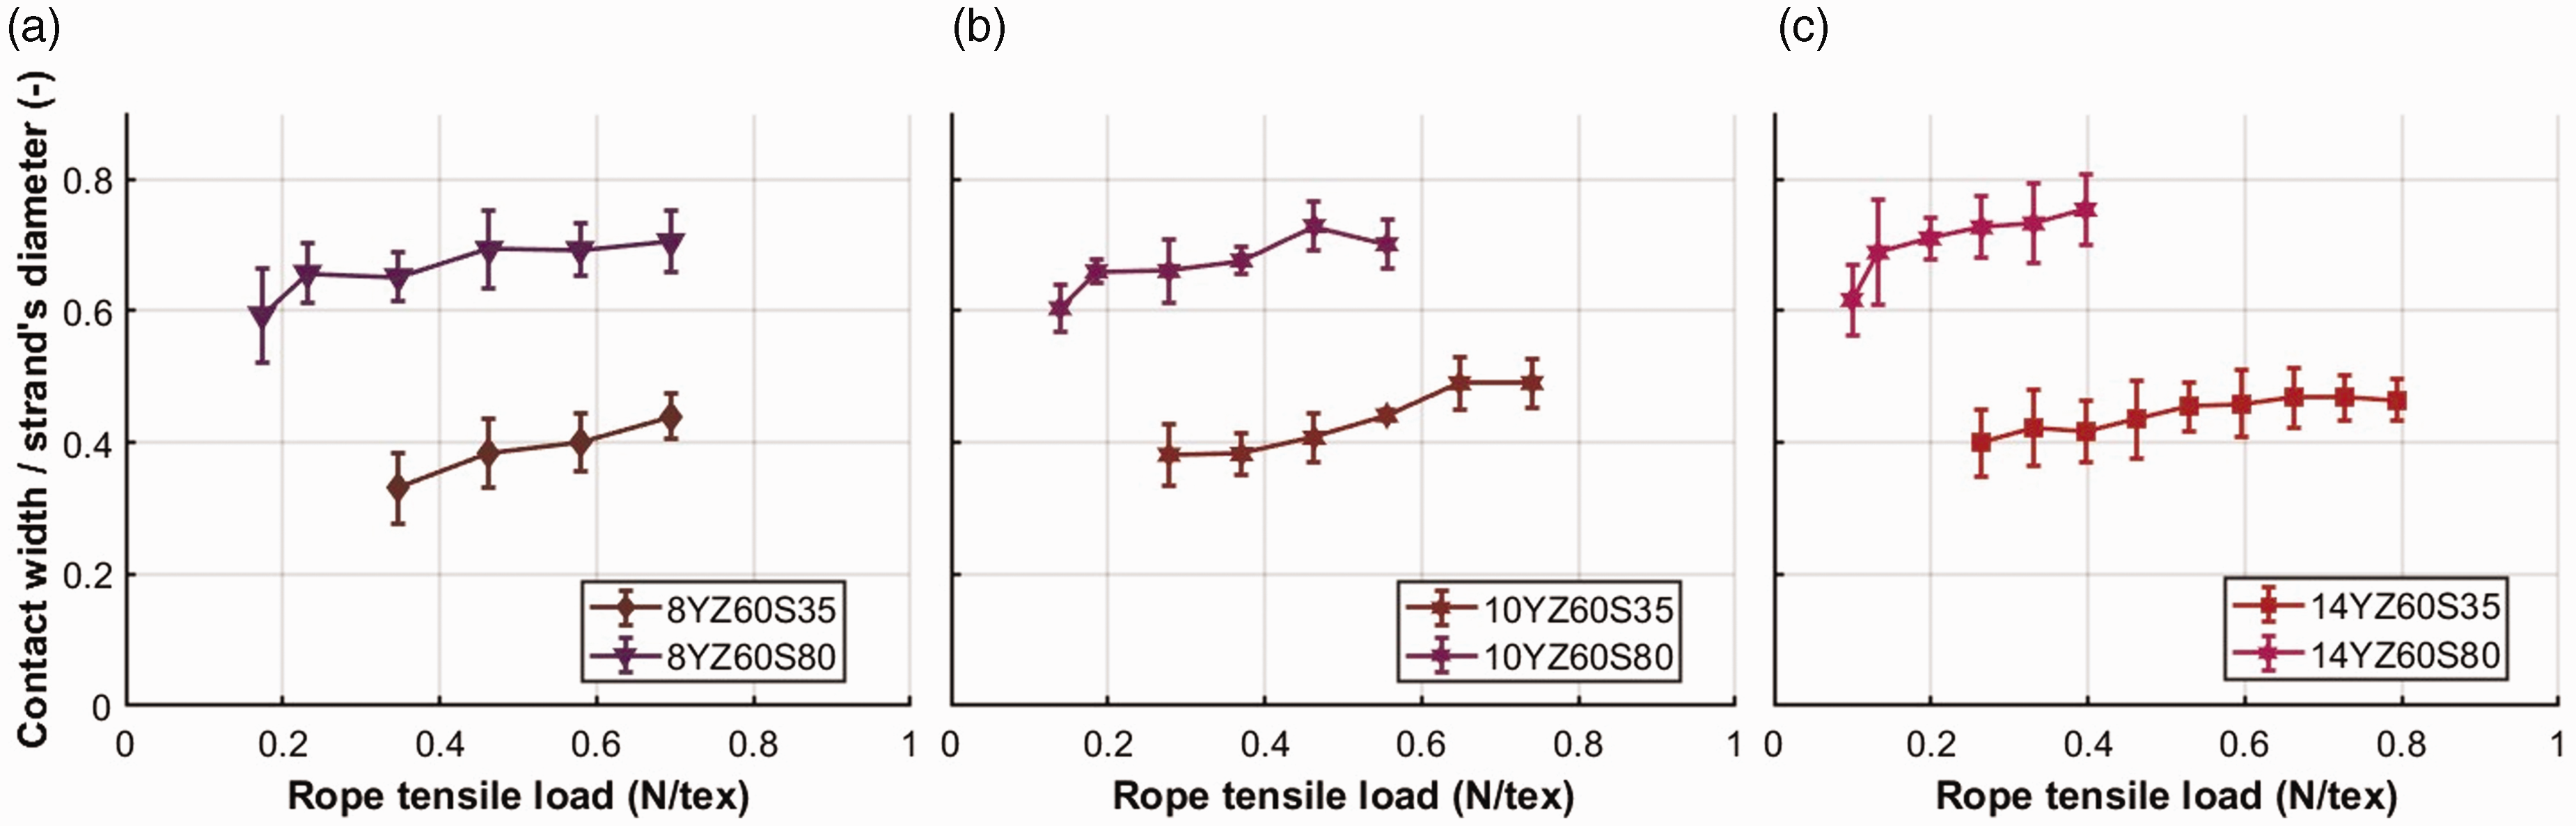
Experimental measurement for contact width using pressure films, highlighting the effect of rope twist for ropes with: (a) 8 yarns/strand; (b) 10 yarns/strand and (c) 14 yarns/strand.
Effect of number of filaments
Figure 17 is a plot of the normalized contact width against the tensile load applied to ropes with varying degrees of rope twist. The data show that, as the rope twist increases, the measured normalized contact width increases. This occurs because increasing the rope twist increases the helix angle and hence the force component at the strand–strand contact interface, leading to a higher normal deformation in the strands.
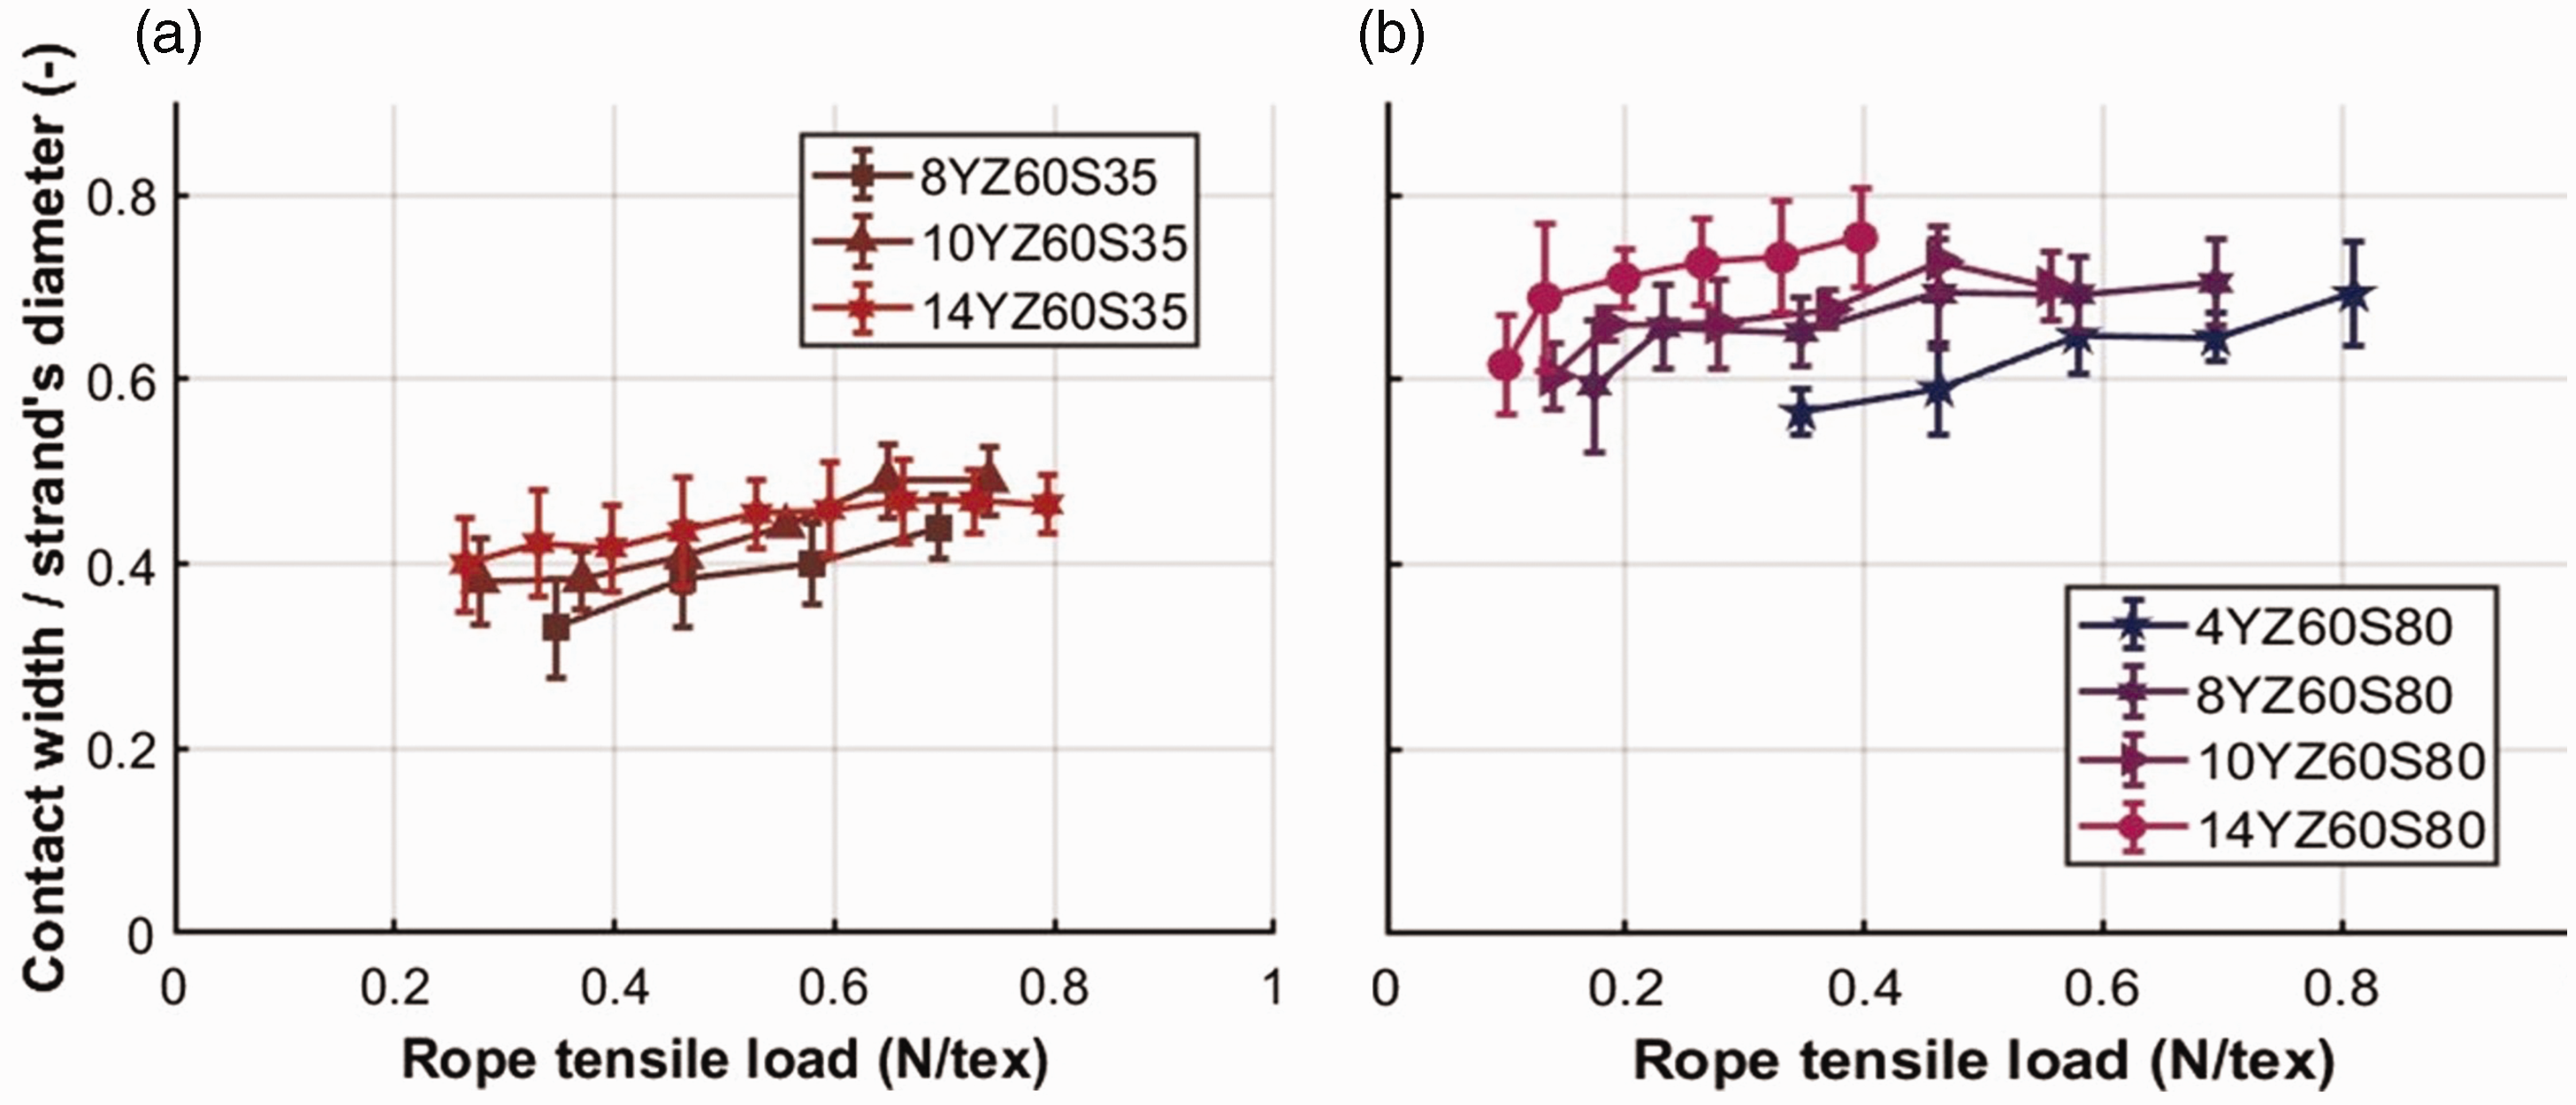
Experimental measurement for contact width using pressure films, highlighting the effect of number of filaments for: (a) Z60S35 ropes and (b) Z60S80 ropes.
The contact width at the strand interface quantifies the normal deformation and flattening of the strands, which increases as the strands are subjected to higher contact forces. However, as discussed earlier, strands with higher twist exhibit a higher stiffness and are more resistant to deformation. It is important to note that, in both our tested ropes and industrial ropes, the rope twist is always in the opposite direction to the strand twist. Therefore, applying a rope twist effectively untwists the individual strands, as observed by Treloar.
19
By neglecting the effect of strand retraction caused by twisting both the strand and the rope, Treloar
19
estimated the effective strand twist 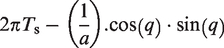
The effective strand twist is calculated and its impact on the strand’s contact width is analyzed by relating the normalized contact width to the experimentally measured contact force, as shown in Figure 18. Through this analysis on rope specimens with varying numbers of yarns, the effect of filament count can be isolated, allowing for a focused analysis of the impact of effective strand twist. This approach allows us to better understand how twist combinations influence the normal stiffness of the strands.
Effect of strand contact force on contact width for different net strand twists.
The results illustrated in Figure 18 demonstrate that, for the same effective strand twist, even when the individual rope twist, strand twist, and number of filaments are varied, the normalized contact width does not change for the same contact force. This consistency indicates that the normal stiffness of the strand depends solely on the effective strand twist. Moreover, a trend of increasing contact width ratio for the same contact force can be observed as the effective strand twist decreases. This trend is evident when comparing Figure 18(a) with Figure 18(c), as a decrease in the effective strand twist reduces the normal stiffness of the strand. Additionally, the effect of the effective strand twist on the contact width ratio can be seen in Figure 15.
Contact pressure
In this section, the effects of strand twist, rope twist, and the number of filaments on the contact pressure at the strand interface are examined. This is achieved by relating the applied tensile load on the rope (N/tex) to the experimentally measured contact pressure, derived from the analysis of pressure films.
Effect of strand twist
Increasing the strand’s twist increases its normal stiffness, 3 thereby decreasing the contact width between the strands, as elaborated previously. This, in turn, results in higher pressure for the same contact force on the strand. This effect is illustrated in the experimental results shown in Figure 19. Additionally, it is observed that these three different ropes with the same rope twist (S35) exhibit a similar trend (slope), which corresponds to the theoretical model, presented in equation (12), which does not include the strand’s twist in its formulation. As previously explained, pressure films become less accurate at pressures exceeding 40 MPa; this explains the larger error bars shown in Figure 19 for measurements above 40 MPa.
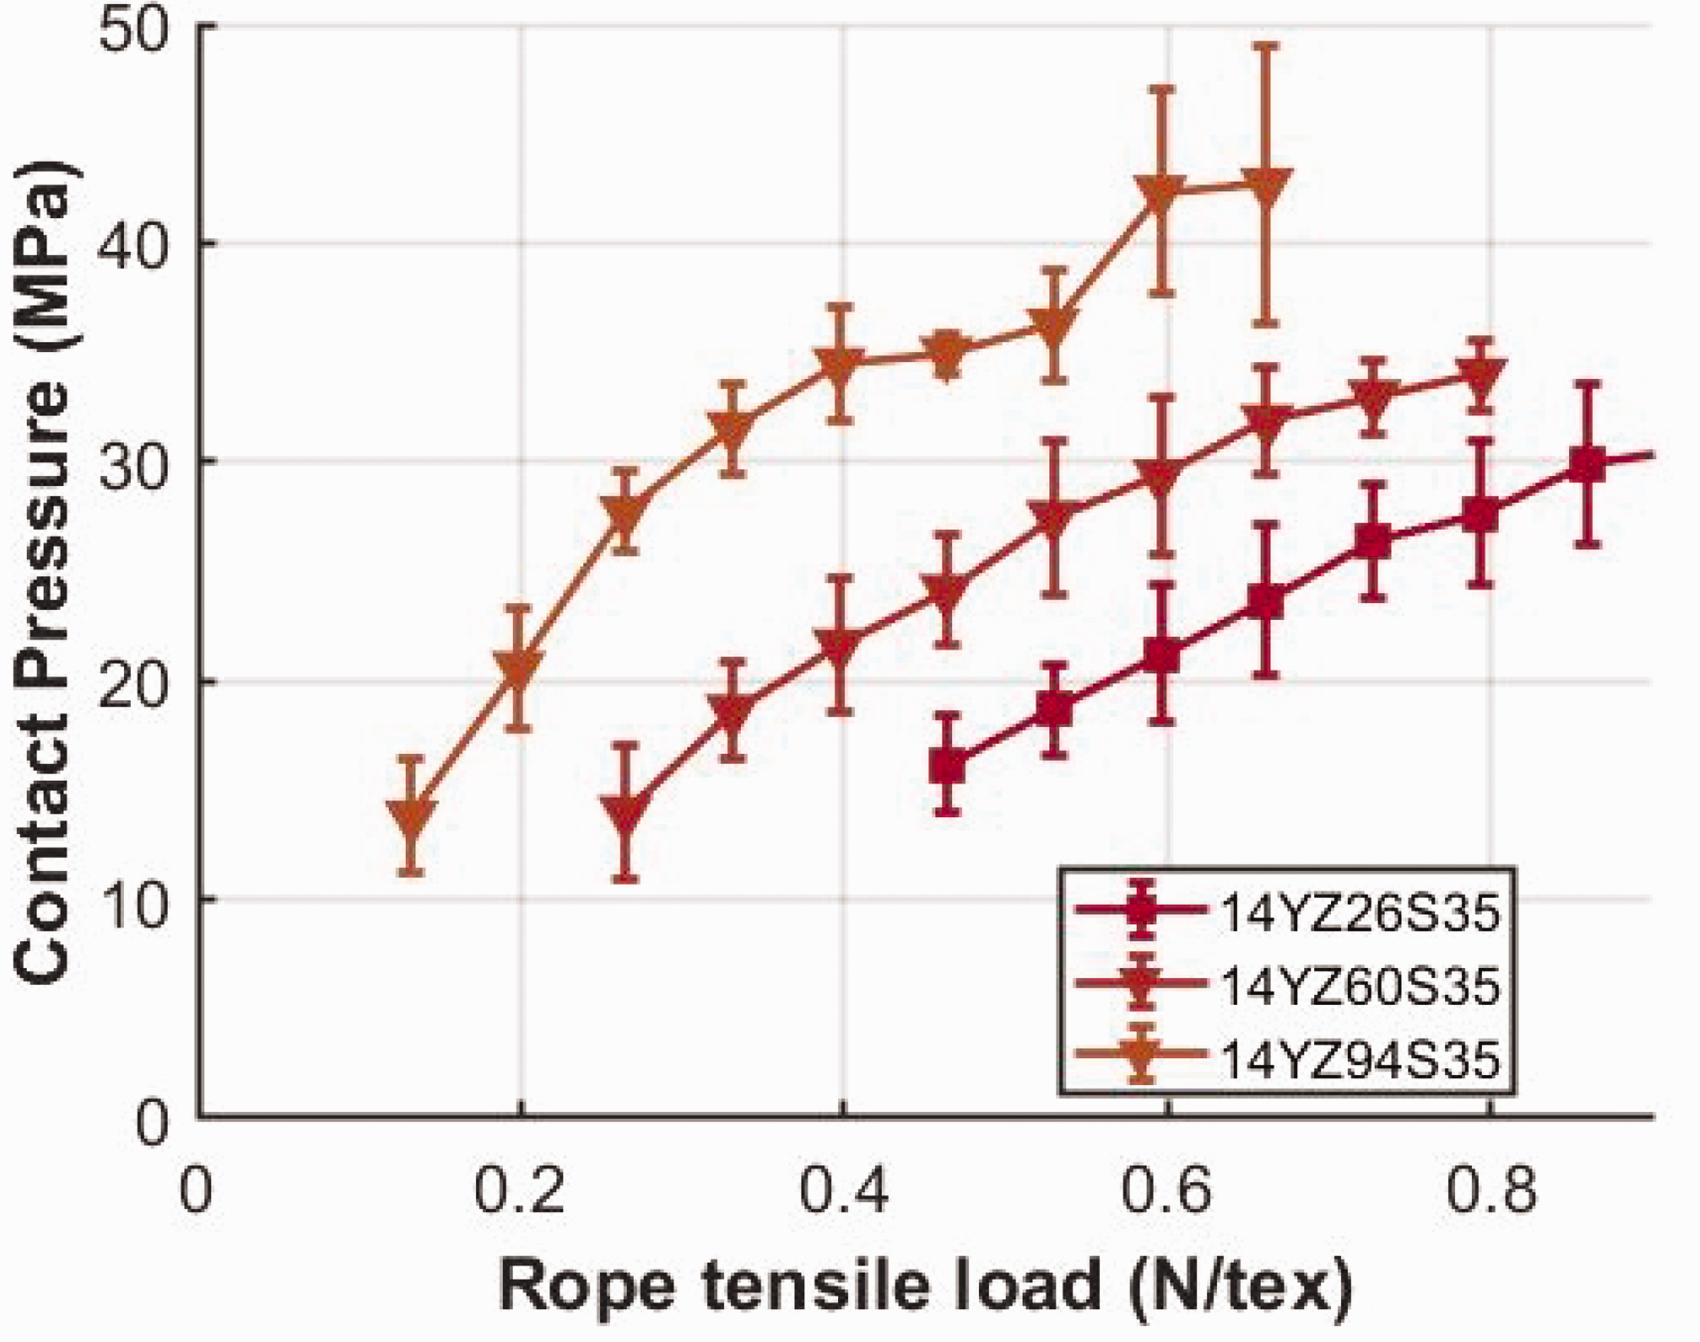
Experimental measurement for contact pressure using pressure films for S35 ropes with varying strand twists.
Effect of rope twist
Increasing the rope’s twist increases the contact force between the strands. As shown in Figure 20, the rope’s twist affects the trend (slope) of the experimental contact pressure–applied tensile load relationship. This means that the twist directly influences the way in which the tensile load is converted into normal contact forces between the strands. This observation supports the theoretical model presented previously, particularly in equation (12), which demonstrates that the contact force
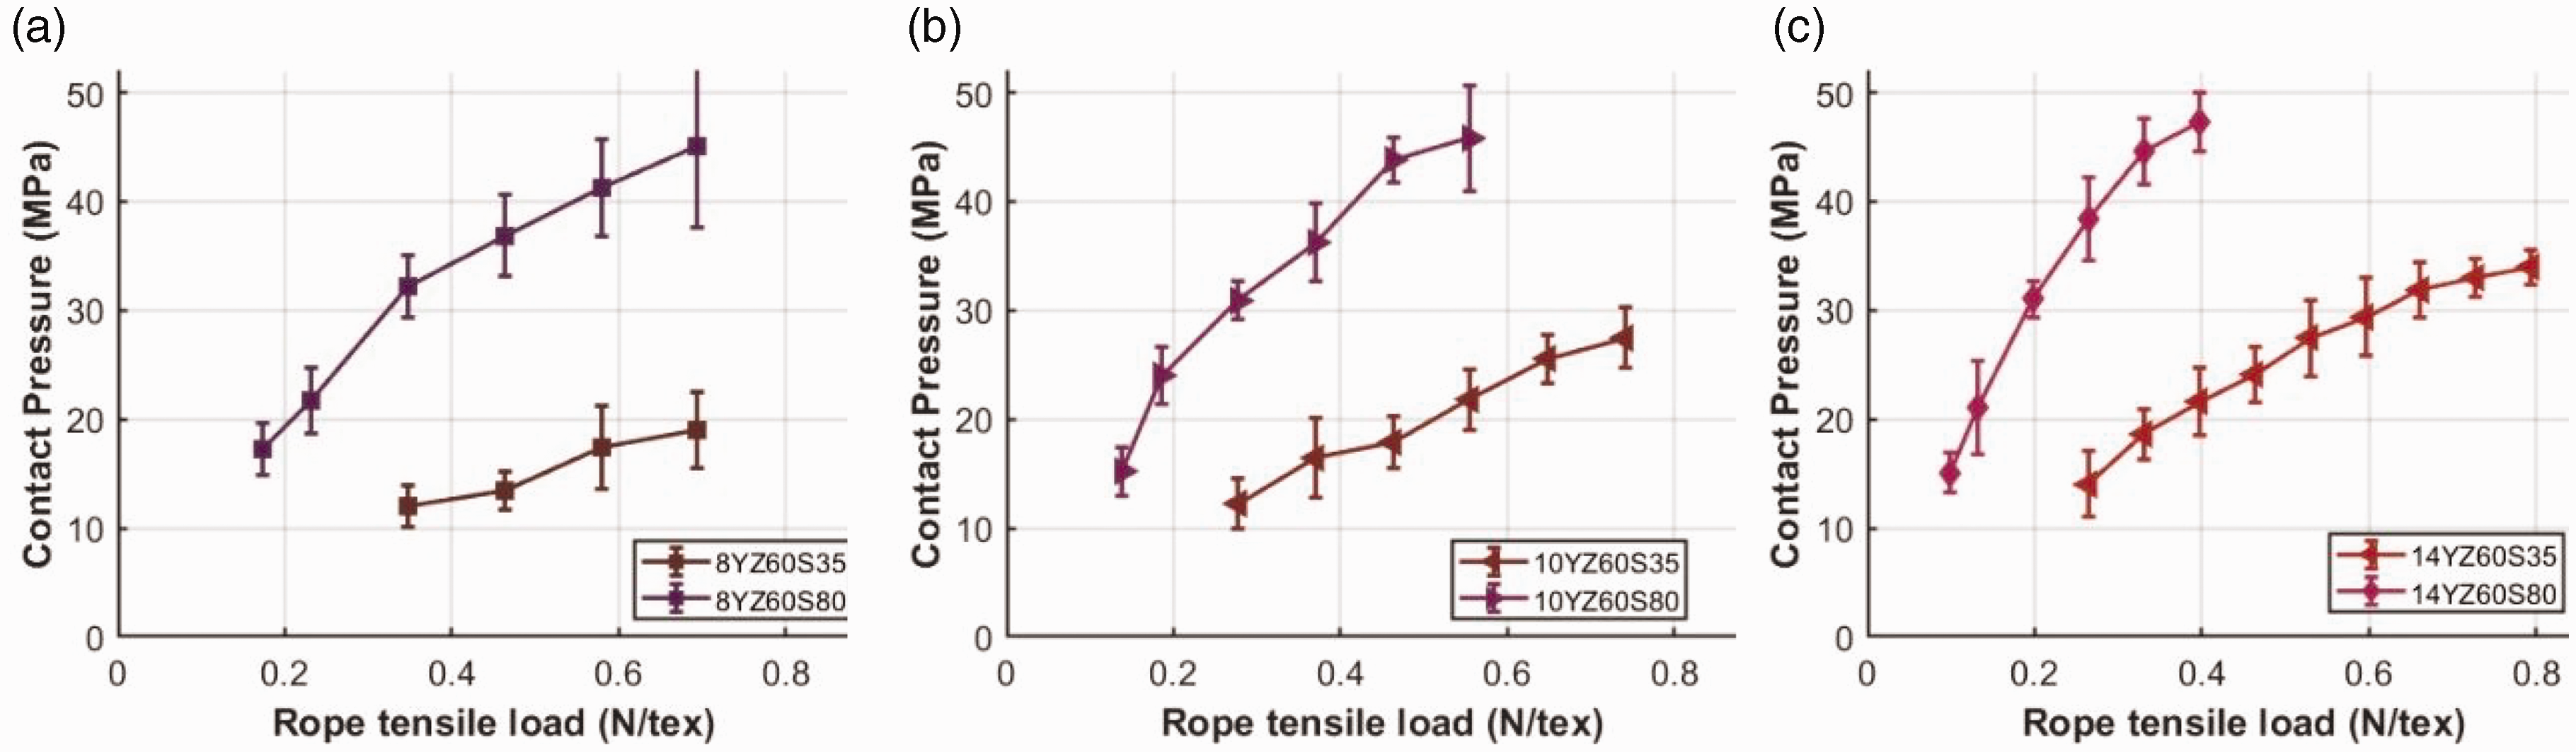
Experimental measurement for contact pressure using pressure films, highlighting the effect of rope twist for ropes with: (a) 8 yarns/strand; (b) 10 yarns/strand and (c) 14 yarns/strand.
Effect of number of filaments
Understanding scalability is crucial for the lifetime of larger industrial ropes, which might reach the plastic limit at the strands’ interface at a relatively smaller fraction of the breaking load, compared with smaller ropes, potentially reducing their operational lifespan.
It can be observed from Figure 21 that increasing the number of filaments, for the same applied tensile load (N/tex), results in a greater contact pressure. This can be explained by Batra’s analytical model, 22 which suggests that a higher number of filaments results in a larger strand diameter. Consequently, this leads to a higher mean helix angle for the filaments, directly increasing the resulting strand–strand forces as the rope is loaded.
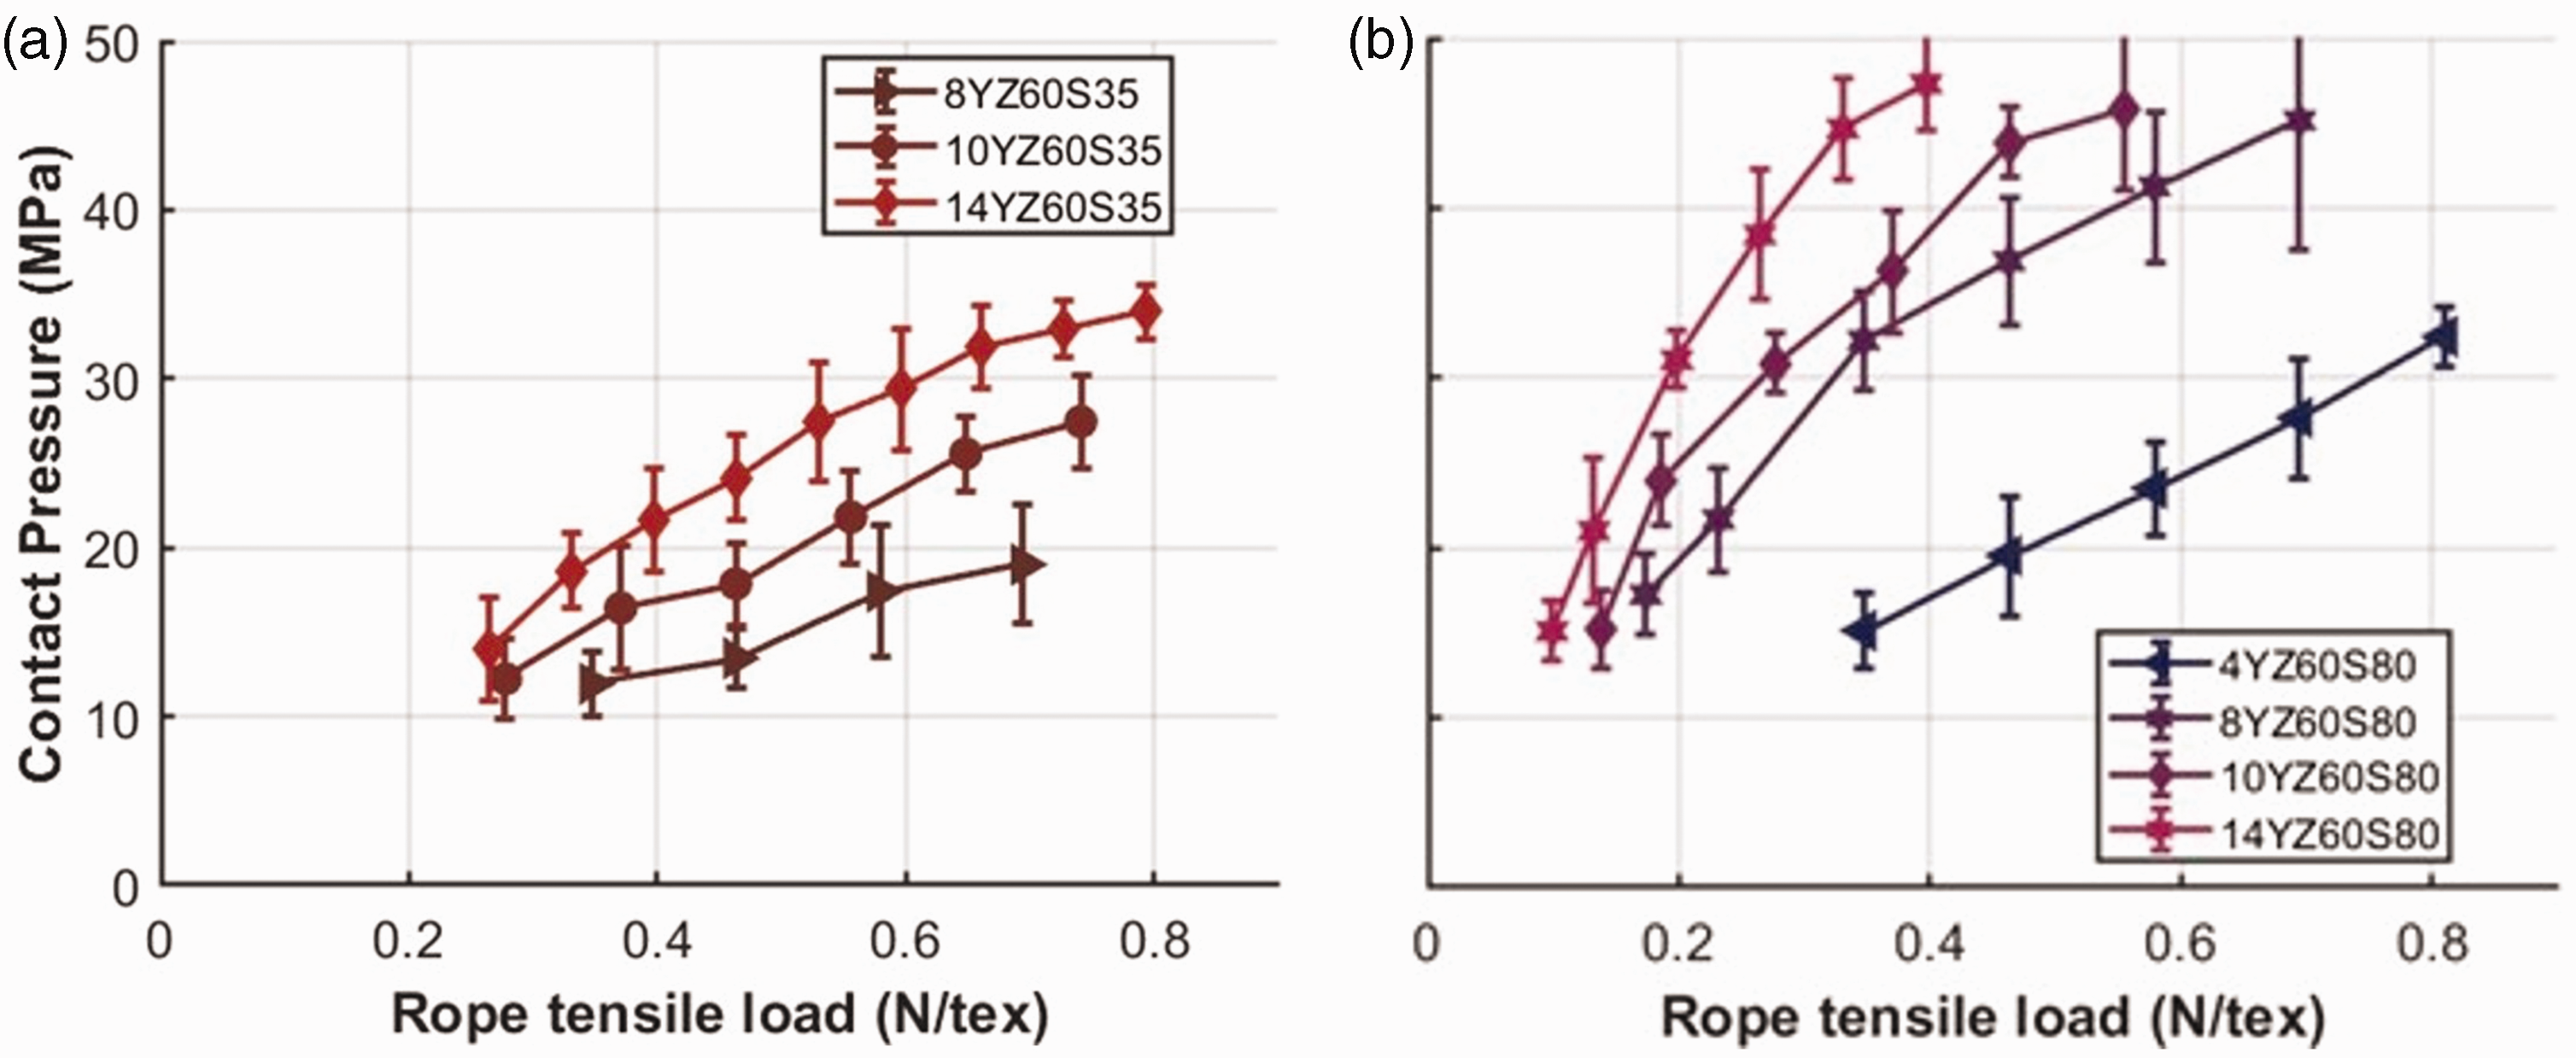
Experimental measurement for contact pressure with varying numbers of filaments for: (a) Z60S35 ropes and (b) Z60S80 ropes.
It is noteworthy that, for the same applied total load (kN), the experimental results plotted in Figure 22 show almost the same contact pressures at the strand–strand interface with an increasing number of filaments. This indicates that a higher number of filaments increases both the contact width and the contact forces simultaneously, so that they balance each other out to maintain similar contact pressures.
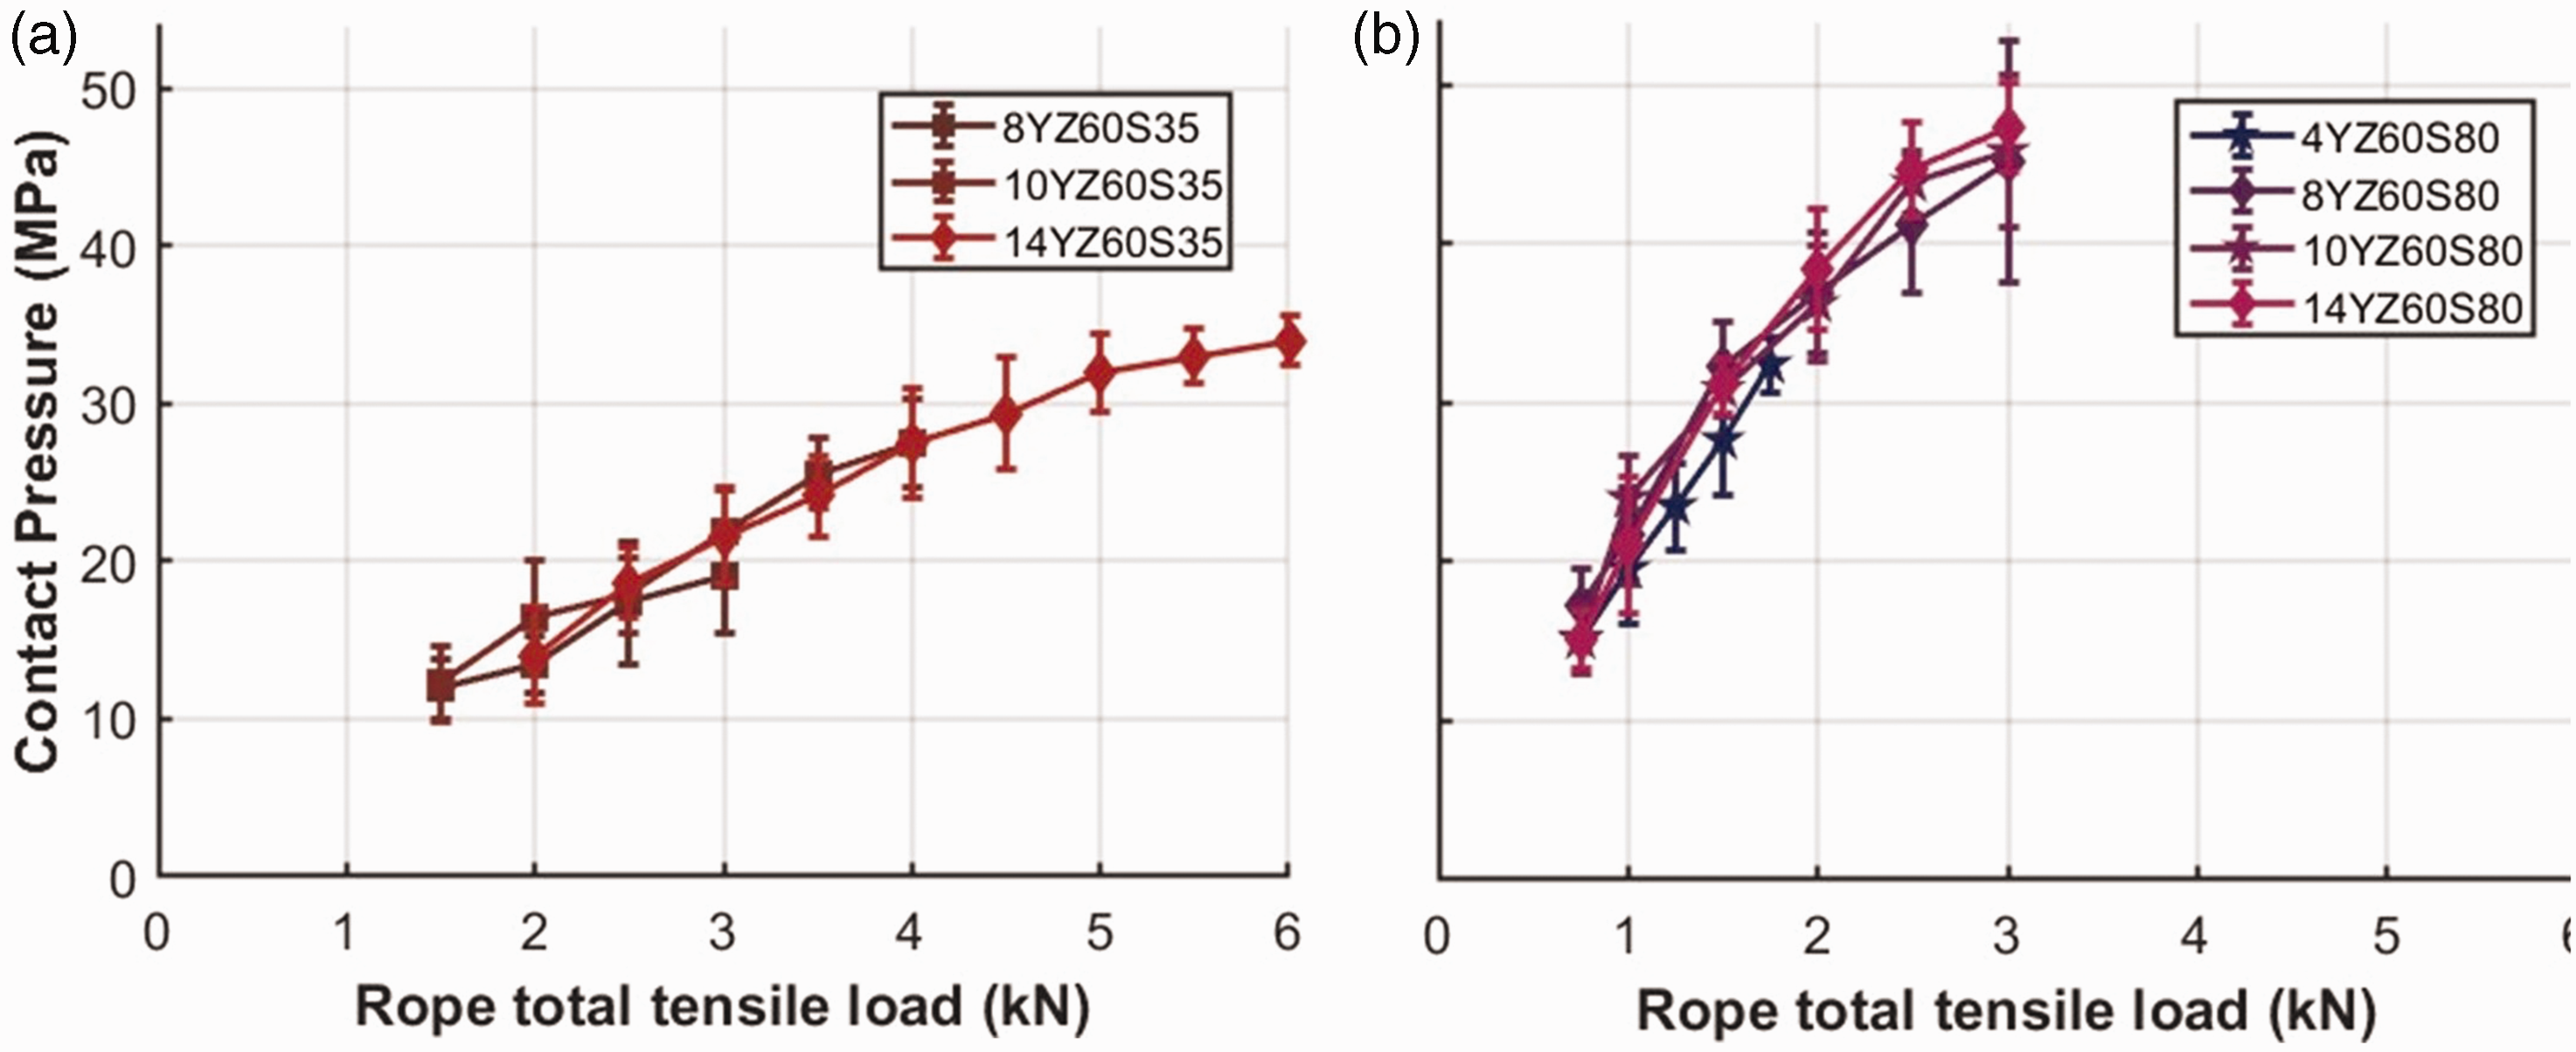
Experimentally measured pressure with varying numbers of filaments for: (a) Z60S35 ropes and (b) Z60S80 ropes. The x-axis represents the rope tensile load in kilonewtons.
Linearly projecting the values of contact pressure for a larger number of filaments indicates that the contact pressure between the filaments at the strand–strand interface approaches levels that cause plastic deformation under the same tensile load (N/tex), corresponding to a percentage of the breaking load. This is relevant for industrial applications, where the number of yarns per strand is significantly greater. This plastic deformation reduces the lifetime of the rope under operation. Figure 23 estimates contact pressures for a larger number of filaments per yarn using linear approximation. For instance, for Twaron fibers with a Z60S35 twist combination at a 0.4 N/tex load, which is a reasonable load, a rope with
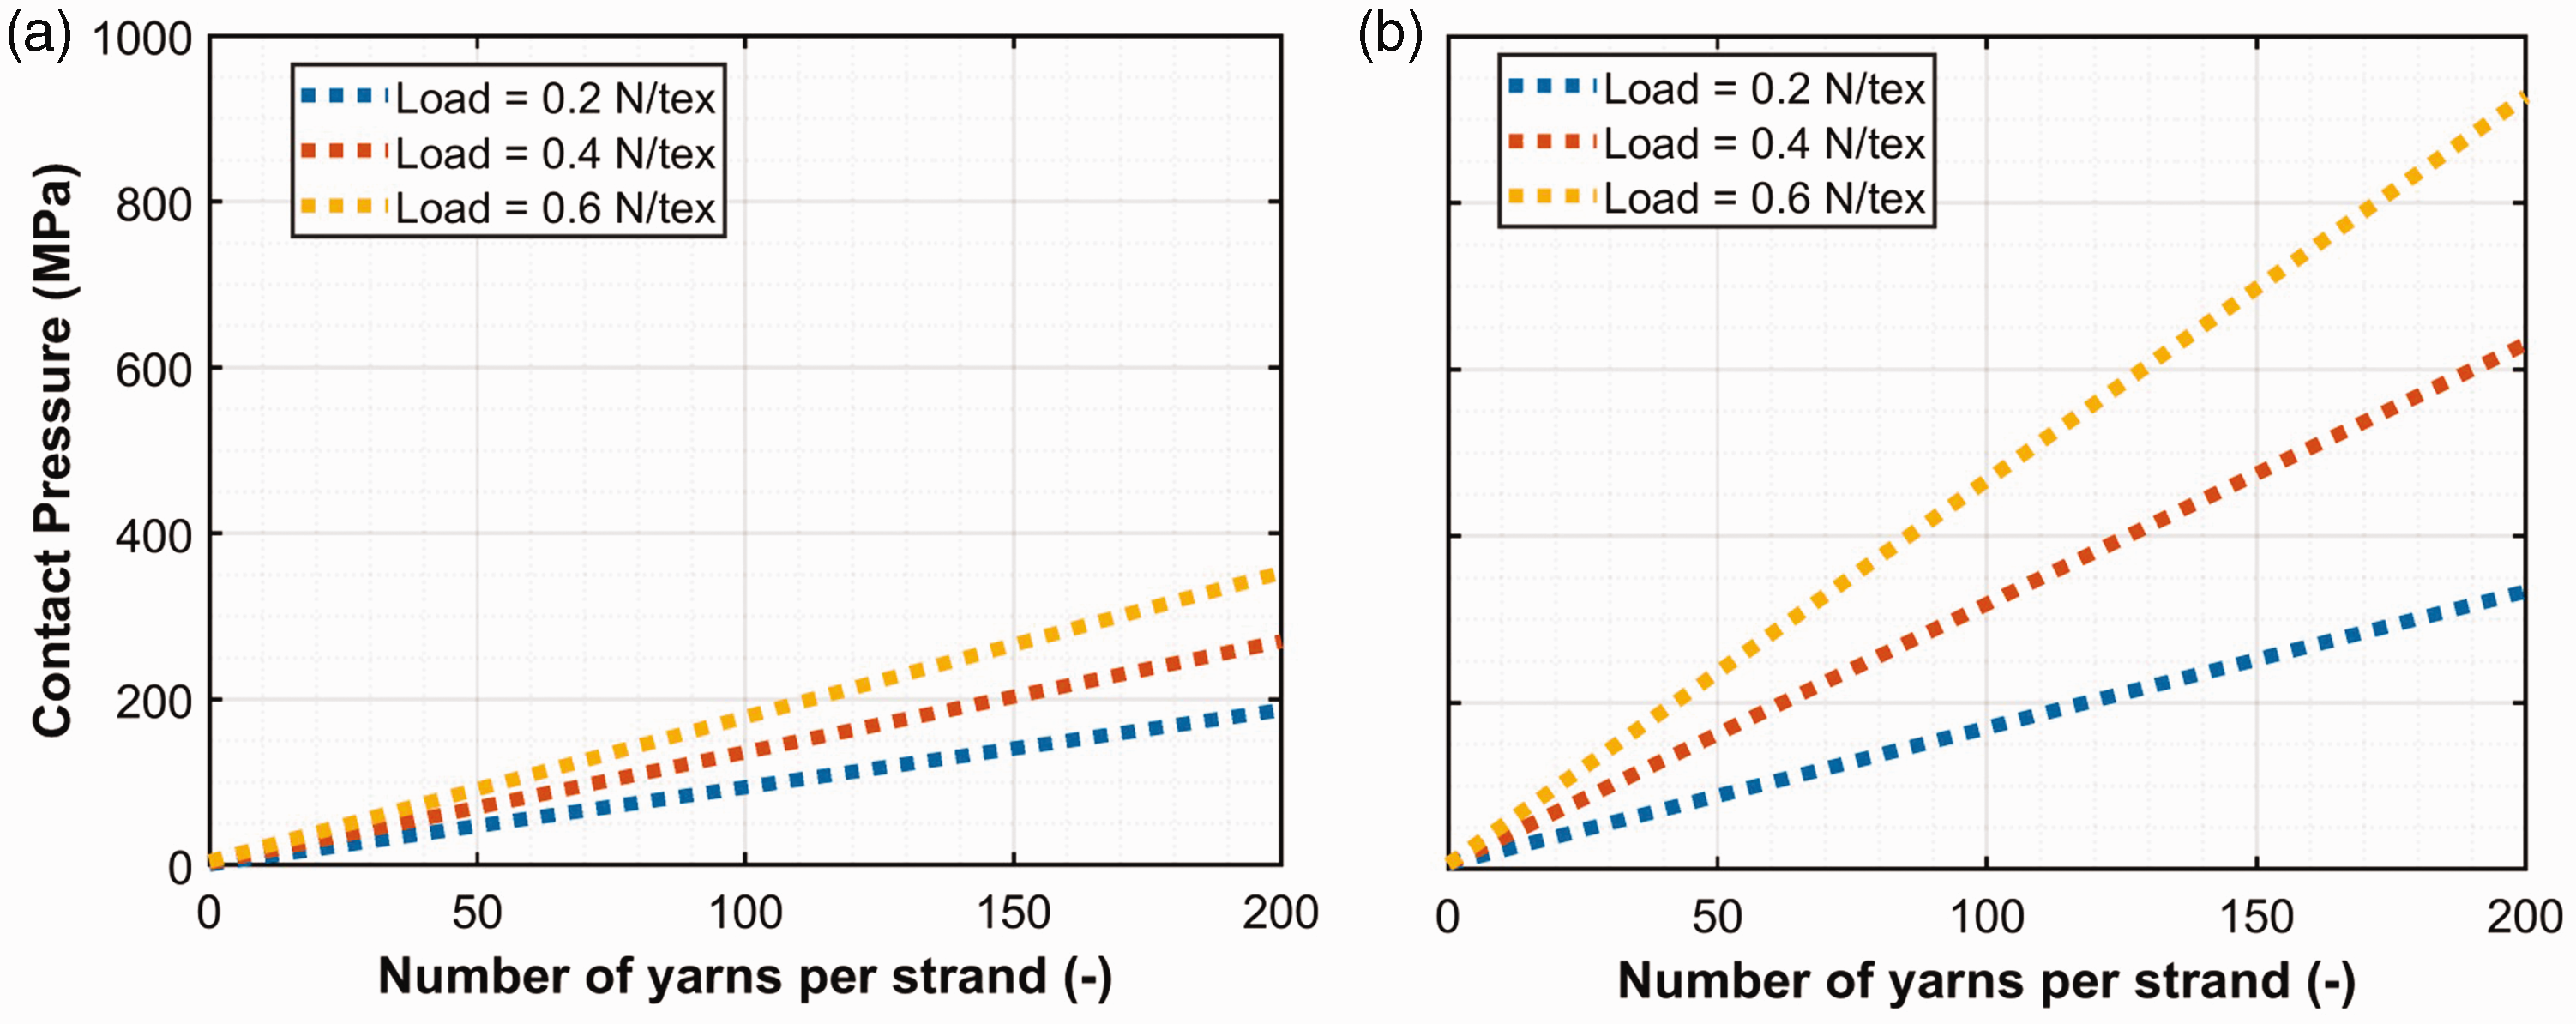
Linear projection of contact pressure based on the number of yarns per strand at three different tensile load loads for: (a) Z60S35 ropes and (b) Z60S80 ropes.
To provide some context for industrial ropes, the PSFS aramid ropes manufactured by Phillystran 34 can contain up to 7000 yarns per rope. For an applied load of 0.4 N/tex, corresponding to 27% of its breaking load, and assuming a three-strand rope construction, this configuration will generate extremely high contact pressures at the strand interfaces that exceed the elastic limit and can cause fiber fibrillation, as shown by Singletary et al.15,16 After fibrillation, the fibers can withstand transverse compression but can no longer support tensile loads; this results in weakening of the rope.
Experimental validation of analytical model
The experimentally measured contact force, as explained previously, can be compared with the analytical model described previously.13,22 Using this model, contact forces were plotted against the rope tensile load curves and compared with our experimental findings, as shown in Figure 24.
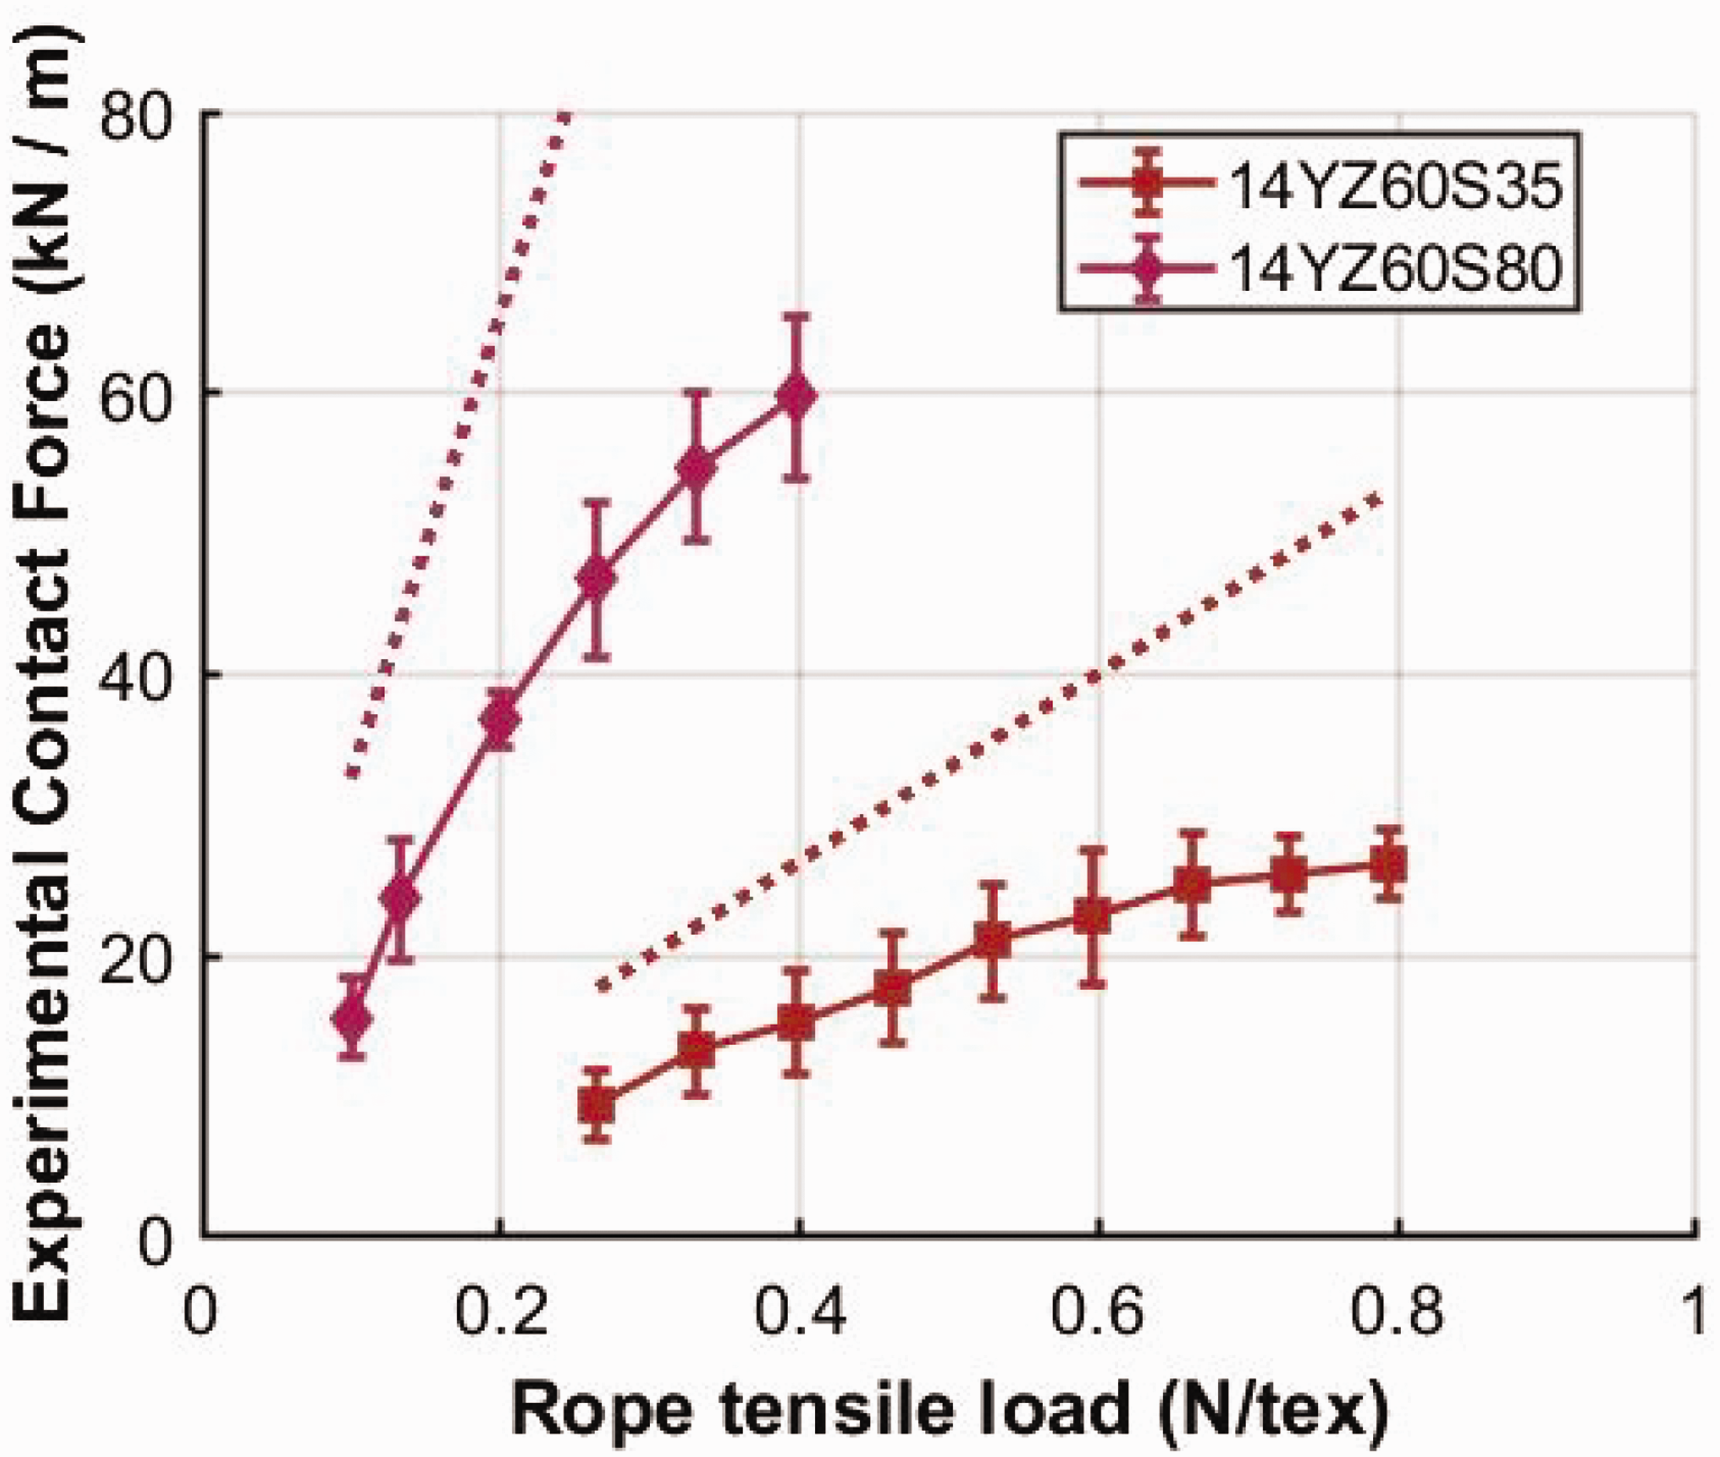
The model overestimates the contact forces, owing to two key assumptions: (1) the ideal helix structure, with the calculation of the strand’s helix angle, and (2) the behavior of the strand as a single continuous solid entity. The distribution of filament angles in ropes with twisted strands deviates from the ideal helix model for two main reasons. First, there is a difference in local strain values between filaments at the strand’s periphery and those at the strand’s interface. This manifests in two ways: (1) a strand radius reduction occurs at the strand’s outer periphery, observed by Hsu
13
to be 20% of the strand’s radius, and (2) equalization of the local filament angles. Filaments on the outer edge experience a higher local strain, resulting in smaller angles with the rope’s axis and a tendency to align with it. Conversely, filaments near the rope’s center have higher filament angles, owing to lower local strain.
19
Second, flattening of the strand occurs at the strand–strand interface. As the analytical contact force depends on the strand’s helix angle
Therefore, following the previous deviations from the ideal model, a correction factor of 0.74 of the helix angle, obtained by fitting the model with the experimental data, is applied to calculate the strand’s helix angle
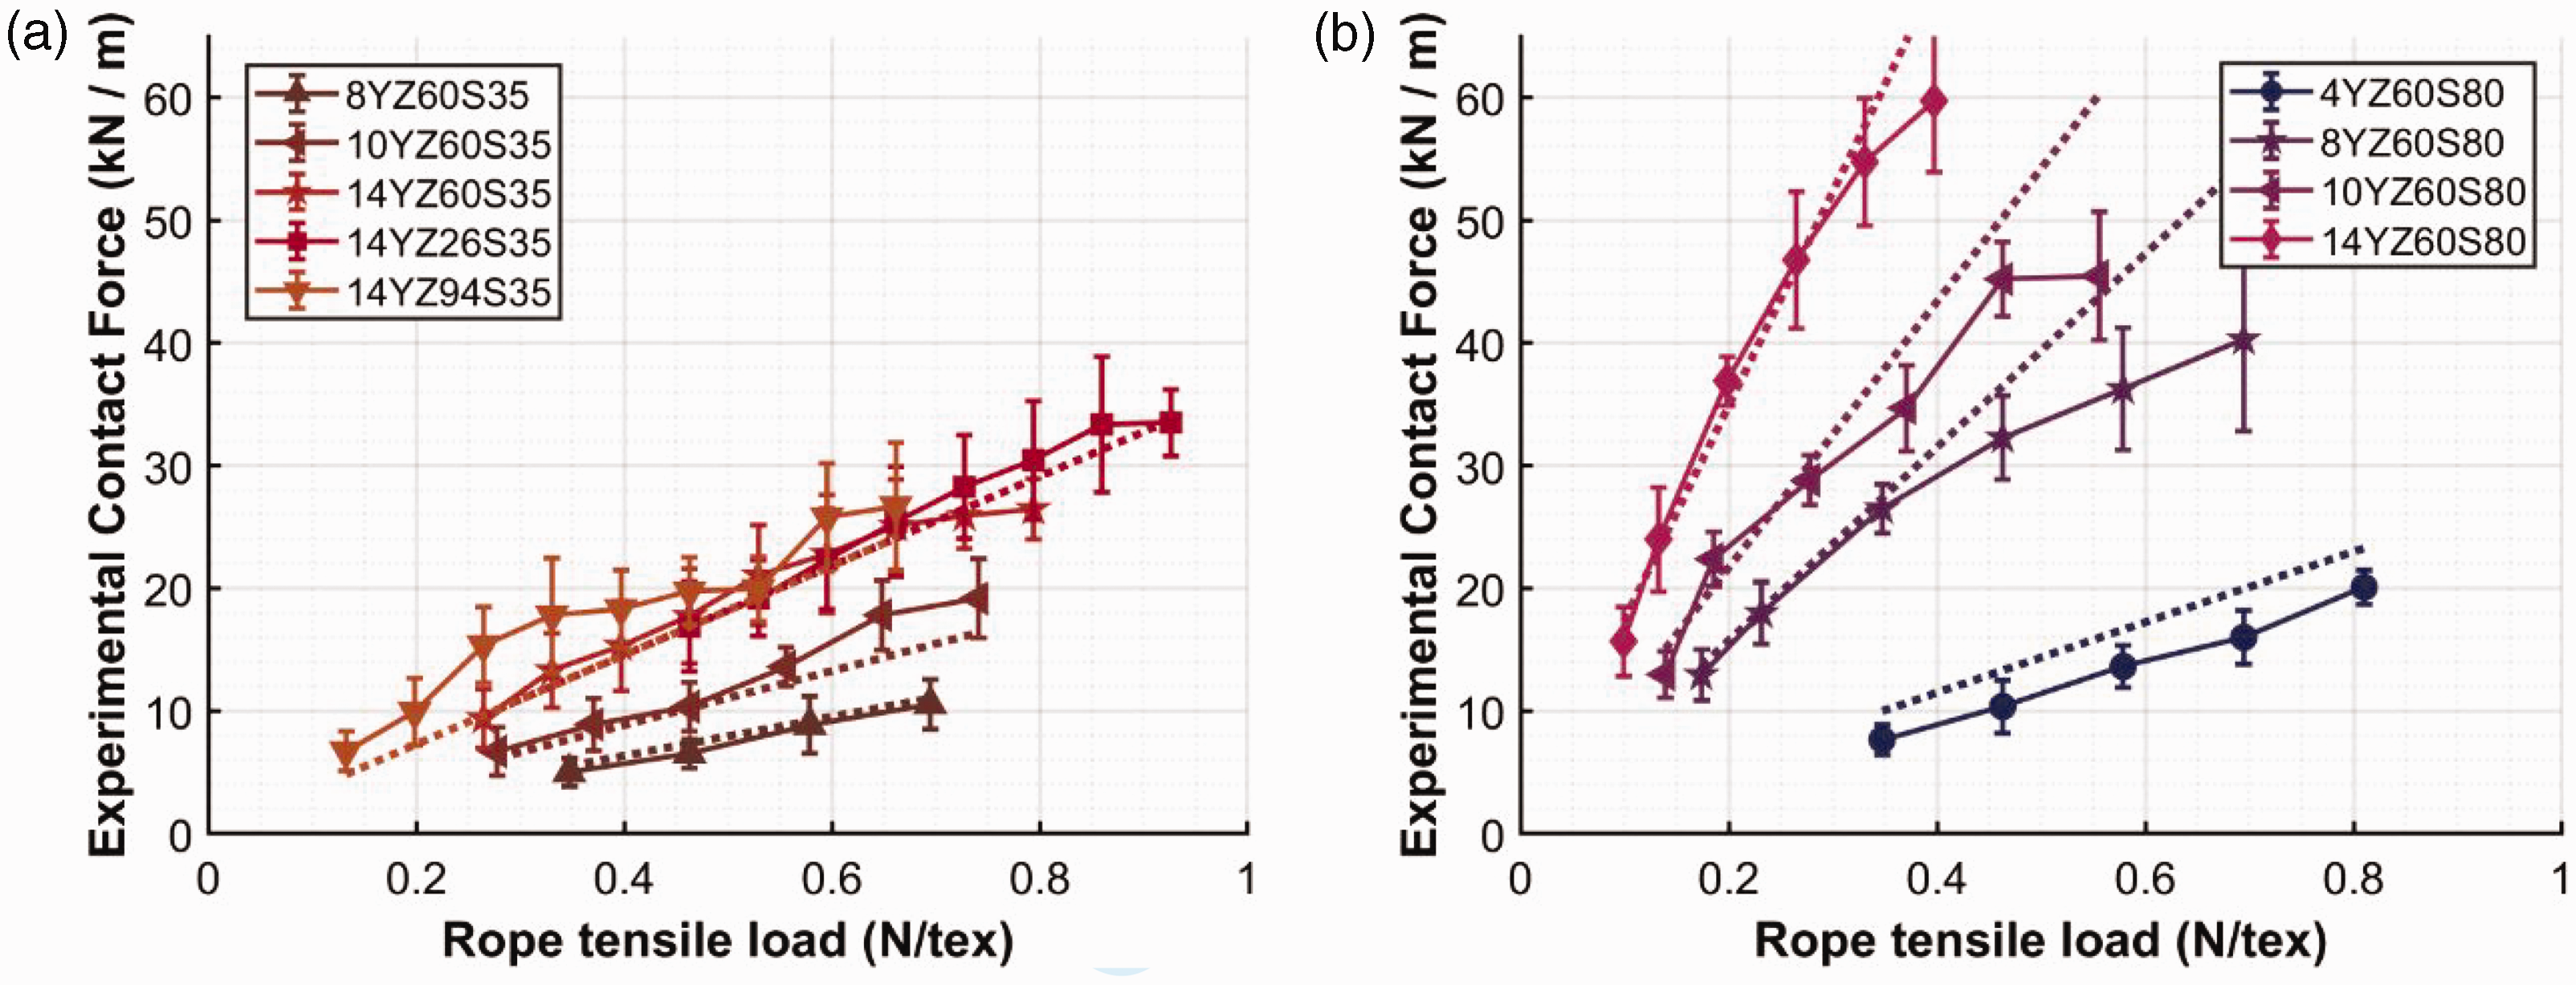
Comparison between our experimental results and the Batra–Hsu contact model, represented by dotted lines, with an adjusted helix angle for ropes with a rope twist of: (a) S35 and (b) S80.
Conclusions
This study is an experimental investigation of the effects of rope twist, strand twist, and the number of filaments on contact forces at the strand–strand interface in three-strand aramid ropes. Using pressure films, contact pressure and contact width were measured and analyzed, along with the calculated and contact forces under various tensile loads and rope configurations, offering valuable insights into the relationship between rope structure and internal contact forces. The key findings from this study can be summarized as follows:
For the same effective strand twist, even when varying individual rope twist, strand twist, and the number of filaments, the normalized contact width does not change for the same contact force. Increasing strand twist increases strand stiffness, which reduces contact width and consequently increases contact pressure for the same contact force. Increasing the number of filaments for the same load per fiber linear density (tex) leads to higher contact pressure. The rope tensile load has an approximately linear relation to the contact force inside a three-strand rope. Increasing rope twist increases contact force. However, increasing strand twist increases contact width and contact pressure for the same tensile load, which results in similar contact forces for different strand twists. The analytical model derived from the literature predicts the experimental trends well but overestimates the contact forces for three-strand ropes, mainly for geometrical reasons. A correction factor for the mean helix angle to take into account geometrical effects related to the deviation from the perfect helix shape results in qualitative agreement between model and experiments.
The strength of this study lies in using a novel experimental technique with pressure films to characterize contact width and contact pressure at the strand–strand interface for validating an analytical model by introducing a correction factor that enables the prediction of contact forces for any Twaron three-strand rope. A key limitation is that the experiments were limited to a specific rope material and construction; future work could expand the scope by exploring different rope materials and constructions.
Footnotes
Acknowledgments
This research was carried out under project number 17981 in the framework of the Partnership Program of the High Tech Systemen en Materialen (HTSM) 2019 TTW, Netherlands Organization for Scientific Research (![]() ). The authors thank and acknowledge Vincent van Bommel and Dr. Bo Cornelissen from Teijin Aramid for their support with timely preparation and supply of aramid rope specimens.
). The authors thank and acknowledge Vincent van Bommel and Dr. Bo Cornelissen from Teijin Aramid for their support with timely preparation and supply of aramid rope specimens.
Data availability statement
The data generated and analyzed during this study are available upon reasonable request from the corresponding author.
Declaration of conflicting interests
The author(s) disclosed the conflicts of interest with respect to the research, authorship, and/or publication of this article: Oday Allan reports financial support provided by Teijin Aramid BV. The other authors have no conflicts of interest to declare.
Funding
The author(s) disclosed receipt of the following financial support for the research, authorship, and/or publication of this article: This work was supported by the Netherlands Organization for Scientific Research (NWO) (award number 17981) and Teijin Aramid BV.