
Abstract
Studying the internal geometry of fibrous structures is critical for understanding their behaviour and improving their durability and performance. This study introduces an innovative micro-computed tomography (micro-CT) approach to analyse the internal geometry of three-strand ropes, focusing on filament orientation and its dependence on varying rope and strand twist configurations. Using advanced digital segmentation techniques, the micro-CT scans effectively isolate and quantify individual filaments, enabling precise measurements of filament-to-rope angles and their distributions. These experimental measurements are compared against a theoretical analytical model based on a double-helix structure, which accounts for strand retraction. The results reveal that the analytical model closely predicts filament orientations within the strand core but shows discrepancies near strand interfaces due to inter-strand forces. Higher strand-to-rope twist ratios reduce these deviations. This study not only underscores the limitations of current analytical models but also provides valuable insights into refining these models for more accurate predictions. A deeper understanding of this is important for improving the performance of fibrous ropes.
Keywords
Introduction
Rope structures, especially those comprising of synthetic fibres like Twaron®, have a wide range of applications across aerospace and maritime industries, 1 due to their excellent mechanical properties such as high strength and durability. 2 Twaron, a para-aramid fibre known for its high specific tensile strength, and improved heat resistance, is often employed in ropes that must endure extreme mechanical stresses and environmental conditions. 3 Understanding the internal structure of these ropes, particularly at the filament level, helps to gain a deeper understanding of how different rope constructions perform and degrade under various loading scenarios. This is critical for predicting their lifetime and improving their performance in specific applications.
Rope structures can incorporate multiple levels of twist, each of which influences the rope’s mechanical behaviour. 4 “Strand twist” refers to the winding of filaments to form the strand, while “rope twist” refers to the helical winding of strands around the rope’s central axis. The interaction between these twists affects the orientation of the filaments which in turn affects key mechanical properties, such as tensile strength, load distribution, and flexibility. 5 Further, a rope with larger filament angles near the strand interfaces typically results in more internal slip, which can lead to internal degradation of the rope. To understand these effects, analytical models6–8 have been developed to predict filament angle distributions within twisted rope structures, providing a mathematical framework to explore the relationship between twist configurations and the resulting orientation of the internal filaments.
Early models of fibre paths in ropes explored various idealized trajectories, such as helical, 5 conical, 9 doubly, epihelical paths, 10 and a wound helical 8 path which is especially relevant to this research. The advantages of a wound helical fibre path are its simple construction and its idealized representation of a double-twisted filament path. By allowing fibres to follow both primary and secondary helical paths, Treloar’s 8 model can represent how fibres might be arranged in real ropes, providing a closer approximation of the filament structure within the rope compared to simpler single-helical models. 5
Further advancements in analytical modelling of rope structure, like the use of Orientation Density Functions (ODFs), developed by Hearle5,7 and Jeon6,11 have improved the accuracy of predicting yarn’s mechanical behaviour by providing a more detailed representation of filament orientations within the yarn. Additionally, Kumar et al. 12 investigated the relationship between applied transverse compressive load and yarn packing density, to show that the applied load initially increases packing density up to a certain point, after which further compression has minimal effect on the packing density. 13 However, these models have not been experimentally validated. Real materials exhibit complexities which are not accounted for in simplifications assumed in theoretical formulations.
Experimental characterization of the distribution of filaments angles for few microns diameter filaments inside a rope structure is challenging due to the complex, intertwined nature of the filaments within the strands. Several experiments have been done to assess the orientation of fibres in twisted yarns. Morton and Yen 14 introduced the Fibre Tracer Technique, where coloured fibres are added to a yarn bundle and observed under a microscope after immersing in a liquid that matches the refractive index of the fibres. This method helps estimate fibre migration but does not provide a complete trajectory description suitable for mechanical modelling. Later, Lee et al. 15 applied this technique to study the orientation distribution in spun yarns, and found that the fibre angle typically follows a normal distribution curve. Komori et al. 16 sliced the yarn into thin sections and analysed the fibre angles under a microscope, and observed a normal distribution of fibre angles. Despite these findings, few studies have successfully reproduced these experimental methods, leading to a reliance on analytical models to describe fibre configurations and migrations, often without substantial experimental insights and validation.
Advancements in imaging technologies, particularly micro-X-ray computed tomography (µXRCT), have significantly enhanced the potential for experimental measurements. This non-invasive technique provides high-resolution images that can be analysed to extract detailed information about the internal geometry of porous materials. Advanced image processing techniques, such as segmentation algorithms, can be used to isolate individual filaments from micro-CT scans of filament bundles. By segmenting the micro-CT images at the filament level, it becomes possible to quantify filament orientations and angle distributions, which can then be compared with predictions from analytical models. 17
Toda et al. 18 employed micro-CT to model the structure and mechanical parameters of multi-component natural staple fibre yarns in ropes, focusing on the distribution of fibres within twisted strands. The study identified uneven fibre filling and twist across the yarns. Ding et al. 19 explored the effects of preloading and pitch length on the tensile strength and strain behaviour of braided polyarylate fibre ropes, using digital image correlation (DIC) and micro-CT to capture deformation responses under cyclic loading. However, while Ding et al. 19 analysed the compaction of yarns within the braided structure, their study also did not segment or analyse individual filaments, leaving a gap in the detailed understanding of filament distribution and its impact on the rope’s mechanical behaviour. Both studies indicate the need for more magnified insights at the filament level to better understand the internal structure and improve modelling accuracy.
Sibellas et al. 17 calculated orientation angles of the filaments in two- and three-ply yarns made up of polyamide by analysing the spatial distribution of mean filament angles within the yarn cross-section. Initially, each yarn was divided into smaller sub-sections across the yarn’s cross-section. In each sub-section, they computed the mean angle of all filaments passing through that area, which revealed variations in yarn twist, helping visualize the overall distribution of the filament orientation. For multi-ply yarns, they employed a local reference frame to track the movement of individual plies around the yarn axis, dividing the cross-section into small squares to average filament angles within each region.
While this approach provides useful insights into overall trends in filament orientation, it relies on averaging filament angles across regions, which can obscure finer details of individual filament paths. This method lacks the precision of analysing each filament separately, as it smooths out local deviations from the mean and limits visibility into microscopic variations in filament distribution, especially in areas with high filament migration or complex localized interactions such as the strand-strand interface. Additionally, all micro-CT scans in the study done by Sibellas et al.
17
were conducted at a resolution of 2.5 µm, appropriate for polyamide filaments (average diameter∼30 µm) but insufficient for finer filaments like aramid, which are approximately 12 µm in diameter. When comparing their results with Treloar’s double-wound helical model,
8
Sibellas et al.
17
used an arbitrary value of
Despite these limitations, recent studies on segmentation in 3D tomographic scanned images of nylon fibres have primarily focused on automating fibre extraction, often relying on deep-learning-assisted methods combined with traditional image-processing techniques.20,21 One such approach jointly utilises U-Net segmentation, 22 elliptical contour estimation, and watershed algorithms to separate fibres, achieving high segmentation accuracy for elliptical-contoured structures, such as, flattened filaments. However, these methods are limited in their ability to segment irregularly shaped, thin or densely packed filaments and do not extend beyond segmentation to analyse the structural behaviour of the filament. In contrast, our study applies a more advanced UNet++-based deep learning model with AI-driven seed recognition to improve filament identification, 23 ensuring precise segmentation even in thinner aramid fibres in complex strand arrangements. Additionally, our research uses this segmentation to quantify filament orientation, diameter, and packing density and provides insights into the effects of twist parameters on these filament properties.
Overall, in rope mechanics, significant gaps persist, particularly in the accurate experimental characterisation of filament distributions for different twist configurations. While analytical models offer valuable insights, precise measurements of filament distribution and orientation under various twist settings remain limited. Existing experimental techniques to characterize filament geometry are hard to replicate with high resolution and repeatability. Improvements in state-of-the-art experimental methods are necessary to extend and validate existing analytical models for computing structural parameters of the rope at the filament level and is thus critical for optimizing rope performance.
This research addresses these gaps by applying advanced image processing techniques for segmenting micro-CT images of three-strand Twaron ropes at the filament level. To achieve this, Object Research Systems (ORS) Dragonfly, 24 a specialized image processing software, is employed to enable detailed segmentation of each filament within its own region of interest (ROI). This software facilitates precise tracking of filament orientation, and the data extracted from micro-CT imaging allows for accurate calculation of filament distributions. By analysing these images, the distribution of filament angles is experimentally measured and compared with the results of an analytical model in which a more accurate strand-to-rope twist ratio is implemented, accounting for the retraction of the strand due to twist. This comparison will assess the model’s accuracy and highlight areas for further refinement, with findings that could lead to the development of more accurate predictive models for ropes in high-performance applications.
Materials and methods
Rope specimen
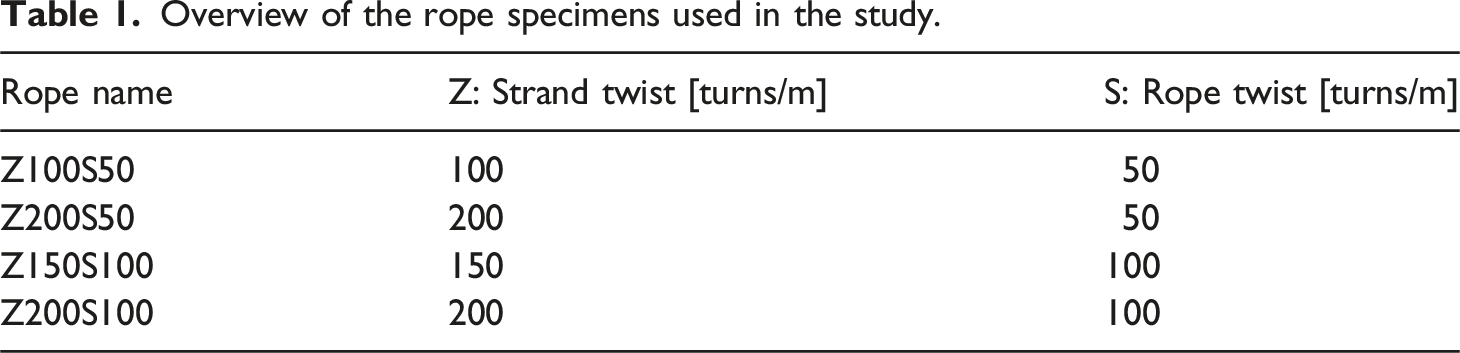
Overview of the rope specimens used in the study.
Experimental setup
An in-situ apparatus is designed to apply controlled rope twist to three-strand Twaron ropes, allowing for precise control and measurement before performing micro-CT scans. This setup allows the loading of the rope and analyse the internal rope structure under tension. The structure is supported by an aluminium tube, with four large openings along its centre to allow the X-rays to pass through without disturbance and minimal attenuation (see Figure 1a). The remaining aluminium supports between those openings are designed to be as narrow as possible while withstanding the compression stresses generated by the rope. (a) In-situ tensile setup with a total length of 30 cm integrated into the CT scanner to enable rope loading during imaging. (b) Schematic illustration of the setup.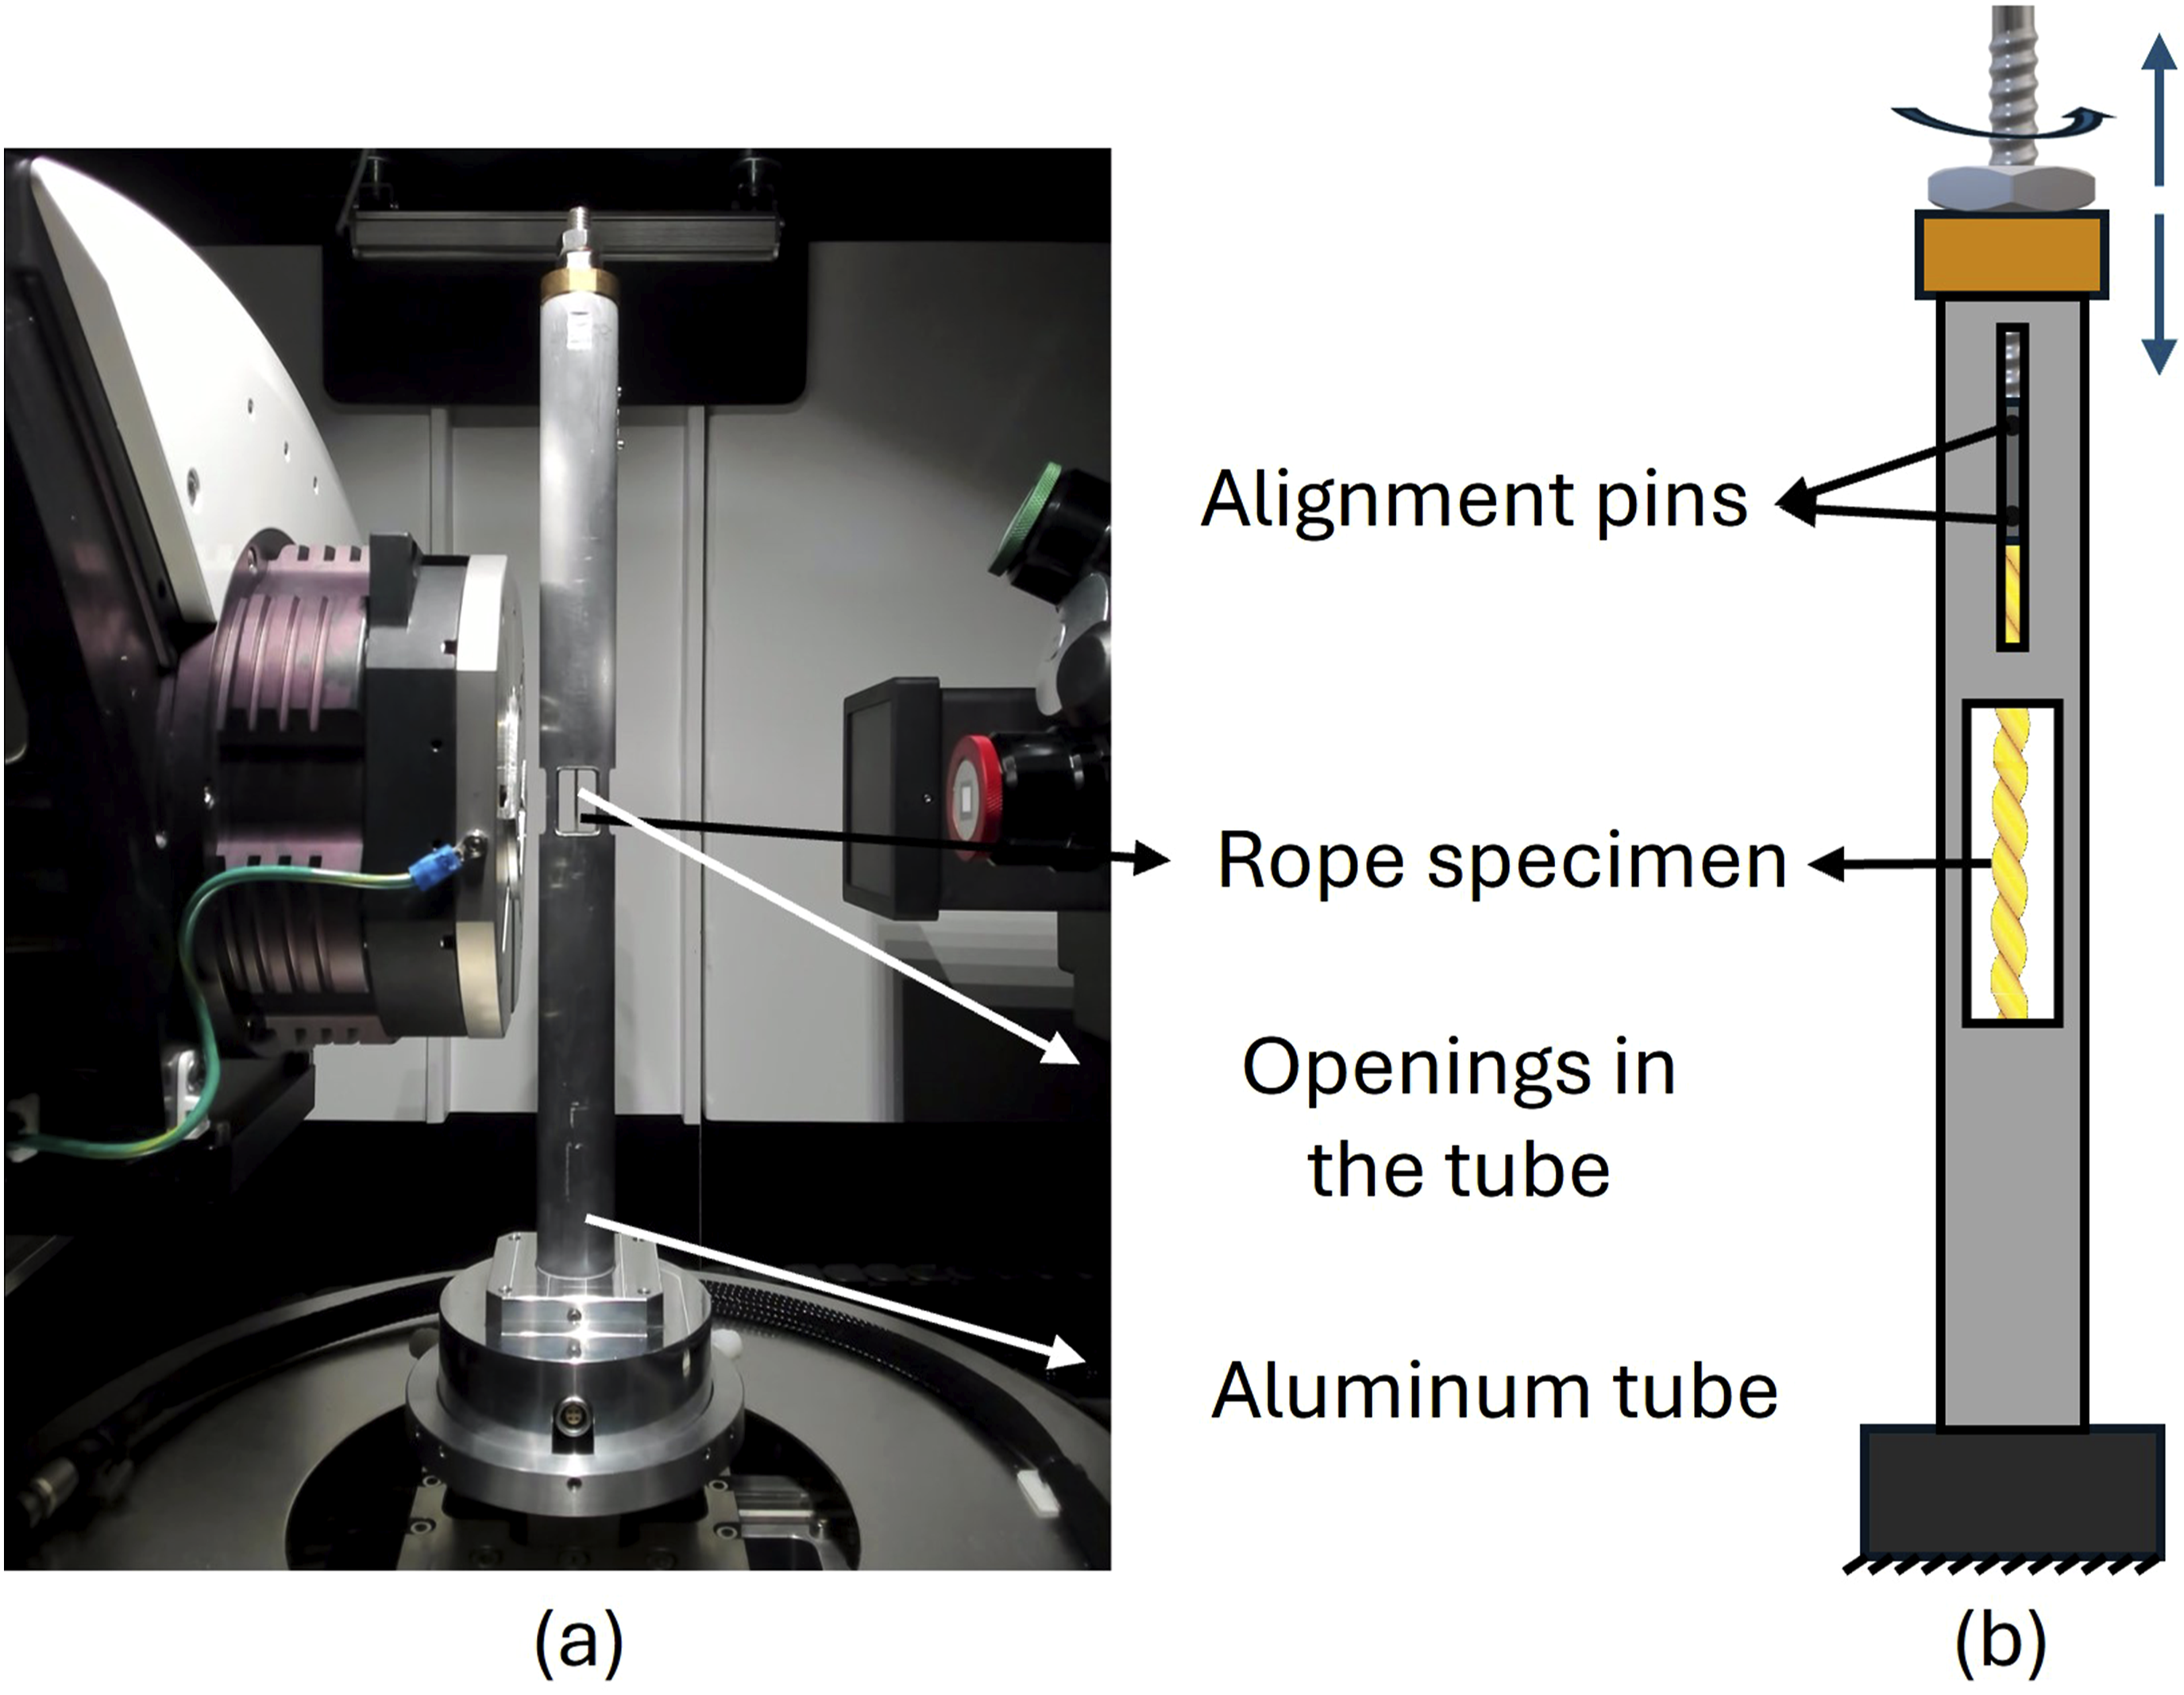
Initially, a small twist is applied to the rope, which consists of three strands pre-twisted to the required amount. The distance between the two clamps is then measured after cycling a preload to eliminate slack and ensure the rope is properly seated. Following this, the alignment pins are removed, allowing the rope to be fully untwisted (see Figure 1(b)). The rope is then twisted to the desired amount, defined in terms of rotations per unit length (rotations/m), ensuring consistent and accurate twisting throughout the rope’s length. This precise twisting process is critical for ensuring reliable test results.
Micro-CT scanning protocol
Before a scan can be done, the rope is first cycled through a few repetitions to allow for filament redistribution and to secure the knots, which helps reduce slip during the experiments and ensures accurate strain measurement. Then, the rope is twisted to the required amount of twist. Afterwards, a small amount of tensile load is applied to the specimen to prevent rope slack. Because the temperature inside the CT chamber is 28°C, a few degrees above room temperature, the scan is performed at least 2 hours after applying the load. In this way, any (thermally induced) stresses are relieved, otherwise any small movement will lead to blurred images.
For capturing the CT images, the Zeiss Xradia 610 Versa micro-CT scanner is used, located at the Micro-CT facility at our laboratory as shown schematically in Figure 2. This instrument can achieve a true spatial resolution of 0.7 µm. Initially, the in-situ stage is fixed on the sample stage, then the distance between the X-ray source and specimen and the distance between the specimen and detector is adjusted to optimize the scanning time, resolution, and field of view. Finally, the number of projections is chosen to be quite high, normally, around 1600, for an object having the same width as the field of view. The aluminium supports are located outside the field of view; however, they appear in some projections, partially or completely attenuating the X-rays. The reconstruction algorithm needs sufficient projections to minimize reconstruction artifacts caused by the supports, doubling the number of projections to 3201, which improves the image quality significantly. A vertical stitch is made with four of these scans, to obtain a scanned length of approximately 3.3 mm and a scanned diameter of 0.9 mm of the rope. The detailed scanning settings are listed in Table 2. The resulting projections are then reconstructed and stitched into a 3D voxel image using the standard Zeiss reconstruction algorithm. Schematic diagram showing the operation of micro-CT. Input scanning parameters for micro-CT scan.

Image segmentation
The CT-scanned and reconstructed images of the rope specimens are imported into ORS Dragonfly for analysis. Two deep learning models with UNet++ structure are trained to enable data segmentation. Initially, five images (slices) are processed semi-manually to generate two regions of interest, ROI1 and ROI2.
ROI1 (Figure 3(a)) Masks the filaments while excluding the background, ensuring precise segmentation. ROI2 (Figure 3(b)) comprises small circles, only a few pixels in diameter, located at the centre of each filament. These circles serve as seeds for individual filaments. The advantage of creating these seeds lies in the clear space between adjacent seeds (see Figure 3(b)), allowing for the assignment of a distinct region of interest to each seed, accurately representing a single filament. Dragonfly segmentation of Z200S50 rope specimen. (a) ROI1 (pink) highlights the segmented filaments while excluding the background. (b) ROI2 (cyan) shows the seed points, represented by small circles at the center of each filament, facilitating accurate individual filament identification.
Once the models are successfully trained using these five processed images, they can be applied to the entire dataset. This automated process generates ROI1 and ROI2 for all scanned cross-sections of the rope specimen, ensuring consistent and efficient segmentation.
The watershed technique25,26 is applied to segment individual filaments within the rope structure. In this process, seeds are initially defined, with each seed representing a single filament. The watershed algorithm then expands these seeds into distinct regions, effectively separating the filaments. This method allows for the clear delineation of each filament within the region of interest (ROI1), and the development of a second region of interest (ROI2) which isolates each filament as a separate entity. This segmentation enables detailed analysis at the filament level, ensuring accurate geometrical and structural assessment in subsequent image processing steps.
Image analysis
ORS Dragonfly software calculates the geometrical properties of segmented images shown in Figure 4(a) by analysing the three-dimensional structure of the filaments. After segmentation, the software identifies the centre of each filament in every image slice. These centres are then connected across the image slices to form a continuous axis for each filament as shown in Figure 5(a). Based on this constructed axis, the software calculates various geometrical parameters, such as filament angle Dragonfly analysis of a 3-strand rope, showing (a) 2-days cross-section and (b) 3-days image. Each color represents a separate region of interest. (a) Identification of filament centres across micro-CT image slices and reconstruction of continuous filament trajectories. (b) Definition of the filament orientation angle 

Erroneous data, specifically small fibres with unusually high or irregular values of
To improve accuracy, the images were divided into sub-sections (segments) as shown in Figure 6, each approximately 35 μm in length, allowing for the calculation of geometrical parameters in each segment. Reducing the section length increased the accuracy by providing more localized parameters for each filament. However, this also led to increased computational time. (a) Micro-CT images showing the determination of filament centres across image slices and the construction of filament axes. (b) Segmented sub-sections (not to scale) illustrating individual filaments and their reconstructed region of interest.
Measured geometrical parameters
The following parameters for the filaments are calculated from the segmented images: Packing density (α): It is the ratio of the material filling the space to the total space, including both the material and the gaps. The packing density can be calculated in both 2-D as well as in 3-D to give a more general overview of the volume of the material is filling space.
27
Diameter of filaments
Analytical model
The analytical model described in this section elaborates on the steps to mathematically characterize the orientation of the filament in a three-strand rope as a function of the rope twist combination. The model begins by assessing the diameter of a strand based on the inherent properties of its constituent filaments, such as their number, diameter, and packing density. Next, the filament path is determined using the double-helix model, considering the distance between the strands,
Strand parameters
Given the packing density 
The helix angle of the strands, which indicates how the strands twist around the rope’s axis, is determined by considering the radial position of the strands and the rope’s twist rate. The helix angle provides insights into the strand’s orientation and its contribution to the rope’s geometrical properties.
The radial distance between the strands’ axes and the rope’s axis, Calculation of the distance between the rope’s axis to the strand’s axis.
28


The projected x-coordinate 

The radial distance between the strands’ axes and the rope’s axis 
It is important to note that
Additionally, the twist ratio between the strands and the rope is vital for understanding the interplay between the structural twist of the entire rope and the inherent twist of each strand. Strand retraction is defined as the reduction in length of any twisted structure due to the twisting process, studied in detail by Treloar. 8 In this case, when strands are twisted, their length is reduced, and when the rope is twisted, the total rope length is reduced. This study includes the effect of strand retraction on the twist ratio to re-calculate the filament orientation for three-strand ropes.
In this scenario, the process begins with a strand of initial length
Twist ratio
Treloar
8
derived equations to calculate 
Intermediate parameters 

Equation (10) is given for the strand length 
Expression in equation (11) is given for the strand to rope twist ratio 
To determine the final strand torsion 
The rope twist contribution 
The final strand torsion 
Filament angles with rope’s axis
The spatial coordinates and orientation of the strands within the rope are described using a polar coordinate system, which helps visualize the three-dimensional pathway of the strand through the rope. The coordinates of the strand’s axis can be expressed as 
The tangential, normal and binormal axes of the strands can be derived from Frenet-Serret formulas as expressed in equations (16)–(18) and shown in Figure 8. The negative sign in equation (17) is based on the direction assigned to Cross-sectional strand’s geometry, highlighting the filament’s axis 


Lastly, the orientation of the filaments relative to their respective strands is critical for a geometrical analysis. The overall orientation of the filaments combines the orientation of the strand’s axis with their own relative orientation, providing a complete expression of the filament’s position within the strand. The vector that relates the strand axis to the filament axis can be represented by 
The coordinates of the filament axis 

The negative sign in equation (19) before the (a) Schematic representation of the ideal helical trajectory of a filament (dashed red) and the strand path (blue). (b) 3D model of an idealized three-strand rope structure, showing the double helical arrangement of filaments.
From equation (21), 
Here,
Density distribution function
In this study, the filament-rope interaction is modelled using a density function that accounts for the distribution of filaments within a three-strand rope. The density function describes how the filaments are arranged in successive annular layers, each corresponding to a specific radial distance from the rope’s centre. The packing density, 1. Uniform packing pattern: The filaments follow a uniform packing pattern within each strand, where the packing density remains consistent across the rope structure. 2. Fixed filament paths: No filament migration occurs between layers or within a layer. Each filament maintains a distinct and fixed path in space throughout the rope. 3. Layered arrangement: The filaments are distributed uniformly layer by layer, of layer thickness Schematic representation of a strand cross-section, showing the arrangement of filaments within concentric annular layers.

The area of an annular layer between radius 
The area occupied by a single filament (small circle) with diameter 
The number of filaments that can fit into the n-th annular layer, considering the packing density α, is given by:
Substituting the expressions for 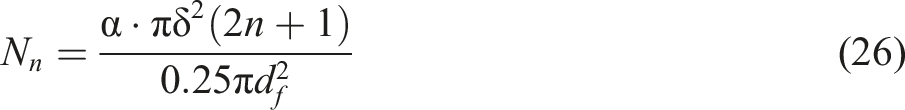
Simplifying the above expression, the number of filaments in the n-th annular layer is:
The geometrical assumption of assigning a structured framework for distributing the filaments within concentric annular layers enables the calculation of the number of filaments in each layer by relating the area of an annular layer to the packing density and filament cross-sectional area. This, in turn, allows for determining the angle distribution across the entire strand cross-section, facilitating a comparison between analytically predicted and experimentally observed angle distributions.
Results and discussion
Filament diameter
The average filament diameter is used in the analytical calculation of the distribution of angle of filaments in double twisted structures, such as three-strand ropes. In the analysis of the CT-scan images of ropes, the mean diameter of the Twaron filaments used in the experiments was found to be 2D equivalent diameter analysis of Z150S100 rope filaments. (a) Cross-sectional micro-CT image with color-coded filament diameters. (b) Histogram of filament diameters showing mean and standard deviation.
Packing density
In an actual strand, the filaments are not properly arranged/packed in layers, due to the presence of small gaps between the filaments in the strands, as shown in Figure 12. Cross-sectional micro-CT image of a rope strand, showing the arrangement of filaments within a strand. Red sections indicate small gaps between filaments. This image demonstrates that, in actual strands, filaments are not perfectly aligned in layers, resulting in gaps.
The packing density for each of the three strands can be calculated, as shown in Figure 13, with values of 67.84%, 66.17%, and 65.28%. For subsequent analyses, an average packing density value is calculated based on these individual strand measurements, providing a representative metric for modelling. Cross-sectional micro-CT image of a Z100S50 rope, showing the packing density of filaments within each strand. The packing densities are labelled for each strand: 67.84%, 66.17%, and 65.28%.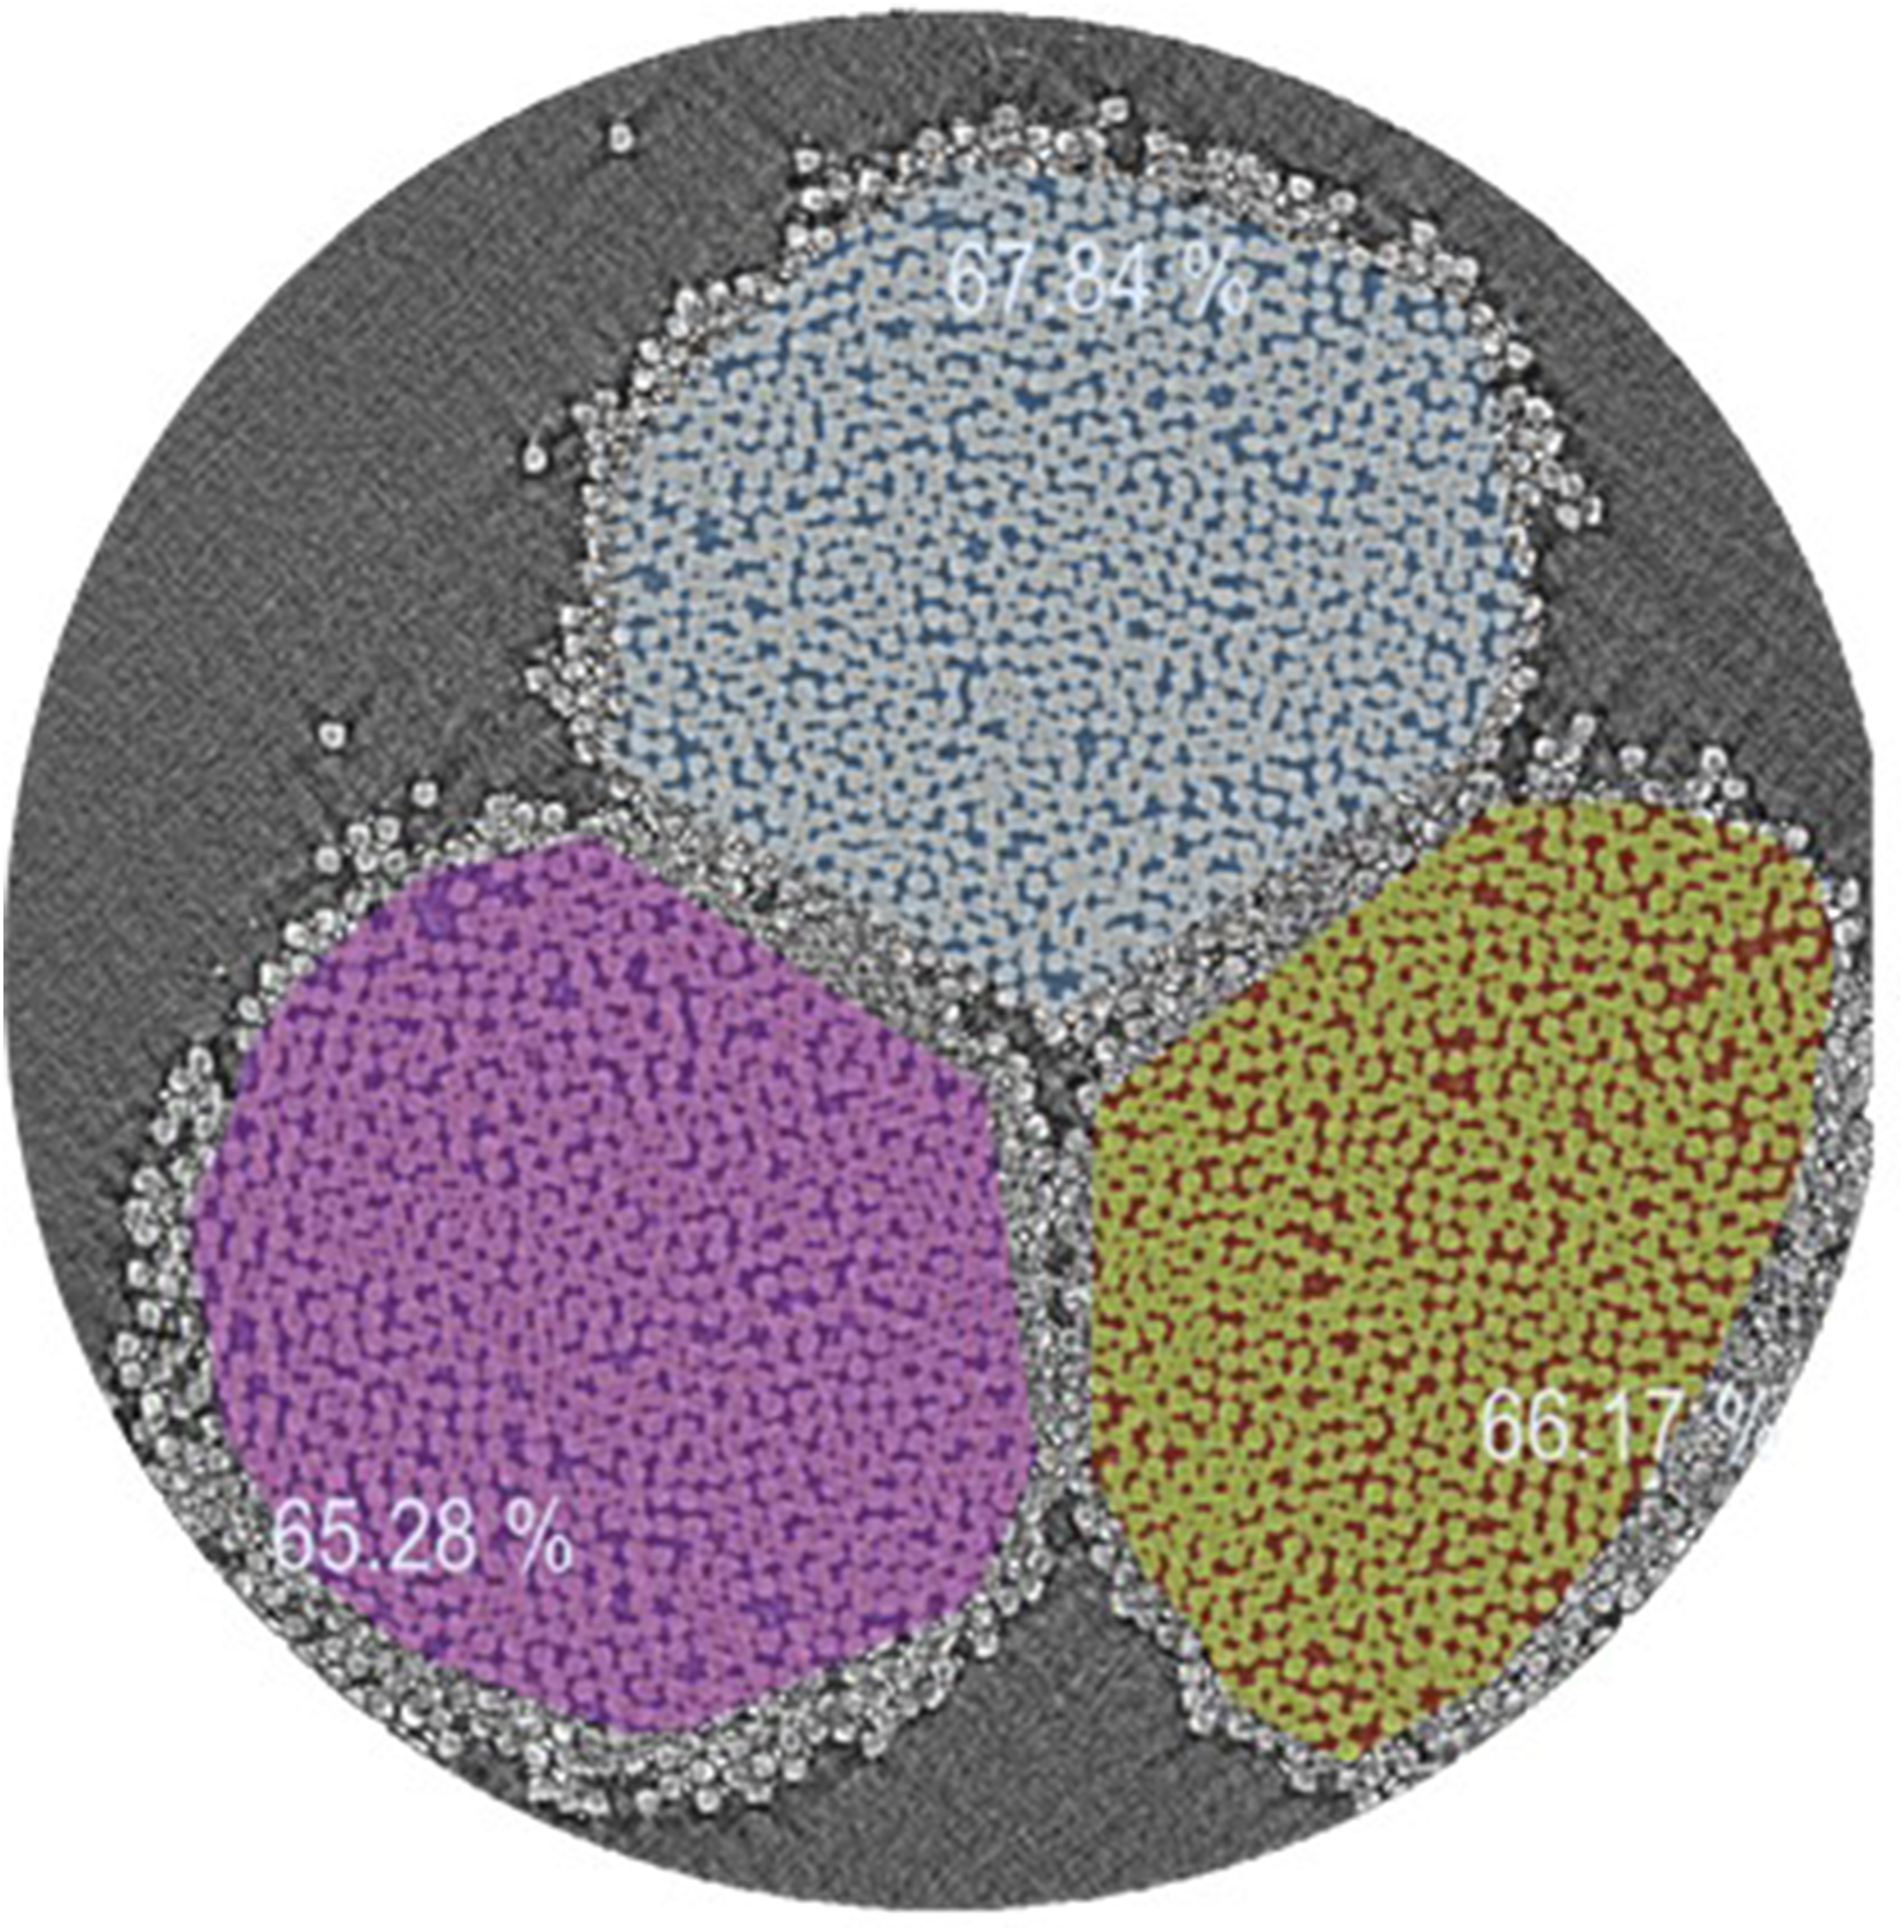
Filament angle distribution
The density distribution function derived previously provides an analytical method to calculate the probability distribution of filament angles within each strand. Assuming each annular layer contains N filaments uniformly distributed around its circumference, the angle
In this section, this approach is applied to various twist configurations—Z100S50, Z200S100, Z200S50, and Z150S100, see Table 1 for details. For each configuration, the analytical model is consistently compared with experimental results using probability distribution plots, radial angle maps obtained from the analytical model, and micro-CT images. This analysis highlights key trends, identifies discrepancies, and examines the impact of different twist settings on filament orientation. By assessing the model’s accuracy across these configurations, a comprehensive understanding is gained of how twist ratios influence filament alignment within the rope.
Figure 14 compare the experimental and analytical probability distributions of Analytical and experimental probability distributions for filament-to-rope angles 
The radial distributions of Side-by-side comparison of experimental micro-CT images and analytical radial distributions of filament-to-rope angles 
The spatial variation of filament-to-rope angles Spatial analysis of filament-to-rope angles 
The right column (b1–b4) presents cross-sectional micro-CT images of the strands, with filament angles visualized using a colour gradient. These images reveal spatial patterns of filament orientation, with higher angles concentrated closer to the centre of the rope and smaller angles observed near the outer layers. In some cases, such as Z200S50 (row 2), regions of minimum angles appear slightly offset from the outer layers, because of the nature of double twisted structures.
To compare this approach with existing literature, the results of Sibellas
17
were examined, where bundles consisted of 210 polyamide fibres with an average diameter of 30 µm and a rope twist of 420 tr/m were studied. These differences in the material studied may influence filament orientation distributions and overall packing density. The research derived filament orientation maps using an assumed twist ratio
In this method, the twist ratio Comparison of filament orientation maps. (a) Analytical map with the correct twist ratio λ accounting for strand retraction, (b) analytical map with an assumed twist ratio of λ = −1 as used by Sibellas, and (c) experimental results from Sibellas.
17

Using the corrected
Effect of strand twist
In these ropes, as is also typical in industrial ropes, the strands are twisted in a direction opposite to that of the rope’s twist. This counter-twisting effect reduces the filament-to-rope angle distribution up to a certain value of strand twist, approximately equal to the rope twist. Beyond this threshold, the filament orientations deviate further from the mean rope helix angle, leading to an increase in the standard deviation of the angle distribution as shown in Figure 18. Consequently, as the strand twist increases, the filament angle distribution within the strand broadens as can be seen with the increase in the standard deviation (SD) of Analytical variation of the mean 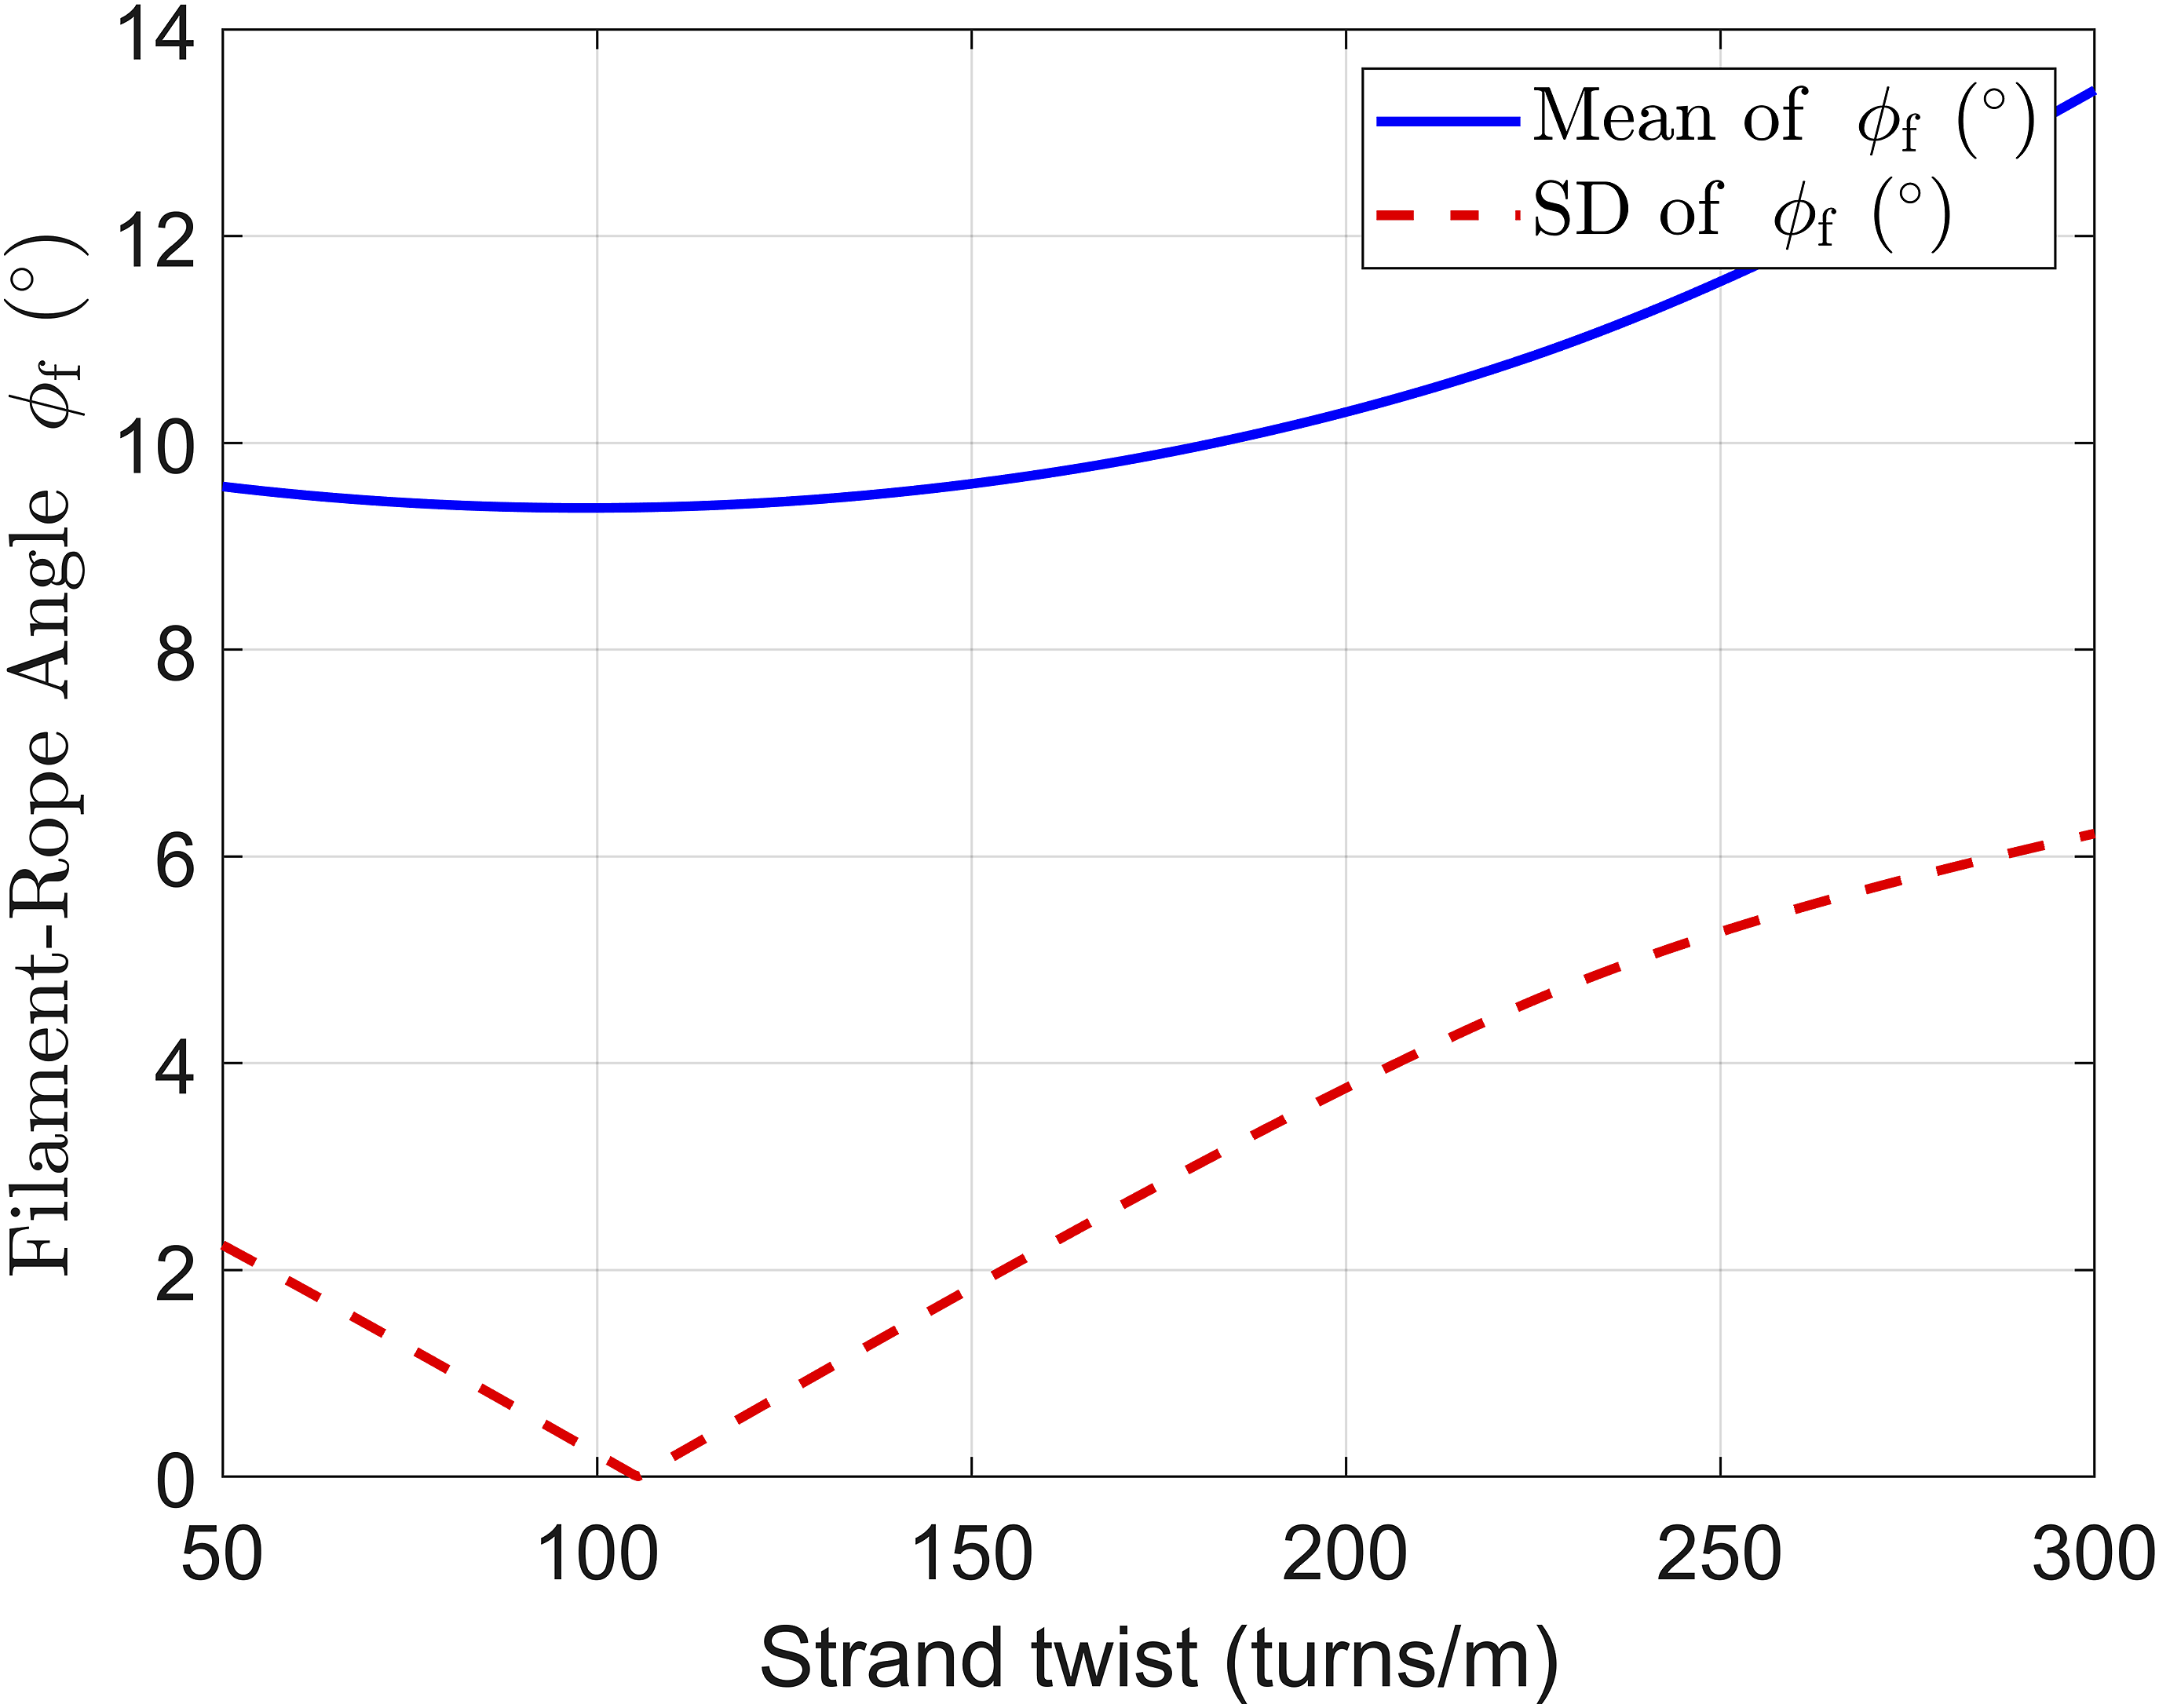
The analytical model generally does not accurately predict filament angles at the strand interfaces due to the contact forces and repositioning of filaments in these regions. Additionally, it can be noted that for ropes with much higher strand-to-rope twist ratios, where the flattening of strands is less dominant due to stiffer strands, 30 the analytical model captures the distribution of filament angles more effectively compared to lower twist ratios, where increased strand interactions lead to greater deviations.
Conclusion
A new method was developed to analyse the internal structure of three-strand Twaron ropes using micro-CT imaging and advanced segmentation techniques. This approach enabled precise measurements of filament angle distributions and their comparison with a modified analytical model. From this analysis, the following conclusions can be drawn: • Effectiveness of segmentation: The segmentation method of the micro-CT scans proved highly effective for analysing fibrous structures at the filament level, providing detailed insights into filament behaviour and geometry. • Geometrical model: The developed geometrical model calculating filament-to-rope angles for a 3-strand rope is in good agreement with the experimental results. • Effect of strand twist: Higher strand twists increase inter-filament forces, stiffening the strand and reducing flattening or deformation at strand-strand contact. Moreover, higher strand twist leads to a broader distribution of filament angles. • Effect of rope twist: Rope-level twists effectively untwist the individual strands, reducing their transverse stiffness. Additionally, higher rope twist increases the forces at the strand-strand interface. These effects synergistically influence the strand’s shape, making it more circular when the rope-to-strand twist ratio is small, as it better preserves the strand’s original shape, and more flattened when the ratio is large. • Role of strand interfaces: At the interfaces, the analytical model does not account for filament movement and strand flattening caused by interactions with contacting filaments of adjacent strands. This results in experimental filament angles • Role of filaments at outer layers: Due to the twist combination in the ropes used in this study—and commonly in industrial ropes—the filaments in the outer layer of the strand are more aligned with the rope’s axis. This alignment results in higher localized strain in these regions which causes them to straighten along the axis. The model overestimates the filament angles
The analytical model assumes uniform packing, fixed filament paths, and circular strand geometry with no flattening at the strand interfaces, leading to deviations in geometry at these interfaces and boundaries. Further refining the model to account for inter-strand forces and deformations can address these limitations and enhance accuracy. While this model can be expanded to accommodate ropes with any number of strands, including multi-layer twist-laid ropes, braided ropes would require additional modelling efforts due to their increased geometric and mechanical complexity.
Footnotes
Acknowledgements
This research was carried out under project number 17981 in the framework of the Partnership Program of the High Tech Systemen en Materialen (HTSM) 2019 TTW, Netherlands Organization for Scientific Research (![]() ). The authors would like to thank and acknowledge Vincent van Bommel and Dr Bo Cornelissen from Teijin Aramid for their support with timely preparation and supply of aramid rope specimens.
). The authors would like to thank and acknowledge Vincent van Bommel and Dr Bo Cornelissen from Teijin Aramid for their support with timely preparation and supply of aramid rope specimens.
Statements and declarations
Funding
The author(s) disclosed receipt of the following financial support for the research, authorship, and/or publication of this article: Netherlands Organization for Scientific Research (NWO), Award Number: 17981, granted to Matthijn de Rooij. Financial support was also provided by Teijin Aramid BV.
Conflicting interests
The author(s) declared the following potential conflicts of interest with respect to the research, authorship, and/or publication of this article: Oday Allan reports financial support provided by Teijin Aramid BV. Other authors, if applicable, declare that they have no known competing financial interests or personal relationships that could have appeared to influence the work reported in this paper.
Data Availability Statement
The data generated and analyzed during this study are available upon reasonable request from the corresponding author.