
Abstract
Spacer fabrics are 3D technical textiles. Their compressibility can be adjusted during production, e.g. by changing the machine parameters or using different yarn materials. These steps require extensive knowledge of the production process and are difficult to change. This research takes an innovative approach to influence the compression behavior individually. It introduces the concept of creating locally sectioned spacer fabrics through sewing. The compression behavior of these fabrics, with seam distances of 43 mm, 24 mm, and 18 mm, was thoroughly tested and evaluated. A two-step numerical model was developed to accurately predict the compression behavior of these spacer fabrics with seams. The model’s validity was confirmed through experimental compression tests. The results show that spacer fabrics with a larger number of seams absorb compressive forces less. The numerical model agrees well with the experimental results and proves its applicability. Using the numerical model seam patterns for larger spacer fabrics can be tested and individual modified spacer fabrics can be produced.
Spacer fabrics (Figure 1(a)) offer a unique combination of properties for various application fields. Three typical layers form a spacer fabric. Two outer layers (Figure 1(b)) are kept at a distance by an inner layer made of spacer yarns (Figure 1(c)). The inner layer is called the spacer area. 1 The spacer area mainly defines the thickness of the spacer fabric. The spacer area consists of a set of monofilaments and defines the elastic compression behavior of the whole system.
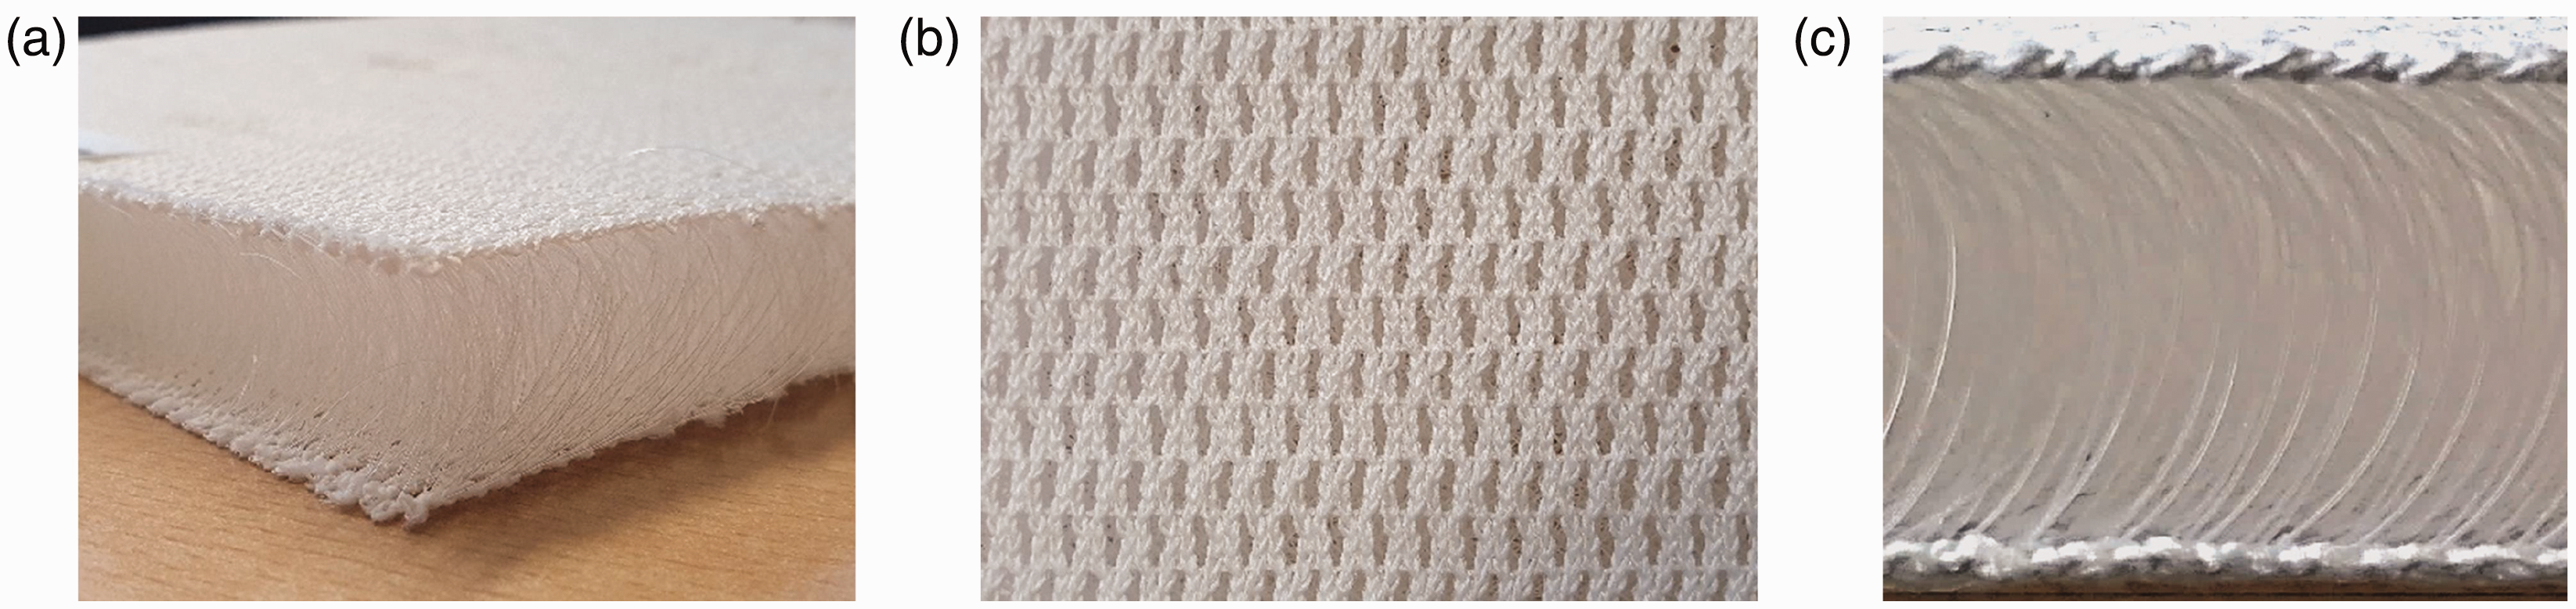
Principal construction of spacer fabric: (a) 3D structure; (b) front and back side and (c) spacer area.
The properties of the different layers can be adjusted using three main manufacturing techniques: warp knitting,2 –4 weft knitting, 5 and weaving.6 –8 The standard technology for spacer fabrics is warp knitting.2 –4 Warp-knitted spacer fabrics can be produced cheaply and with high productivity. 1 By changing the spacer fabric material, the knitting structure of the outer layer, or the spacer distance, a wide range of spacer fabrics can be produced. This parameter change offers application for car seats, 9 concrete applications, 10 protective applications, 11 and in medicine or sports. 8 The spacer fabrics produced for various applications are characterized by homogeneous properties. However, some researchers have attempted to create spacer fabrics with heterogeneous properties by varying the spacer thickness during the production process. This approach has thus far been evaluated as challenging to implement. 8
A still new technology for changing spacer fabric properties after the production process involves sewing them. Utilizing a specialized 3D sewing technique based on single-sided stitching with a blind stitch double lock stitch, 3D spacer fabrics can be sewn without compression. This ensures that such functions as the surface flow effect in the spacer area are preserved, even at the 3D edges. Additionally, other specialized sewing technologies, such as spacer stitching, allow for the processing of spacer structures with defined spacings. 12 This technology enables modification of a spacer fabric after its production and can be used, for example, to define heat flow 12 or to personalize cushioning. This method has the advantage of combining the fast spacer fabric production process with an individualized change of properties, without changing the machine’s parameter. To predict the spacer fabric material behavior after the seam modification, a numerical model can be created. Numerical models are a common tool in the prediction of spacer fabric material behavior.
Different approaches have been applied to model the compressional behavior of spacer warp-knitted fabrics. The approaches differ in their level of detail. One common approach to model spacer fabrics involves modeling at the yarn level, also called the mesoscale. This approach needs a high knowledge of the spacer fabric production process and a high computational time. Examples of this modeling approach can be seen in other work.13 –19 Some researchers have created mesoscale models based on computed tomography, giving high accuracy, 20 but this is also an expensive data acquisition method. The spacer fabric can be recreated at the yarn level using different software. 21 Some researchers only consider pile yarns analytically and derive the properties of the fabrics through classical mechanical analysis. 16 Modeling spacer fabrics at the mesoscale requires a deep understanding of their properties and the associated modeling techniques. This approach is time-consuming, owing to the need to generate models for each yarn in both the outer and inner layers. Furthermore, these mesoscale models often have long computational times because of the significant number of contact points involved. If faster numerical results are needed and individual yarn behavior is not critical, a spacer fabric can be modeled more effectively using a simplified macroscale approach. The spacer fabric is modeled as a whole system. This modeling principle benefits the model setup time and computational time.
This paper reports an investigation of the influence of seams on the compression and deformation behavior of spacer fabrics using both experimental and numerical methods. The numerical model is simplified at the macroscale to prioritize shorter computational times and faster setup, making it suitable for larger fabric areas. By utilizing this numerical model, the deformation and compression behavior of individually modified spacer fabrics with seams can be analyzed without the need for extensive experimental testing.
Materials and methods
The next section defines the production process and the machine parameters of the spacer with seams. The following section describes the methods of experimental testing and numerical model development.
Materials
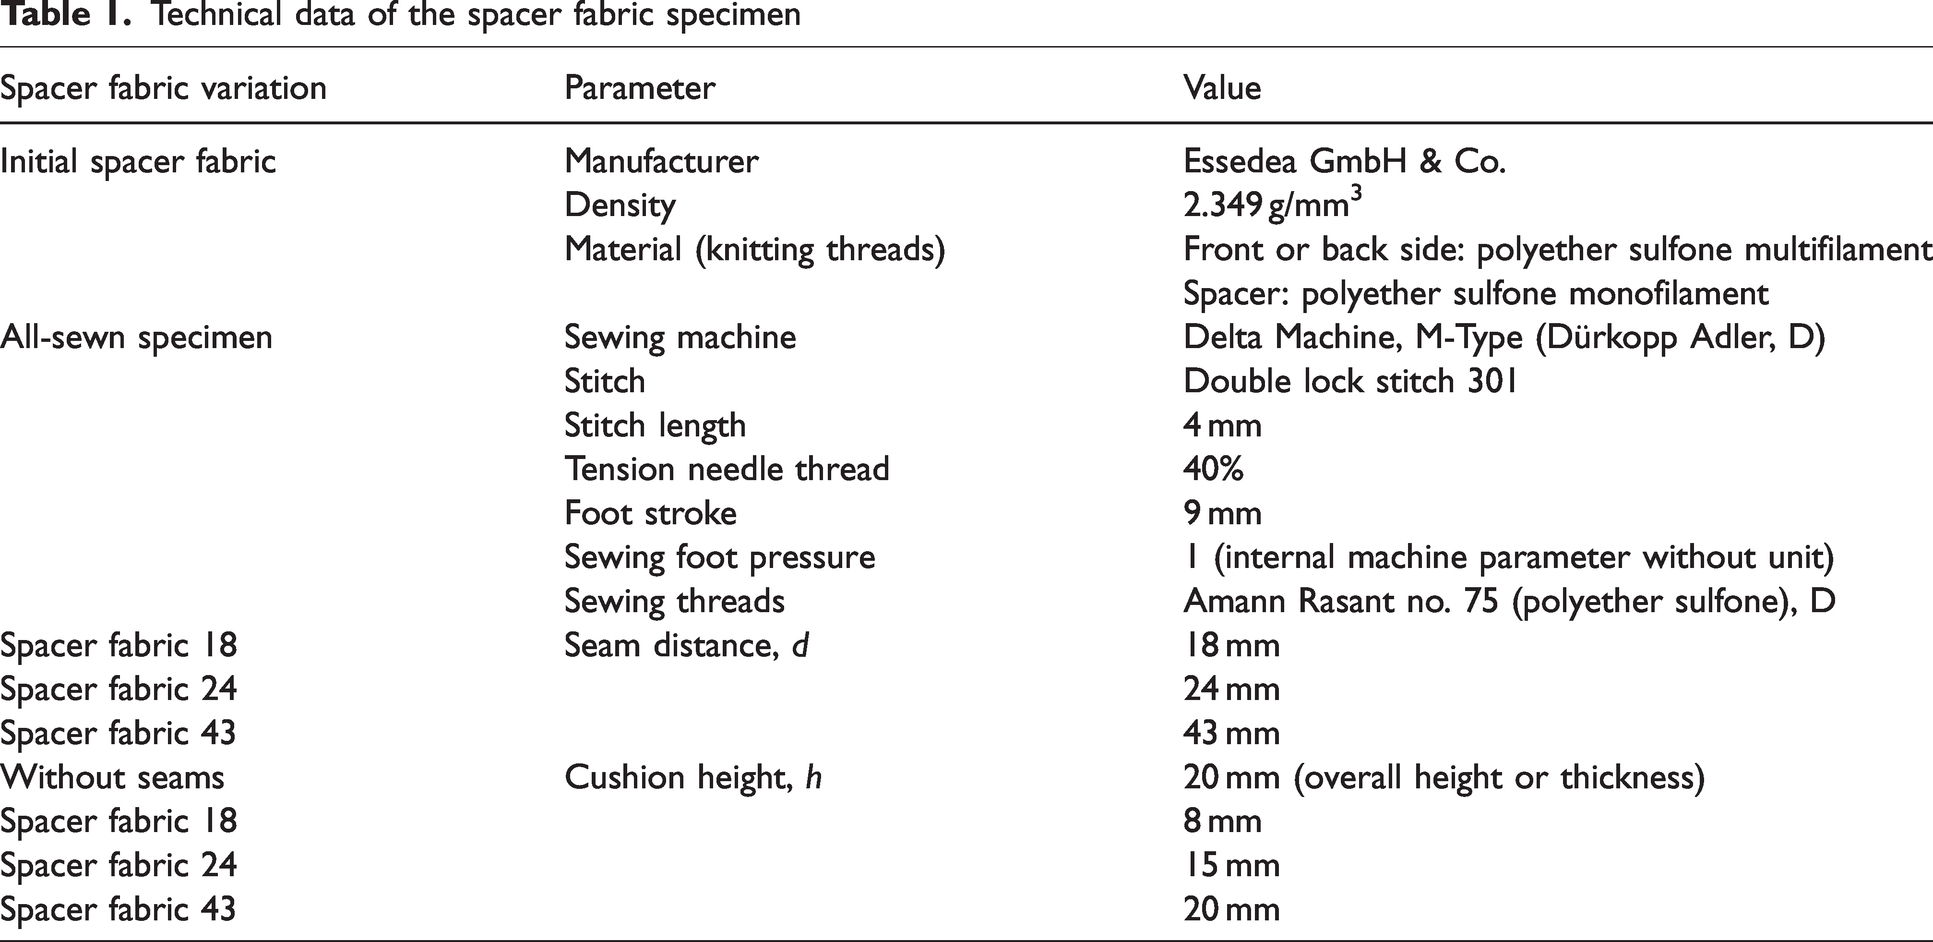
Four different spacer fabric variations were produced. All spacer fabrics were manufactured by Essedea GmbH & Co. The specimens’ initial state is the spacer fabric without seams, as shown in the bottom part of Figure 2(a) and the top left part of Figure 2(b). The seams were inserted in three spacer fabric specimens, using a Delta M-Type Dürkopp Adler sewing machine. The seam distances (d) were constant for each specimen, with average seam distances of 18 mm, 24 mm, or 43 mm. Within the sections between the seams, cushioning occurs; the cushion height (h) differs, owing to the seam distances. The measurement of the seam distance and cushion height can be seen in Figure 2. A summary of the material data is given in Table 1.
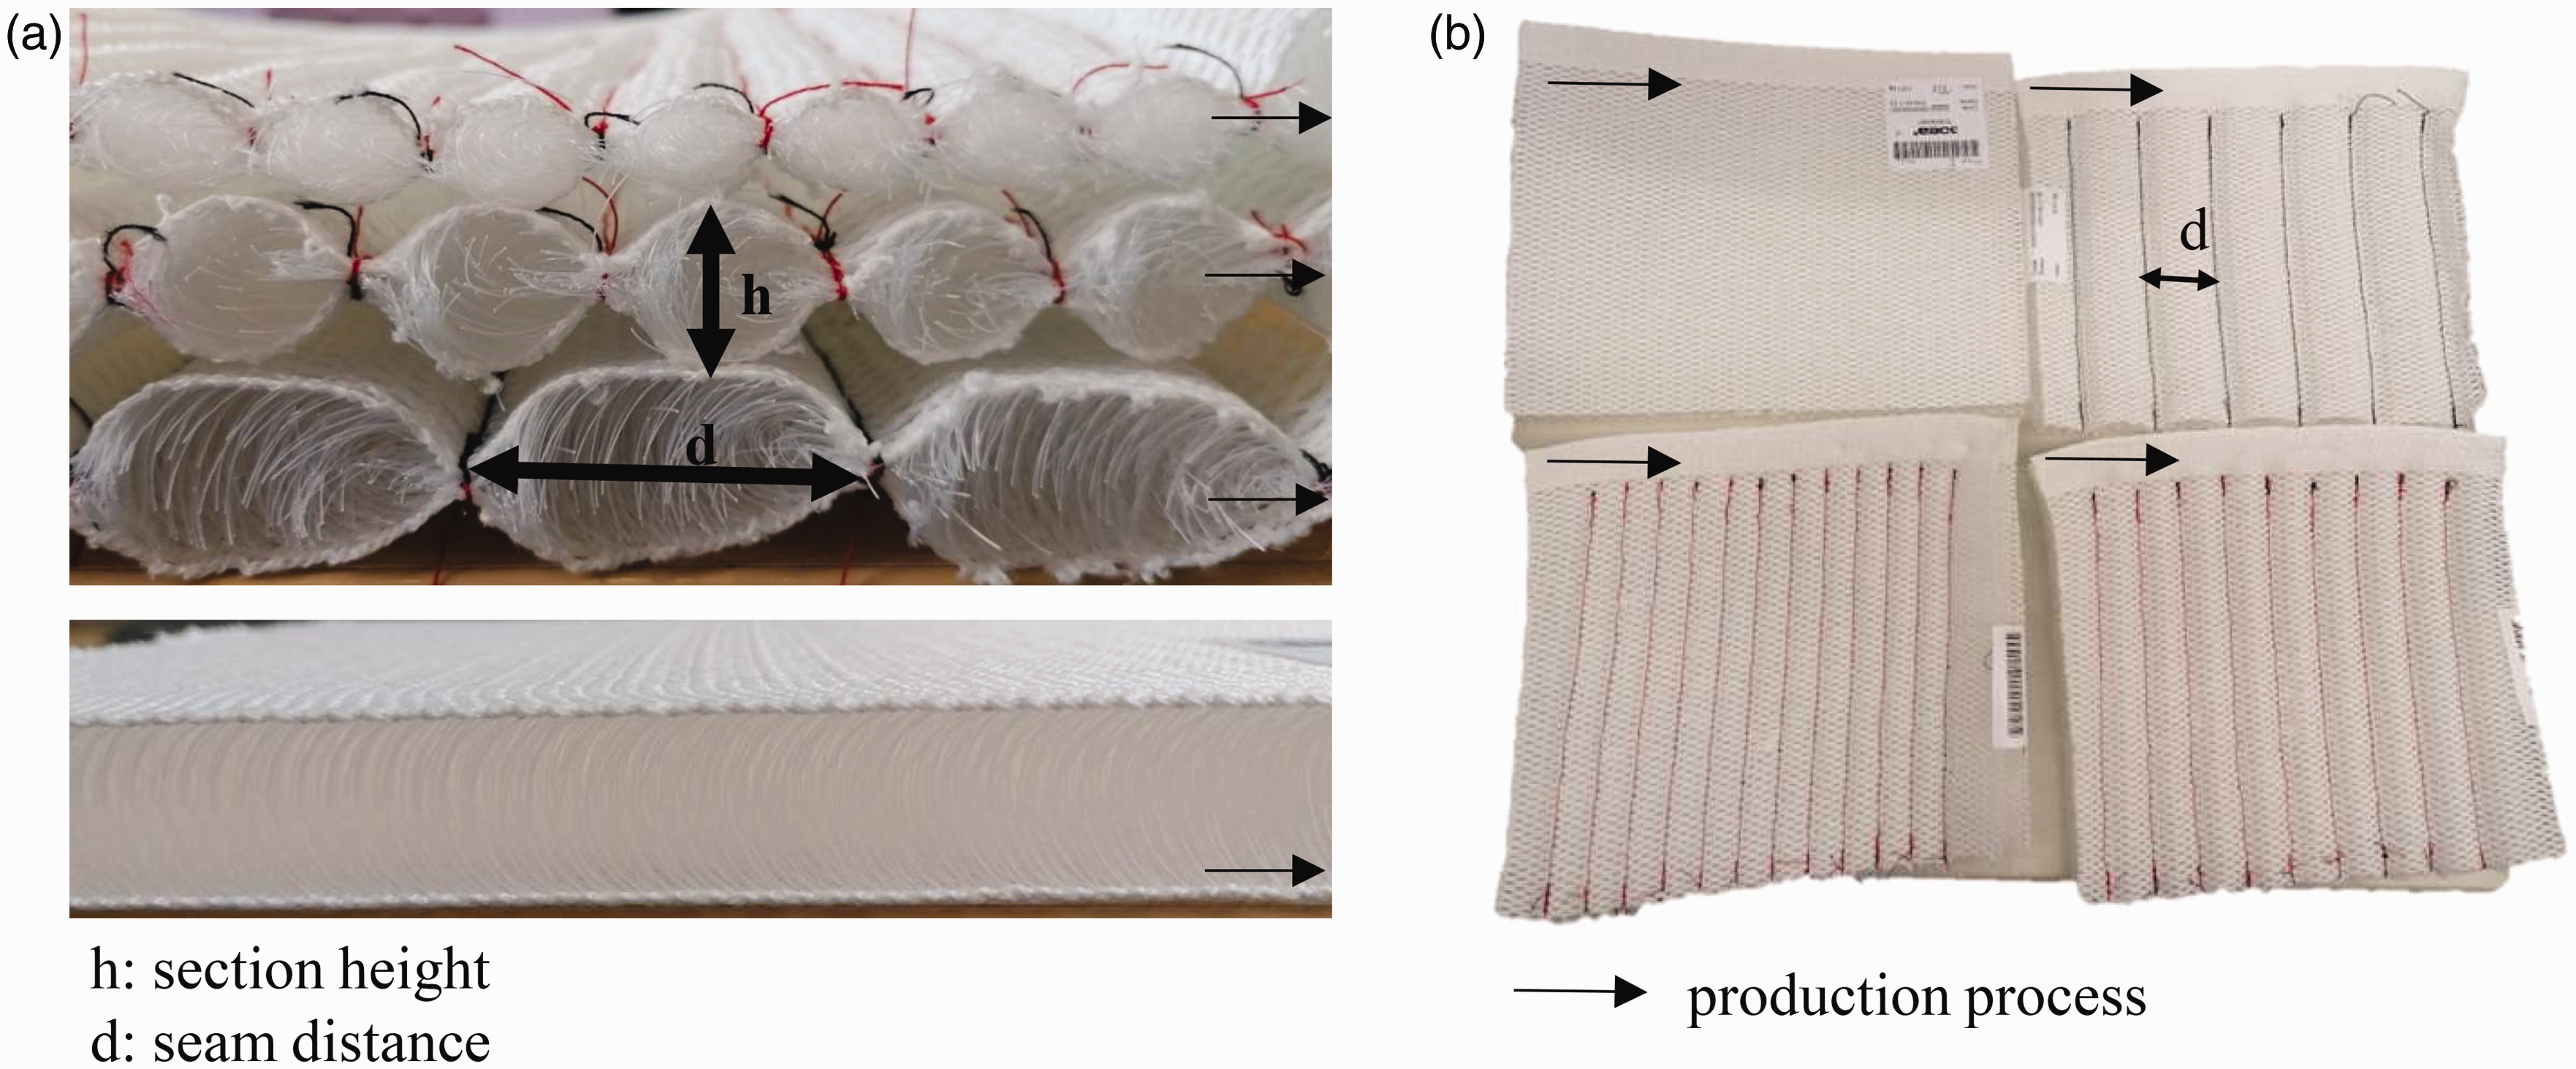
Spacer fabric variations for experimental testing: (a) side view and (b) top view.
Technical data of the spacer fabric specimen
Method
After the spacer fabrics with seams were produced, they were experimentally tested. Then, a numerical model was developed and validated.
Experimental investigation of compression behavior of spacer fabrics
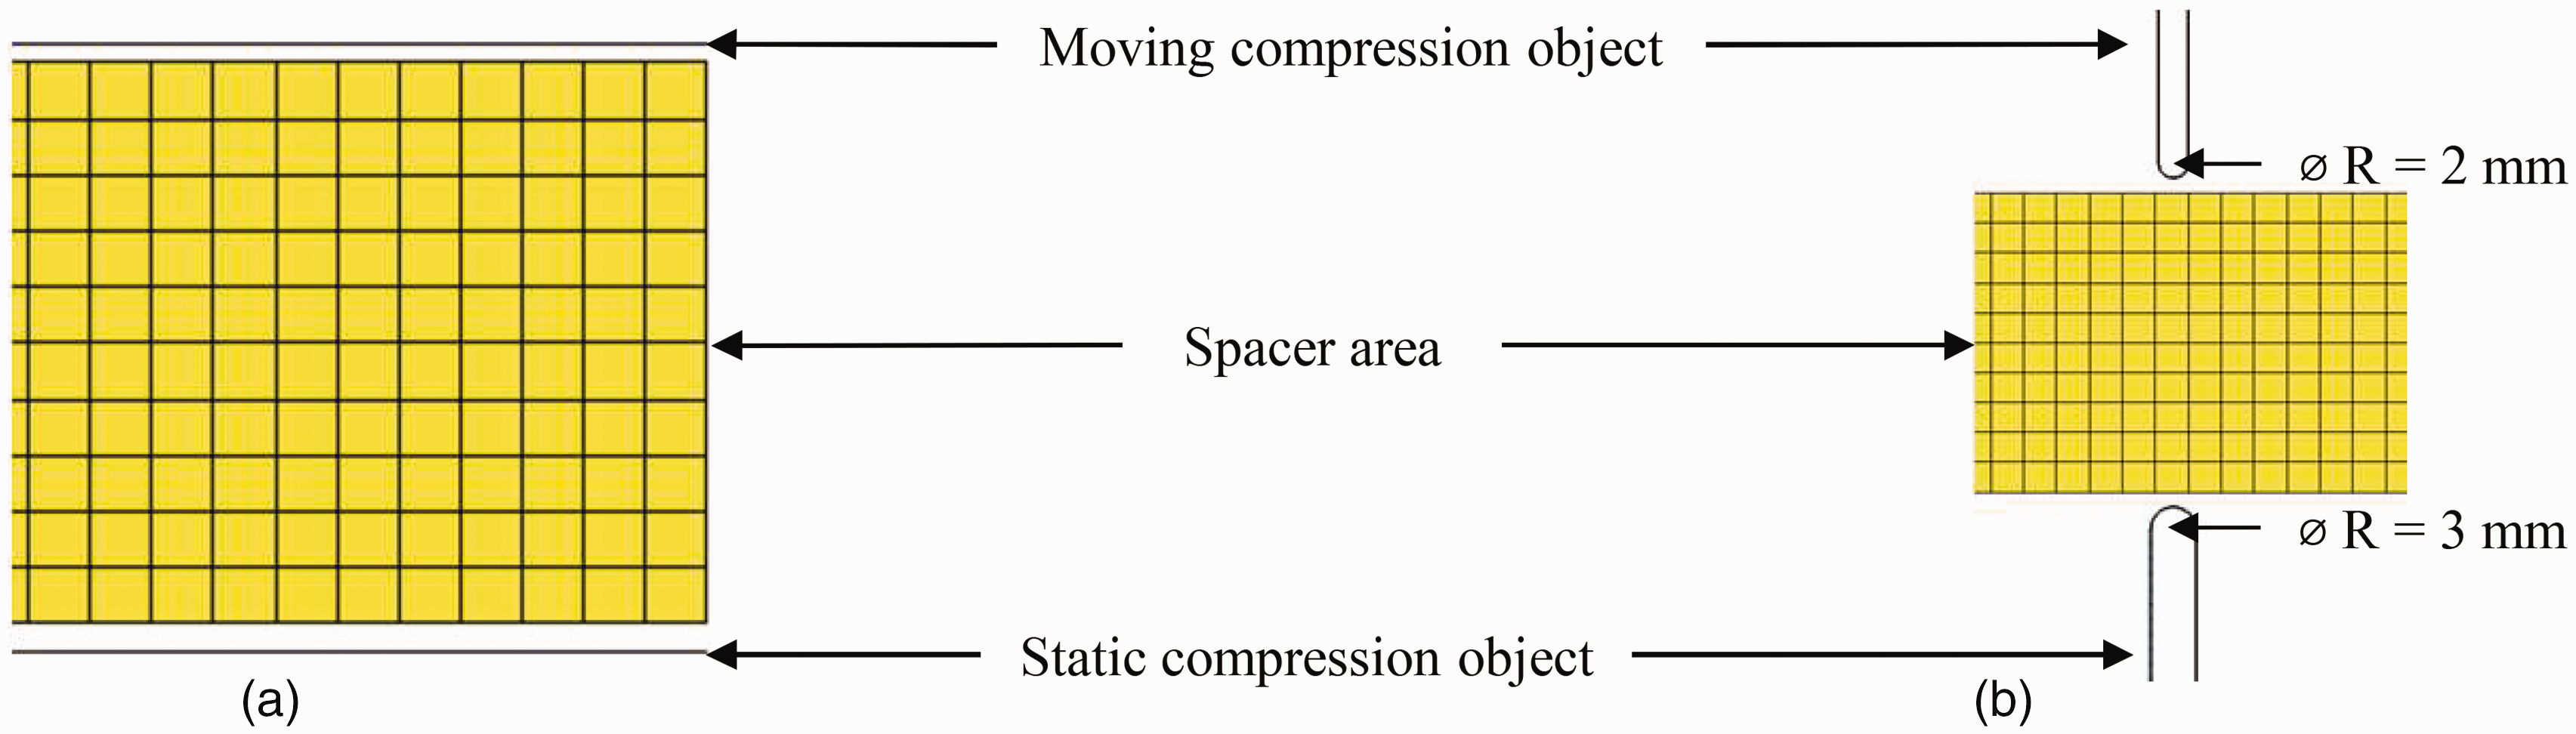
For the experimental investigation, and to calibrate and validate the numerical models, specimen compression tests were conducted according to the test standard DIN EN ISO 3386-1. 22 The specimen properties are given in Table 1. The compression tests were conducted using a Zwicki Z2.5 machine (Zwick GmbH & Co.). A force sensor with a capacity of 500 N and (perforated) pressing plates with an area of 121 cm2 were used. The speed was set to 100 mm/min. Figure 3 illustrates the experimental compression testing of the spacer fabric without seams (Figure 3(a)) and with seams (Figure 3(b)). Figure 3(c) illustrates an edge force test to analyze the forces needed to compress the spacer fabric locally.
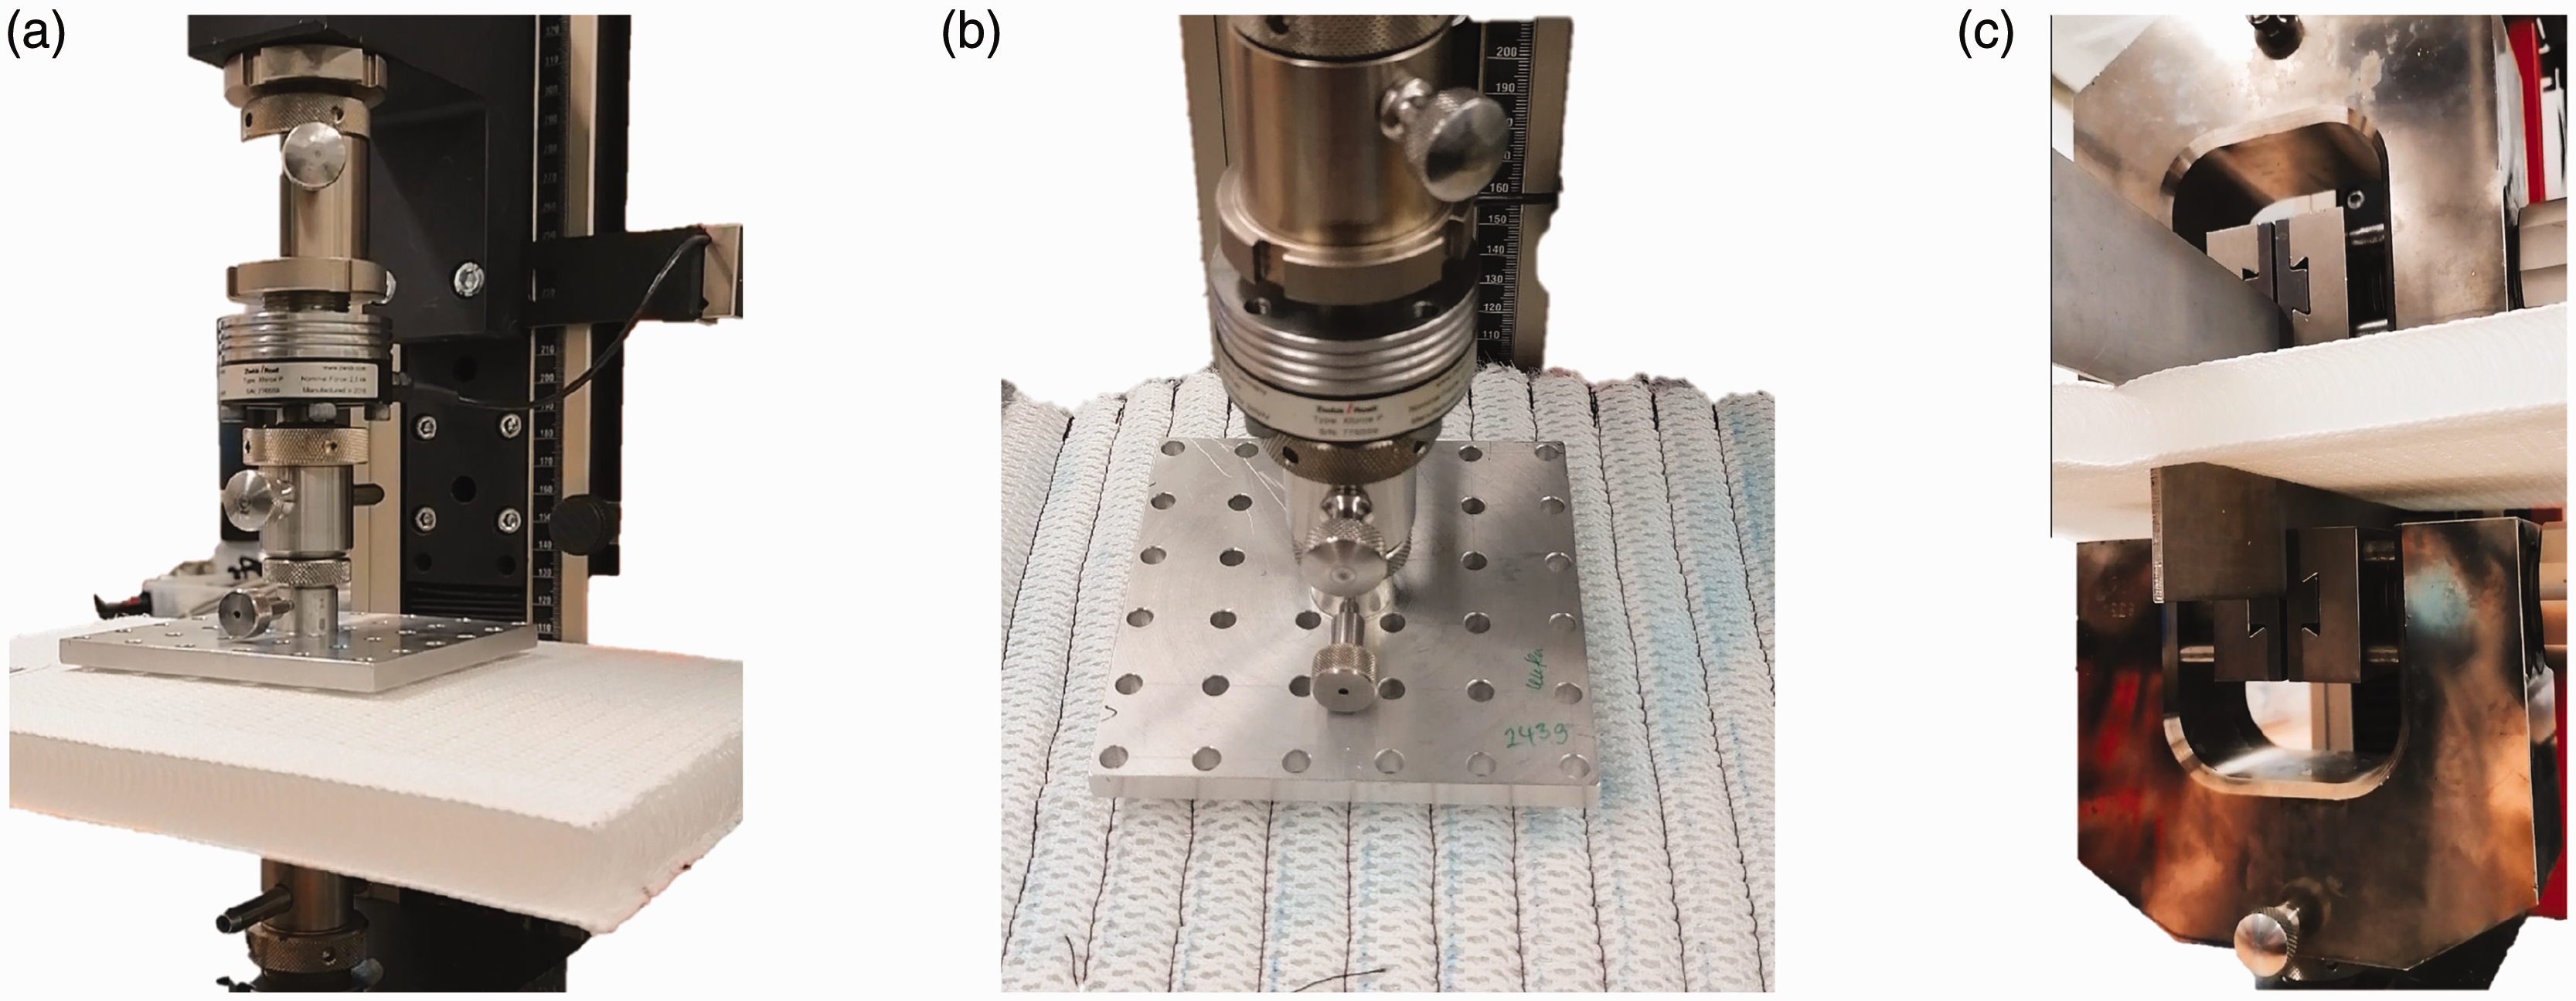
Test setup for various compression tests: (a) spacer fabric without seams; (b) spacer fabric with seams and (c) edge force test for spacer fabric without seams.
Numerical investigation of compression behavior of spacer fabrics
For the macroscopic numerical investigation of the spacer fabrics, several finite-element models were developed. The modeling environment used was the commercial software LS-PrePost by LS-Dyna. First, a model of the spacer fabric without seams was developed. Details of the simulation parameters can be found in the in the following sections. The experimental compression test was remodeled in the simulation. In this way, the material and structural behavior of the initial spacer fabric could be calibrated. After calibration of the material model, the same material model was used for the following simulation models of the spacer fabrics modified with seams.
Modeling spacer fabric without seam modification
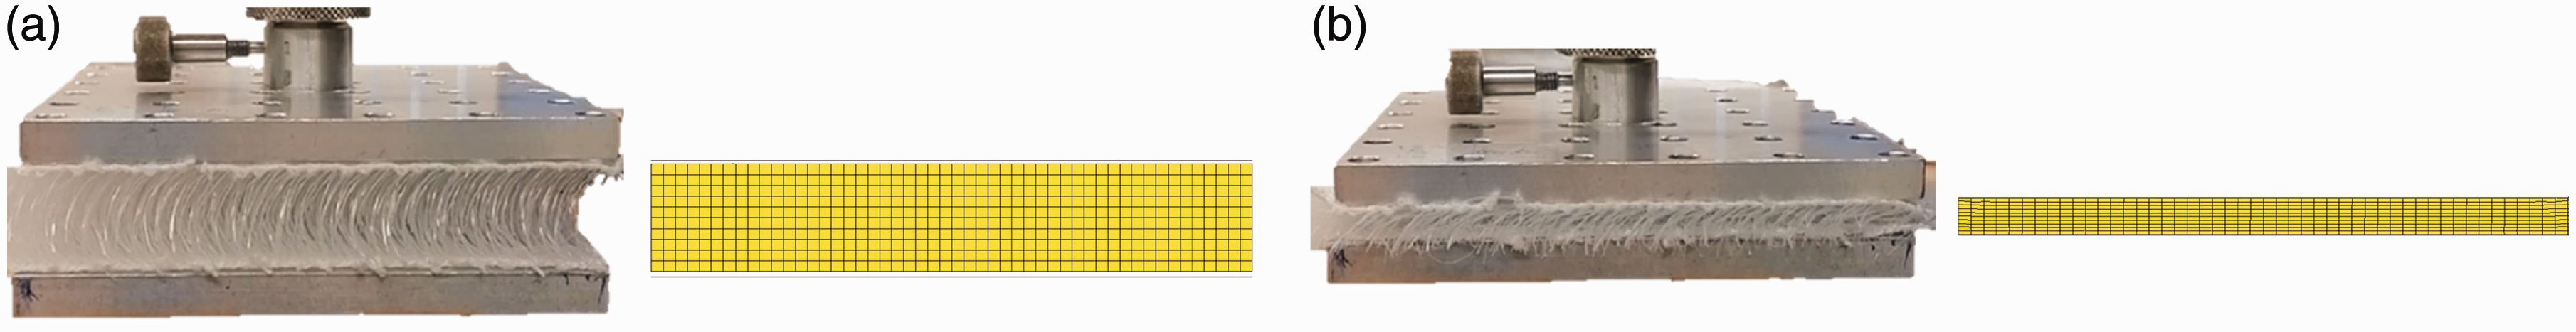
The spacer fabric without seams was modeled as a square volume discretized by solid elements. Both different element formulations (ELFORM: 1, −1, 2, −2) and element shapes (pyramid, hexagon) were tested, and the best combination of contact stability and large deformation was chosen. The element formulation was set to ELFORM = −2, a fully integrated S/R solid. The element shape was a hexagon. Because the experimental results show significant compression of the spacer fabric, a material model with the ability to realize large deformation was selected. Two foam materials, MAT57 and MAT83, were tested in preliminary investigations. Models with MAT57 could realize more significant deformations under compression; thus, this material was chosen for all further models. MAT57 (*MAT_LOW_DENSITY_FOAM) describes a material model for highly compressible low-density foams, which also fits the material behavior of the spacer fabric. It is generally applied for seat cushions or padding on side impact dummies. A more detailed description of the constitutive equations for the material models can be found elsewhere. 23 The stress–strain relation obtained in the compression test for the spacer fabric without seams was used in this mode. The test given in DIN EN ISO 3386-1 was used to validate the simulation results. 22 The compression plate in the finite-element model had the same size as that in the experimental test, 110 mm×110 mm. The spacer fabric had a height of 20 mm (Table 1). As in the original compression test, the lower plate was fixed, the foam had all degrees of freedom, and the upper plate moved downward to the spacer fabric at a velocity of 100 mm/min, leading to compression (Figure 4(a)). The keyword *CONTACT_AUTOMATIC_NODES_TO_SURFACE was used to model the contact between the plate and the spacer fabric. During the modeled compression test, the resulting forces in the compression direction were exported using contact forces. These forces were compared with experimental results.
Numerical model of compression tests: (a) spacer fabric without seams and (b) seam-force compression test.
Modeling compression force for spacer fabric modified by one seam
The numerical model recreates the experimental test set up in Figure 3(c). The spacer fabric was modeled in the same way as previously. The compressing edges were modeled in the same way as the plates presented previously. Only the shape of the compressing object was different. Instead of using flat compressing plates, curved edges were modeled (Figure 4(b)). The compressing objects had the same radius of 2 mm (moving part) and 3 mm (static part) as the experimental setup used. The moving part moved down until the distance between both compression objects was 4.5 mm. This distance had been measured as an average seam thickness in the spacer fabrics modified with seams. The validation of the simulation model is due to its shape deformation and compression force.
Modeling of spacer fabric modified by several seams
The model of the spacer fabrics with seams was abstracted by modeling the seams’ compressive behavior instead of the seams themselves. The advantage of this method is that it saves computational time, but still models the behavior of the spacer fabric between the seams. Following the recreation of one seam in the seam-force compression test, several seams were inserted into the initial spacer fabric using the same principle. The initial spacer fabric was the same as described previously. Three specimens with seams were modeled. The specimens had the same seam distances as the manufactured specimens (Table 1). The seam distances were 18 mm, 24 mm, and 43 mm. An overview of this modeling step is given in Figure 5(a).
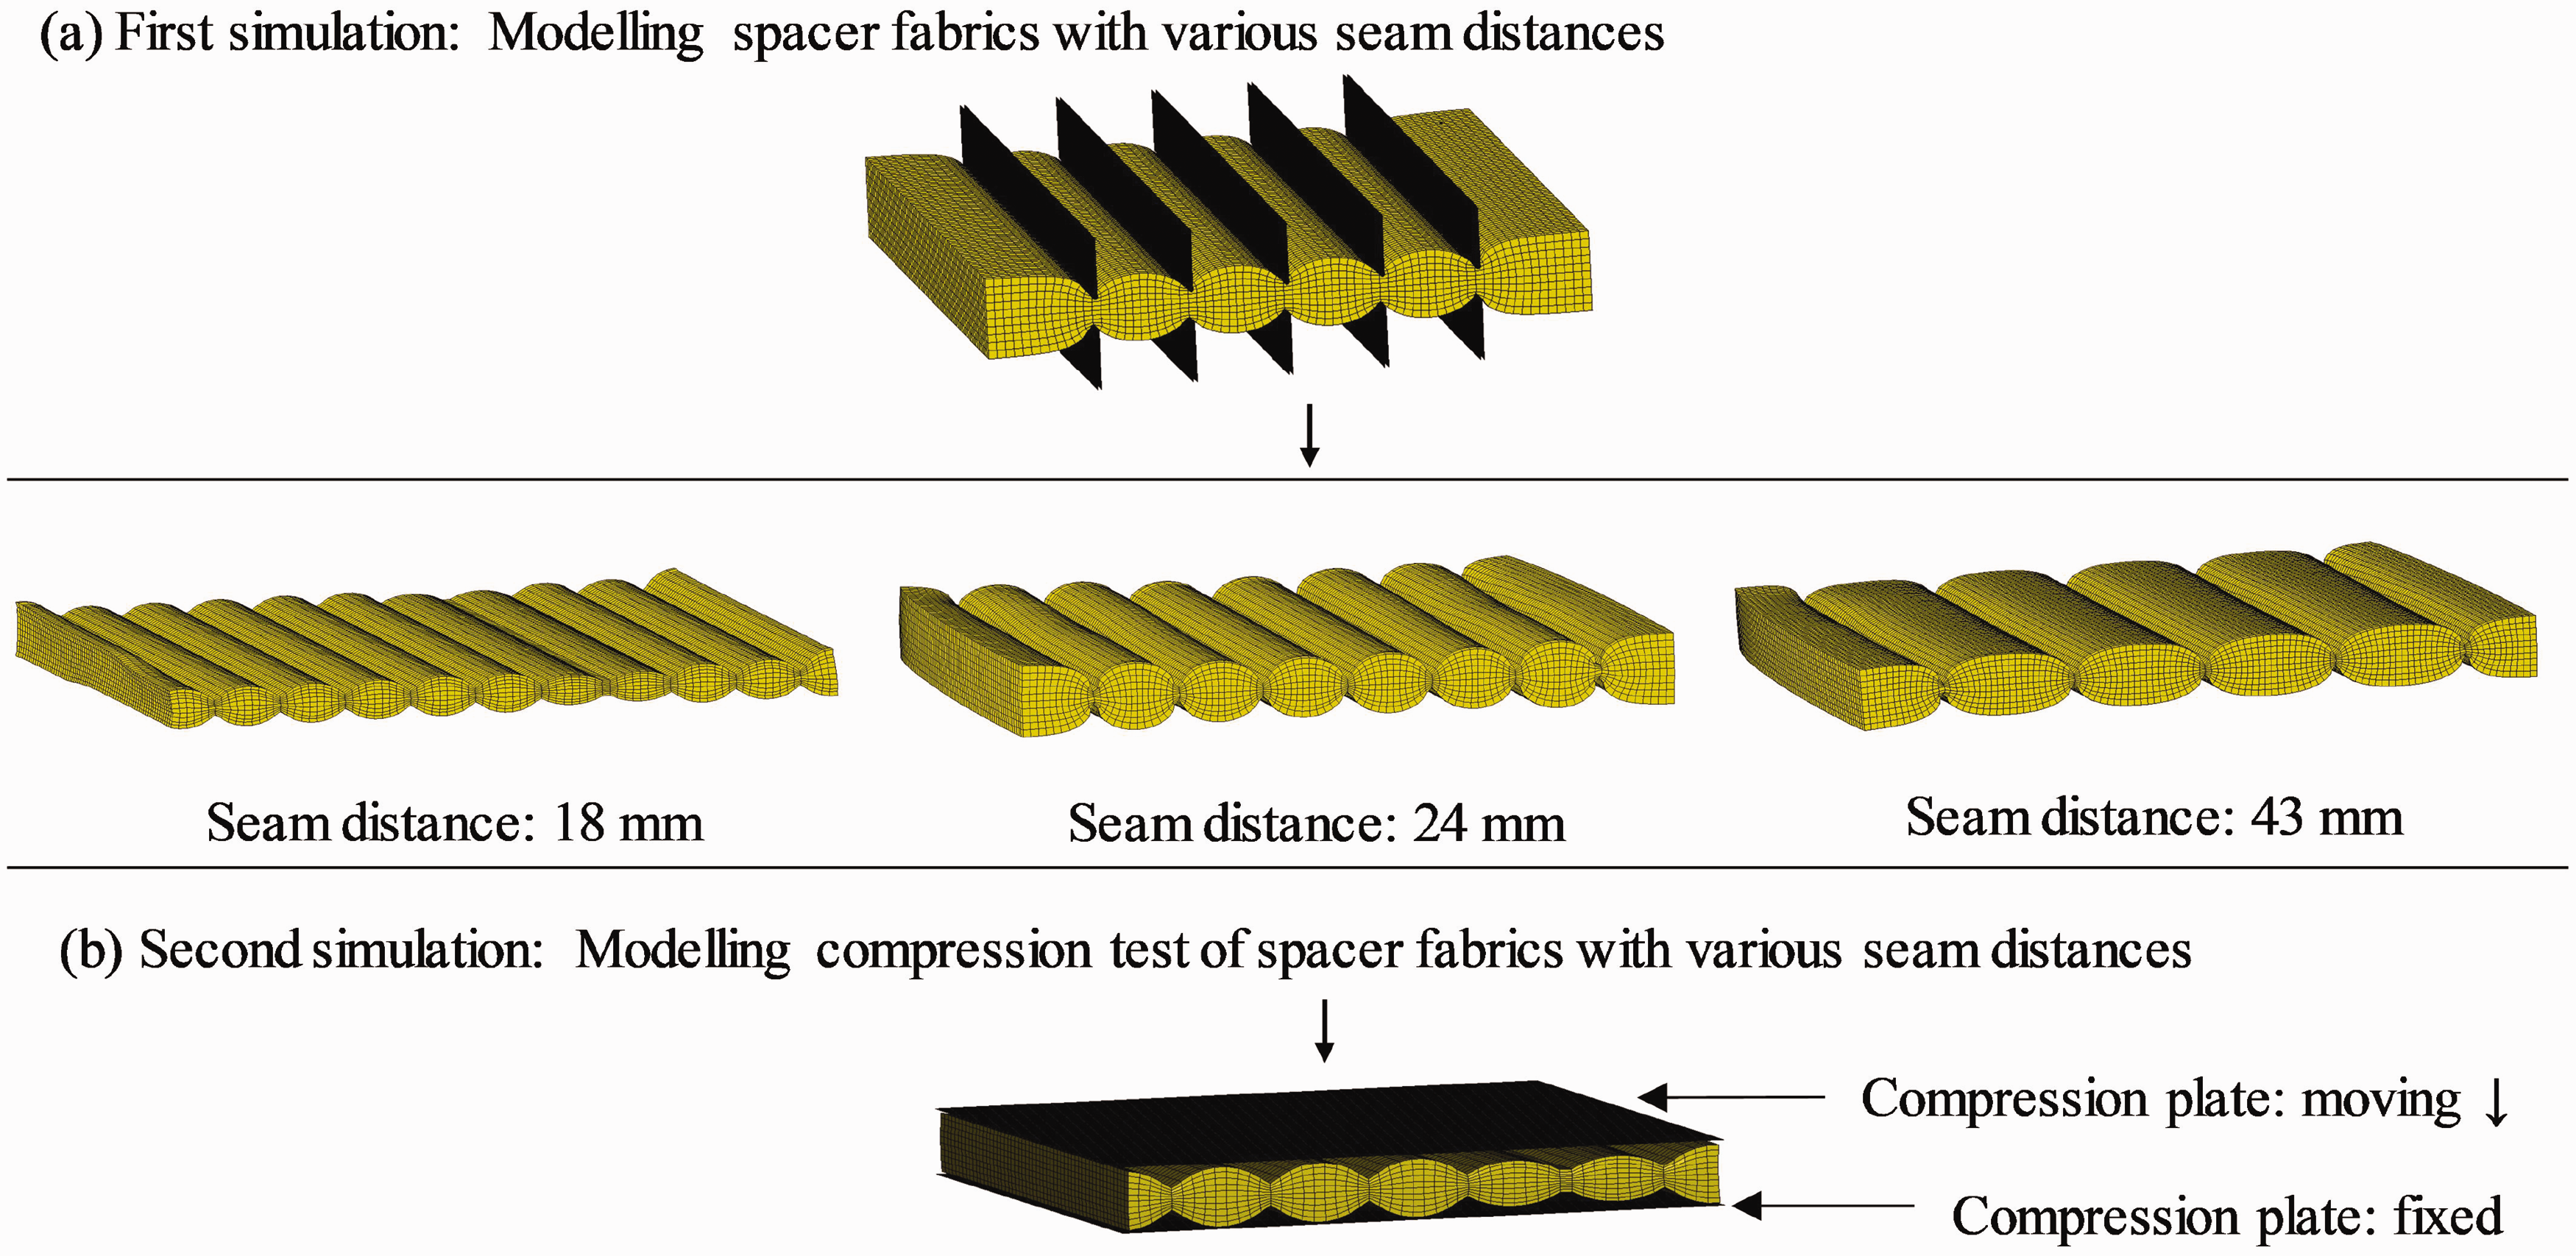
Two-step simulation: (a) modeling spacer fabrics with seams and (b) performing a compression test.
To evaluate the reliability of this modeling method, the cushion heights after the local compression process were measured (Figure 5(b)). If the cushion height was similar between the experimental and numerical results, this served as a testament to the accuracy and trustworthiness of the modeling method and material model.
Modeling compression tests of spacer fabrics modified by several seams
The prestressed model, resulting from the simulation in the previous subsection, provided the compression test’s starting position. The same modeling method and material parameters as used in the compression modeling presented previously were used. These parameters were the same as in the experimental tests (Table 1). The spacer fabric was placed between the compression plates in each model, as in the experiments (Figure 5(c)). Six seams were arranged under the compression plate to test the spacer fabric with an 18 mm seam distance. For a seam distance of 24 mm, five seams were under the compression plate, and for a seam distance of 43 mm, there were two seams under the compression plate.
To evaluate the simulation results, the forces during the compression test exported from the numerical model and the experimental compression test were compared. The compression forces were extracted using the contact forces between the plates and the spacer fabric surfaces.
Results
This section describes the experimental and numerical results. First, the experimental compression tests are evaluated and discussed. Then, the numerical model of the spacer fabric without seams is developed and calibrated by experimental results. The compression forces of one single seam are modeled and discussed. Lastly, the compression tests of spacer fabrics with seams are modeled and compared with experimental results.
Experimental compression tests for spacer fabric
Figure 6 presents the experimental results of the compression tests with sectioned spacer fabrics with seams placed at different periods. Because the initial heights of all tested specimens are determined by the seam placement difference, the curves are visualized as if the compression plates started at the same plate distance of 20 mm. For the specimen with a seam distance of 18 mm and an average cushion height of 12 mm, the force measurement starts at a compression distance of 8–12 mm.
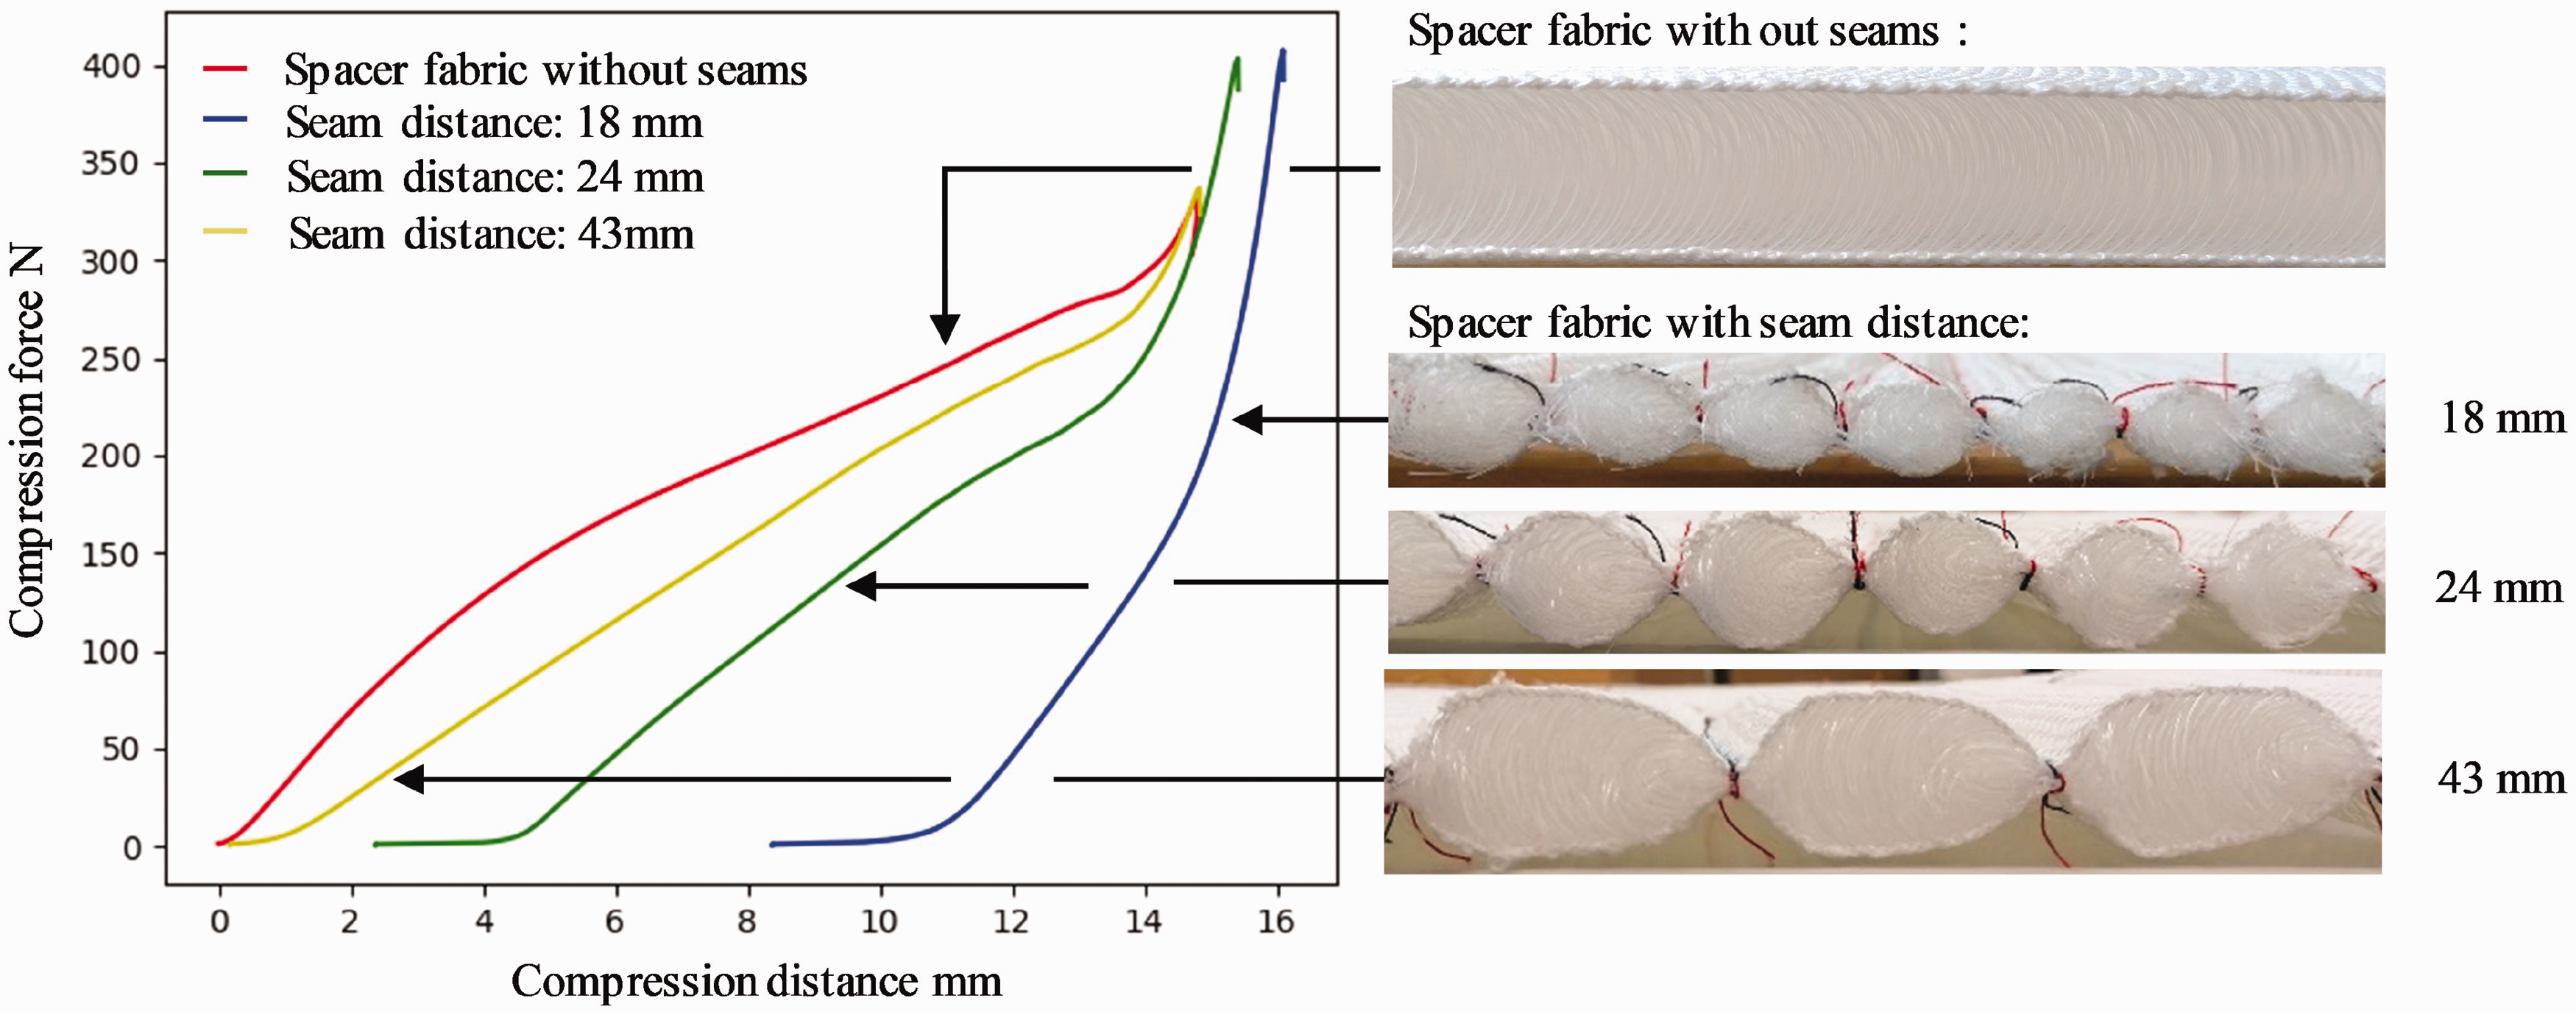
Experimental results of compression tests of spacer fabrics with various seam distances.
The analysis reveals a consistent pattern in the data. All curves can be divided into three distinct sections. The first section shows a slight increase in force over the compression distance. The second section, except for the spacer fabric without seams, demonstrates a higher, nearly constant, increase in force. The third section indicates a further stiffening of the material, compared with the second section.
The first section shows that the more seams are inserted, the longer is the section of low Young modulus. The reason is that, when more seams are inserted, the spacer threads are bent further and cannot absorb forces. Another reason is that the heights of the sectioned areas of the spacer fabric differ more. This effect can also be seen in Figure 11(c). The deviation from the average height of the specimen with a larger number of seams is larger. Thus, not all sections absorb forces at the same time. The compression plate comes into contact with one cushion after another and does not work with all cushions simultaneously (Figure 7). The compression force increases over a longer compression distance. This assumption is supported by looking at the compression force–compression distance curve for the spacer fabric without seams (the red curve in Figure 6); this fabric has a nearly constant height and so the contact with the compression plate is at the same time at every point of the spacer fabric’s surface. This results in a direct increase in force.
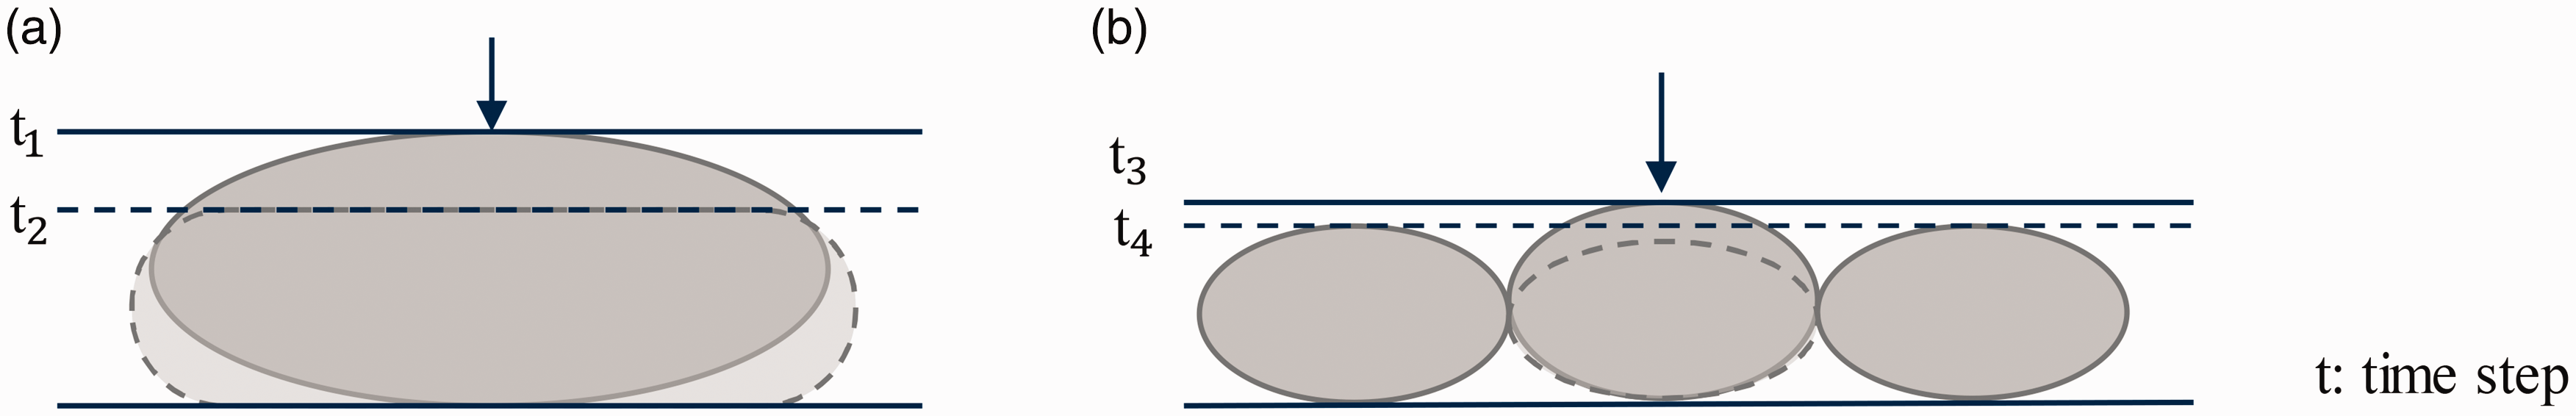
Explanation of the low compression force–compression distance curve section: (a) longer seam distance and bigger cushions and (b) shorter seam distance and smaller cushions. t, time.
In the next section of the curve, the fabrics stiffen up and absorb a greater force. The reason is that the pile thread is forced to stay in place through the seams and cannot lose energy through shear. The threads are bent against each other, stiffening up the fabric. This effect explains why, when more seams are inserted, the curves in the second section are steeper. The more seams are inserted, the less freedom of movement each pile thread has; thus, the stiffer the sectioned spacer fabric.
In the last section, the Young moduli of all curves are even higher, and the curves converge. This causes all spacer fabric to be bent and become nearly flat. The influence of the seams is negligible in this state.
Looking at the absolute forces at each compression step, the absolute force of a spacer fabric without seams is always greater than that of a spacer fabric with seams. The fewer seams are inserted, the higher are the absolute forces. This is because forces for compressing the spacer fabric are already inserted in the production step, while sewing. This force is relatable to the forces seen in Figure 10.
In summary, our findings suggest that a spacer fabric with more seams can absorb less compression force, owing to the compression force previously inserted through the seams. However, when more seams are inserted, the stiffer the spacer fabric becomes, owing to its structural change and the locking of movements of the pile threads.
Calibration of material model while recreating compression tests
Figures 8 and 9 show the results of the numerical model calibration of the initial spacer fabric in the experimental and numerical test setups. Figure 8 shows the calibration in terms of deformation, and Figure 9 shows the calibration in terms of compression force. Figure 8(a) shows the state before compressing the spacer fabric, and Figure 8(b) shows the state for the maximum compression. The numerical model behaves in the same way as for the experiments. As seen in Figure 9, the force–compression length diagram shows the same behavior. The chosen material model, element type, and processing keywords lead to a stable numerical model that can be used in further simulations.
Modeling compression test for material calibration: (a) initial state and (b) compressed state.
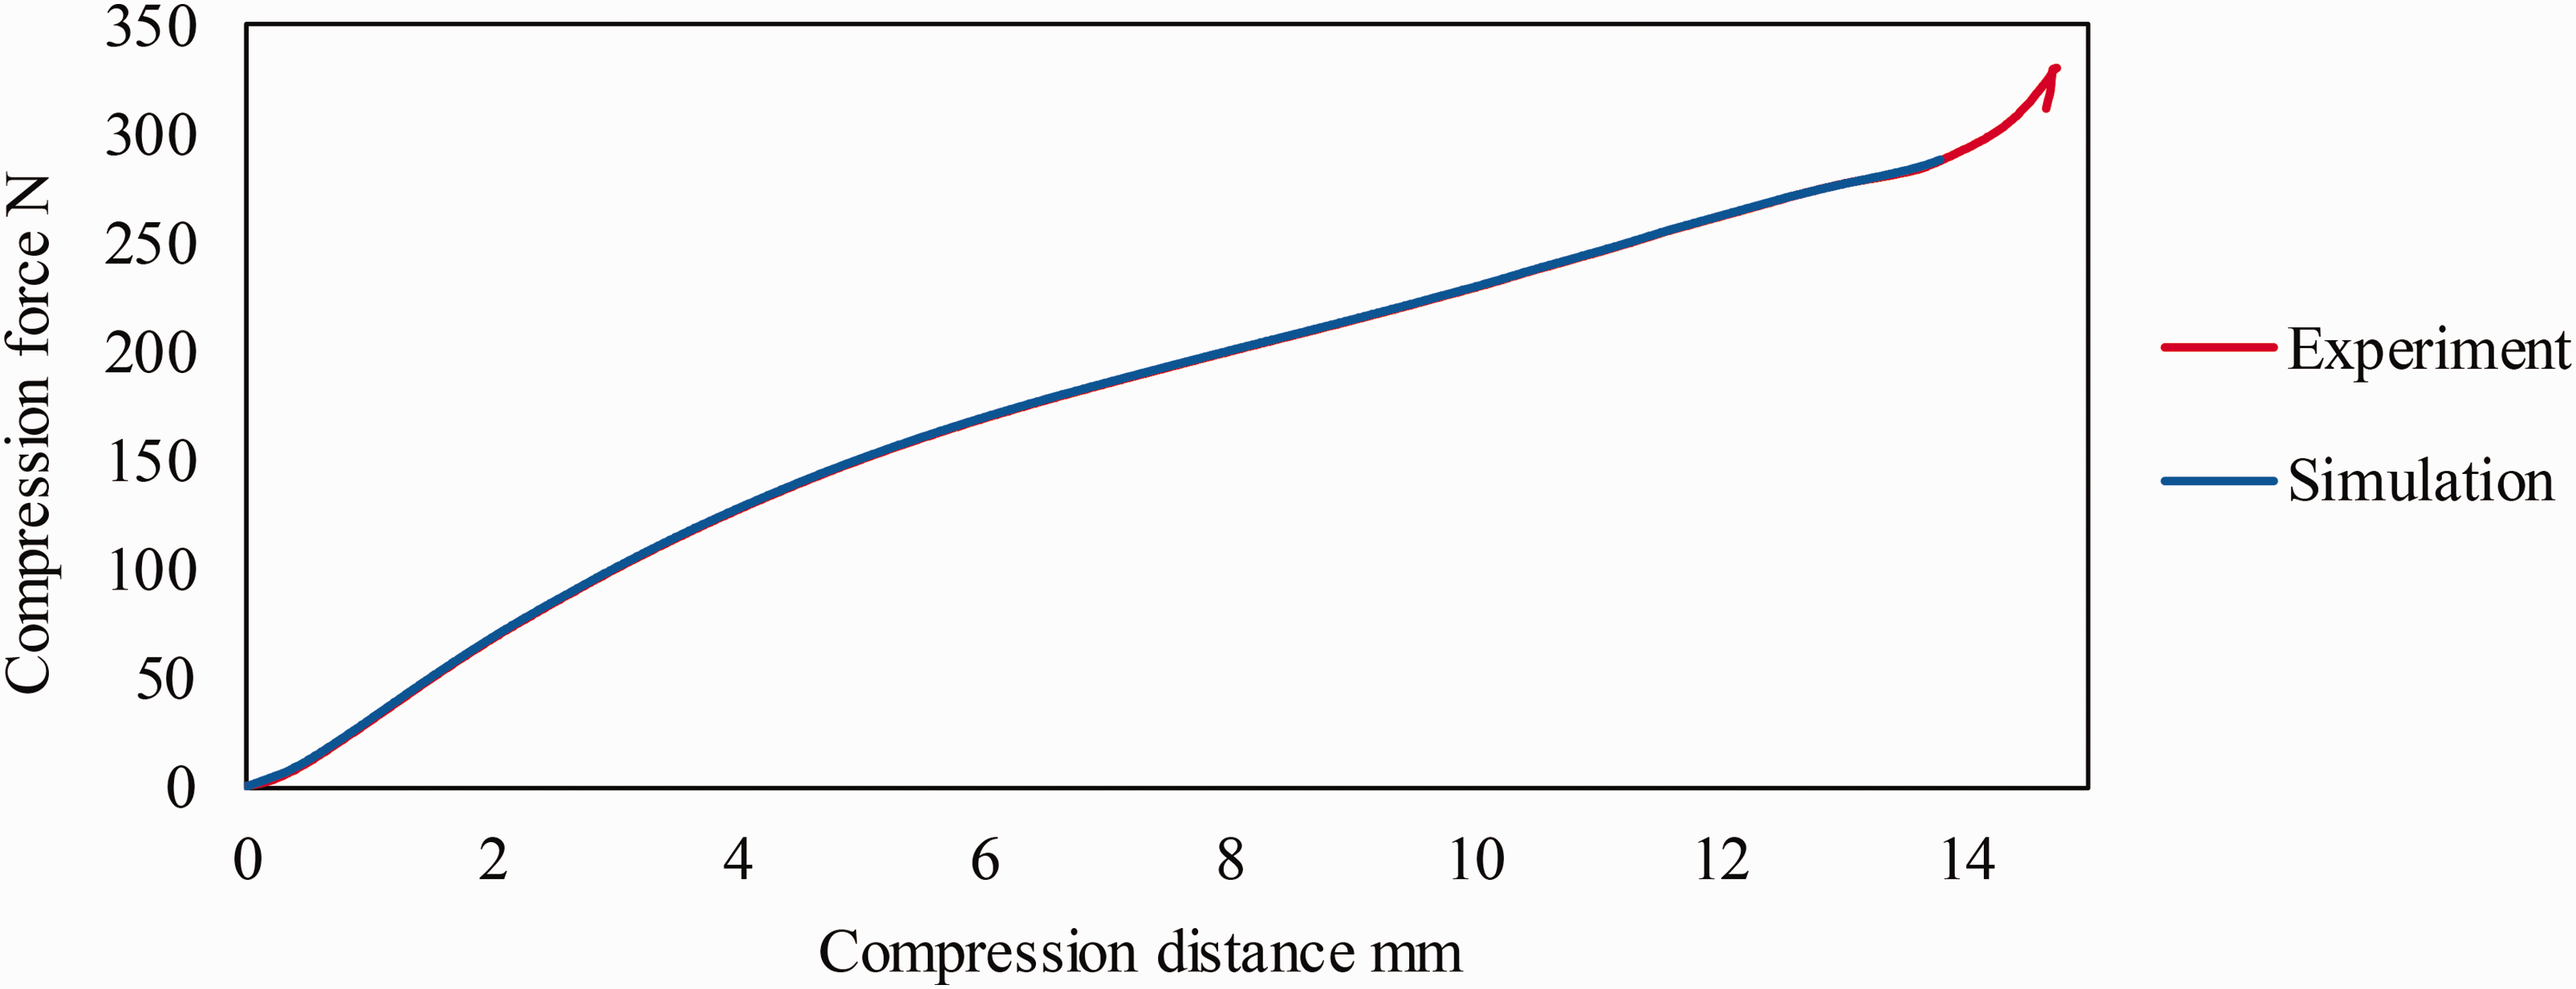
Comparison of forces during modeled and experimental compression tests.
Compression force of one single seam
By imitating the force absorbed by one seam (Figure 10), a similar compression behavior to that for a spacer fabric without seams can be seen (red curve of Figure 6). Comparing the simulation results with the experimental results, there is a difference in the measured forces, but a similar order of magnitude of the forces, with ≈20 N difference, can be seen. The material behavior of the spacer fabric causes this. The pile threads come into contact through the compression, which causes friction and blocks their movement. This pile interaction leads to stiffer material behavior. Since the material model is generally used for soft foams, this stiffening behavior is not imitated in the material model. Looking at the structural behavior (Figure 10(b)), a good match can be seen between the numerical and experimental results for the resulting shape during the compression.
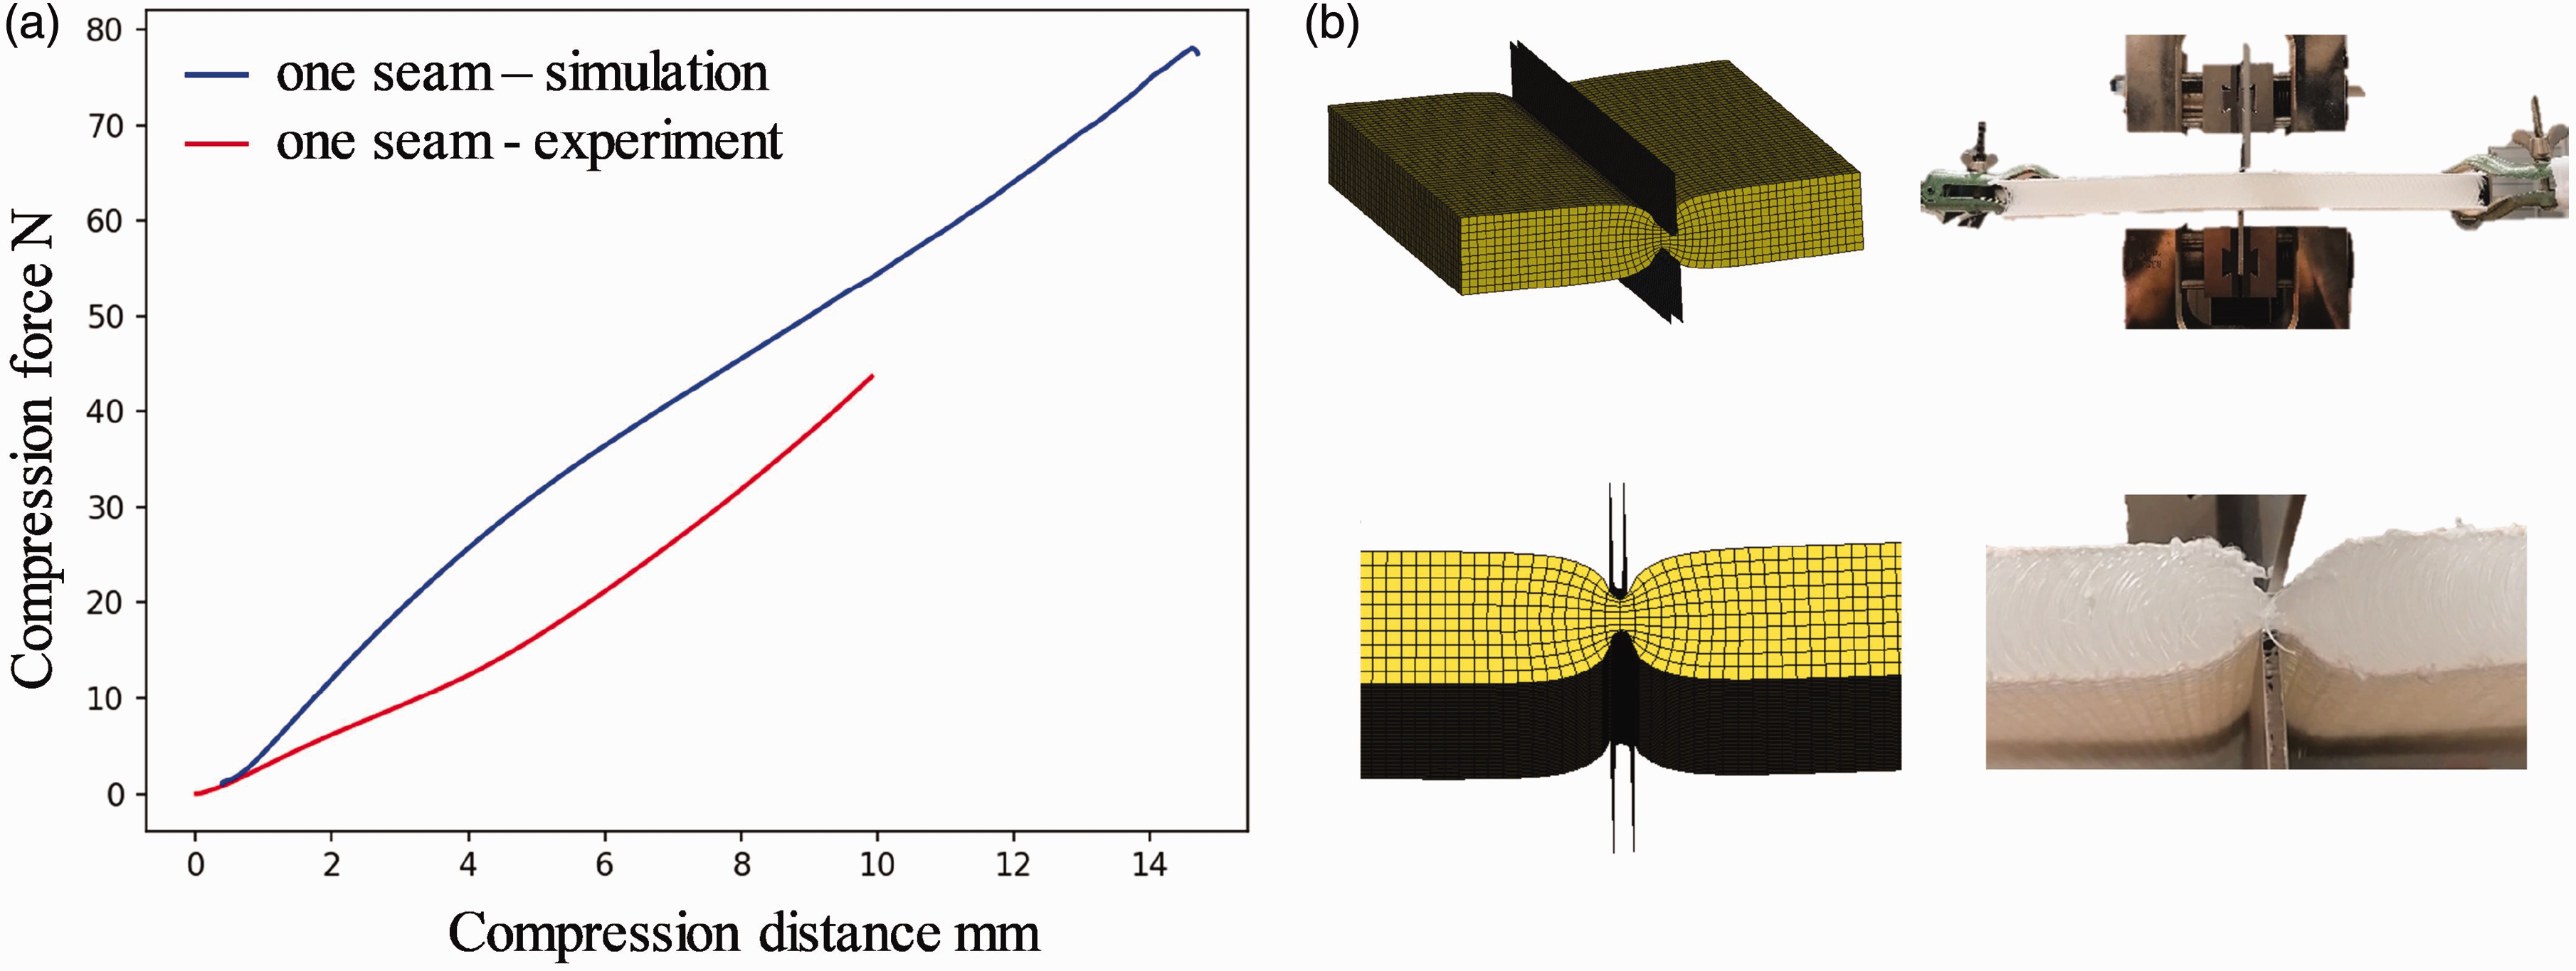
Single seam pressure compression test: (a) compression force–compression distance curve and (b) compression deformation.
In conclusion, the agreement between the simulated and measured curves in Figure 10, regarding force comparison, is not ideal. However, discrepancies in the force trends highlight the inherent limitations of macroscopic modeling, particularly the omission of pole interaction and stiffness increase resulting from bending and friction. Nevertheless, this modeling method shows potential in modeling spacer fabrics with seams. In future research, this point needs further investigation; refinements could be made to address these limitations.
Comparison section height between seams and section shape
In Figure 11(a) and (b), the deformation of the modeled spacer fabrics with seams is compared for each fabric. All modeled specimens look similar to the manufactured ones. The spacer fabrics with an 18 mm seam distance have an oval cross-section. The spacer fabrics with 24 mm seam distance have a rounder cross-section. The spacer fabrics have a seam distance of 43 mm, a cross-section with a flat, undeformed middle part, and rounded edges at the seams. The height is as high as the initial state in the simulation and the experimental specimens. The seam distance is wide enough that the spacer fabric is not deformed in the middle. The spacer fabric between the seams can relax because of the simulation method of performing a two-step simulation and recreating the sewing process. This is why there is a minor deviation in the section heights in the simulation results. However, this can also be seen in the experimental results.
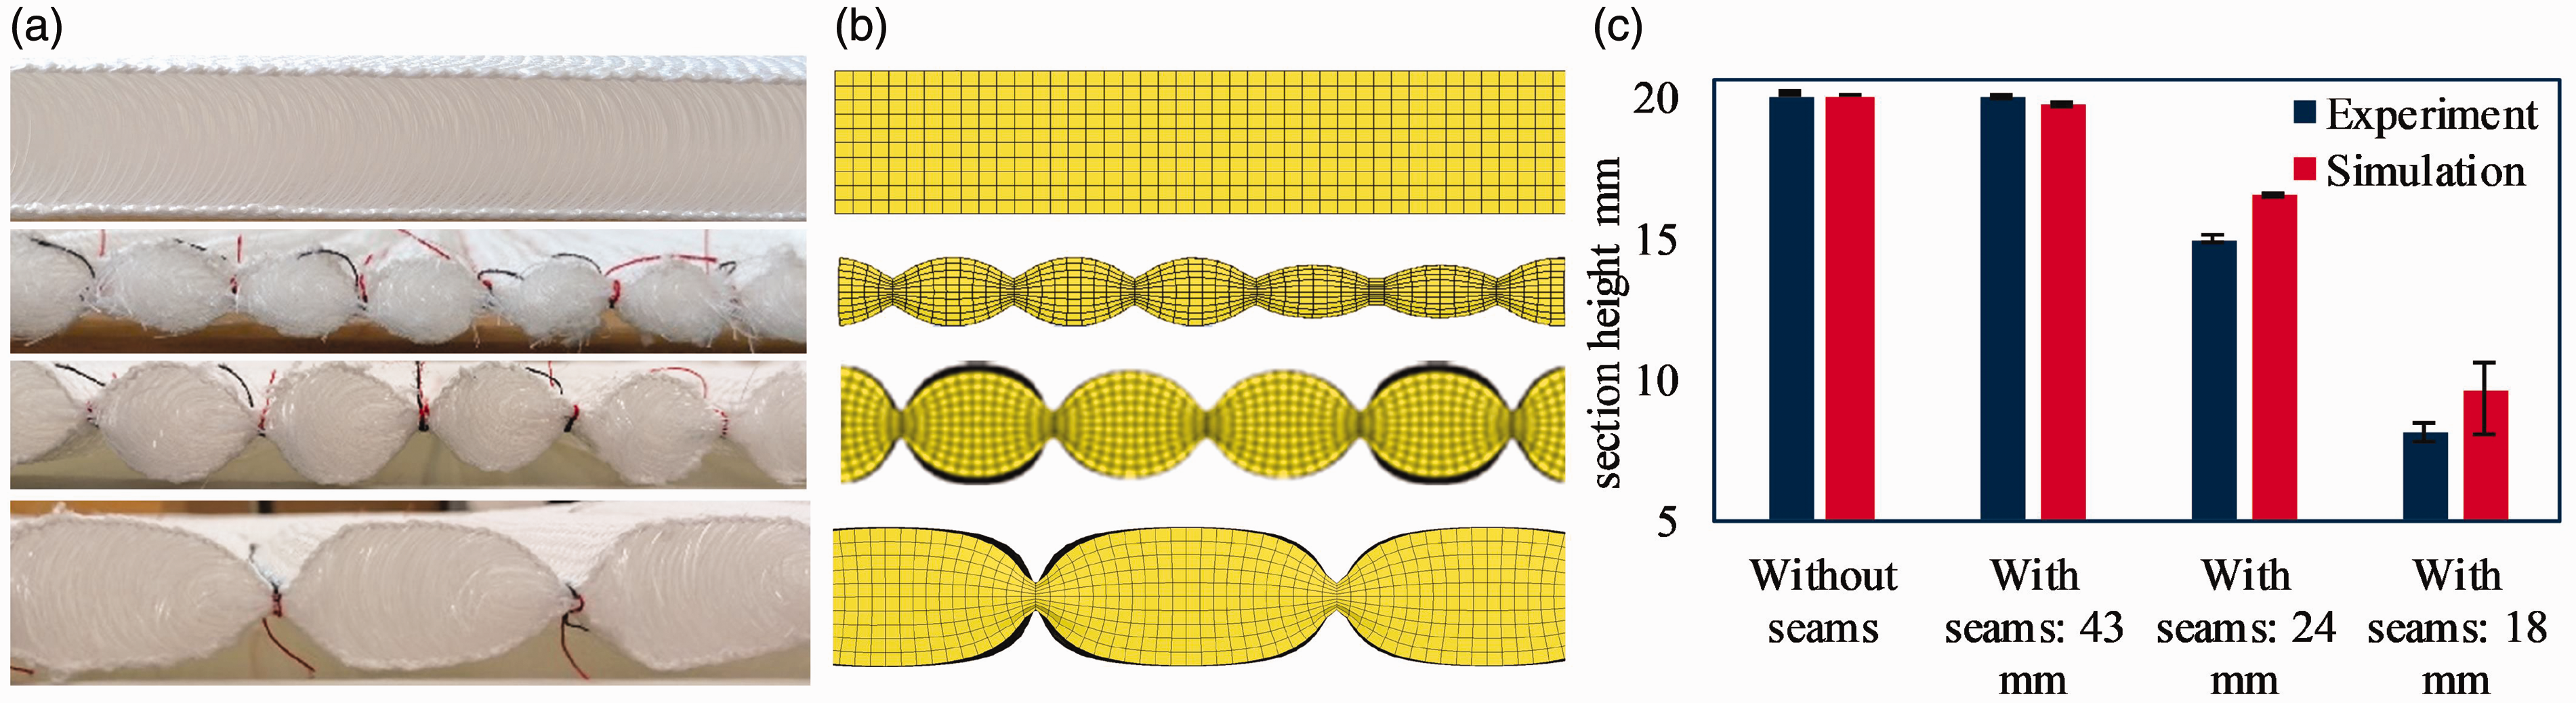
Comparison of the deformation behavior and cushion heights: (a) manufactured spacer specimen; (b) numerical modeled spacer specimen and (c) cushion heights.
Figure 11(c) is a comparison of the cushion heights for the experimental data and the modeling approach. A good match of the cushion heights between the seams can be seen for the numerical and experimental results. The cushion height of the numerical model is lower, as for the experiment of the specimen with more seams. Also, the deviation from the mean value is the largest for the specimen with the most seams. The average height of the cushions in the numerical modeling and manufacture for the specimen with a seam distance of 43 mm differs by 1.26%. The height for the specimen with 24 mm seam distance differs by under 10%, and that for the specimen with 18 mm seam distance differs by 15%. The difference in the cushion heights is increasing because the compression is greater. Still, it is a very good agreement.
Overall, the modeled cushion height and cushion shapes match the experimental results well, and the created simulation model can be used for further investigations.
Compression forces of spacer fabrics with seams
Figure 12 shows the results of the compression tests performed, both experimental and numerical. Figure 12(a) compares the specimen’s compression force–compression distance curves for a spacer fabric with a seam distance of 43 mm. Both curves show a very good match. Because of the wide distance between the seams, the spacer fabric’s sectioned areas have not been compressed through the seams in the middle parts and have the same height as the spacer fabric without seams. Nevertheless, the seams’ influence can still be modeled in a really good way. The curves of the specimen with a 24 mm seam distance are plotted in Figure 12(b). Also, here, the curves are similar to each other. The slower force increase at the beginning of the compression process differs from the experimental results. This could be because the manufactured specimen is more uneven than the simulated ones; thus, it takes longer to contact all the cushions (Figure 7). Similar results can be seen in Figure 12(c). The curve shapes and forces are similar between the modeled and manufactured specimens, for a seam distance of 18 mm. The simulation results show a very good relationship with the experimental data. This agreement is corroborated in Figure 12(d) and (e).
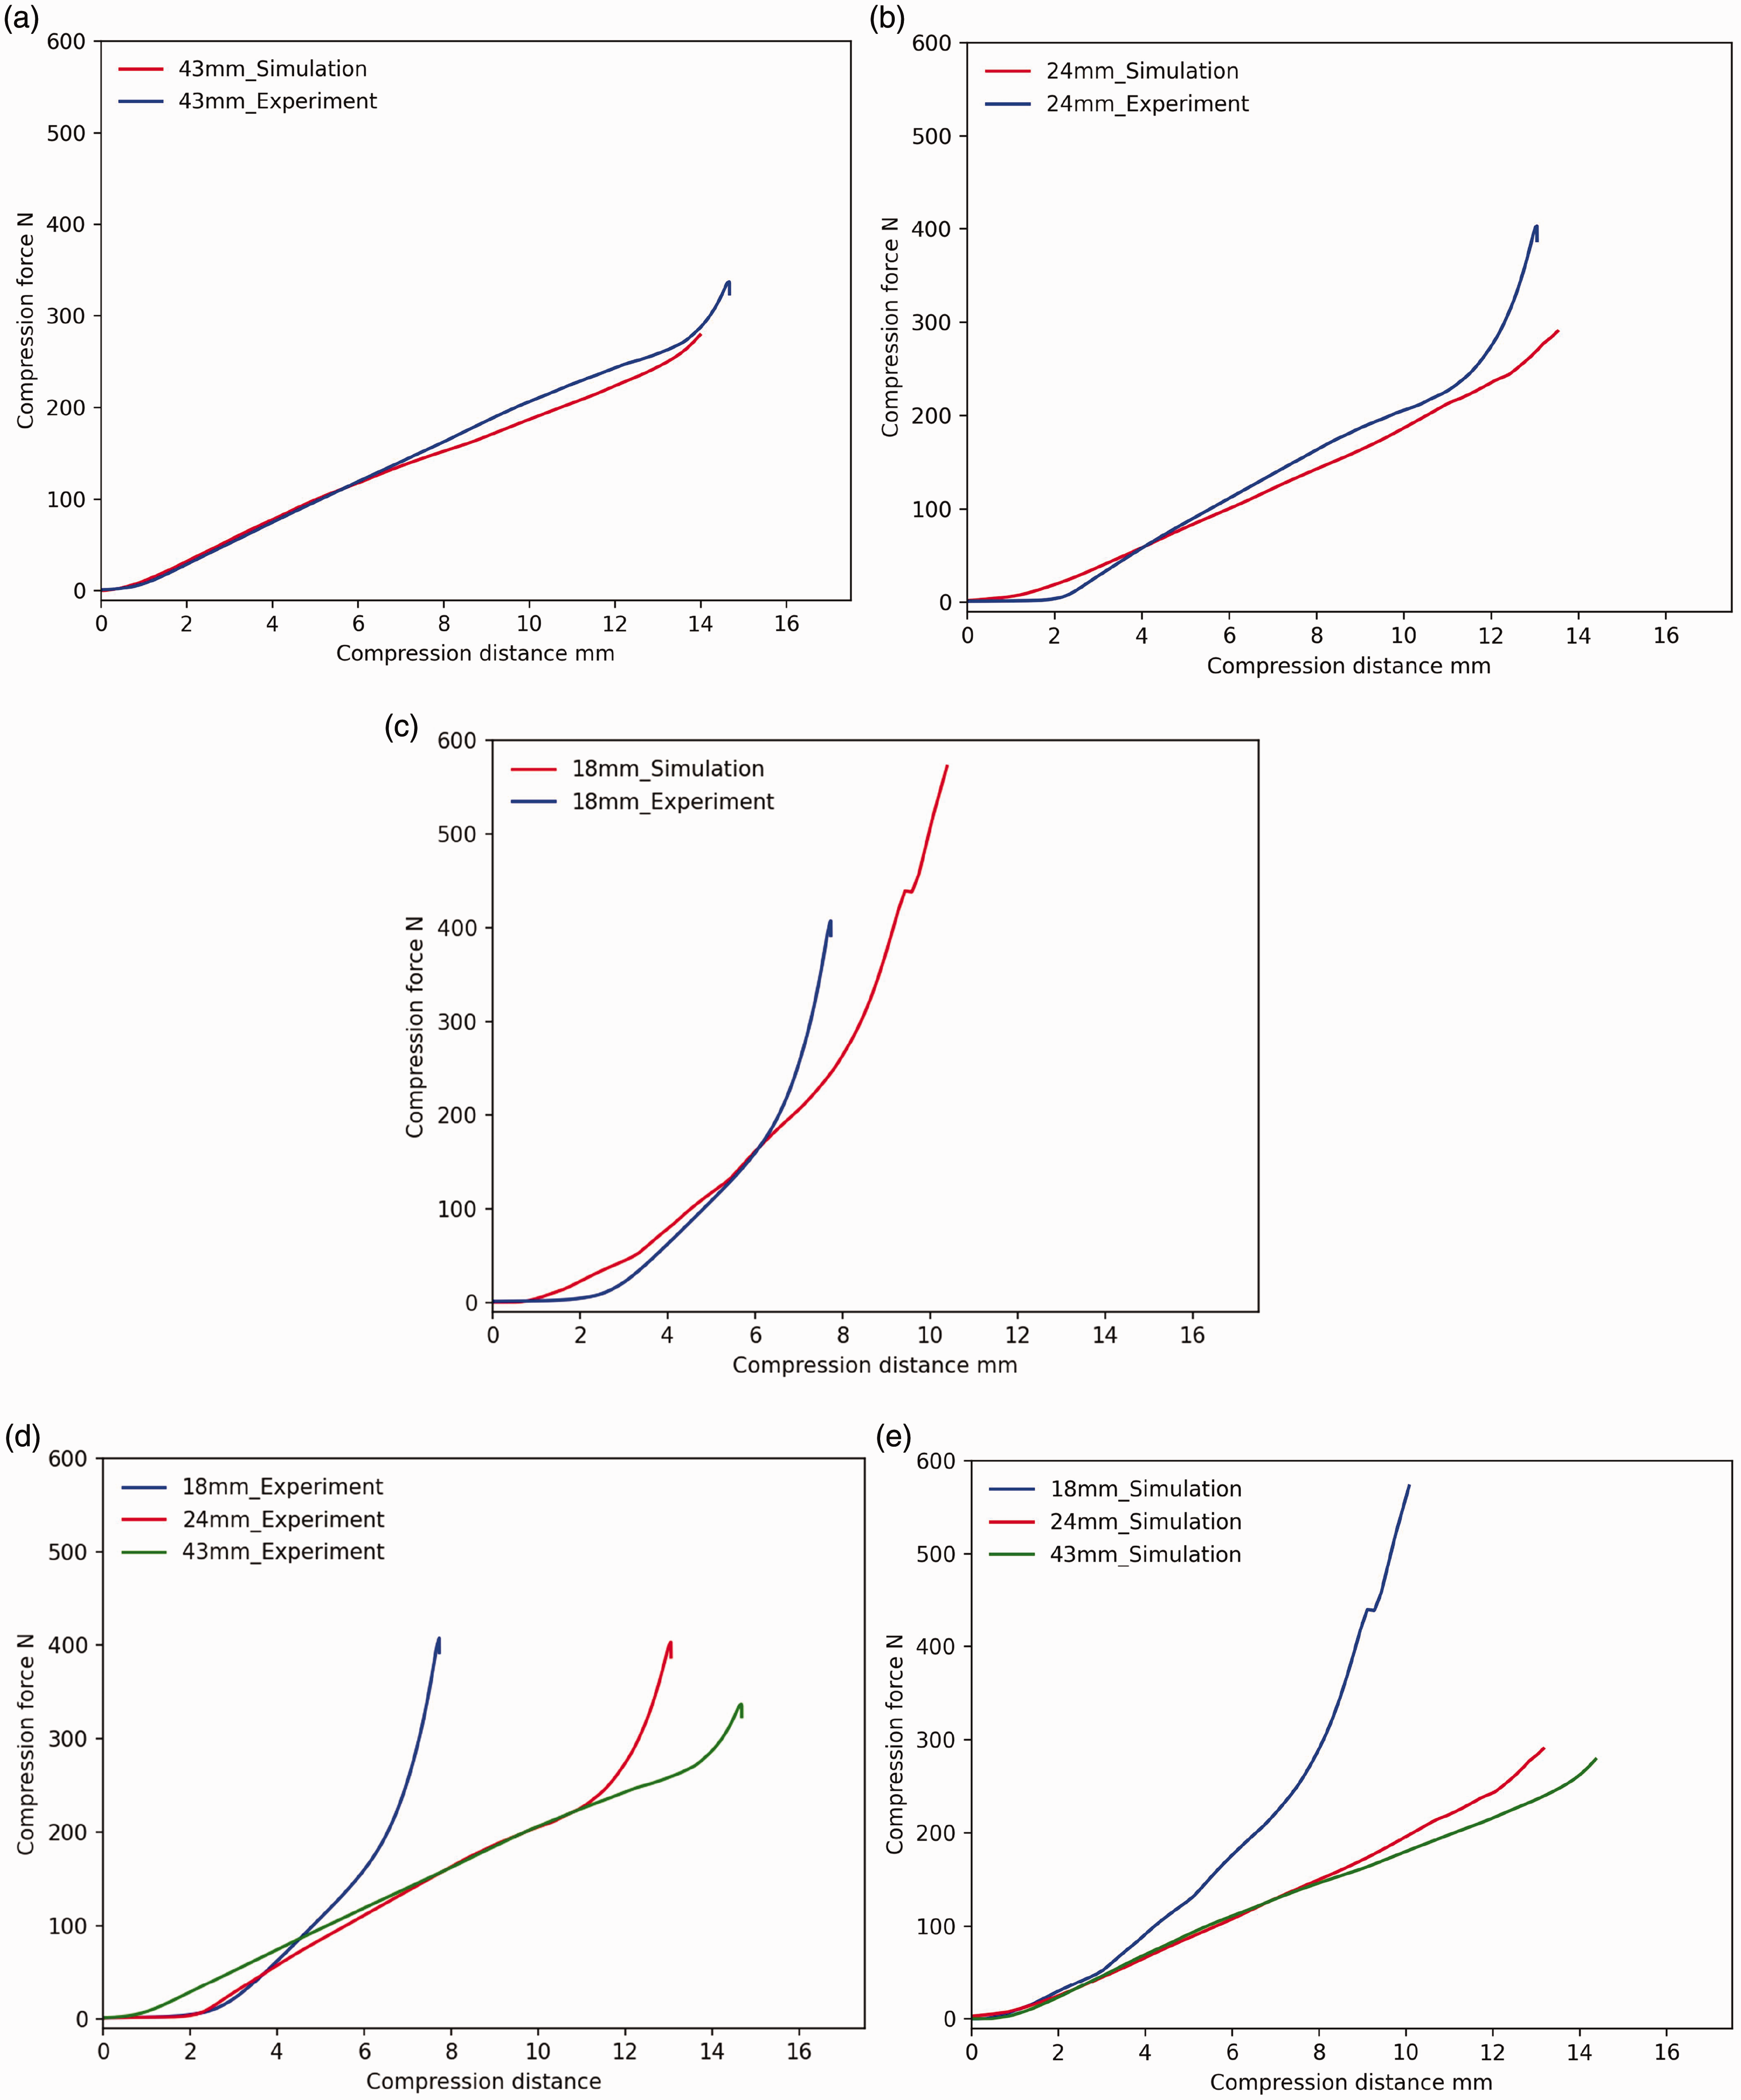
Comparison experimental and simulative results of compression tests: (a) seam distance, 43 mm; (b) seam distance, 24 mm; (c) seam distance, 18 mm; (d) all seam distances, experimental results and (e) all seam distances, numerical results.
Overall, the effect of the seams on the compression force matches the experimental results very well. Only the beginnings of the curves differ slightly. However, the specimen with 18 mm seam distance shows the highest compression forces. Also, the specimens with 24 mm and 43 mm seam distances show similar compression moduli, until the specimen with 24 mm seam distance increases its stiffness. These results can be further used to model different seam shapes and investigate the resulting cushions.
Discussion
Modeling spacer fabrics with seams at the macroscopic level offers significant advantages. Compared with numerical models that model each yarn, this approach reduces both setup and computational times. Material properties of the spacer fabric can be incorporated using experimental data from compression tests, eliminating the need for precise knowledge of the spacer fabric’s knitting pattern. This renders the modeling method accessible to a broader range of users. Furthermore, by not modeling individual yarns or pole structures, computational efficiency is enhanced, allowing for the simulation of larger areas of spacer fabric. However, macroscale modeling has limitations, such as the lack of information on pole deformation, which may lead to slight inaccuracies in force response during compression tests.
Currently, the properties of spacer fabrics are primarily defined during production by altering machine parameters; this can be impractical for small sample sizes. The introduction of seams and varying seam placements presents a new opportunity to modify the properties of spacer fabrics after production. This study experimentally demonstrates that the compression behavior and height of spacer fabrics can be altered through seam placement. Customizing spacer fabrics and locally adjusting their material properties is now feasible. Future research will be focused on an analysis of the analytical relationship between seam distance and section height to predict the effect of various seam patterns. Modeling these seam placements showed an accurate representation of the deformation and compression behavior of the spacer fabrics modified by seams. Various seam patterns can now be tested and evaluated before they are manufactured. Also, curved seam placements are possible, as in the example shown in Figure 13. These individually simulated seams can be used to investigate the pressure distribution of mattresses of individualized sectioned foams. Overall, the approach of modifying spacer fabrics with seams to change the material behavior shows very promising results.
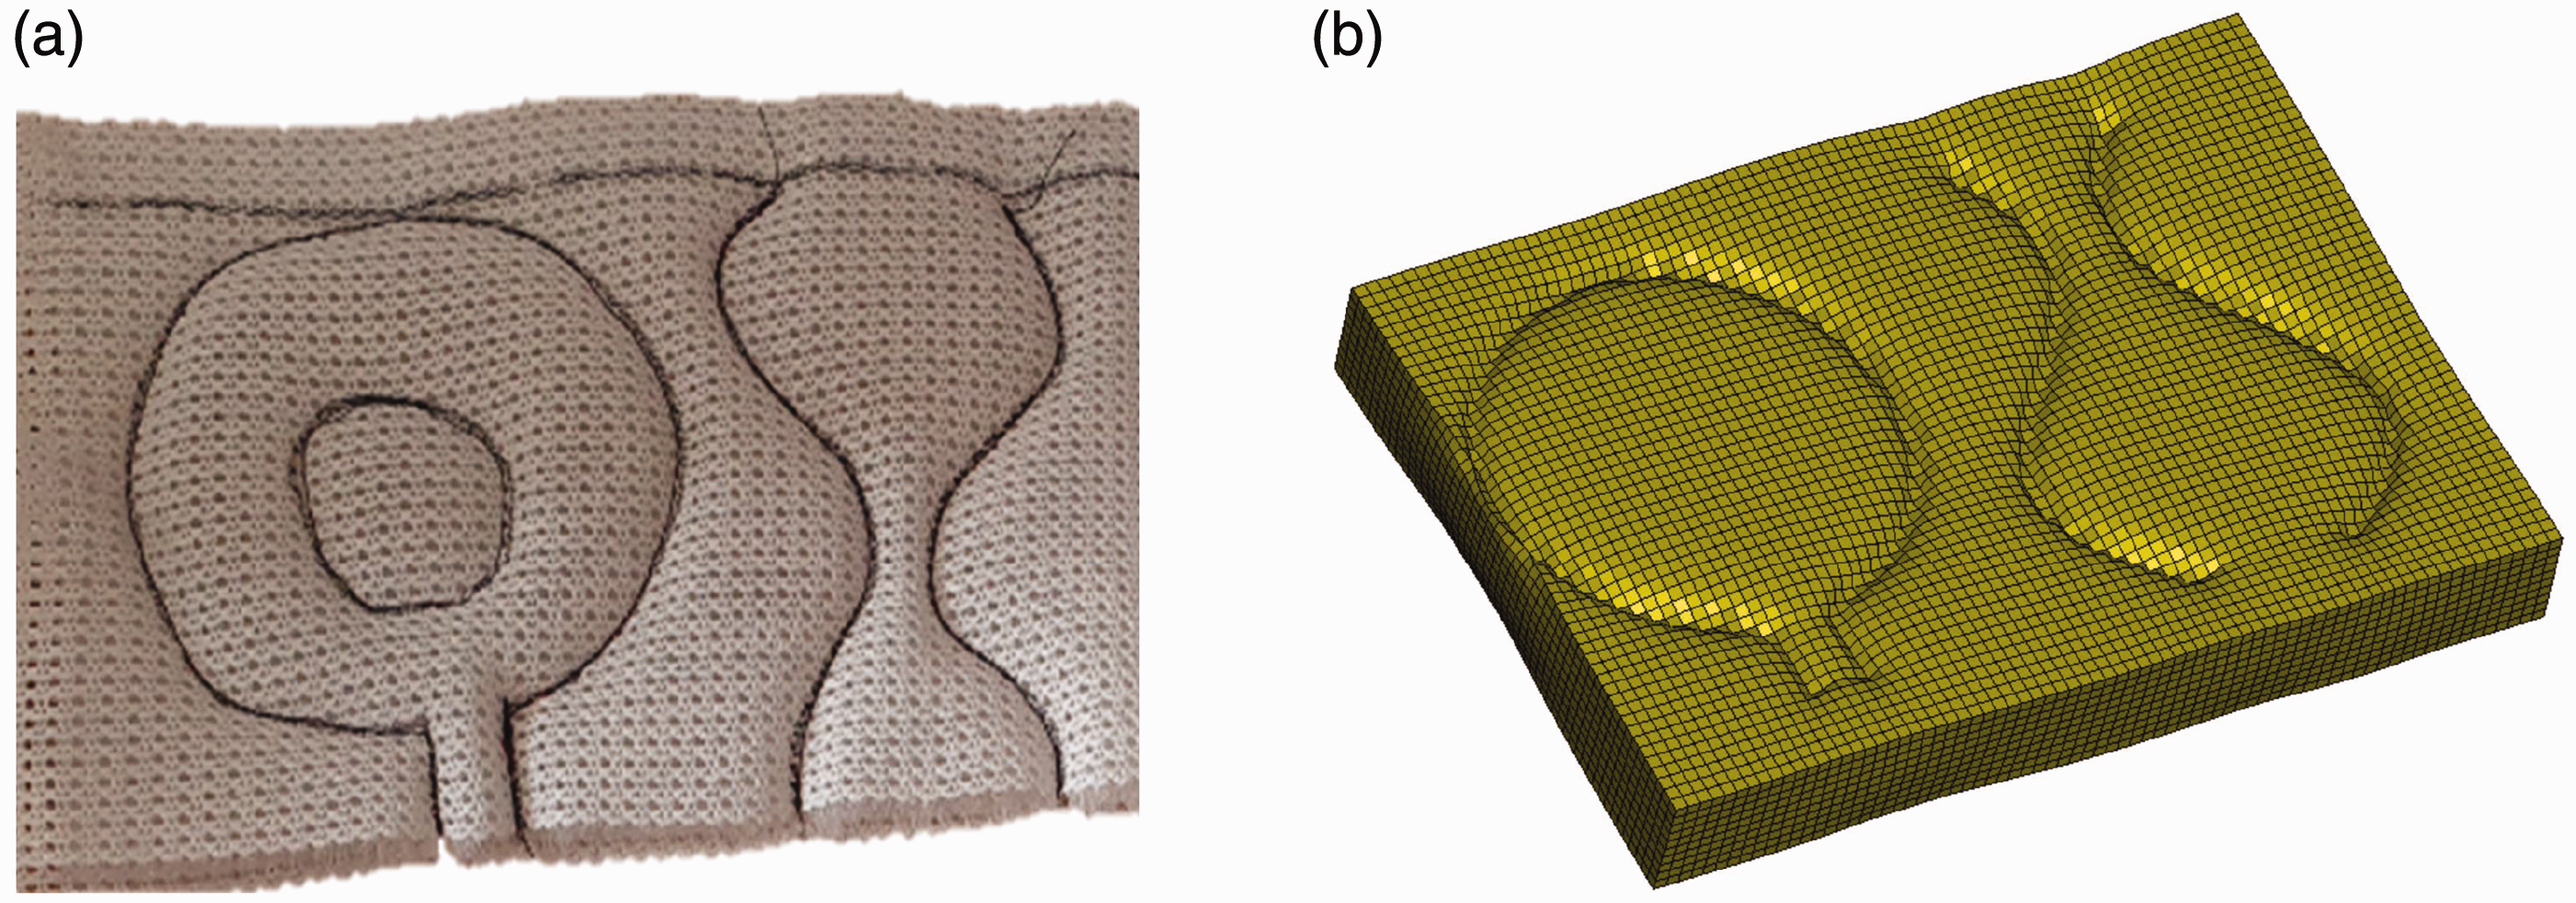
Individually placed seams on spacer fabrics: (a) manufactured and (b) numerically modeled.
Conclusion
This paper presents an experimental and numerical analysis of spacer fabrics modified by seams. Four different specimens were tested and modeled. Three specimens were sectioned locally with seams. One specimen was a regular spacer fabric, without seams, and functioned as a reference. In a two-step simulation, a spacer fabric with seams was recreated, and then a compression test, as in the experimental setup, was performed. The shape deformation and compression force–compression distance curve of the experimental and modeling results were analyzed and compared.
It could be observed that spacer fabrics with more seams absorb compression forces less. This is because compression forces have already been inserted during the manufacturing process. Additionally, the spacer fabric with more seams shows a stiffer behavior. This is due to the structural change and the locking of movement of pile threads.
The two-step simulation method showed very good results. The shape of the sectioned areas in the simulated spacer fabrics, and the height, match well with the manufactured ones. The numerical compression tests showed a very good agreement between the numerical and experimental compression curves.
Overall, the numerical method has proven that the modeling parameter and method were chosen successfully. The simplified numerical model of the spacer fabric improves the model setup and computational time. The method of seam placement is new, experimentally and numerically, and gives great opportunities for individualizing spacer fabrics after production, without changing the machine parameters.
Footnotes
Declaration of conflicting interests
The author(s) declared no potential conflicts of interest with respect to the research, authorship, and/or publication of this article.
Funding
The author(s) disclosed receipt of the following financial support for the research, authorship, and/or publication of this article: This work was supported by DFG, German Research Foundation (grant number PI 1251/1-3).