
Abstract
Compression textiles are prevalent in sports, healthcare and medical products. However, challenges have appeared in designing graduated compression stockings, including the need for systematic studies on leg geometry and the complex pressure-measuring process. This study investigated the pressure performance of suggested and undersized stockings, particularly when the wearer's leg size exceeds the supplier's recommendations. The relationship between pressure and the wearer’s body fat, muscle mass, bone percentage and body mass index (BMI) was also analyzed. A 3D-printed leg mannequin was developed to predict the pressure exerted on human legs. Fifteen healthy female adults were recruited to evaluate two commercially available travel-oriented graduated compression stockings in a seated position with 90° knee flexion. This study found that both stockings failed to provide the theoretical pressure gradient in which the highest pressure was found at below calf (b1). The stocking wearer should ensure that both their legs and the selected stocking sizes align with the supplier’s recommendations to avoid unexpectedly high pressure applied to their legs. Among body fat, muscle mass, bone percentage and BMI, only pressure measured at below calf (b1) can be predicted by bone percentage. Furthermore, the developed 3D-printed leg mannequin can be cost-effective for pressure evaluation in the initial compression stocking development stages. It helps reduce the need for repeated human trials while enabling customization to replicate different leg shapes and sizes, thereby conserving time and resources in the research process. Future studies should be conducted with an improved design of the leg mannequin and more extensive participant groups.
Compression textiles have been widely applied to healthcare, medical, athletic, and leisure sports applications.1 –3 Sports compression garments have been commonly used to improve muscle function, enhance exercise performance, and prevent muscle fatigue by increasing venous return, blood flow, and oxygenation.4 –6 Long-haul air travel grows yearly, with 2.4 billion passengers flying internationally, 7 and the usage of graduated compression stockings in long-haul flights is expected to increase. With appropriate pressure, compression stockings are the fundamental treatment to facilitate the blood from the leg to return to the heart, improve venous hemodynamics, decrease the symptoms of the swollen extremity, reduce blood clot risk during long-haul flight, and prevent deep vein thrombosis (DVT), pulmonary embolism, and chronic venous diseases.1,8 –12
To achieve the leg pressure gradient, compression stockings exert maximum pressure on the ankles and gradually decrease toward the knees.12,13 Insufficient pressure of the compression textile limits the efficacy, whereas excess pressure can cause discomfort, numbness, or even more severe damage.1,14 Commonly, the non-ergonomically designed compression stockings cause poor fit, discomfort, skin irritations, and injuries.15,16 Therefore, evaluating the pressure of compression textiles has become a significant issue in compression stocking development. For commercial compression stockings, the indicated pressure dosage typically reflects a measurement taken at the ankle, while the distribution of compression dosage throughout the leg remains unspecified. 17 Besides, various standards are used in different countries for evaluating the pressure, including the British standard BS661210:2018, 18 European standards CEN/TR 15831:2009, 19 German standard RAL-GZ 387/1:2008-01, 20 and International Compression Club recommendation. 21 Furthermore, the pressure indicated by the manufacturer is measured exclusively in a laboratory setting and not on human legs. 22 In fact, the human leg’s size, shape, and texture can significantly influence the pressure exerted by compression stockings. Mismatches in leg shape and size can affect the pressure applied by the stockings. Additionally, legs with more muscle mass may have a softer texture, potentially reducing the pressure experienced by the wearer. However, commercial stockings are typically produced in standardized shapes and various sizes, which may not provide an ideal fit for all individuals. There is a notable lack of studies investigating the relationship between these factors and the pressure performance of compression stockings.
To evaluate the pressure performance of the stockings, commonly used methods include direct measurements using pressure sensors 23 with human subjects,24 –26 compression testing machines,18,20 and mannequin legs.27 –29 Previous studies found that the anatomical structure of individual legs, body postures, measurement point on the leg, design of compression stockings, and physical properties of stockings materials also influence pressure value.22,24,26,30 While wearer trials are generally considered a more reliable evaluation method than mannequin testing, they usually involve costly and inefficient recruitment processes and require large groups of participants to collect sufficient data for analysis. According to the British standard BS661210:2018 18 and German standard RAL-GZ 387/1:2008-01, 20 the pressure can be tested on the HATRA Mark II Hosiery compression testing machine and the Hohenstein system compression test device. Some studies used the medical stocking tester (MST, Salzmann AG, St. Gallen, Switzerland) to measure the interface pressure on a wooden leg model and electrical sensors at four measuring points, including ankle (b), below calf (b1), calf (c), and below knee (d).9,22 However, the wooden leg in the MST medical stocking tester costs around AUD 5567. The high cost of purchasing the testing device may hinder the initial design and development of the compression stockings.
Recently, a computer-controlled artificial leg with force-sensing resistor sensors has been developed to measure pressure in medical compression stockings. 28 However, the leg mannequin is cylindrical with a hard surface, which is different from that of the human leg, with curvature and softness. Another leg mannequin, morphing from size M to L, is embedded with pressure sensors and a silicone cover, 31 requiring a complex setup and high testing costs. These requirements are impractical for pilot tests in the textile design and development stages, which are generally conducted on small scales. Another indirect approach is to estimate pressure performance by testing the physical characteristics of the compression textile, 23 theoretical calculation by Laplace's Law,19,30 and simulation by a three-dimensional (3D) finite-element (FE) model.23,32 According to European standards CEN/TR 15831:2009, the measured force is measured using a tensile tensiometer and then transformed into a pressure value using the Laplace formula. 19 A previous study found that the calculated compression pressure of knitted fabric using modified Laplace's Law correlates well with the experimental interface pressure values measured on the rigid cylinder with a PicoPress compression measurement system. 30 In this way, the human leg's texture, shape, and anatomy have been neglected again, which may affect the accuracy of the measured pressure value on the human leg. A 3D FE model for simulating the interaction between the leg and the compression stockings has been developed based on the actual geometry of a female leg obtained from magnetic resonance imaging (MRI) and the mechanical properties of the stocking prototype.23,32 The high cost of MRI and the professional programming skills needed to develop an FE model may not be efficient enough for pilot tests on compression textiles.
In addition, the relationship between the pressure, compression stockings’ size, and wearer’s leg sizes has not been systematically studied. Small-scale, realistic, and cost-effective compression textile testing devices are particularly scarce. Therefore, this study investigated the impact of undersized stockings, the effects of leg sizes exceeding supplier recommendations, and the effect of body fat, muscle mass, bone percentage, and body mass index (BMI) on compression stockings’ pressure performance. A 3D-printed leg mannequin was developed as a cost-effective method to study the effectiveness of using leg mannequins to estimate the compression performance of stockings on human legs. The findings in this study are significantly beneficial for the sportswear, healthcare, and textile industries.
Material and methods
Participants
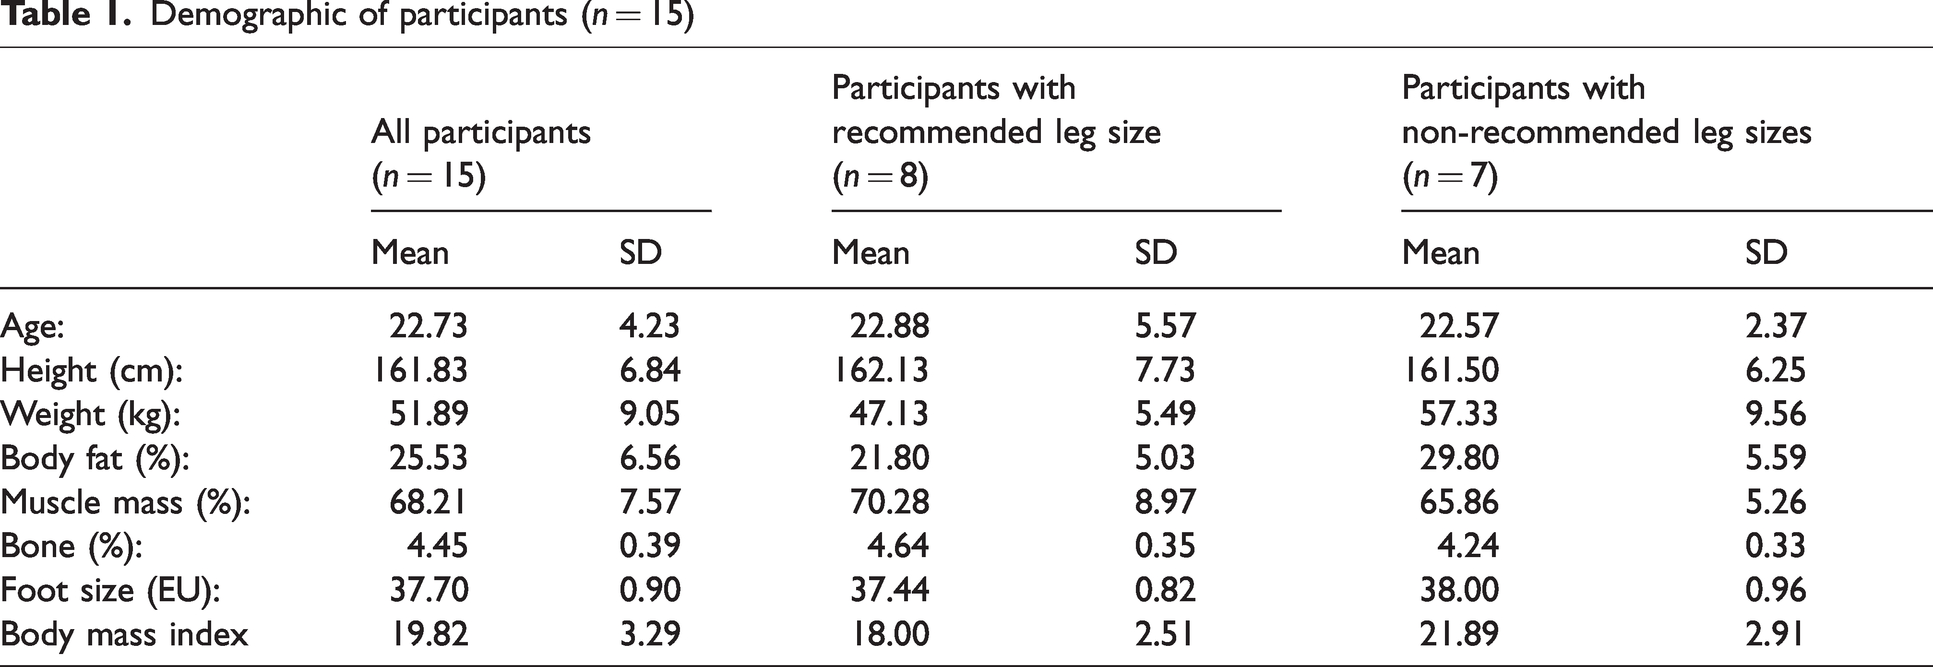
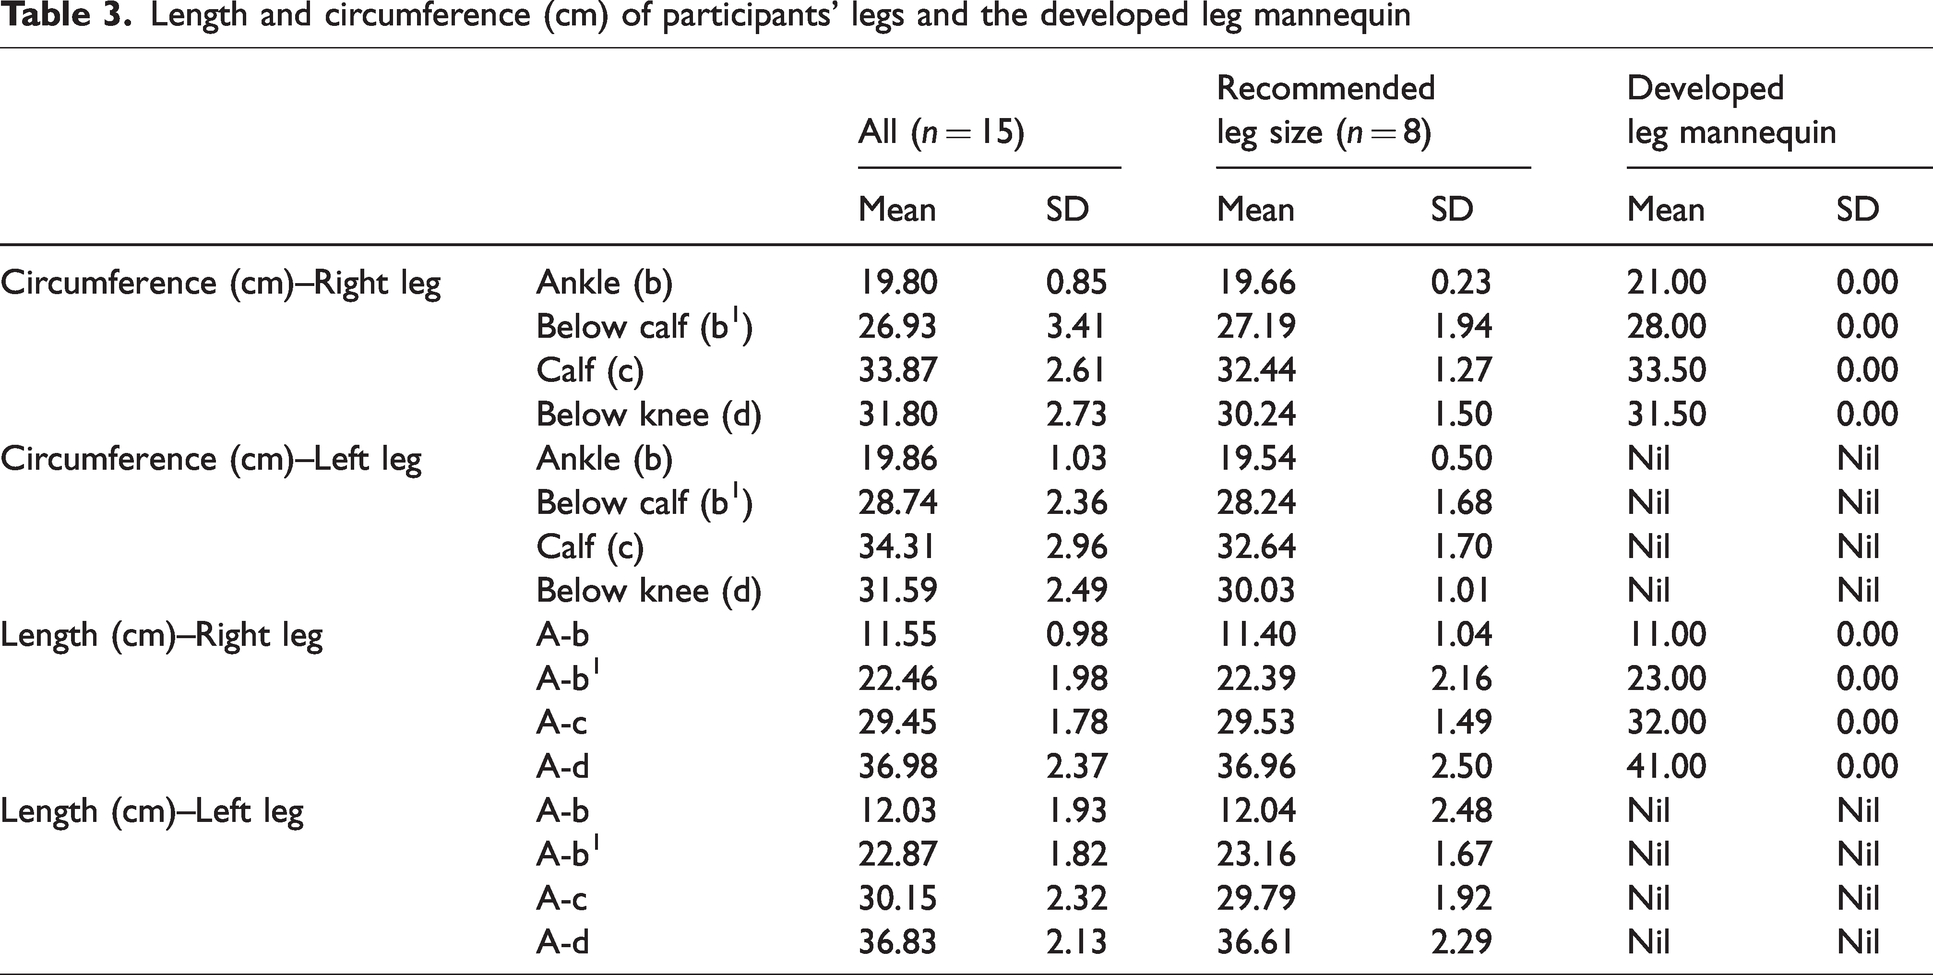
Fifteen young, healthy females above 18 (aged 22.73 ± 4.09 years, height 161.83 ± 6.60 cm, weight 51.89 ± 8.75 kg) participated in this study, in which eight participants had leg sizes within the recommended range, and seven were outside the range. The recommended leg size is based on commercial compression stockings, which are 19–21 cm around the ankle and 28–37 cm around the calf. Among the seven participants with leg circumferences outside the supplier’s recommended size, four participants had larger calf circumferences (mean: 38 cm), one had larger ankle circumferences (22 cm), and two had smaller ankle circumferences (mean: 18.3 cm) than the supplier’s recommended size. Participants were selected to be healthy with normal body fat (25.53 ± 6.56%) and high muscle mass (68.21 ± 7.57%) and tend to wear compression stockings during exercise to enhance their performance. All participants were informed and signed written consent and participated under the ethics approval (ETH23-8764) granted by the Human Research Ethics Executive Review Committee at the University of Technology Sydney. Table 1 presents descriptive statistics for the biometric measurements of all participants.
Demographic of participants (n = 15)
Materials and equipment
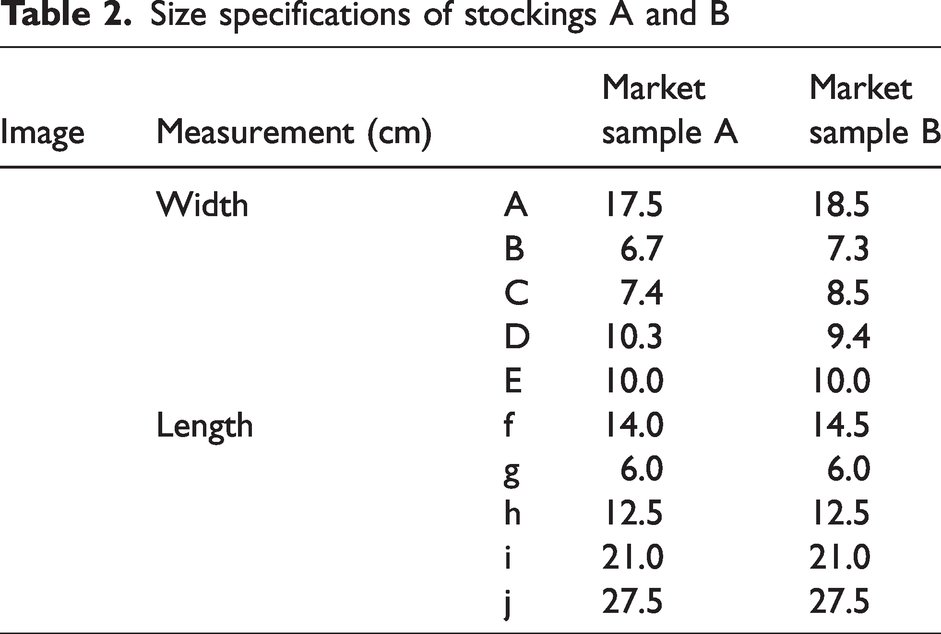
Two knee-high graduated compression stockings designed for travel were selected. To investigate the importance of appropriately sized stockings, the size of market sample A was selected based on the participants and the developed leg mannequin's leg measurements. In contrast, the size of market sample B was chosen to be smaller than required. Market sample A (Jobst, Sweden) offers 15–20 mmHg compression in size 1, suitable for individuals with an ankle circumference of 18–21 cm and a calf circumference of 27–37 cm. This stocking is composed of 55% Nylon, 33% Cotton, and 12% Elastane (Figure 1(a)), and the weight of stocking A is 25.2 g. Market sample B (Oapl, Australia) provides 14–18 mmHg compression in size S, fitting those with a leg height of up to 40 cm and a calf circumference of 25–30 cm. It is composed of 76% Nylon and 24% Spandex (Figure 1(b)), and the weight of stocking B is 17.8 g. Both market samples are knitted in a single jersey structure. The knitted fabric of market sample A has 1 mm thickness whereas market sample B is 0.88 mm thick. Their dimensions were measured with a ruler when lying flat on a desk. The pressure exerted by stockings was measured using AMI air-pack pressure sensors (AMI3037-SB-SET, SANKO TSUSHO CO., LTD, Japan). It has a thin sensor bladder with 1 mm thickness and 20 mm diameter. The measurement range is from 0 to 150 mmHg, with an accuracy of ±2 mmHg in a room temperature of 23°C. 33 Table 2 presents the size specifications of commercially available compression stockings A and B.
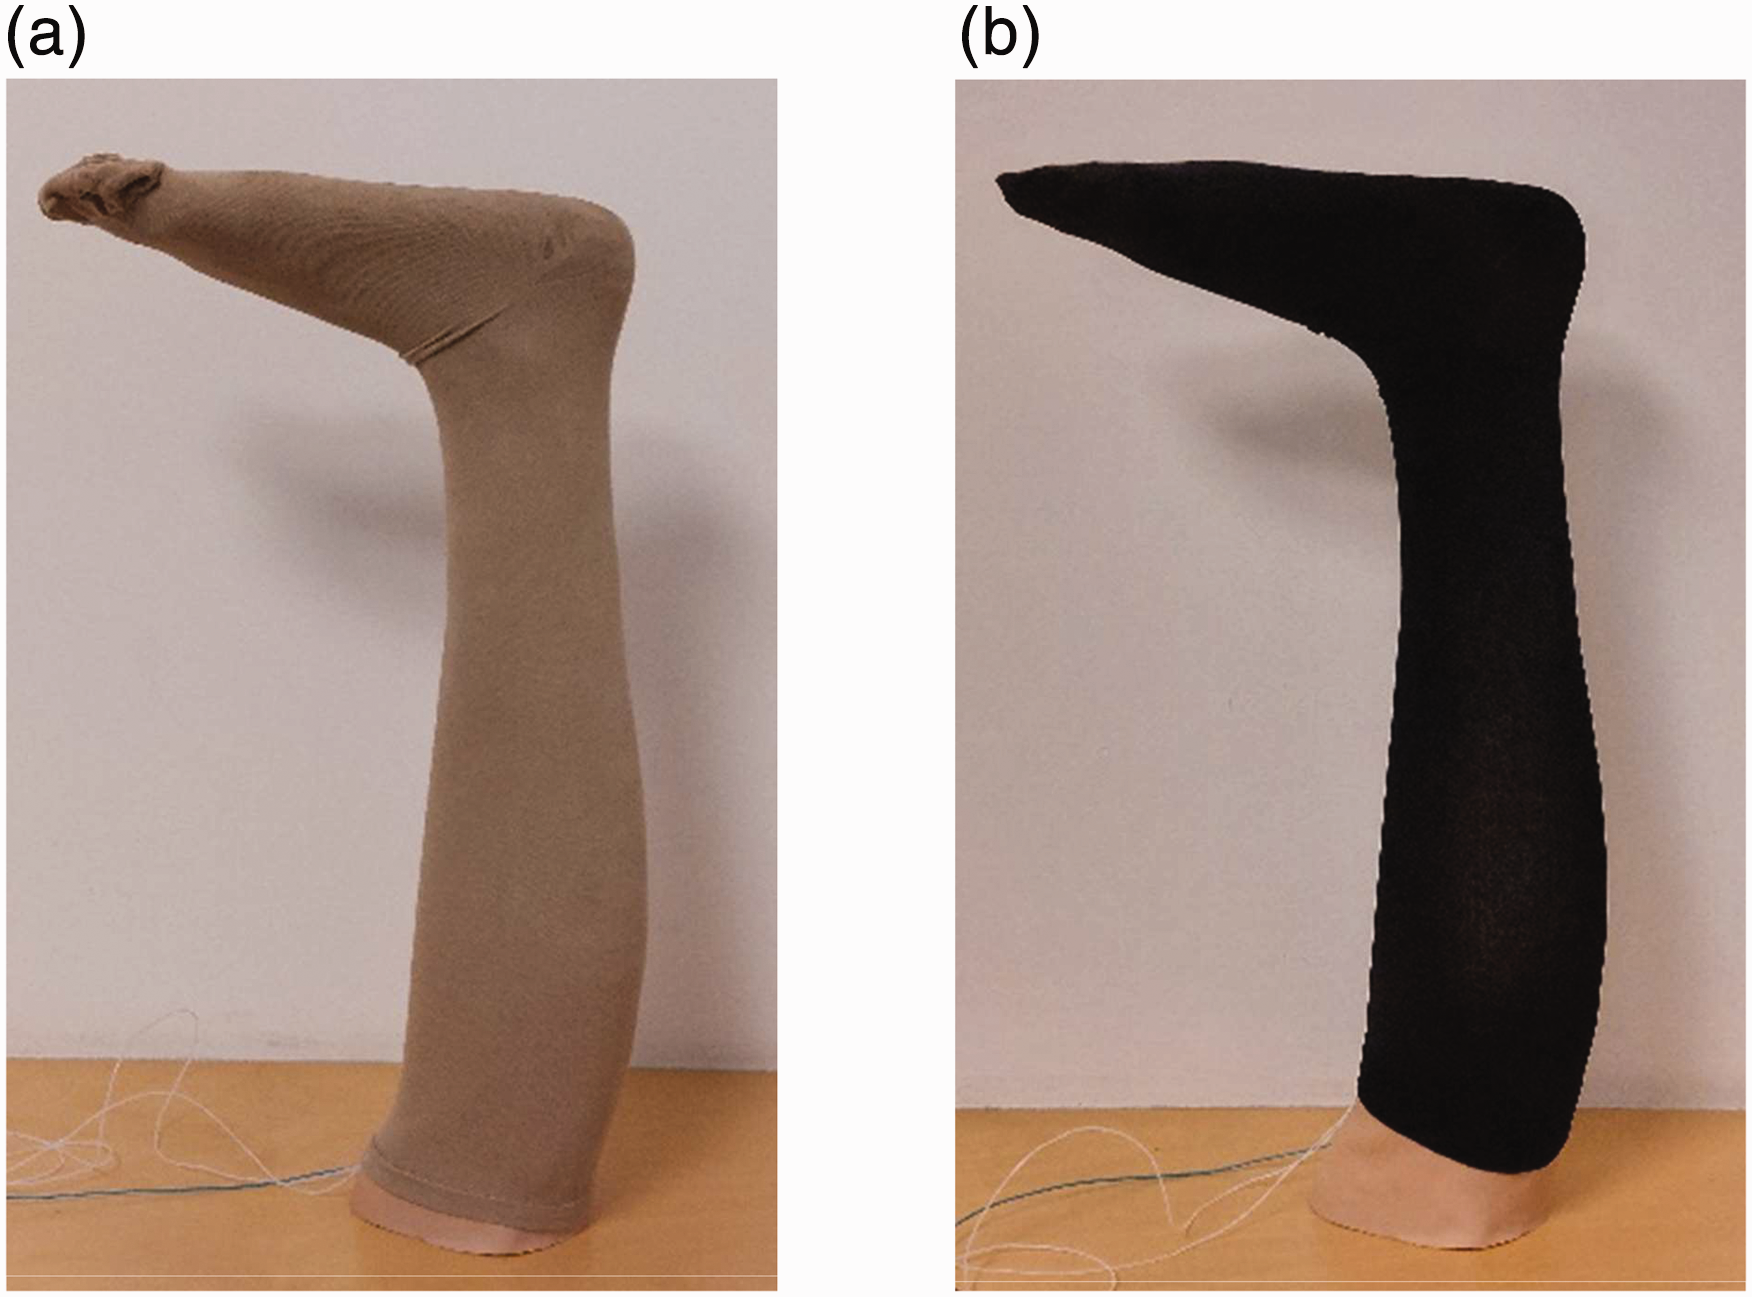
(a) Market sample A (Jobst, Sweden) and (b) Market sample B (Oapl, Australia).
Size specifications of stockings A and B
To customize a cost-effective pressure-measuring method for initial compression stocking development, a 3D-printed leg mannequin was developed with an ankle circumference of 21 cm and a calf circumference of 33.5 cm (Tables 3). The mannequin size was based on a female participant who is 161 cm tall, 51.3 kg weight, has 26.8% body fat and 68.7% muscle mass. The mannequin was 3D printed by Big Rep One printer with Polylactic Acid (PLA) and covered with a 1-mm-thick Pevalen™ prosthetic cover (Embreis, Sweden) (Figure 2). The rigid 3D-printed leg core simulates the human leg size and shape, while the prosthetic cover provides a smooth surface for the 3D-printed leg mannequin to avoid uneven surfaces interfering with the pressure measurement.
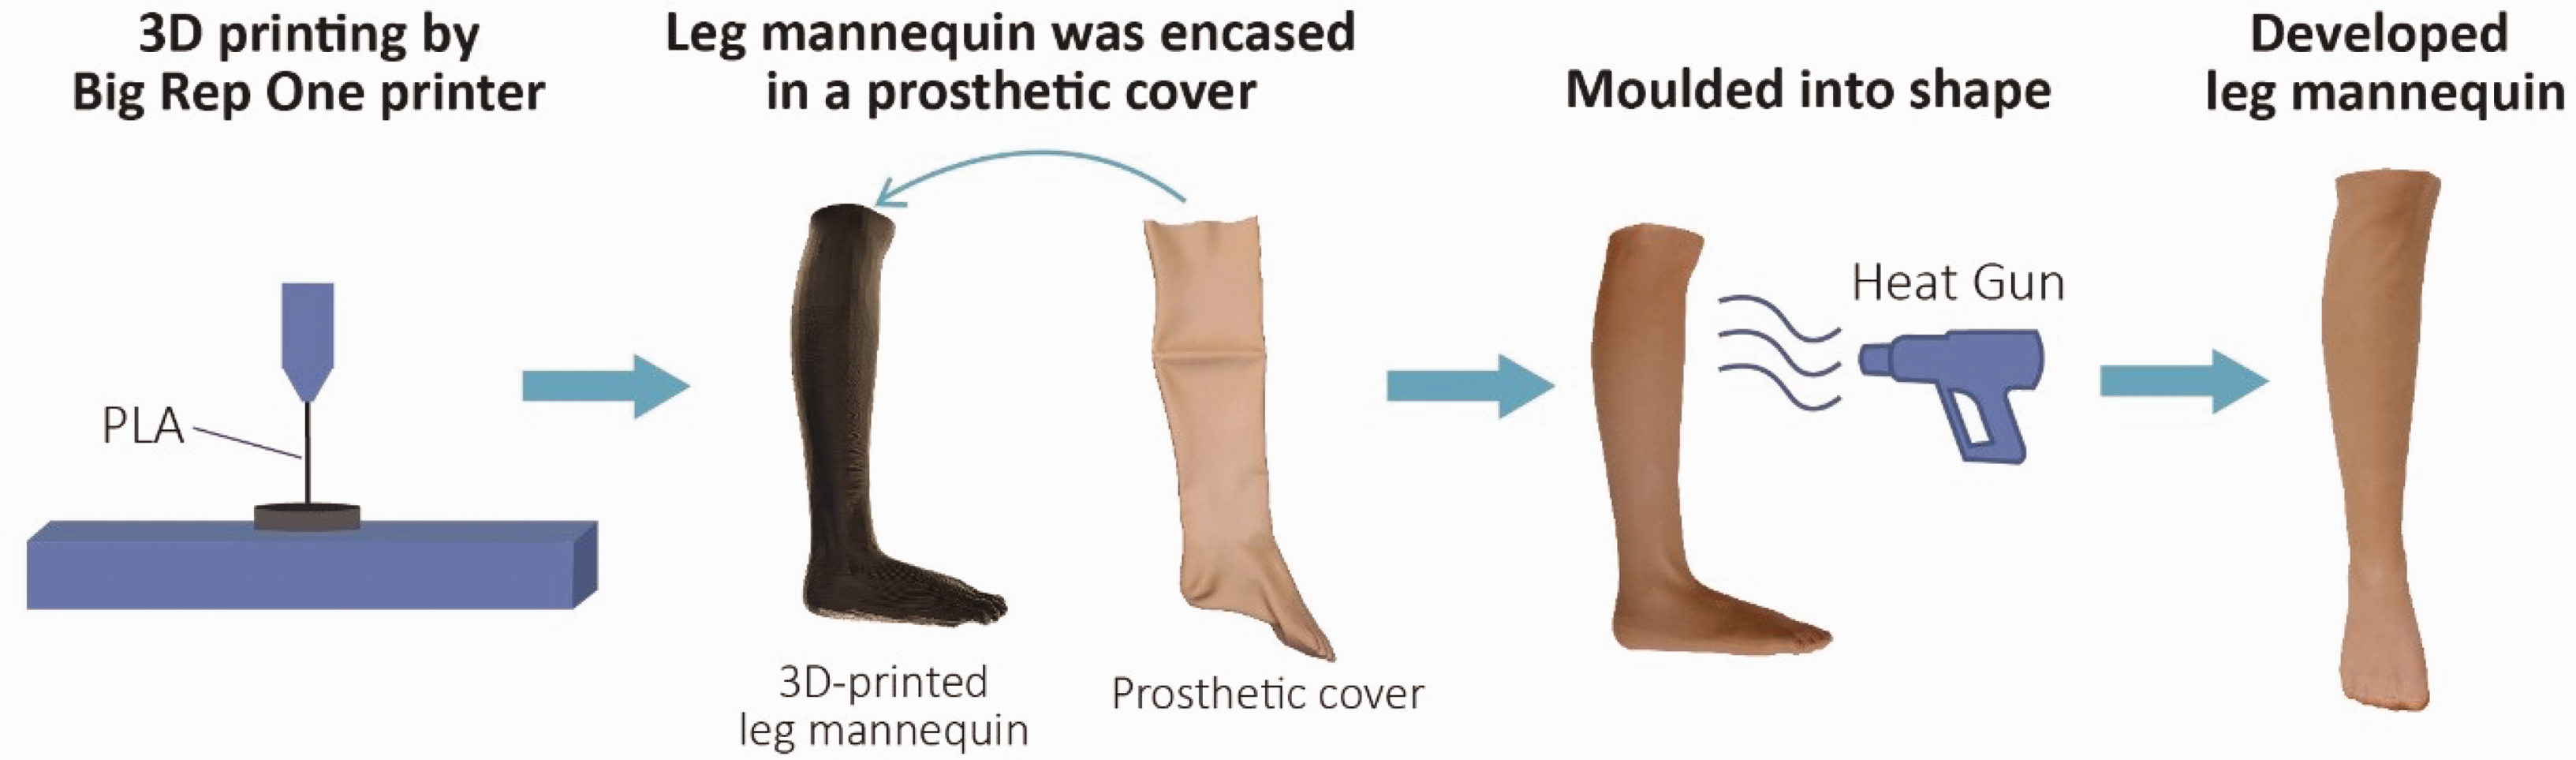
The development process of a 3D-printed leg mannequin
Measurement
Before the pressure measurement, the circumference and length of participants' legs in the supine position and leg mannequins were measured by hand with a soft ruler according to the Haddenham custom measurement instructions 34 (Figure 3). All the measurements were performed with the same researcher to eliminate interobserver variability. Then, participants were requested to wear two market samples in a sitting position with knee flexion of 90°. Air-pack sensors were placed at four measuring points of the medial of both legs in ankle (b), below calf (b1), calf (c), and below knee (d).22,25,35 In this study, pressure measurements were performed on both legs when wearing two stocking samples. The same method was applied to a 3D-printed leg mannequin in which the same air-pack sensors were placed on the medial of the leg mannequin before wearing stocking samples. Each condition was tested five times, and the mean value was obtained. All experiments were conducted at the standard laboratory conditions with a temperature of 23 ± 0.5°C and relative humidity of 65 ± 3%.
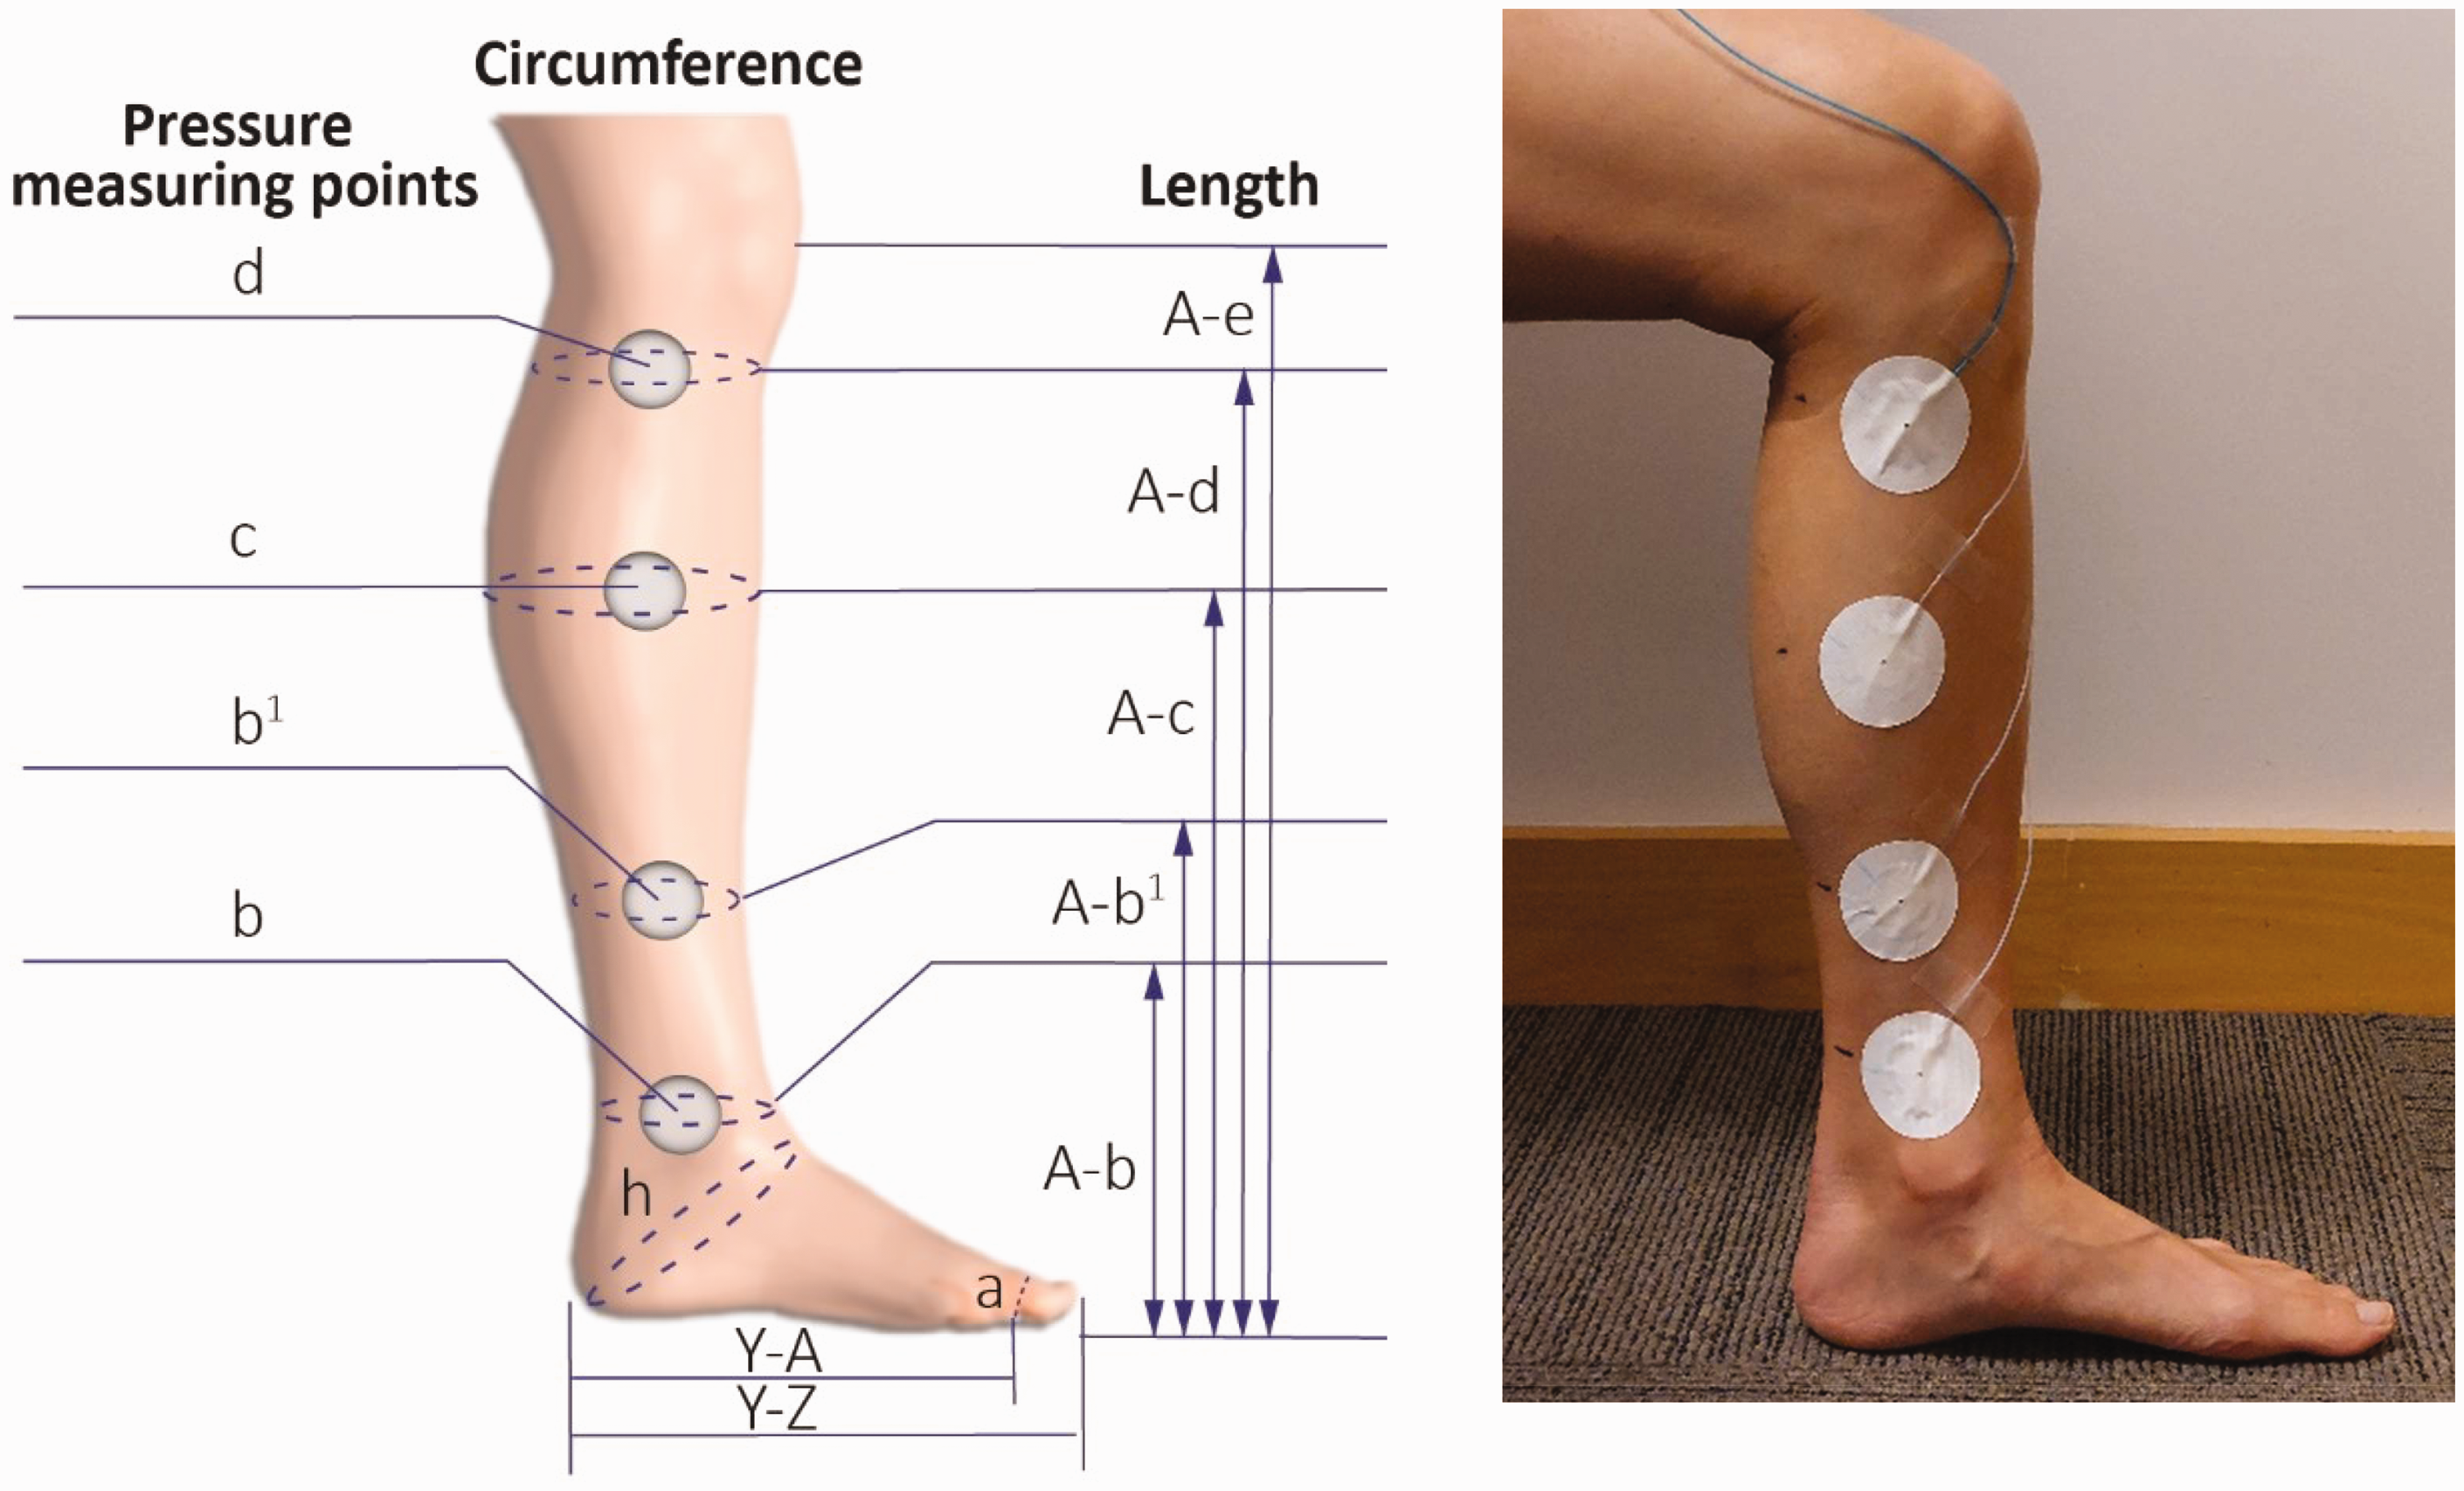
Measuring points of pressure and leg size.
Statistical analysis
The experiment data were analyzed using SPSS 23 (IBM Corp., Armonk, New York). An independent samples t-test was performed to identify the significant differences in pressure between participants' legs with recommended and unrecommended sizes, two market samples, and left and right legs. Pearson correlation and linear regression were conducted to examine the relationships between the dependent variable (pressure) and four independent variables: (1) body fat, (2) muscle mass, (3) bone percentage, and (4) BMI of the participants. To predict the pressure measured on the participants' legs by the developed leg mannequin, the Pearson correlation and linear regression analysis were conducted to examine the relationships between the pressure measured on the participants' legs and the developed mannequin at four measuring points. This exploratory study set the significance level at p ≤ .1 to detect potential trends.
Result and discussion
This study examined the pressure performance of two commercial compression stockings on the participants' legs with recommended and unrecommended sizes. Their pressure performance was then compared with the developed leg mannequin to predict the pressure on human legs. The details of the leg measurements, the pressure data on both the participants and the developed leg mannequin, and the cost of the developed leg mannequin are provided in Tables 3 –5 and illustrated in Figures 4 –8.
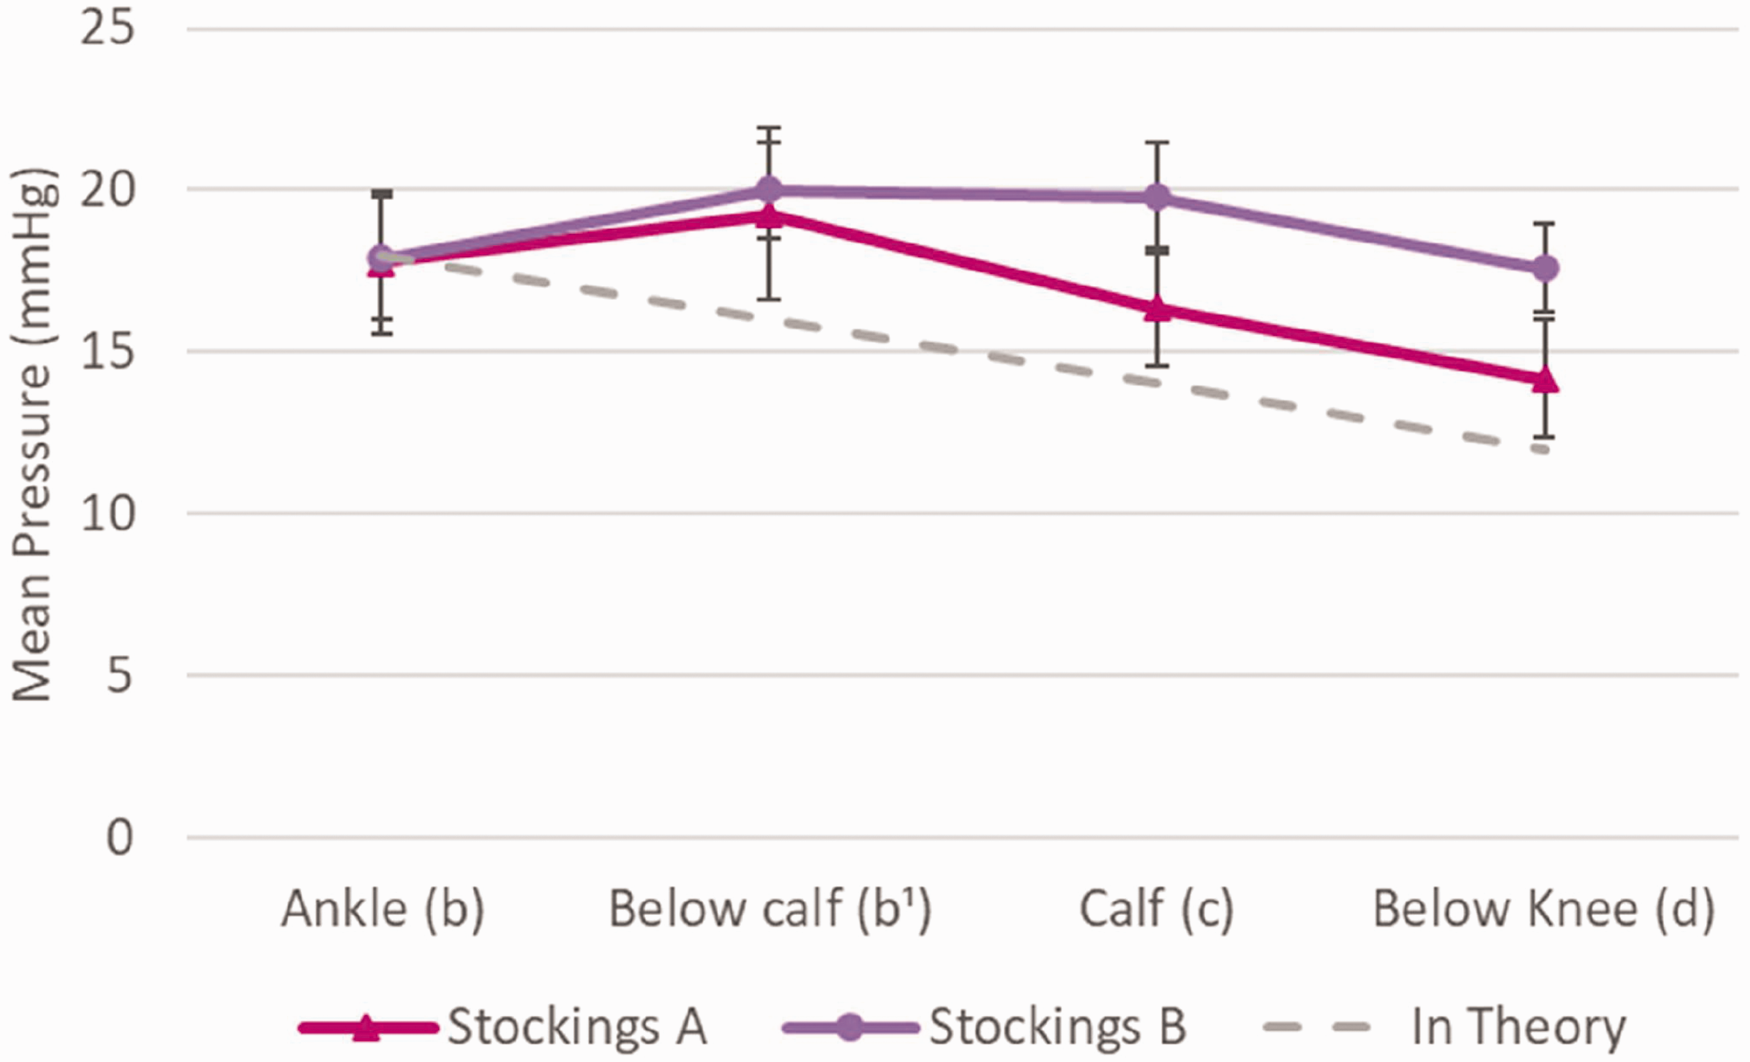
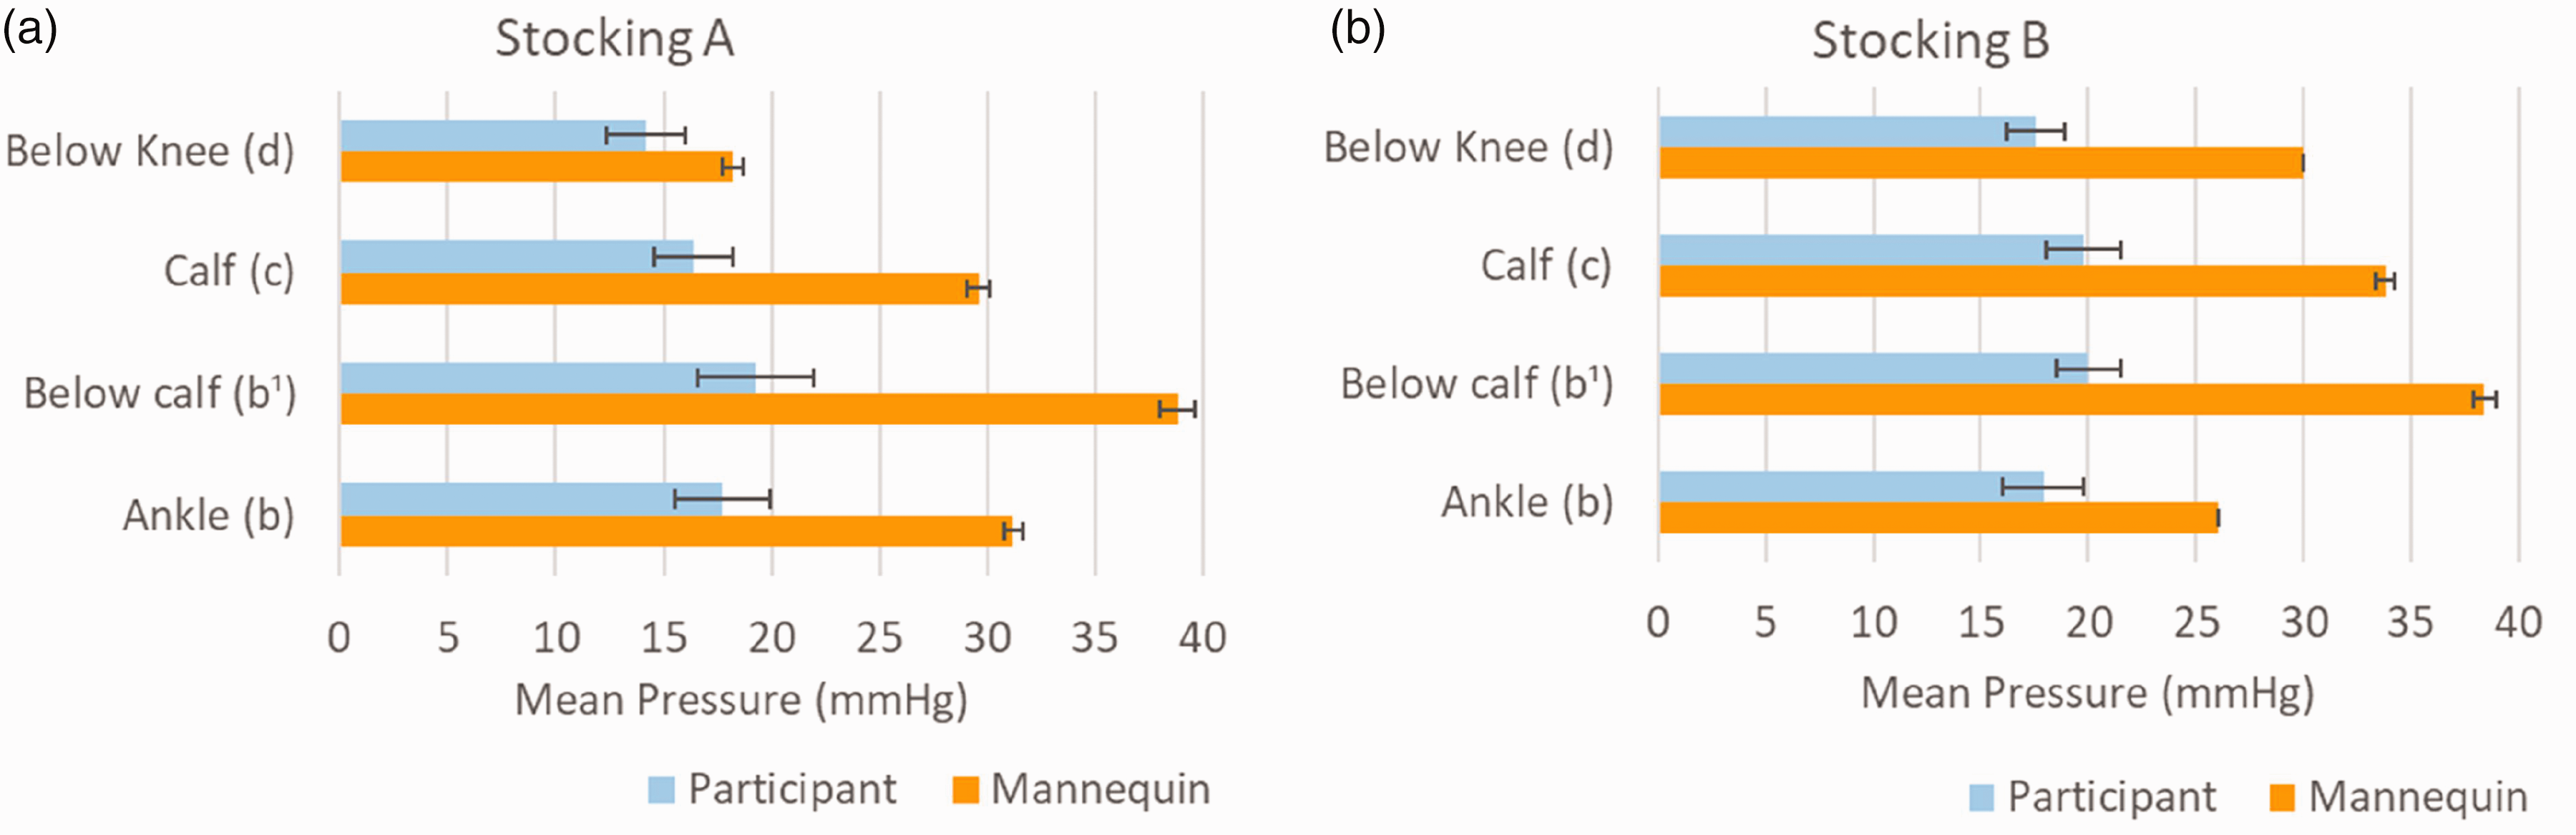
The pressure along the participant's leg with recommended leg sizes when wearing stocking A and B.
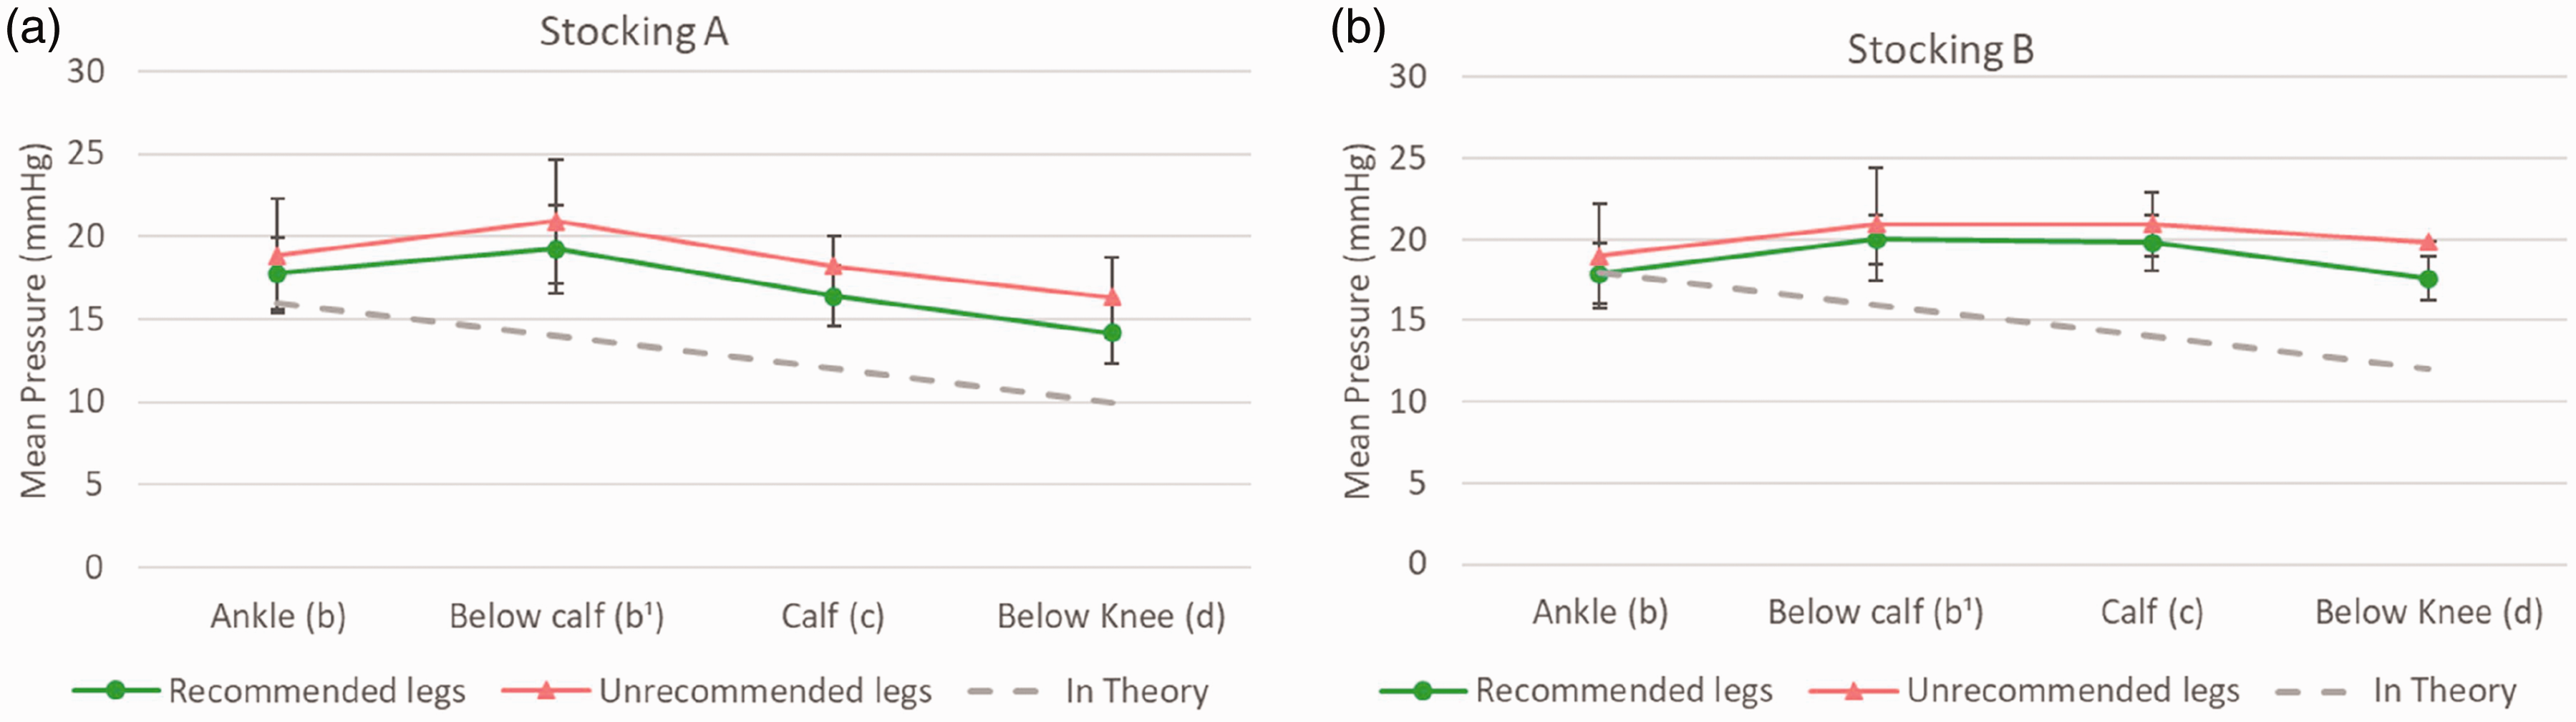
The pressure along the participant's leg with leg sizes within and exceeding supplier recommendations when wearing (a) stocking A and (b) stocking B.
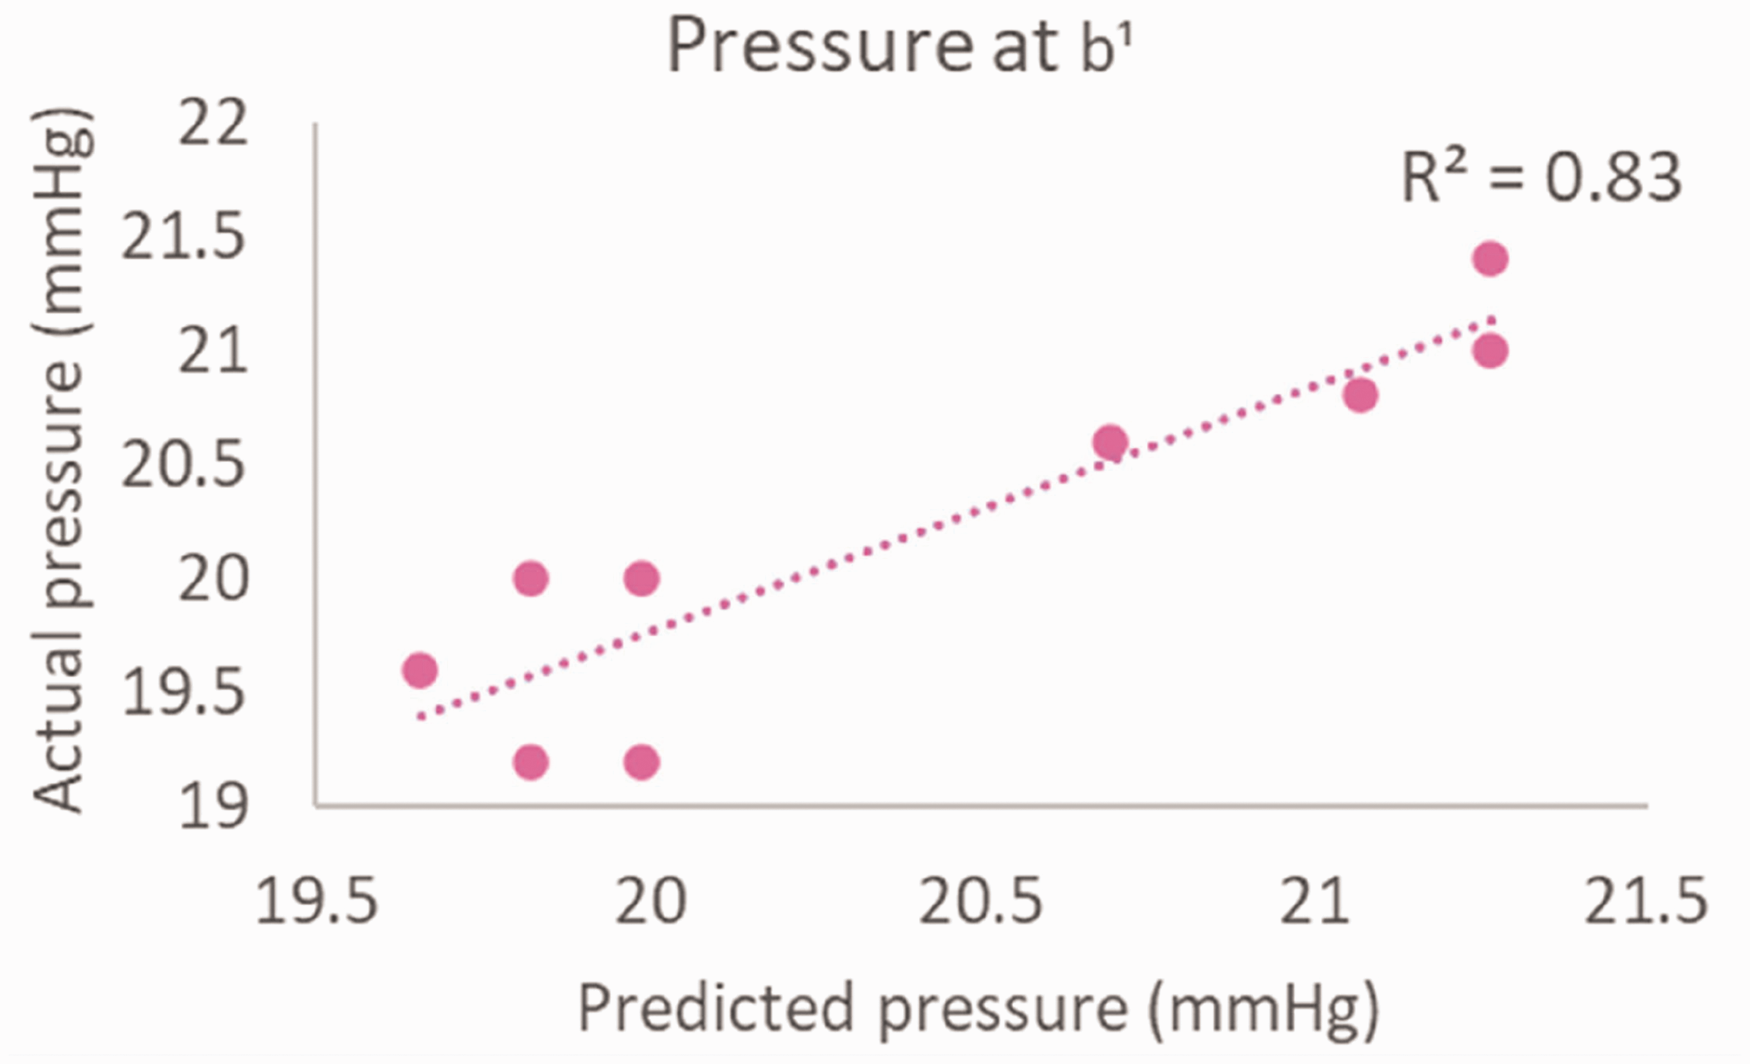
Bivariate scatterplot that exhibits the linear relationship between predicted and measured pressure at point b1 with the bone percentage of participants.
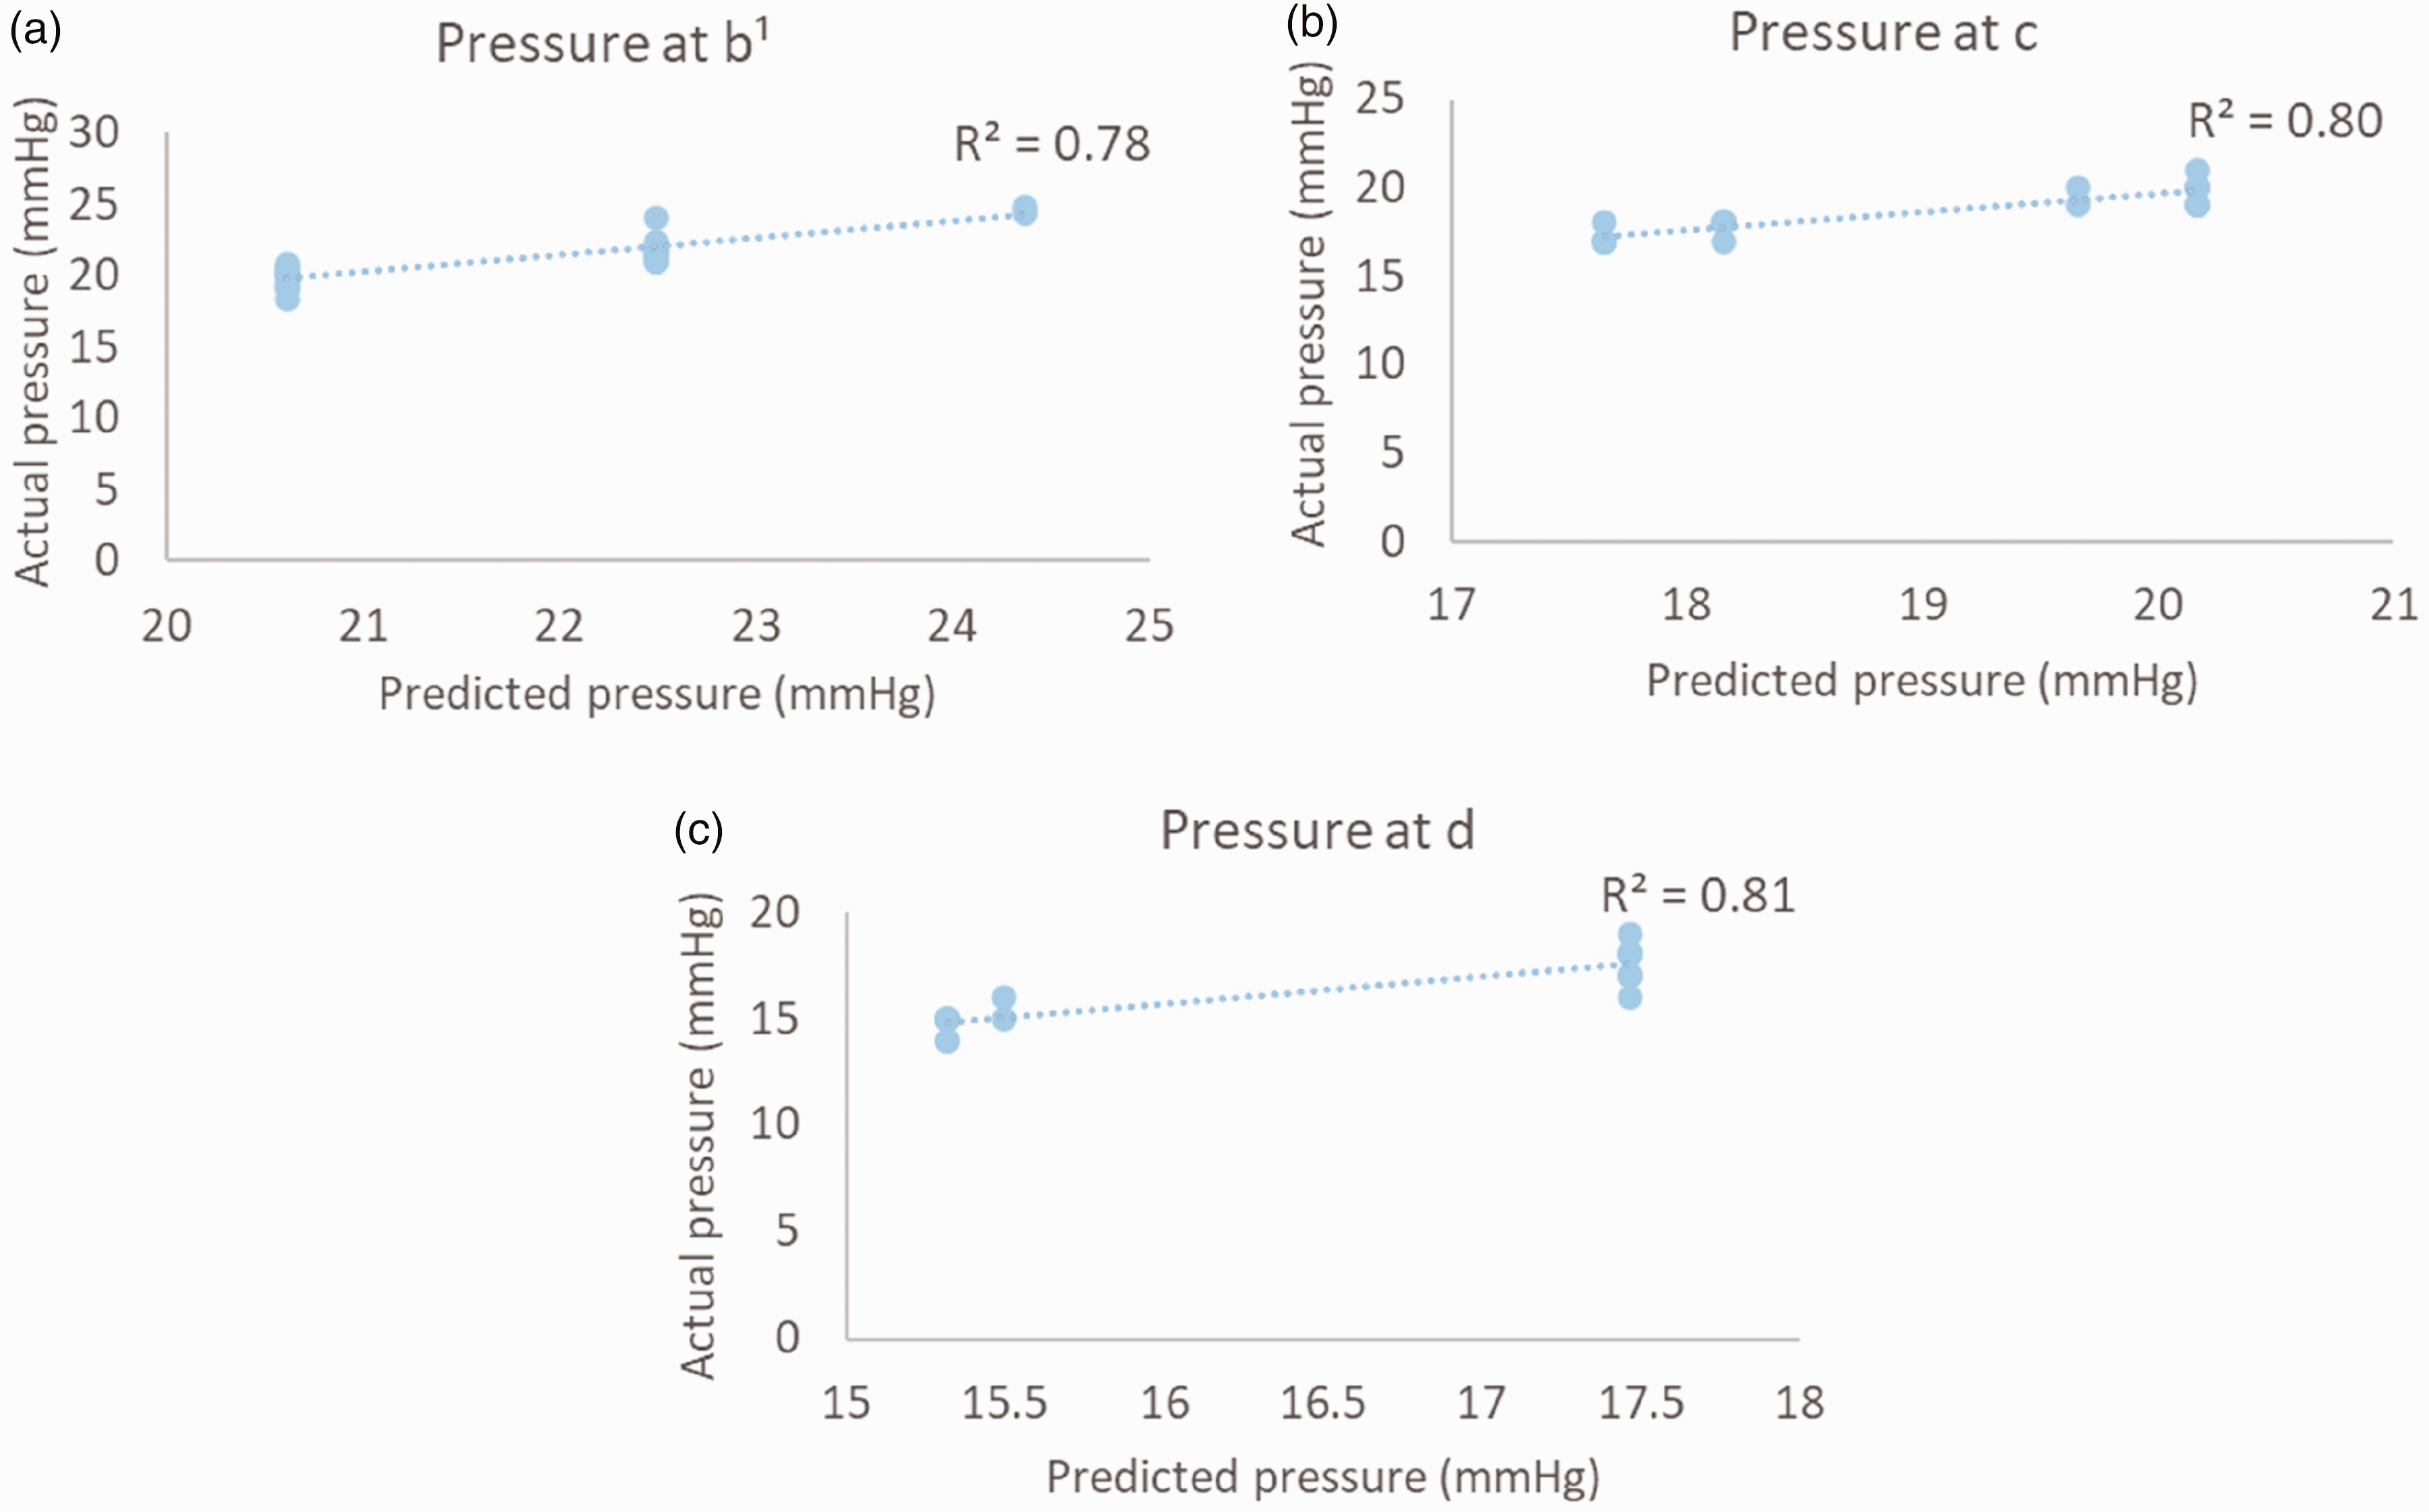
Bivariate scatterplot that exhibits the linear relationship between pressure predicted from the developed leg mannequin and measured on participants' legs at (a) below the calf, (b) calf, and (c) below the knee.
The pressure along the participant's leg and developed leg mannequin when wearing (a) market sample A and (b) market sample B.
Length and circumference (cm) of participants' legs and the developed leg mannequin
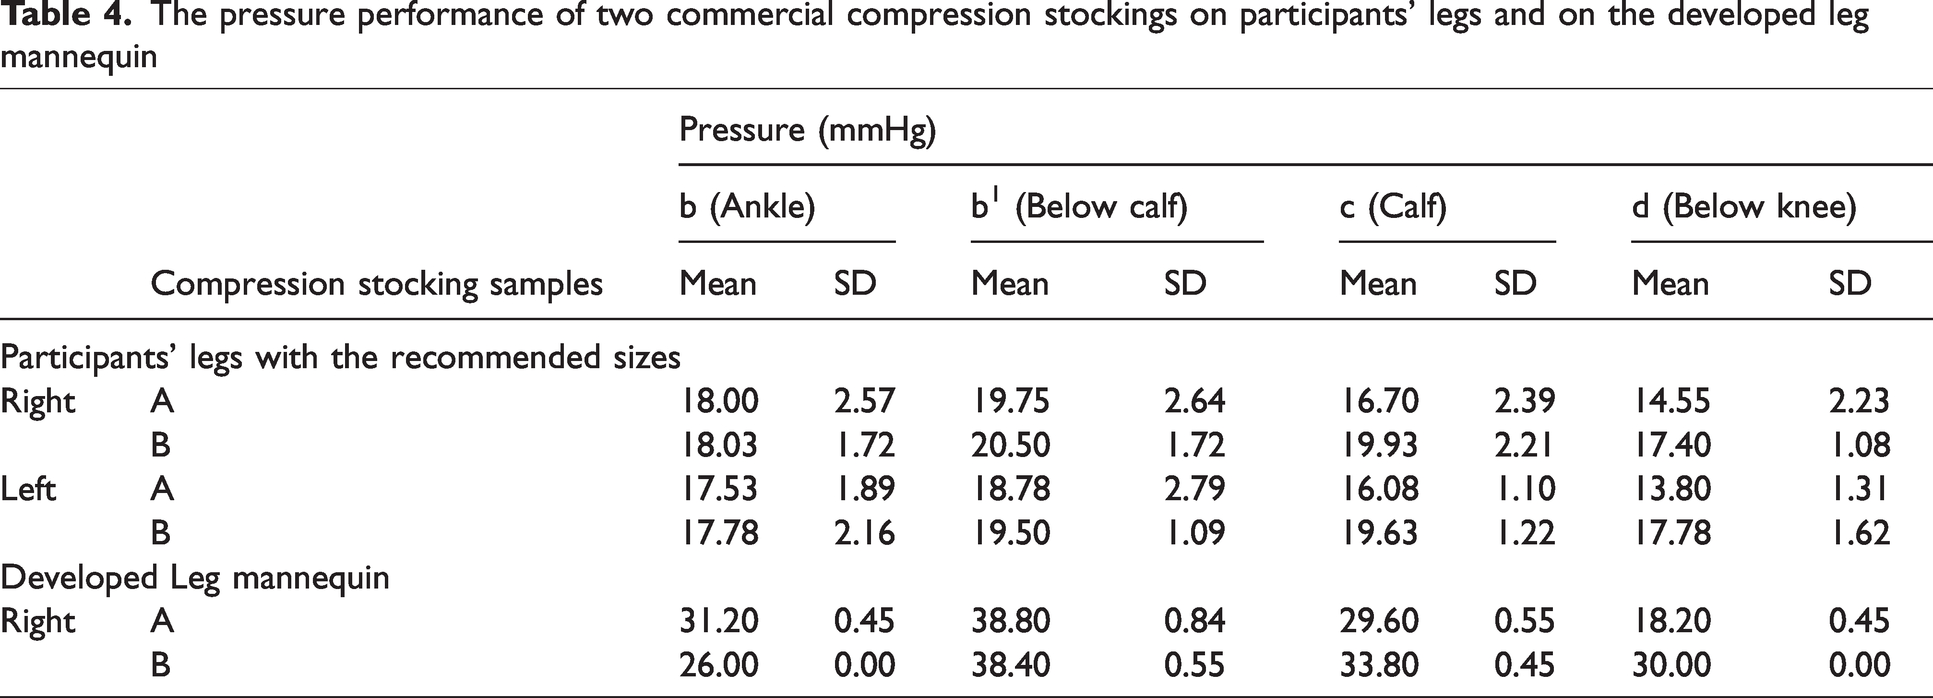
The pressure performance of two commercial compression stockings on participants' legs and on the developed leg mannequin
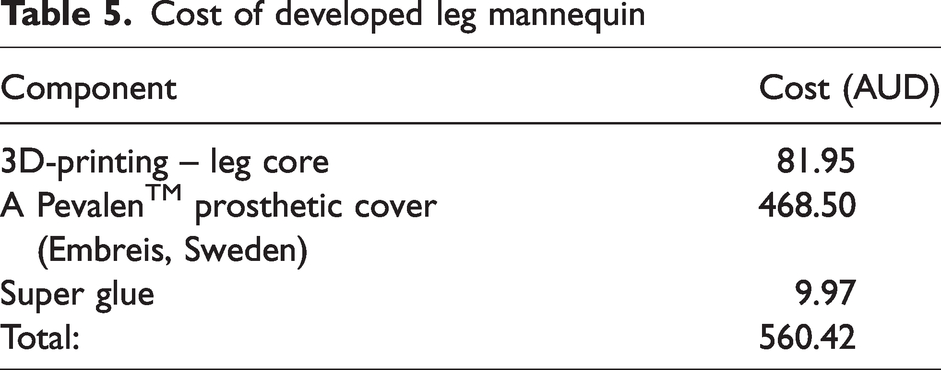
Cost of developed leg mannequin
Pressure performance on participants’ leg
Comparison of left and right legs
All stockings demonstrated similar pressure levels on participants' left and right legs (Table 4), with statistical analysis confirming that there was no significant difference in pressure between the two legs (p > 0.1). The results of similar pressure on both participants' legs indicate that wearers can wear compression stockings in pairs with the same pressure range as labeled, regardless of the minor size discrepancy between their left and right legs.
Impact of undersized stockings on pressure performance
When comparing the two stockings, the pressure measured at calf (c) (t58 = –6.10, p < 0.001) and below the knee (d) (t58 = –5.92, p < 0.001) had significant differences between stocking A with recommended size, and undersized stocking B. Interestingly, the two market samples had no significant pressure difference at the ankle (b) and below calf (b1). Overall, the pressure of stocking B was 3.07 mmHg higher at calf (c) and 3.46 mmHg higher at below knee (d) than the pressure of stocking A. As shown in Figure 4, both stockings failed to provide a theoretical pressure gradient with lower pressure at the ankle (b) than below the calf (b1). In stocking A, the highest pressure was applied below calf (b1) and gradually decreased toward below knee (d). On the other hand, market sample B had steady pressure along the leg from below calf (b1) to below knee (d). This result agrees with other studies22,24 that found many stockings failed to produce the optimal pressure gradient from the ankle to the calf. In the theoretical pressure mechanism of compression stockings, the highest pressure is applied at the ankle, then gradually decreases toward the knee to help boost blood circulation from the legs to the heart. 6 This may be attributed to the stockings being unfit for the human leg anatomical geometry. The lower pressure measured at the ankle (b) may be because the protruding medial malleolus and calf created a small air gap between the skin and stockings, thereby reducing the pressure measured by the sensor. It is noteworthy that using the ankle point as the reference point for indicating the compression class or pressure range from the stocking producers may be inaccurate in describing the pressure applied along the leg from the stockings. Instead, pressure data below the calf (b1) could be more reliable. 22
The pressure of undersized stocking B on four measuring points along both legs is higher than on stocking A. The pressure of undersized stocking B below calf (b1) and calf (c) was higher than the suggested range (14–18 mmHg) by the supplier. Besides, the pressure value on the ankle (b), below calf (b1), and calf (c) on stocking A were within the suggested pressure range of 15–20 mmHg on both legs (Figure 4). The improper pressure offered by the stockings will result in excessive heat, discomfort to the wearer, and even severe damage to health.1,14 Therefore, the wearer should follow the supplier's instructions when choosing the size of the compression stockings.
The two market samples have no significant pressure differences at ankle (b) and below calf (b1), which can be explained by the different widths of the stockings. The ankle (B) and below calf (C) width of stocking B is 6 mm and 11 mm wider than that of stocking A, respectively (Table 2). The larger width of the stockings at the ankle and below calf reduced the pressure exerted on the leg and minimized the pressure difference between stockings A and B. At the calf, stocking B exerted a significantly higher pressure than stocking A, which can be explained by the 9 mm smaller width at the calf (D) in stocking B. Also, the higher pressure of stocking B at below knee (d) appeared even though both stockings have the same width (E). This discrepancy may be related to the stiffness of the knitted textile in stocking B. When stocking B exhibits greater fabric stiffness, it can offer higher pressure when worn on the same wearer’s leg. The increased stiffness can be controlled by the lower elasticity in the yarn material and the shorter loop length. This indicates that stocking B is designed for smaller legs, whereas stocking A is intended for larger leg sizes.
Pressure performance with leg sizes exceeding supplier recommendations
Generally, the pressure at each measurement point on the legs with unrecommended size is higher than that of the recommended size (Figure 5). The independent t-test analysis revealed that the pressure at the ankle and below the calf has no significant difference between legs with recommended and unrecommended sizes in both stockings. When wearing stocking A, the pressure on the calf with unrecommended leg size was significantly higher than that of the legs with the recommended size (F = 0.02, p = 0.01), mainly due to the larger calf circumference of the wearer. However, there was no significant difference in stocking B. This shows that the knitted textiles in stocking B were not sensitive to minor changes in calf circumference. Furthermore, there was a significant pressure difference in the below knee region between participants with recommended and unrecommended sizes when wearing both types of stockings (A, F = 1.09, p = 0.01; B, F = 7.23, p = 0.01). This can be explained by both stockings being sensitive to the changes in leg circumference at the below knee region.
Both stockings had a similar pressure gradient on recommended and unrecommended sizes (Figure 5), indicating that the pressure gradient is unaffected when the leg size exceeds supplier recommendations. Generally, the pressure at each measurement point on the legs with the unrecommended size was higher than that of the recommended size. These results indicate that stocking wearers should ensure their leg circumference falls within the recommended range. Exceeding the range may lead to increased pressure beyond the values specified by the suppliers. For stocking B, the steady high pressure along the legs will reduce the efficacy of compression stockings, even when worn on legs within the recommended size. This pressure gradient may hinder the effectiveness of pushing blood back to the heart. Instead of facilitating upward blood flow, the high pressure experienced below the calf may cause blood to be pushed downward toward the ankle. The higher compression load also leads to more intense sweating and higher skin temperature, 36 which causes discomfort and skin irritation and lowers the wearer's compliance.
Relationship with body fat, muscle mass, bone percentage and BMI
The Pearson correlation results showed that pressure at the ankle (b) correlated with muscle mass (r = –0.72, p = 0.04), and pressure at and below calf (b1) had a significant correlation with bone percentage (r = –0.76, p = 0.03). The regression analysis revealed that only the bone percentage significantly predicted the pressure at point b1 (F = 10.77, p = 0.02) but not at other points and factors. With a β value of −8.01 (p = 0.02), the bone percentage accounted for 64% of the variance in the pressure at point b1. The result predicted by the regression equation is valid, as a comparison of the predicted and actual pressure yields R2 = 0.83 (Figure 6). The regression equation for the pressure at point b1 is as follows:

The pressure measured at the below-calf region (b1) can be predicted by bone percentage. It can be explained that a higher bone percentage increases the hardness of the below-calf region. At the same time, the other parts of the leg are not sensitive to the changes in bone percentage. This result may further support previous findings that the point below the calf is the most reliable when assessing the pressure of the compression device and is easily found by a simple clinical exam during the muscular contraction of the calf. 25 It also suggests that the stocking suppliers and testing organizations should consider using the point below the calf as the reference point for evaluating the pressure performance of compression stockings but not use the ankle point.
Prediction of pressure measured on human legs by the developed mannequin
This study found that the pressure measured on the developed 3D-printed leg mannequin can be used to predict the pressure performance on the participant's leg at below calf (b1), calf (c), below knee (d). The results from Pearson correlation analysis found that the pressure measured on the developed mannequin at below calf (b1) (r = 0.49, p = 0.08), calf (c) (r = 0.53, p = 0.05), and below knee (d) (r = 0.52, p = 0.06) have a significant correlation with the participant's leg, but not at ankle (b) (r = –0.31, p = 0.28). The linear regression analysis result revealed that the pressure measured on the developed mannequin was a significant predictor of the pressure measured on the participant's leg at points b1 (F = 3.81, p = 0.08), c (F = 4.57, p = 0.05), and d (F = 4.44, p = 0.06). Overall, the model explained almost 24% of the variance in the pressure measured on the participant's leg at points b1 (R = 0.49), 28% of the variance at c (R = 0.53), and 27% of the variance at d (R = 0.52). The regression equations for the pressure on participants' legs are as follows:


The result predicted by the regression equation is valid as a comparison of the pressure measured on the mannequin and participants' leg at b1 (R2 = 0.78), c (R2 = 0.80), and d (R2 = 0.81) (Figure 7). Partsch et al. found that the pressure measured on a wooden leg mannequin always shows the highest pressure value at the ankle. 22 Unlike this study, the developed mannequin shows a similar pressure gradient with the participants' legs in both market samples, in which the pressure at the below-calf region is the highest and gradually decreases toward the knee (Figure 8). This may be due to the similar shape of the leg mannequin to that of the human legs.
Generally, the pressure measured at each measurement point of the leg mannequin was higher than the pressure in the participants' legs. This can be attributed to the rigid 3D-printed core and the thin prosthetic cover with 1 mm thickness only. The depth of the soft tissue on human legs affects the pressure measurement. The higher measured pressure will be detected on a surface with a rigid texture. This is because the pressure sensor placed over the skin surface tends to sink into the soft tissues under the compression from stockings, resulting in a lower pressure. 24 Furthermore, this study's developed 3D-printed leg mannequin costs around AUD 560 (Table 5), whereas the wooden leg in the medical stocking tester (MST, Salzmann AG, St. Gallen, Switzerland) costs around AUD 5567. This shows that the developed 3D-printed leg mannequin can be a cost-effective option for evaluating pressure performance in the initial development stages of compression stockings and educational settings.
Suggested workflow and limitations of the 3D-printed mannequin for preliminary compression stocking pressure evaluation
The developed 3D-printed mannequin offers a practical method for replicating leg size and shape that can be used to predict the pressure gradation of compression stockings. To recreate the mannequin, a 3D scan of a human leg can be taken to capture the precise anatomical features, such as the leg circumference and length. The scanned images can be used to develop a digital model for 3D printing by Big Rep One printer with PLA and covered with a 1-mm-thick Pevalen™ prosthetic cover (Embreis, Sweden) in a selected size. Pressure sensors can be attached to the leg mannequin at four critical measuring points along the leg, such as the ankle (b), below calf (b1), calf (c), and the knee (d). The pressure exerted by the stocking can be measured and translated into corresponding pressures on a real human leg using mathematical equations presented in this study. This approach provides a systematic, cost-effective and reproducible way to evaluate compression stocking performance across different leg geometries, enabling researchers and designers to adjust the stocking design to achieve the desired pressure distribution in clinical and commercial applications.
The findings from this research provide a foundational understanding of how compression stockings interact with varying sizes of leg, body fat, muscle mass, bone percentage, and BMI. This is crucial for informing the second stage of the study, enabling more targeted research to optimize the stocking design. A limitation of this study is that it was conducted under controlled conditions with healthy participants, which may limit the generalizability of our findings to individuals with DVT. As the significance level of p ≤ 0.1 was employed to capture meaningful trends in this preliminary research, future studies involving larger participant groups with different gender and health conditions will be essential for further validating and expanding upon these findings. The development of personalized and made-to-order compression solutions may improve sustainability, patient outcomes, and product efficacy. Additionally, the developed leg mannequin does not fully replicate the softness of human muscles, particularly across different parts of the leg. Future improvements to the mannequin's design, such as the potential of incorporating varied softness and embedded pressure sensors in the leg mannequin, are necessary to enhance the accuracy and functionality of pressure prediction.
Conclusion
Compression textiles are widely applied in sports, healthcare and medical areas. However, challenges appeared in designing the graduated compression stockings due to the lack of systematic studies on leg geometry and the complex pressure-measuring process. The study investigated the pressure performance of two commercial compression stockings on 15 participants. Based on the results, the following conclusions can be drawn.
No significant difference in pressure between the left and right legs has been found. This indicates that wearers can wear compression stockings in pairs with the same pressure range as labeled. Both compression stockings failed to provide the theoretical pressure gradient in which the highest pressure was found at b1 (below calf). This may be due to the stocking's designs fail to fit with the human leg geometry. Wearing undersized stockings and wearing with inappropriate leg size can lead to unexpectedly high pressure on the legs. Stocking wearers should ensure that their legs and selected stocking sizes align with the supplier’s recommendations to avoid experiencing pressure higher than suggested. The relationships between pressure performance and body fat, muscle mass, bone percentage, and BMI were investigated, and the results showed that only the pressure measured at below calf (b1) can be predicted by bone percentage. A higher bone percentage increases the hardness of the below-calf region and measured pressure. This study confirmed that the pressure point at b1 (below calf) is probably a more reliable reference point than the ankle point for pressure evaluation of compression stockings. For the developed 3D-printed leg mannequin, the linear regression analysis result revealed that the pressure measured on the developed mannequin was a significant predictor of the pressure measured on the participant's leg at below calf (b1), calf (c), and below knee (d), but not the ankle. Generally, the pressure measured at each measurement point of the leg mannequin was higher than the pressure in the participants' legs. This can be attributed to the rigid 3D-printed core and the thin prosthetic cover with only 1 mm thickness. The higher depth of the soft tissue on human legs results in lower pressure as the pressure sensor tends to sink into the soft tissues under compression from stockings. A cost-effective 3D-printed leg mannequin was developed at only 10% of the cost of the commercial wooden leg in the medical stocking tester. It can evaluate pressure performance in the initial development stages of compression stockings and educational settings.
Footnotes
Acknowledgment
The authors thank the University of Technology Sydney and the Faculty of Design, Architecture and Building for supporting this project.
Declaration of competing interest
The author(s) declared no potential conflicts of interest with respect to the research, authorship, and/or publication of this article.
Funding
The author(s) disclosed receipt of the following financial support for the research, authorship, and/or publication of this article: This project was supported by the University of Technology Sydney under the 2023 UTS Collaboration Scheme (Project code: PRO23-17450) and the Faculty of Design, Architecture and Building (DAB) under the 2023 DAB Research Support Scheme.