
Abstract
Currently, methods for evaluating the performance of woven filter media used for filtration processes are mainly reduced to air permeability and filtration resistance. However, filtration processes are not limited to dry filtration only. Moreover, critical performance-related factors such as the pore size distribution and liquid permeability are studied but often omitted and ignored in the characterization process. The present study aims to investigate and analyze three characteristics, namely air and liquid permeability and pore size distribution, and to examine correlations between the studied characteristics. The results of the present study show that correlations between the studied characteristics do exist. Polynomial and exponential functions could describe the correlation between the mean flow pore diameter and permeability. At the same time, the dependency between air and water permeability is characterized by a logarithmic function. Consequently, the characterization and selection of filter cloths should be done by analyzing several different parameters simultaneously. These correlations could become the basis of a system of media indexing in the future.
A filter medium is one of the critical elements of any filter. Even the most ingenious filter will be useless and fail without an adequate filter medium.1 –3 In the early stages of filter cake formation, a filter medium plays a central role and it is essential for particle retention both in cake filtration as well as in polishing filtration.2,4 Therefore, the selection of a filter medium is essential in determining the outcome of a filtration process.
A filter medium is defined as any material that is under the operation conditions of a filter, permeable for one or more components of a filtration solution (usually fluid or solvent), and is impermeable to the remaining components (solids, droplets of liquid, colloidal material, etc.). The woven filter medium, made of fibres or filaments of natural or synthetic material, is one of the most frequently used media in solid–liquid separation processes and makes up the most significant component of the media marketplace.2,4
Currently, woven filter media assessment is reduced to the analysis of air permeability, and in some rare occasions, filtration resistance or pressure drop.2,3 Air permeability, undoubtedly, is a very important characteristic that can be used to predict the behavior of the filter cloth in dry filtration processes. However, using only air permeability might lead to erroneous conclusions for wet filtration processes, in which water or other liquids form the fluid phase. Although air and water are fluids, their physical properties are different. Air is a compressible fluid, while water is incompressible. In addition to these factors, important characteristics, such as pore size and pore size distribution, are often omitted in the woven filter media characterization practice. In his work, Orr 5 has stated that the test procedures aimed to characterize filter media with respect to filtration-specific properties should include the measurement of permeability, the resistance to fluid flow and the pore size of the medium. Orr 5 has pointed out that these three characteristics should be the criteria by which the filter medium is evaluated. The present study aims to add to the work of Orr 5 by evaluating if standard characterization routines should be extended to include water permeability and the pore size distribution.
Undoubtedly, the permeability of the filter medium is an important characteristic that influences the capacity and power requirements of a filtration process. Permeability is a predictor of the fluid flow rate in the early stages of filtration, and those initial flow rates, in turn, influence the structure of the filter cake. At the same time, the size and shape of the pores in the medium determine the extent of separation of the components.3,5 Permeability, a parameter that characterizes the macroscopic conductivity of a porous media to transmit fluids,6,7 has two concepts. The first is intrinsic permeability, a constant for a given material or a porous structure, which depends only on the porous structure and not on fluid chemistry and flow mechanism; this has units of m2. Another term is hydraulic conductivity, which is related to the porous structure, properties of a fluid, and flow mechanism. This has units with dimensions of length per time or speed, for example, m/s, cm/day, or ft/day.6,8 Purchas and Sutherland 2 stated that the most common form of filter medium permeability was by characterizing it in terms of the flow rate of a specified fluid (usually air) per unit area.
Although air and water are two commonly used fluids for measuring permeability, oil and a number of other liquids can also be used. 2 Air permeability represents the volume of air that can pass through a specified area of a filter cloth under a predetermined pressure drop. This is a well-studied characteristic and has a standard 9 that describes its measurement procedure. As mentioned previously, most filter media manufacturers report the permeability results by using only air flow data.2,3,8 This is potentially due to the lack of standard and standardized equipment for measuring the water permeability of woven filter media. An analogous problem exists for rock filter media. 8 Filtration processes are not limited to air filtration. Numerous studies3,6,8,10 –14 have shown that water permeability differs from air permeability, and it is usually much lower. The researchers of these studies6,11 –13 explained this difference mainly by a slippage effect proposed and this was explained in detail by Klinkenberg. 14 However, other reasons were also mentioned,10,11,13 such as aeration of water, rehydration, dissolution, migration of fine elements, and the possible influence of physicochemical surface effects. Scheidegger 11 has mentioned that air permeability increases with gas pressure, while water permeability changes with time when water passes through cement. Interestingly, in their work, Rideal et al. 15 have found a close agreement between air and water permeability results for metal woven meshes.
Pore size distribution is another crucial characteristic of any porous material as it has a significant effect on the processes initiated on the surface of the medium and continued within the material. Depending on the material and application, these processes can be, for example, the flow of air or liquid, the retention of solids on the surface or in the pores, and the transportation or reaction of chemicals. Various permanent structural changes caused by compression, swelling, and destruction may be detected by measuring the pore size distribution. 16 Pore size distribution provides more detailed information about the complexity of the structure than, for example, overall porosity. In addition, this parameter describes the through pores, which are responsible for the passing flow, and this makes the pore size distribution more valuable in the study of filtration processes. However, pore size distribution is rarely reported by woven filter media manufacturers. 17 Measurement of the pore size distribution can be carried out using various methods, including mercury porosimetry, 18 flow porometry,19,20 and gas adsorption, as described in standard BS ISO 15901-3. 21
Although the fluid mechanics through porous beds are relatively well known and equations for permeability exist, standardized methods for measuring the liquid permeability of filter media do not. Perhaps this is one of the reasons why water permeability is excluded from characterization by many woven filter media manufacturers. Another central parameter, the pore size (distribution), is well understood in membrane filtration. However, this characteristic is rarely studied and discussed for woven filter media, whose properties obviously differ from membranes. At the same time, the inclusion of this characteristic in woven filter media characterization might provide valuable insights regarding the actual filtration performance. An analysis of literature data has showed that most works devoted to woven materials consider air permeability the most essential and fundamental parameter for estimating cloth performance.2,3,8 During filtration, the initial flow rate of a fluid, which is often not air, is determined by the pore structure of the cloth filter medium. As Zhai and colleagues22,23 have stated, the multi-fluid flow processes are governed by geometrical pore space characteristics. This structure has several different structural parameters and characteristics influencing the performance of the woven cloth.
The current practice to characterize woven filter media for wet filtration suffers from some central performance characteristics, such as water permeability and pore size (distribution), still being poorly understood. Therefore, the aim of the present study was to perform a comprehensive characterization of filter cloths by analyzing three different aspects of woven filter media, such as air and liquid permeability and pore size distribution, and to investigate whether simple correlations exist between these different characteristics. Although a literature survey demonstrated that there has been an attempt to find these correlations for woven filter media by Rideal et al., 15 empirical equations between pore size distribution, air, and water permeability were not presented and discussed in detail. Such equations are of great practical importance because they can be used to obtain information about several characteristics at once and, at the same time, avoid additional tests that involve expenditure on expensive equipment and labour. In addition, most scientific work on a similar topic6,7,12,13,24,25 investigated these relationships for asphalt, concrete, limestones, mortar, clays, etc. For example, Zhai et al. 22 have reported that pore geometry and size distribution were the main factors determining the functional relationships between fluid saturation and air and water permeability of soil. However, the properties of the materials mentioned previously drastically differ from woven filter media. Therefore, investigating the performance-related characteristics of woven filter media and finding the correlations between them are of particular interest and the core of the present study.
Materials and methods
Materials
For the present study, samples of woven filter media were selected to provide a variety of structural parameters similar to any real cloth selection case. Nine woven filter media samples were provided and used in this study, the yarns of which were made of polypropylene. Six cloths were manufactured from monofilament yarns, and the remaining three cloths were fabricated from a mixture of monofilament and multifilament yarns. All samples, except cloth 6, were calendered. However, woven filter media manufacturers did not provide additional information about the method and conditions of this surface treatment nor the structural parameters for the studied cloths.
Scanning electron microscopy
Scanning electron microscopy (SEM) was used to identify the structural parameters of the studied samples, such as the weave design, the yarn diameter, the warp and weft density, and the cloth thickness. The SEM images were taken with a JEOL JSM-5800 scanning electron microscope with a BE/C detector. First, the samples were gold coated with an Edwards Scancoat Six sputter coater to increase electrical conductivity; the acceleration voltage was 15 kV. The diameter of the yarns was defined as the longest distance between two pores located on opposite boundaries of the fibre. The warp and weft densities were determined by calculating the number of yarns per 3 mm in each direction and then scaled up. Warp density was then presented in ends/10 cm, while weft density was in picks/10 cm. These parameters and units are typical in textile research.
Pore size distribution measurement
Capillary flow porometry was selected to measure and investigate the pore size distribution of woven filter media. For this purpose, the Porous Materials Inc. (PMI) advanced capillary flow porometer was used. This equipment uses a liquid displacement technique to measure the pore size distribution and is based on two flow curves: the dry curve and the wet curve. The dry curve is generated with a dry sample after which the sample is wetted with a wetting liquid, and the wet curve is generated by repeating the same measurement procedure. In the dry and wet tests, the equipment measures the flow rate and pressure used. The largest through pore-throat diameter, or in other words the largest of the most constricted pore diameters, can be found at the bubble point pressure. The pore diameter was calculated using

According to the ASTM F316-03 standard, 26 the wetting liquid must completely wet the sample, providing a zero-contact angle. In the present study, the contact angle between the polypropylene material (PP) and a wetting liquid was measured using an Attension Theta Optical Tensiometer, Biolin Scientific AB. Silwick, provided by PMI Inc., was used as the wetting liquid. Using a micro syringe, 3 µL of Silwick was placed on a nonporous PP sample. This droplet test was repeated five times, and the arithmetic mean of these measurements was used as the final result. The results confirmed that Silwick provided a zero-contact angle with the PP surface. Therefore, this wetting liquid satisfied the conditions described in the ASTM F316-03 standard 26 and was further used to determine the pore size distribution by the PMI porometer. The surface tension of Silwick was 0.0201 N/m.
Before the actual measurement, a cloth sample was wetted with the wetting liquid and placed under a vacuum for half an hour. Following this, the wetted piece was inserted into the chamber of the capillary flow porometer, the chamber was sealed, and the analysis was started. The pressure of the gas was increased gradually and continuously. When the pressure overcame the capillary pressure of the liquid in the largest pores, the liquid left the pores. Increasing the pressure further facilitated gas passage through the smaller pores until all the pores were emptied, and the airflow through the wetted sample was equal to the flow through a dry sample.
Tortuosity and the cross-sectional shape of a pore are complex parameters to determine and measure because they are individual to each pore in a sample. Moreover, there is currently no scientifically useful and generic enough information on tortuosity and pore shape to be used for textile materials. Nevertheless, equation (1) satisfies ASTM F316-03 standard conditions. 26 As all the cloths were made of the same material and the same technique was used, the same systematic error would exist in all analyses.
The following settings were used for the measurement: the F/PT factor was set to 100, the bubble flow was 2.4 cm3/min, the minimum number of counts for each incremental opening of the flow regulator was five counts, and for the pressure regulator, there were 0.3 counts. The diameter of the circular measuring area was 16 mm. The pore size distributions were measured using a pressure range from 0 to 0.5 bar, which means that the minimum pore diameter covered by this set-up was 5.2 µm. The test was performed on all nine types of cloth samples – each sample was analyzed three times, and the average value of three measurements was used as a result. Thus, four analyses were made for each selected material. As a result, an averaged pore size distribution for each cloth could be obtained.
The raw fluid flow and pressure data were collected with a PMI advanced capillary flow porometer and processed separately in Excel.
Air permeability measurement
Using a Textest FX 3300 air permeability tester, the air permeability of the cloths in m3/(m2 min) was measured according to the method specified by standard SFS-EN ISO 9237. The tests were performed at a constant pressure drop of 200 Pa, and the surface area of the samples was 20 cm2. For each of the nine cloths, the air permeability measurement was repeated three times. Thus, a total of 27 measurements were done. The average of the replicates is presented in this paper.
As mentioned previously, the Textest FX 3300 equipment working according to the standard 9 measured the air permeability only at a single and low pressure of 200 Pa. Such conditions do not make it possible to analyze the pressure influence on the air permeability of woven filter media. In contrast, the PMI equipment could use a differential pressure of up to 6 bar. In the present study, the air permeability was measured at a 0.1 to 0.5 bar pressure to make it comparable with the liquid permeability. Therefore, the dry curve obtained with the PMI advanced capillary flow porometer was used and analyzed to investigate the air permeability of the studied samples at different pressure ranges. The flow rate data of the dry curve in l/min was further used to calculate the air permeability in m3/(m2 min).
Liquid permeability measurement
The water permeability was measured using equipment specially designed and developed at LUT University, Finland. This device worked under declining pressure starting from 0.5 to 0 bar pressure. Approximately 400 kg of reverse osmosis water passed through a sample at the declining pressure, and the computer recorded the values of pressure, the mass of flowing water, and time. Before each test, the temperature of the testing water was measured with a thermometer. Then the recorded values were processed, and the water permeability was calculated manually in m3/m2 h bar. Three measurements for each sample were performed, and the arithmetic means were used as a result.
The equipment consisted of a 5 m pipe, a sample holder with a diameter of a testing area of 40 mm, a pressure meter, a pump, a scale, a feed tank, a computer, and a filter for keeping clean water in the system. The schematic view of this equipment is shown in Figure 1.
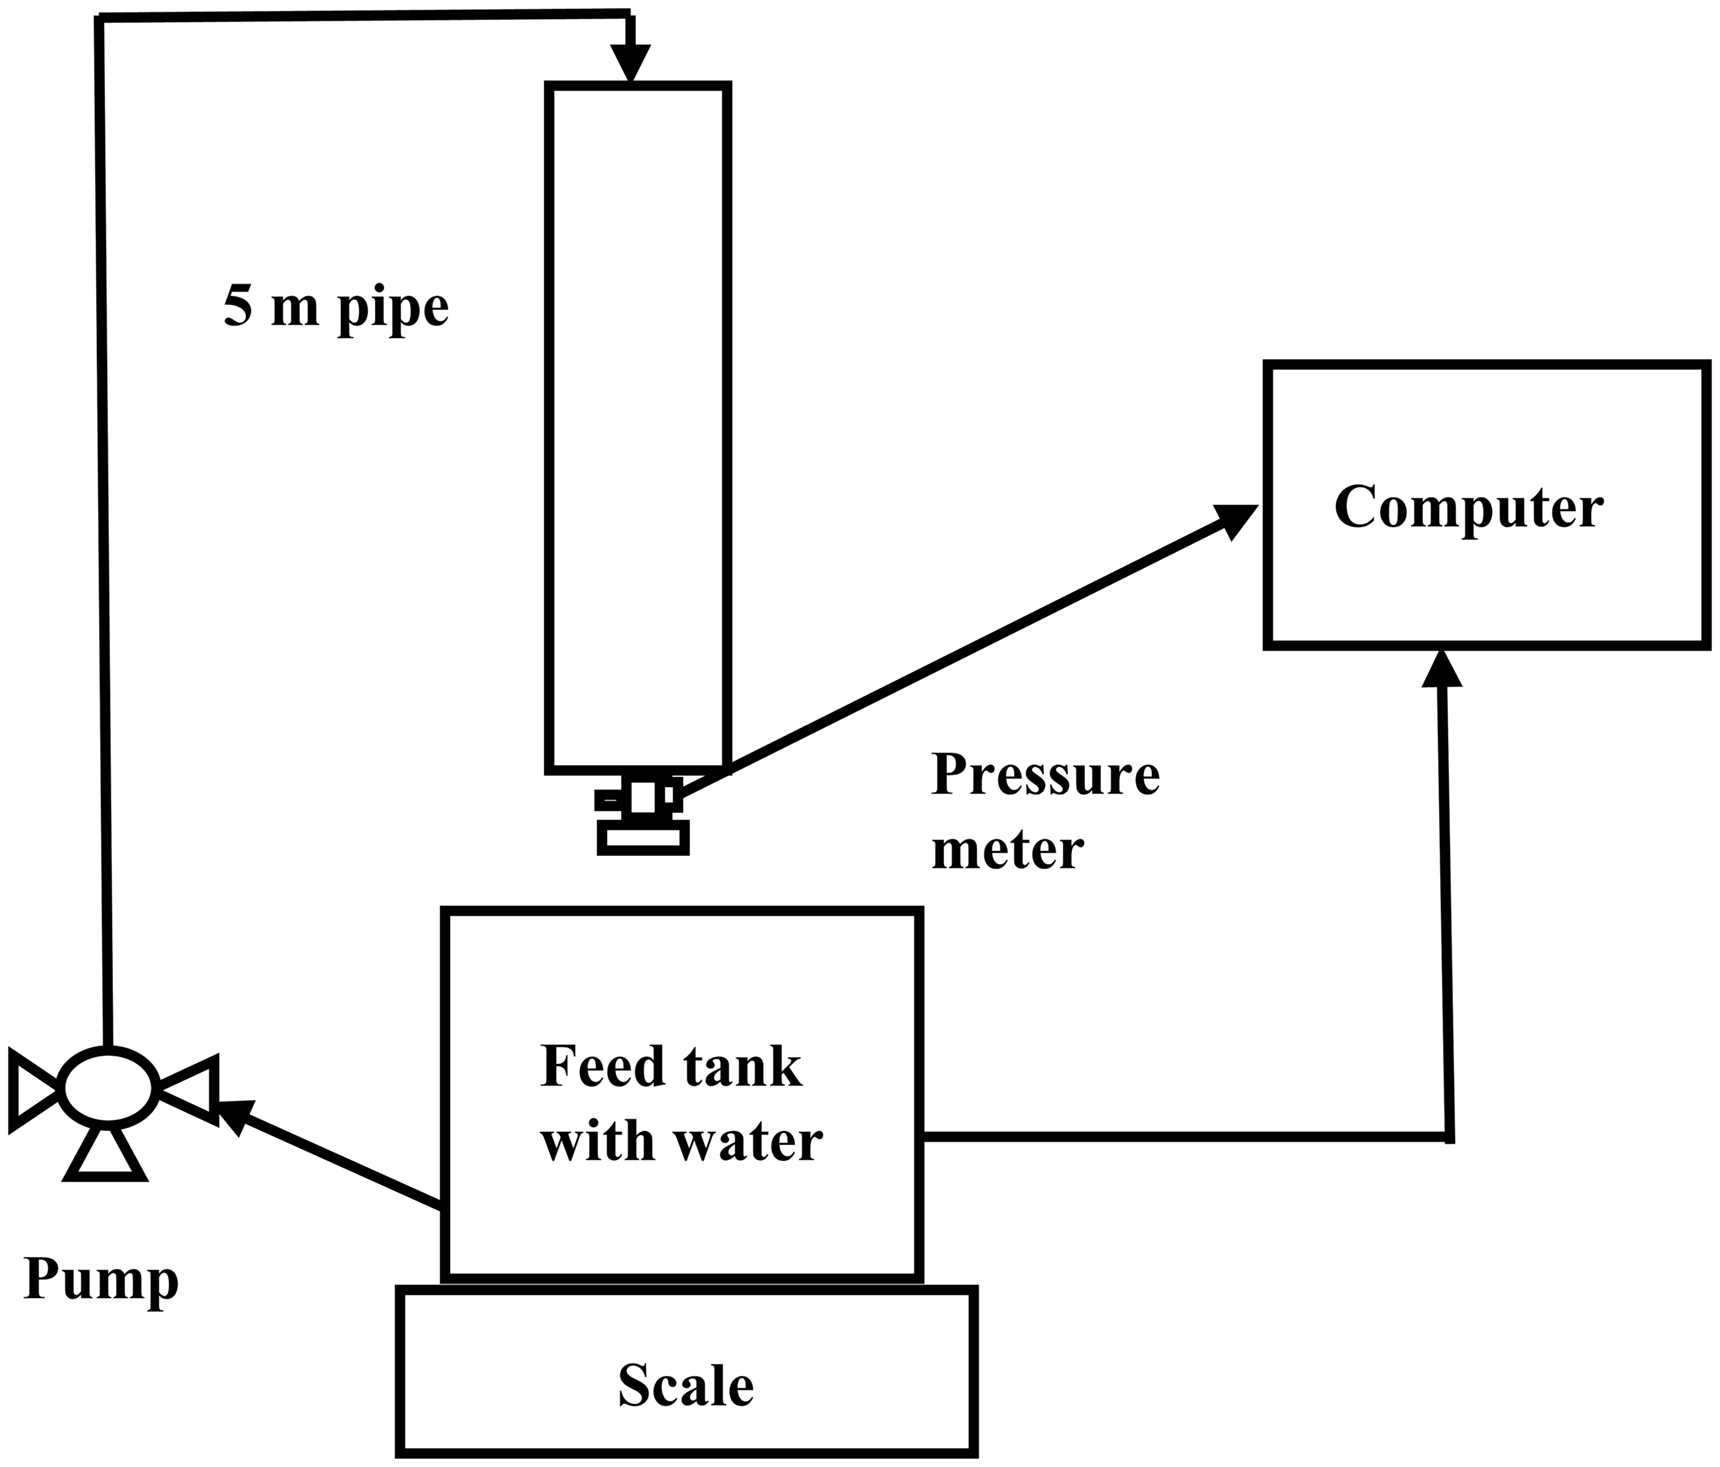
A schematic view of the equipment for measuring water permeability.
Before testing, a cloth sample was wetted with reverse osmosis water and placed under a vacuum for 1 h. This procedure is crucial because it removes air bubbles from the pores of a sample.
Cluster analysis
To study how different performance-related characteristics are related to one another, an exploratory data analysis based on a principal component analysis (PCA) was done. In PCA, the data variables are linearly combined to form a new set of variables that capture the most variation in the data. In this case, this technique makes it easier to visualize the multivariable data that otherwise would be hard to show in two-dimensional or even three-dimensional figures.
In this new variable space, the samples with similar characteristics tend to form clusters. Identifying the samples in each cluster and comparing their structural characteristics can give a clearer view of the relationship between measured characteristics and structural ones. Given the limited sample size with many variables, this kind of clustering analysis is reasonable to reveal similarities with the samples.
The clustering was done with data presented in Table 1 and 2. To take into account the variability in liquid permeability, the variable was split into two separate ones: the minimum permeability (min LP) and the maximum permeability (max LP). To equalize the effect of variables on the analysis, the data were standardized to zero mean and unit variance prior to PCA. MATLAB version R2021a was used to conduct the analysis.
Characteristics of the studied filter cloths
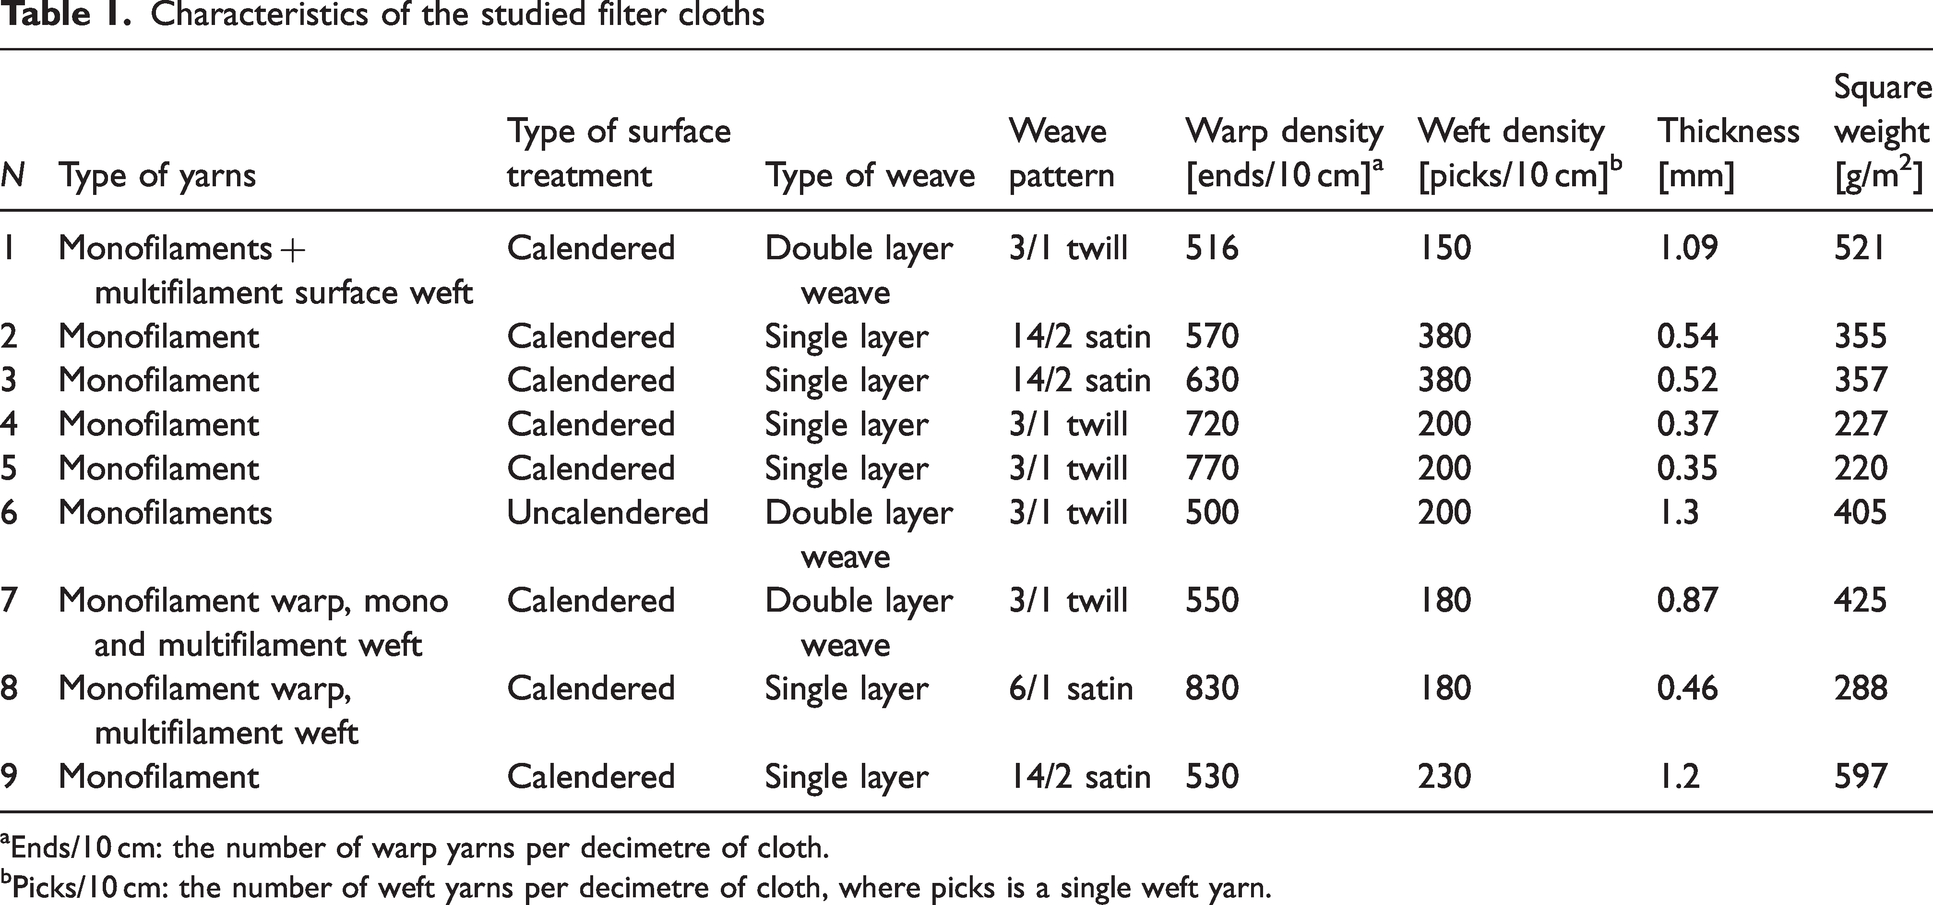
Ends/10 cm: the number of warp yarns per decimetre of cloth.
Picks/10 cm: the number of weft yarns per decimetre of cloth, where picks is a single weft yarn.
Results and discussion
Sample characteristics
As information on the cloth characteristics was unavailable from the industrial partners, they were investigated with SEM images. The SEM analyses provided images of the surfaces and cross-sections of the samples presented in Figure 2. Based on these images, two weave patterns were identified: twill and satin. Twill weave was found in cloths 4, 5 and 6 with a structure of 3/1. Multi-layered cloths 1 and 7 had 3/1 twill weaves on the surface and 2/2 twill on the bottom. The remaining four cloths had a satin weave pattern: cloths 2, 3 and 9 were 14/2 satin, and cloth 8 was 6/1 satin. As can be confirmed from Figure 2, the cloths of both mono and multifilament yarns were studied. Furthermore, single and double-layer weave types were included in the set of samples.
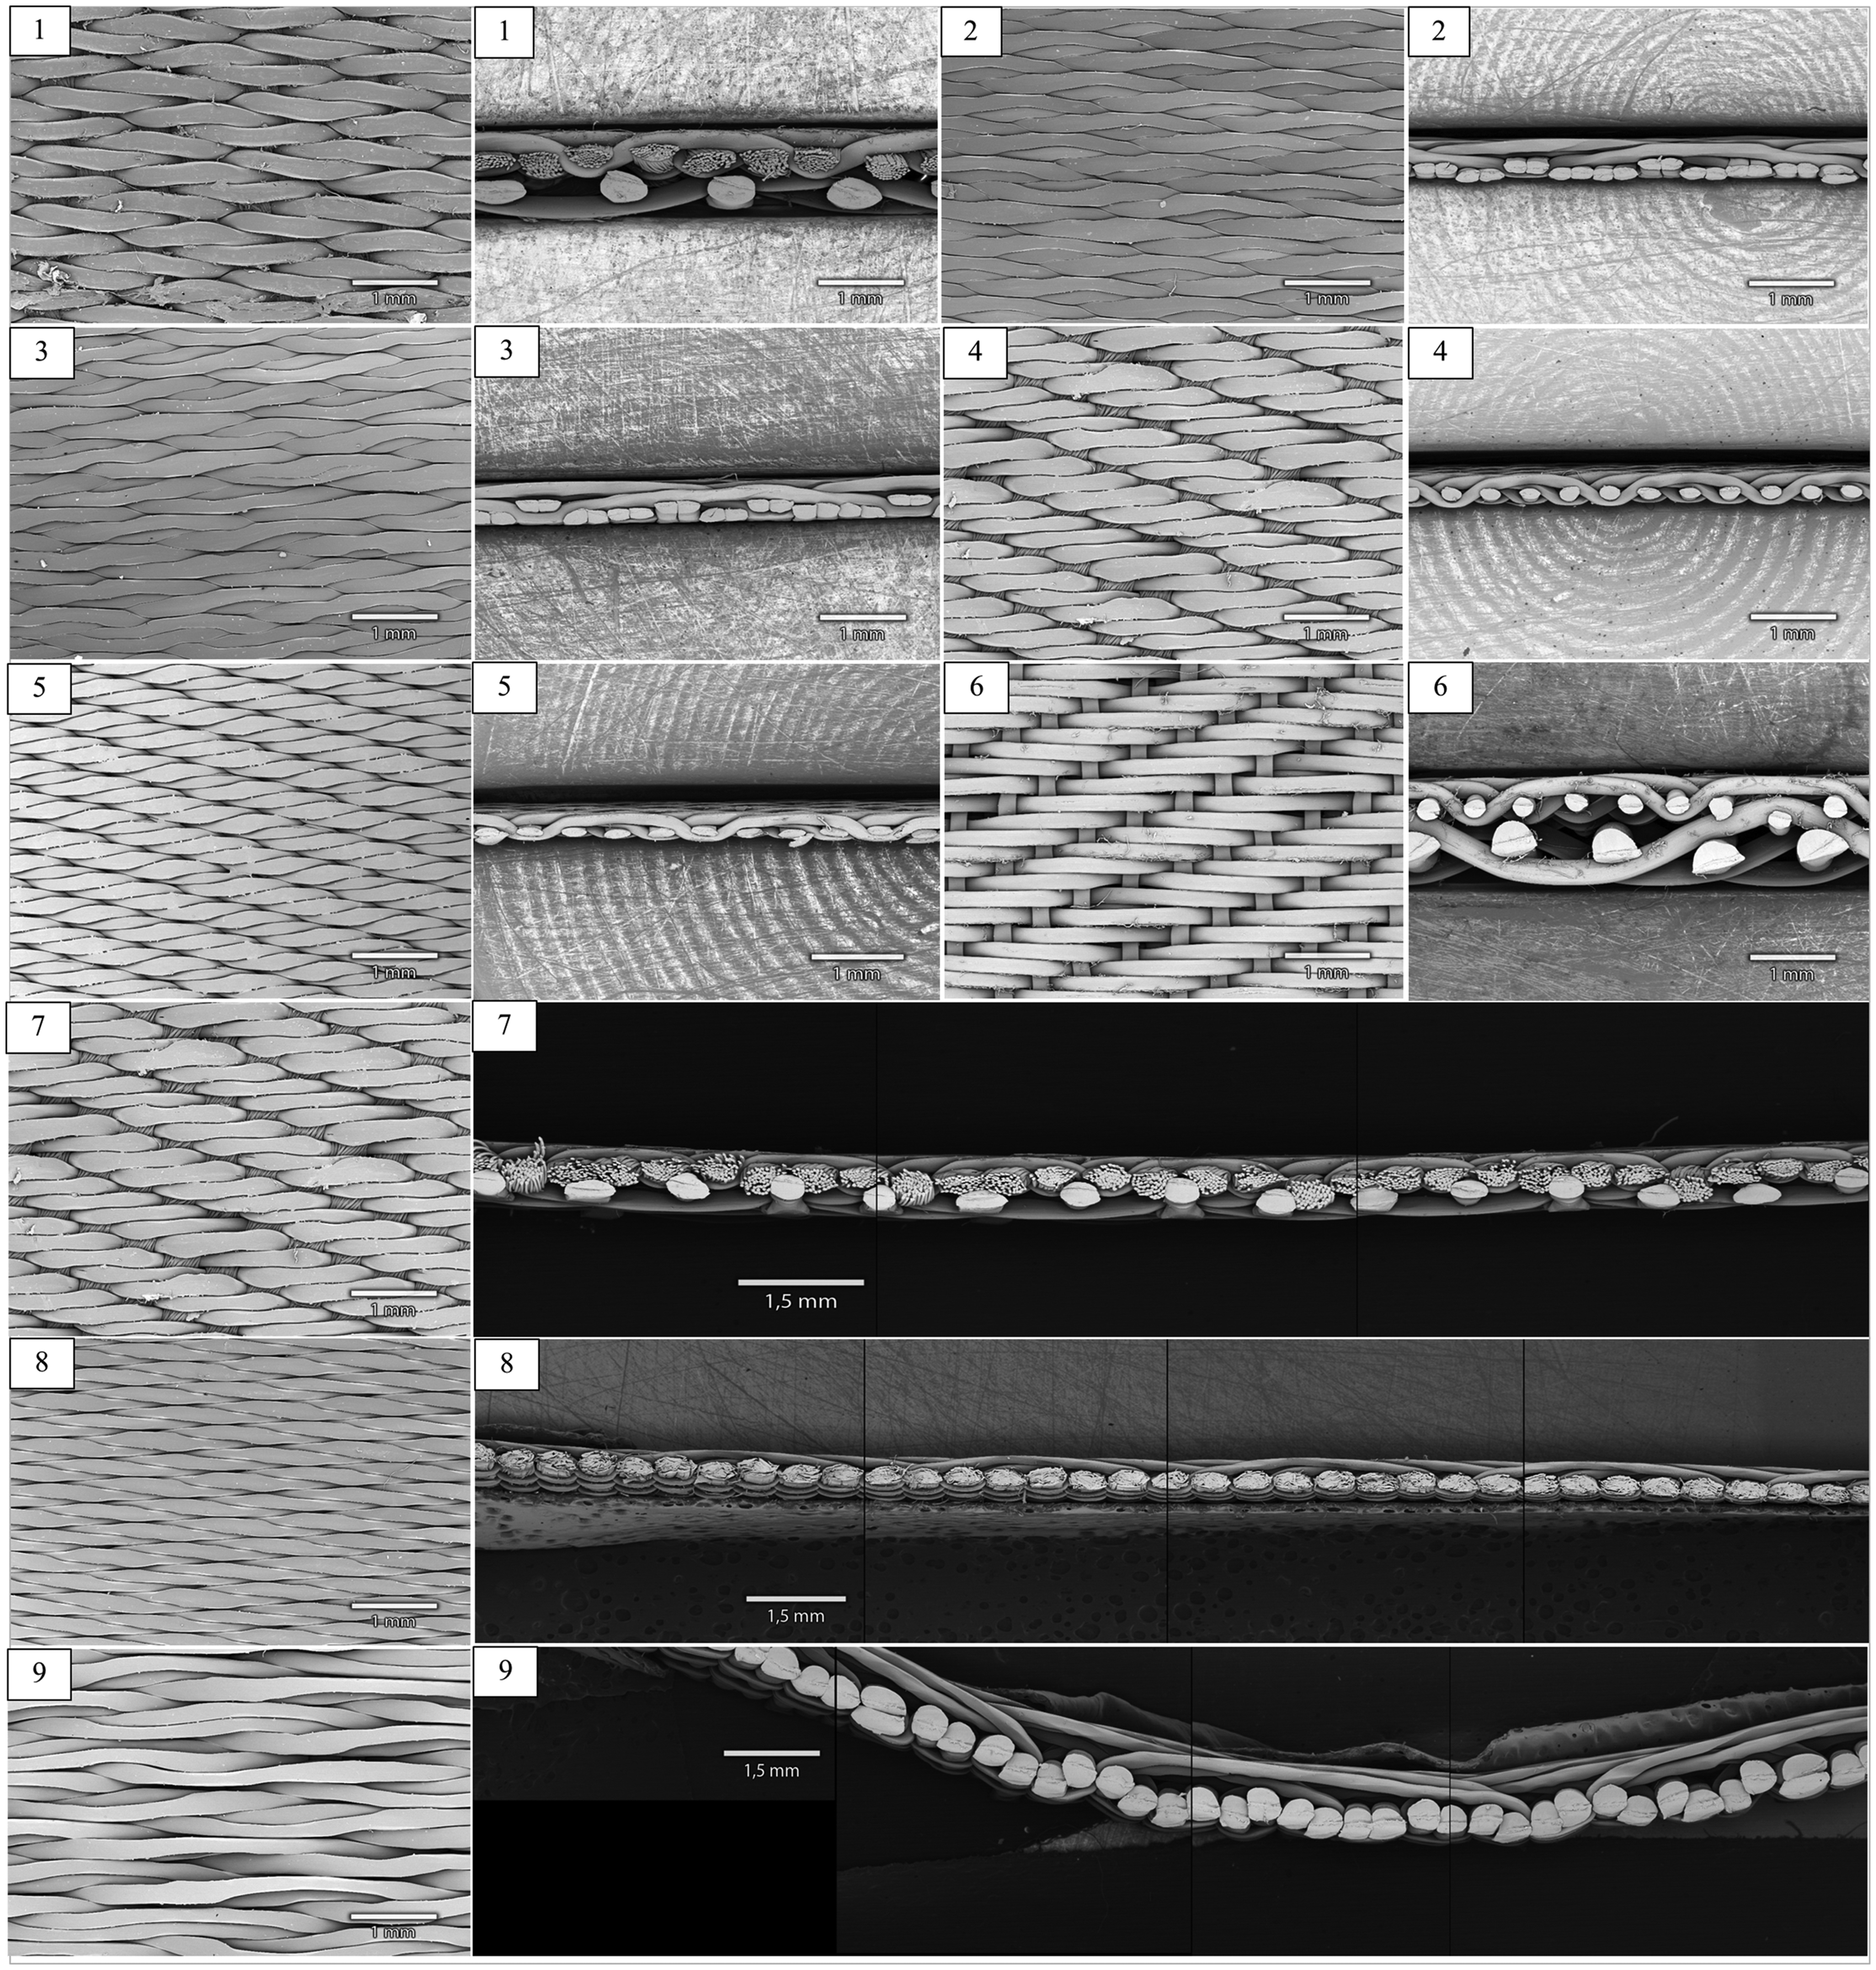
Scanning electron microscopy (SEM) images of the surfaces and cross-sections of the nine filter cloths. The numbering corresponds to Table 2.
As can be seen in Figure 2, SEM images allowed for the detection of such structural characteristics as weft and warp densities, weave pattern and type. Data describing the structural features of the cloths from analyses of the SEM images are presented in Table 2. In addition to the weave design and the yarn densities, the thickness and square weight of the cloths are also listed. Except for cloth 9, the multilayer cloths had the maximum thickness and square weight.
Bubble point pressure, bubble point pore diameter, mean flow pore pressure and diameter, liquid permeability, air permeability, and Reynolds number
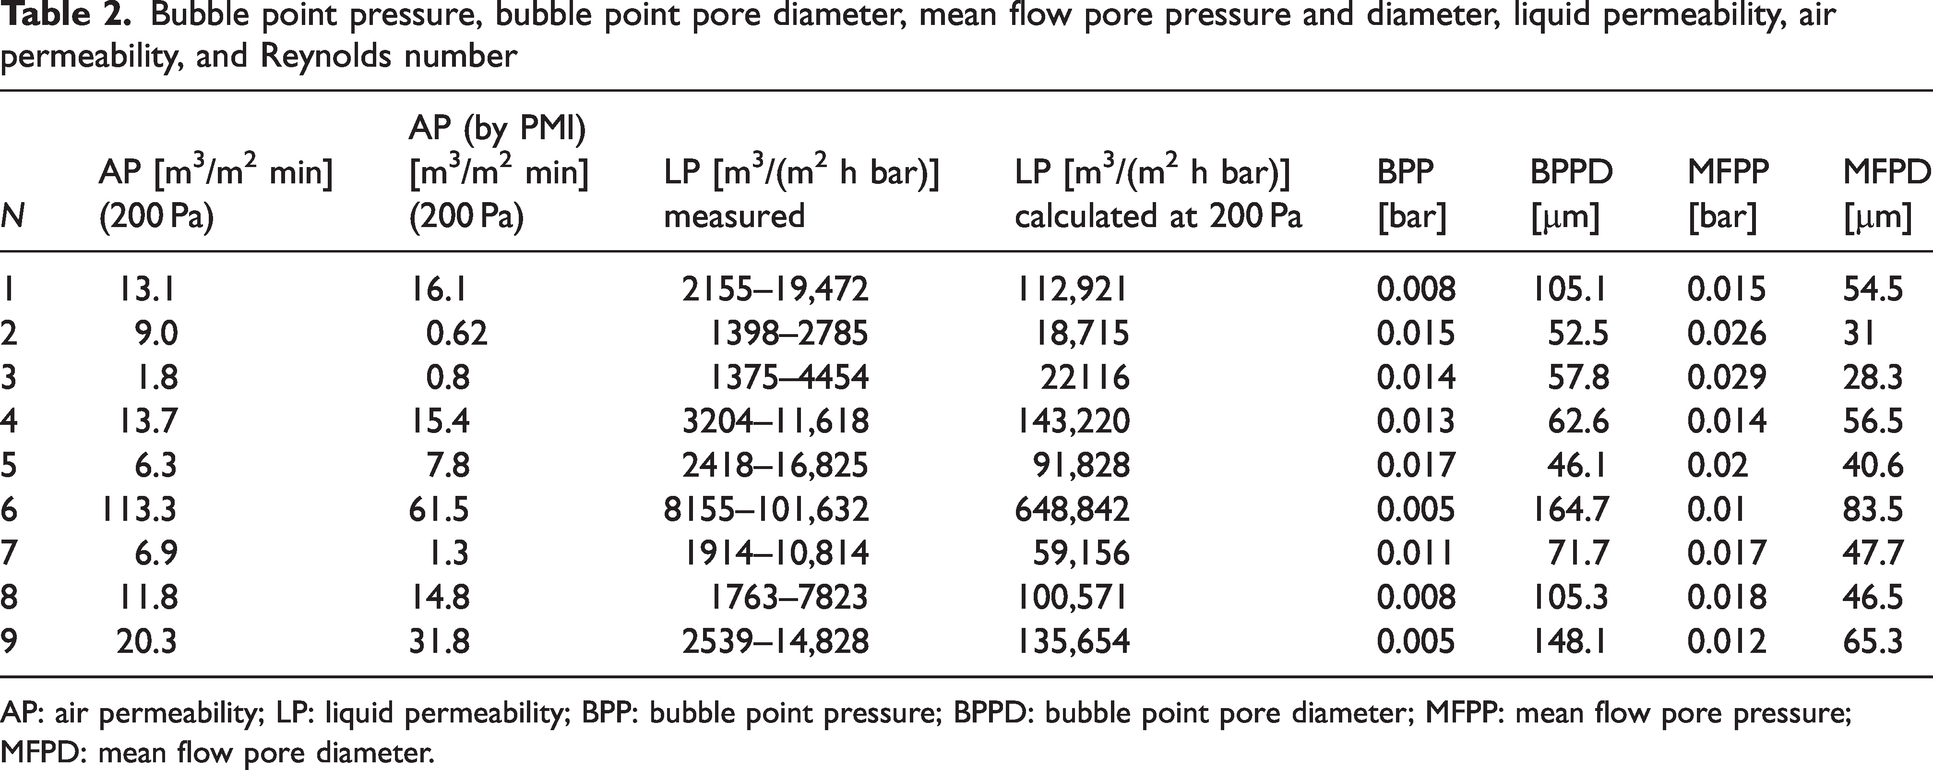
AP: air permeability; LP: liquid permeability; BPP: bubble point pressure; BPPD: bubble point pore diameter; MFPP: mean flow pore pressure; MFPD: mean flow pore diameter.
Sample characterization with cluster analysis
In order to determine if the studied samples could be arranged into groups to simplify their characterization, a statistical cluster analysis was carried out. The cluster analysis was carried out on the measured performance-related data given in Table 1. This table comprises information about the measured values of performance-related characteristics, such as air and water permeability, the bubble point pressure, the bubble point pore diameter (BPPD), the mean flow pore pressure, and the mean flow pore diameter (MFPD). For cloth 6, an exception was made because this cloth drastically differed from the others and did not make it possible to study the clusters formed for the rest of the cloths.
Clustering was performed by applying a PCA. The three largest principal components (PCs) were picked to illustrate the clustering. Together, these PCs capture about 97.8% of the total variation in the data thus giving a good summary of the measured properties and providing a look at the data structure. In their work, Chen et al. 27 stated that examining the cloth samples with a cluster analysis could provide valuable information on textile properties related to a specific use. The data extracted from the cluster analysis can simplify the classification and specification of fabric products and ensure the correct use of fabrics. Figure 3 illustrates the results obtained from the applied method.
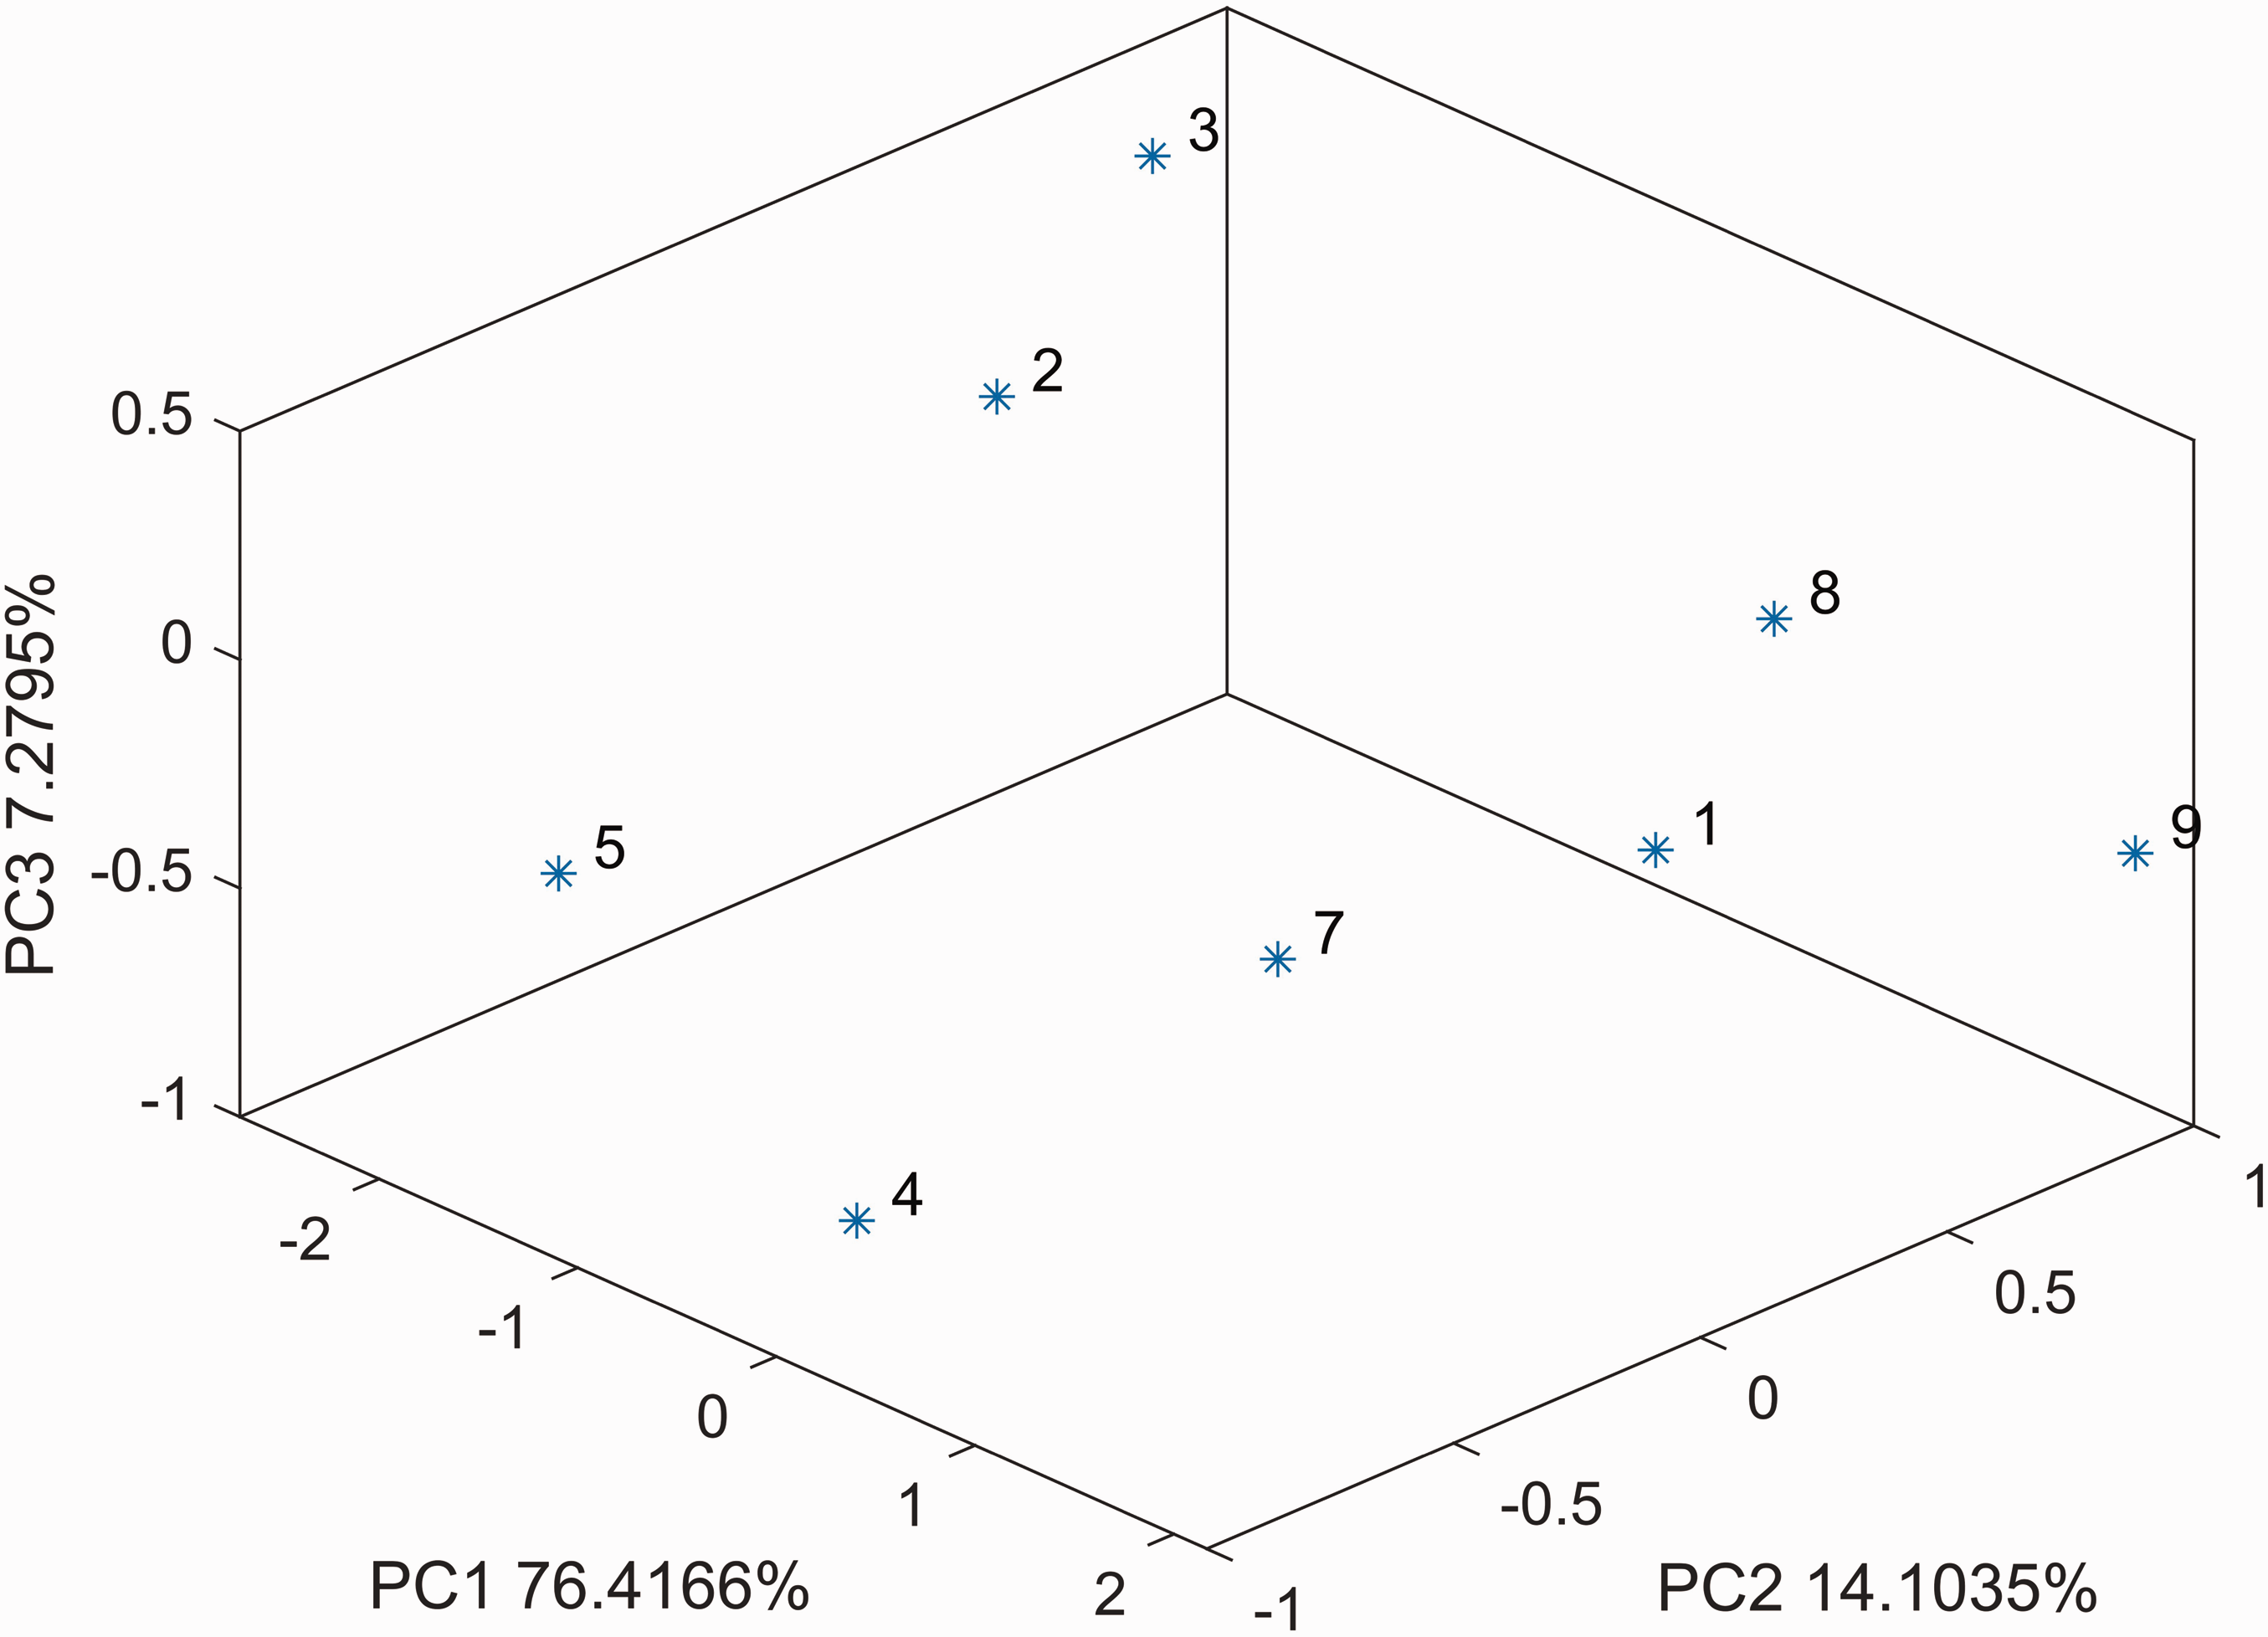
Score plot of the first three principal components (PCs). The percentages given after the PCs indicate the amount of variation captured in each of the components.
As Yoon and Park 28 have mentioned, cloths classified in the cluster analysis and gathered in a group had a higher degree of association within the same group and dissimilar properties between the groups. According to Figure 3, three clusters could be distinguished for the studied samples: one for cloths 2 and 3, another for cloths 1, 8 and 9, and the last for cloths 4, 5 and 7.
In the first cluster, cloths 2 and 3 represented low permeable samples. As indicated by Table 1, these two cloths had the lowest values of calculated air permeability, measured liquid permeability, and MFPDs. According to Table 2, these two cloths were 14/2 satin with quite similar structural features, except for slight deviations in warp density, thickness, and square weight. These similar structural characteristics most likely led to the cluster formation illustrated in Figure 3. Interestingly, cloth 9 was also 14/2 satin and had similar structural attributes to these two cloths, except for a lower weft density and higher thickness and square weight values. However, as Table 1 indicates, this cloth showed almost 2–11 times higher values of air permeability measured with the Textest FX 3300, two to three times higher values of liquid permeability, and approximately two times higher values of BPPD and MFPD. Perhaps the decrease in the weft density had the most drastic effect in this case; the lower the density, the more space between the yarns appears, leading to higher pore diameters and permeability values, respectively.
In the second cluster, cloths 1, 8 and 9 represented high permeable samples. These cloths had the highest values of BPPD (for more than 100 µm) and the lowest values of bubble point pressure (from 0.005 to 0.008 bar), correspondingly. Moreover, these samples had high values of calculated and measured liquid permeability. Air permeability values were intermediate, around 10–20 m3/m2 min, while the minimal values of liquid permeability (LP) were relatively high, about 2000 m3/(m2 h bar). Although all three cloths had different structural parameters, some similarities between the cloths were observed. For example, cloths 1 and 9 had the highest values of square weight with one of the highest thickness values, while cloths 1 and 8 consisted of multifilament yarns. Fabric is an association of various structural parameters, but different combinations of them can lead to similar overall outputs. Therefore, cloths with different structural features can have similar performance-related characteristics.
The last cluster for cloths 4, 5 and 7 represented samples with intermediate permeability, although the trend within these samples was less certain than for the other two groups. These cloths had intermediate values of permeability, BPPD, and MFPD. However, as can be seen in Figure 3, points for cloths 4, 5 and 7 were relatively far apart; their measured performance-related characteristics varied. While a few similarities between some parameters could be found for these cloths, others did not match and differ. Interestingly, cloths 4 and 5 had similar structural characteristics, as indicated by Table 2, but their performance characteristics did not fit as perfectly as expected. Thus, although some cloths might have relatively identical structural features, it is erroneous to expect them to have similar performance-related characteristics.
Pore size distribution
Measurements performed on a PMI capillary flow porometer provided valuable information about the filter media, such as some discrete pore sizes: the bubble point (BPPD) and the MFPDs. In their work, Liu et al. 29 discovered that the pore size significantly affects the filtration performance of woven filter media, stating that the pore size influenced the filtration resistance and efficiency of the surface filtration media fabric structure in static filtration experiments. Moreover, the decrease in the pore size yielded greater filtration precision of the fabric structure. In the dynamic filtration performance experiments, the pore size and fibre diameter influenced the dynamic filtration resistance and efficiency by affecting the dust deposition rate in the depth filtration media. In the present study, the pore sizes measured are listed in Table 1, according to which the highest BPPD of 164.7 μm was obtained for monofilament cloth 6, while the smallest was 46.1 μm for monofilament cloth 5. Although cloth 6 had the highest air and water permeability values within the samples studied, cloth 5 with the smallest BPPD did not have the lowest air and water permeabilities within the set. Orr 5 has stated that the maximum pore size, or BPPD, is an aperture size across, which is impossible to bridge with a specific particle size. Therefore, it is an essential parameter in deciding the upper limit of the aperture size required for a particular process. Although some specialists and practitioners frequently use BPPD, it is a parameter which can describe only the largest pore size in a porous material, damage in structure or, for example, leakage of the pressurized gas during the capillary flow porometer test. Thus, using this single value to characterize the whole porous structure and material behavior in the filtration processes can easily lead to erroneous conclusions.
In their study, Gao and Hu 7 have proposed that the mean pore-throat radius provides the best correlation coefficient for permeability. As well as Gao and Hu, Tanaka et al. 25 have also used D50, or the mean pore size, to represent the pore size distribution (PSD). In contrast, Rideal et al. 15 and Orr 5 have pointed out that this parameter can be inappropriate for nonwovens with a wide range of pore sizes to determine the filter media performance. Liu et al. 29 also stated that the average pore size was the main factor affecting the filtration performance of the surface filtration media fabric structure. In their work, the authors found that the smaller the average pore size of the filter medium, the higher the filtration efficiency, as well as the greater the filtration resistance of the fabric structure. In the present study, the largest MFPD was measured for cloth 6 (83.5 μm) and the smallest one for cloth 3 (28.3 μm). Indeed, cloth 3 had the lowest air permeability and one of the lowest liquid permeability values as well. Thus, MFPD can be a tool to predict permeability. Although single values for BPPD and MFPD, presented in Table 1, provide some insight into the structure of the cloths, a more detailed characterization of the pore structure can only be obtained from the pore size distributions. The value of the bubble point pore diameter can only provide insights into the size of the largest pores in the sample, and the mean pore diameter only describes the pore size in the cloth at which 50% of the total gas flow can be accounted for. In the sample, the pore size distribution provides information on all the pores, enabling the interpretation of flow to pore sizes.
The fluid flow and pressure data collected with a PMI advanced capillary flow porometer were processed, and the differential pore size distribution was obtained. This distribution for all the studied samples is shown in Figure 4. The differential pore size distribution can be a powerful tool to analyze how 100% of the total flow is distributed within the porous structure of a filter cloth. Although Figure 4 proved that BPPD and MFPD are essential parameters for evaluation, they comprised only a certain percentage of the total flow. For example, for cloth 6, only 0.024% of the total flow passed through the BPPD (164.7 μm) and about 13% through the MFPD (83.5 μm). The total flow was distributed through various pore sizes in this cloth, which can be determined by analyzing the diagram in Figure 4.
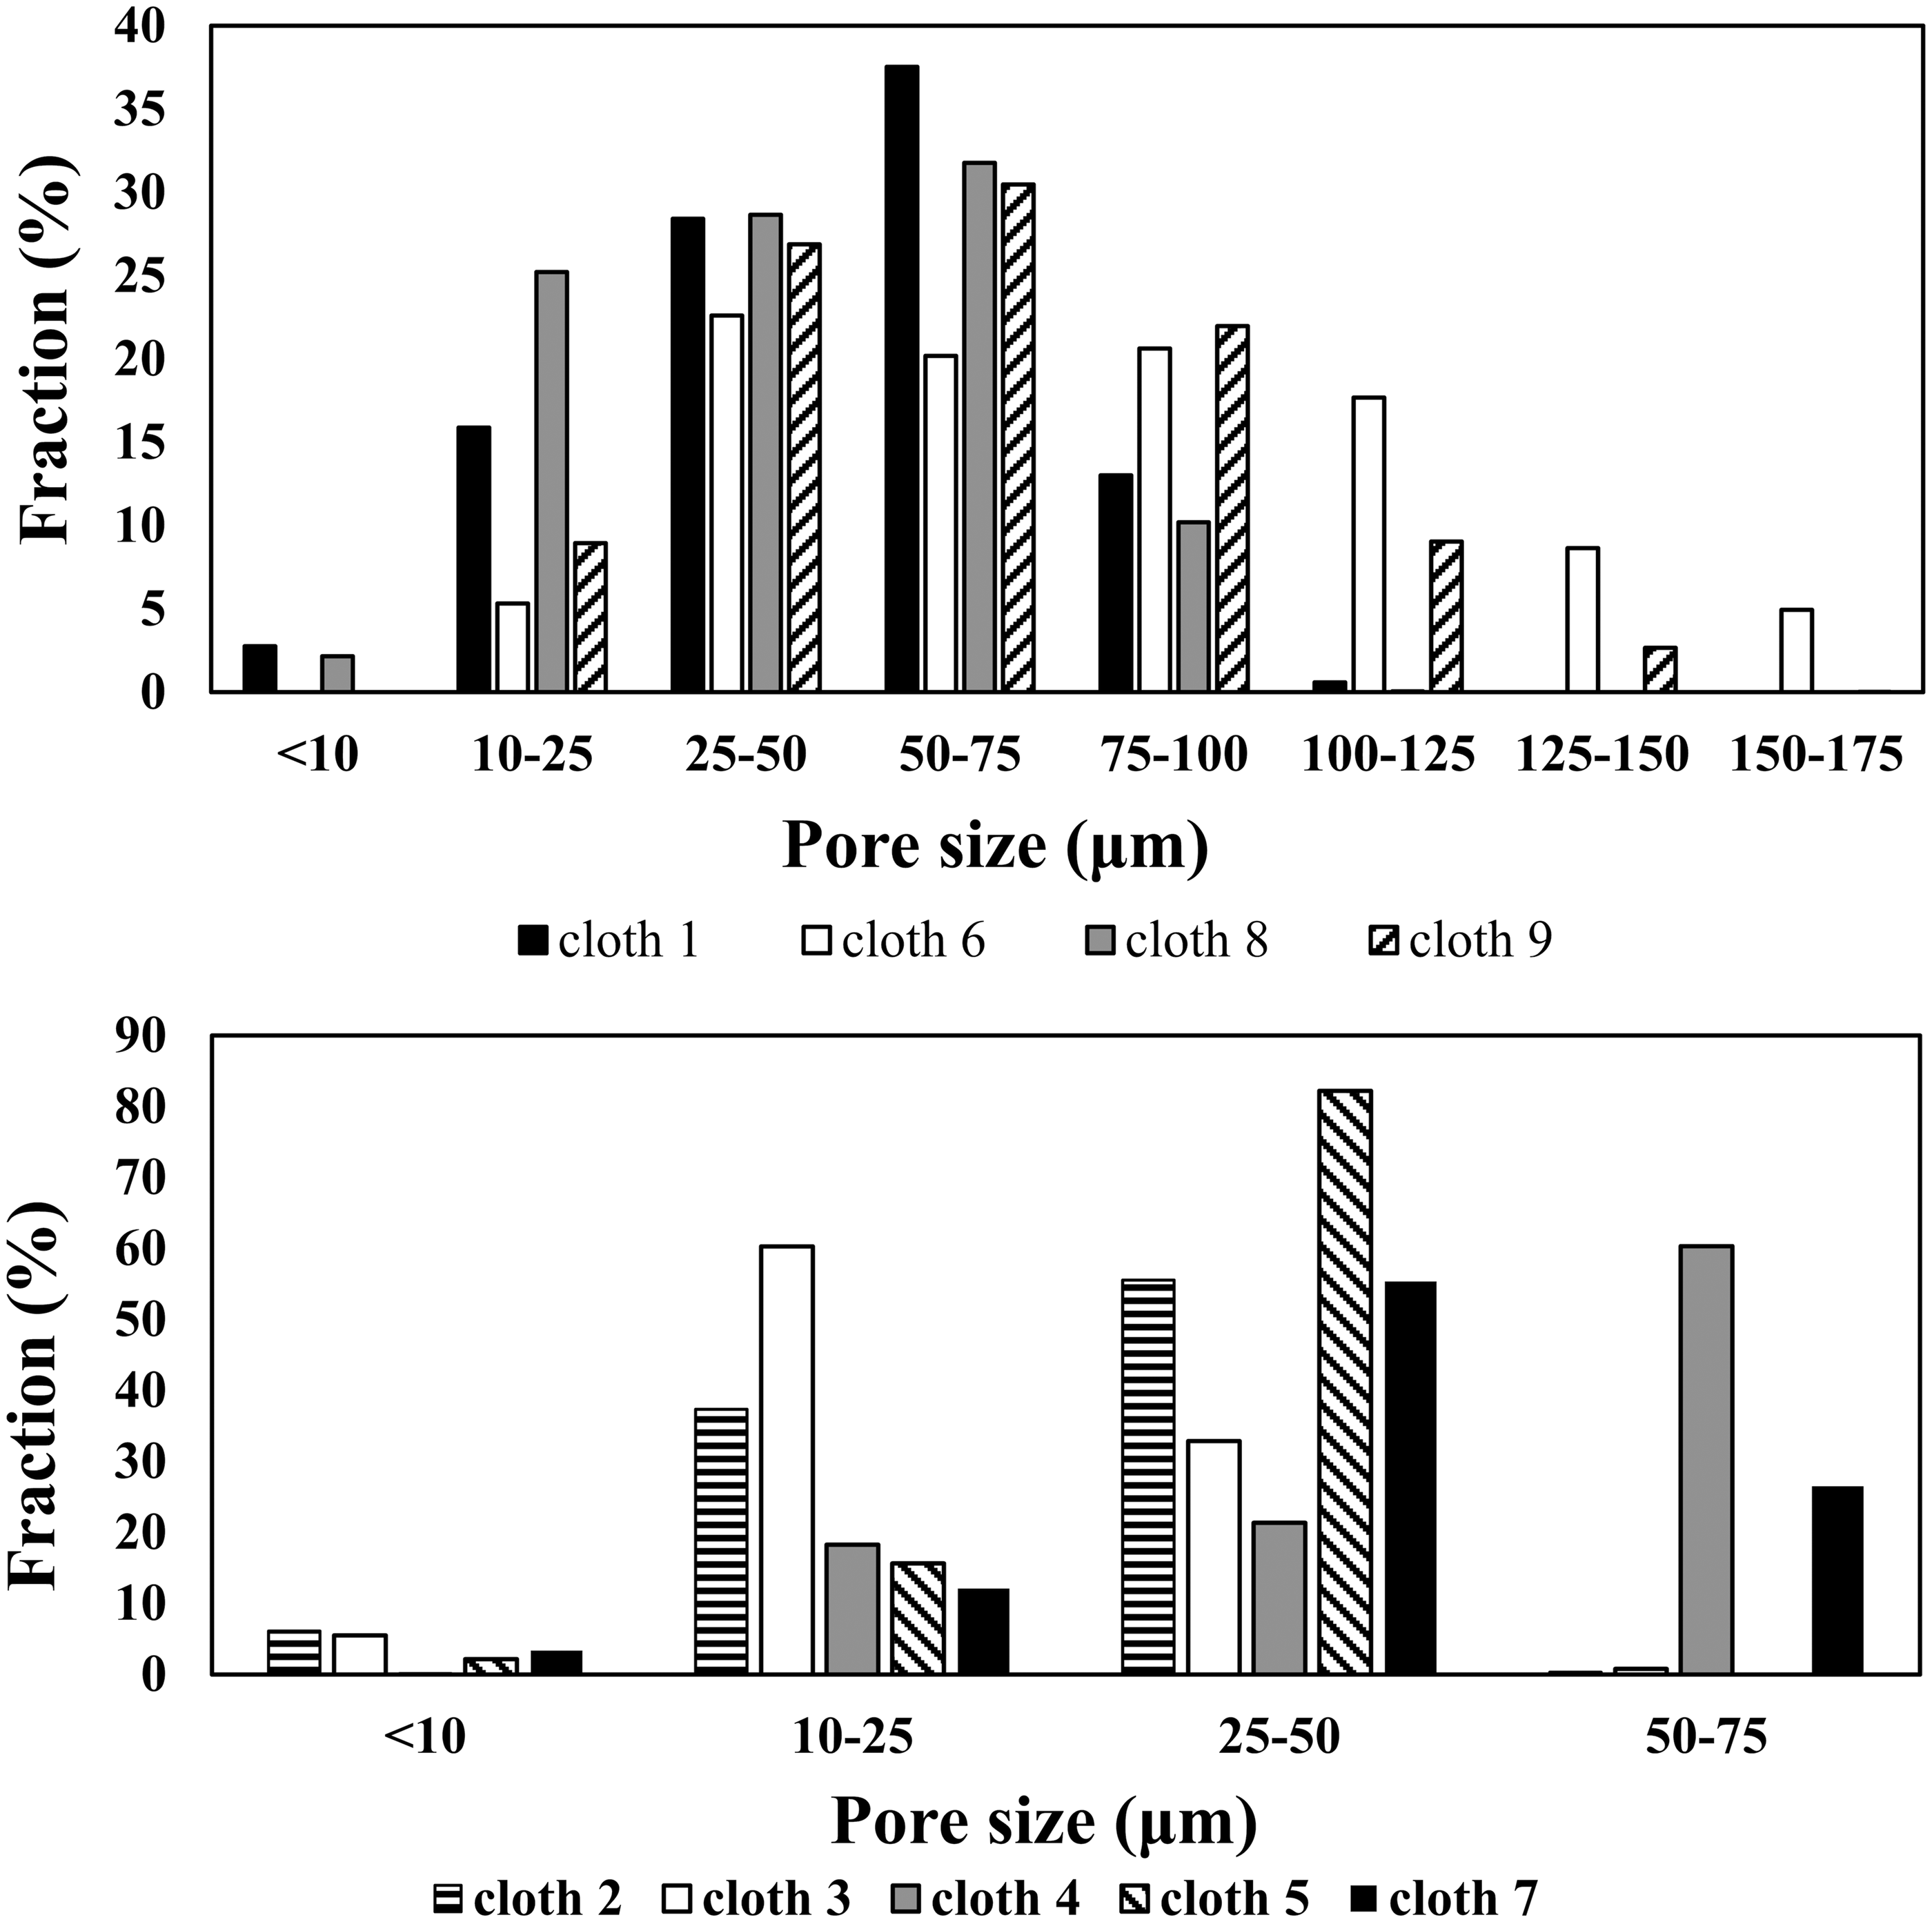
Pore size distribution diagram for the studied materials.
As can be seen in Figure 4, the studied cloths could be divided into two groups based on the pore size distribution. Cloths 1, 6, 8 and 9 had a wide pore size distribution, with the pore sizes ranging between less than 10 and 175 μm. As mentioned previously, these cloths formed a highly permeable cluster, and Figure 4 confirms this statement. In contrast, the pore size distribution of cloths 2–5 and 7 were narrower, including only four fractions from less than 10 and 75 μm.
Except for cloth 7, the second group of cloths with a narrow pore size distribution was mainly made up of monofilaments cloths. The simple structure of a monofilament sample is likely to form less variety for the pores in a piece. Here, four (cloths 2, 3, 4 and 5) out of five (cloth 9) calendered monofilament cloths had a narrow pore size distribution. According to Table 2, cloth 7 had similar structural characteristics to cloth 1 from the first group. Both cloths were 3/1 twill and made of mono and multifilament yarns, but the warp and weft densities were higher for cloth 7 (34 ends/10 cm more for warp density and 30 ends/10 cm more for weft density). A similar trend was also observed for cloths 2, 3 and 9. Although cloth 9 from the first group had identical structural characteristics to cloths 2 and 3, the last two were much denser. This observation leads to the assumption that a higher density leads to a much narrower pore size distribution. However, this rule does not apply to all cloths. For example, cloth 8 had the highest value of warp density, but it still had one of the broadest pore size distributions. Cloth 8 had unique structural features – it was the only sample with the 6/1 satin weave pattern and a single-layer cloth comprising mono and multifilament yarns. As the multifilament cloths consist of large interyarn and interfibre pores, 5 it was expected to observe a broader pore size distribution. Figure 4 confirmed that two (cloths 1 and 8) out of three (cloth 7) fabrics containing multifilament yarns had a wide pore size distribution. These observations lead to the conclusion that a few factors control the pore size distribution of the studied cloth. The first one is the type of yarn – monofilament cloths mainly have a narrow pore size distribution in contrast with the multifilament cloths, while the second factor is the warp and weft density – the denser the cloth, the narrower distribution it will have. However, some exceptions to this rule exist, which are associated with the complex structure of an individual filter cloth. For example, multifilament cloth 7 had a narrow pore size distribution, while monofilament cloths 6 and 9 had a wide one. It should be mentioned that monofilament cloth 6 was the only uncalendered and double-layered cloth. In this sample, the yarns were apparently loose compared with calendered monofilament samples. Together with the pores in the double layer, these loose yarns could contribute to the broader pore size distribution. The woven filter medium is a unique organized structure consisting of copious pores of various sizes, which is individual for each cloth. Only the pore size distribution diagram can provide detailed information for each pore in the sample. As Orr 5 has mentioned, such information can be a valuable source in assessing the separation feasibility.
According to the information presented in Table 1, the influence of a post-treatment process on BPPD and MFPD can be observed. As Sparks 4 and Purchas and Sutherland 2 have reported, the diameter of pores is assumed to depend on post-treatment because such a process is designed to control the surface characteristics of materials. For example, calendering can significantly reduce the size of pores and change their shape on the surface of a cloth. As Table 1 indicates, cloth 6 was the only uncalendered sample. Although the warp and weft densities for this and cloth 7 were quite similar, as indicated by Table 2, the BPPD and MFPD in cloth 6 were almost twice as high as in cloth 7.
Air permeability
Air permeability is an important property of a porous material that demonstrates how easily air can pass through the filter medium. There are different ways to measure air permeability, the most common of which is to use a Textest FX 3300, which works according to the SFS-EN ISO 9237 standard. The PMI capillary flow porometer also measures the volumetric flow rate through a dry sample under different pressure steps. This data can sometimes be used to extract information about the air permeability of the porous material. In the present study, both methods were used. Measured (by a Textest FX 3300) and calculated (from a measured volumetric flow rate, or dry curve, obtained with the PMI equipment) air permeability values were obtained and are presented in Table 1 and Figure 5.
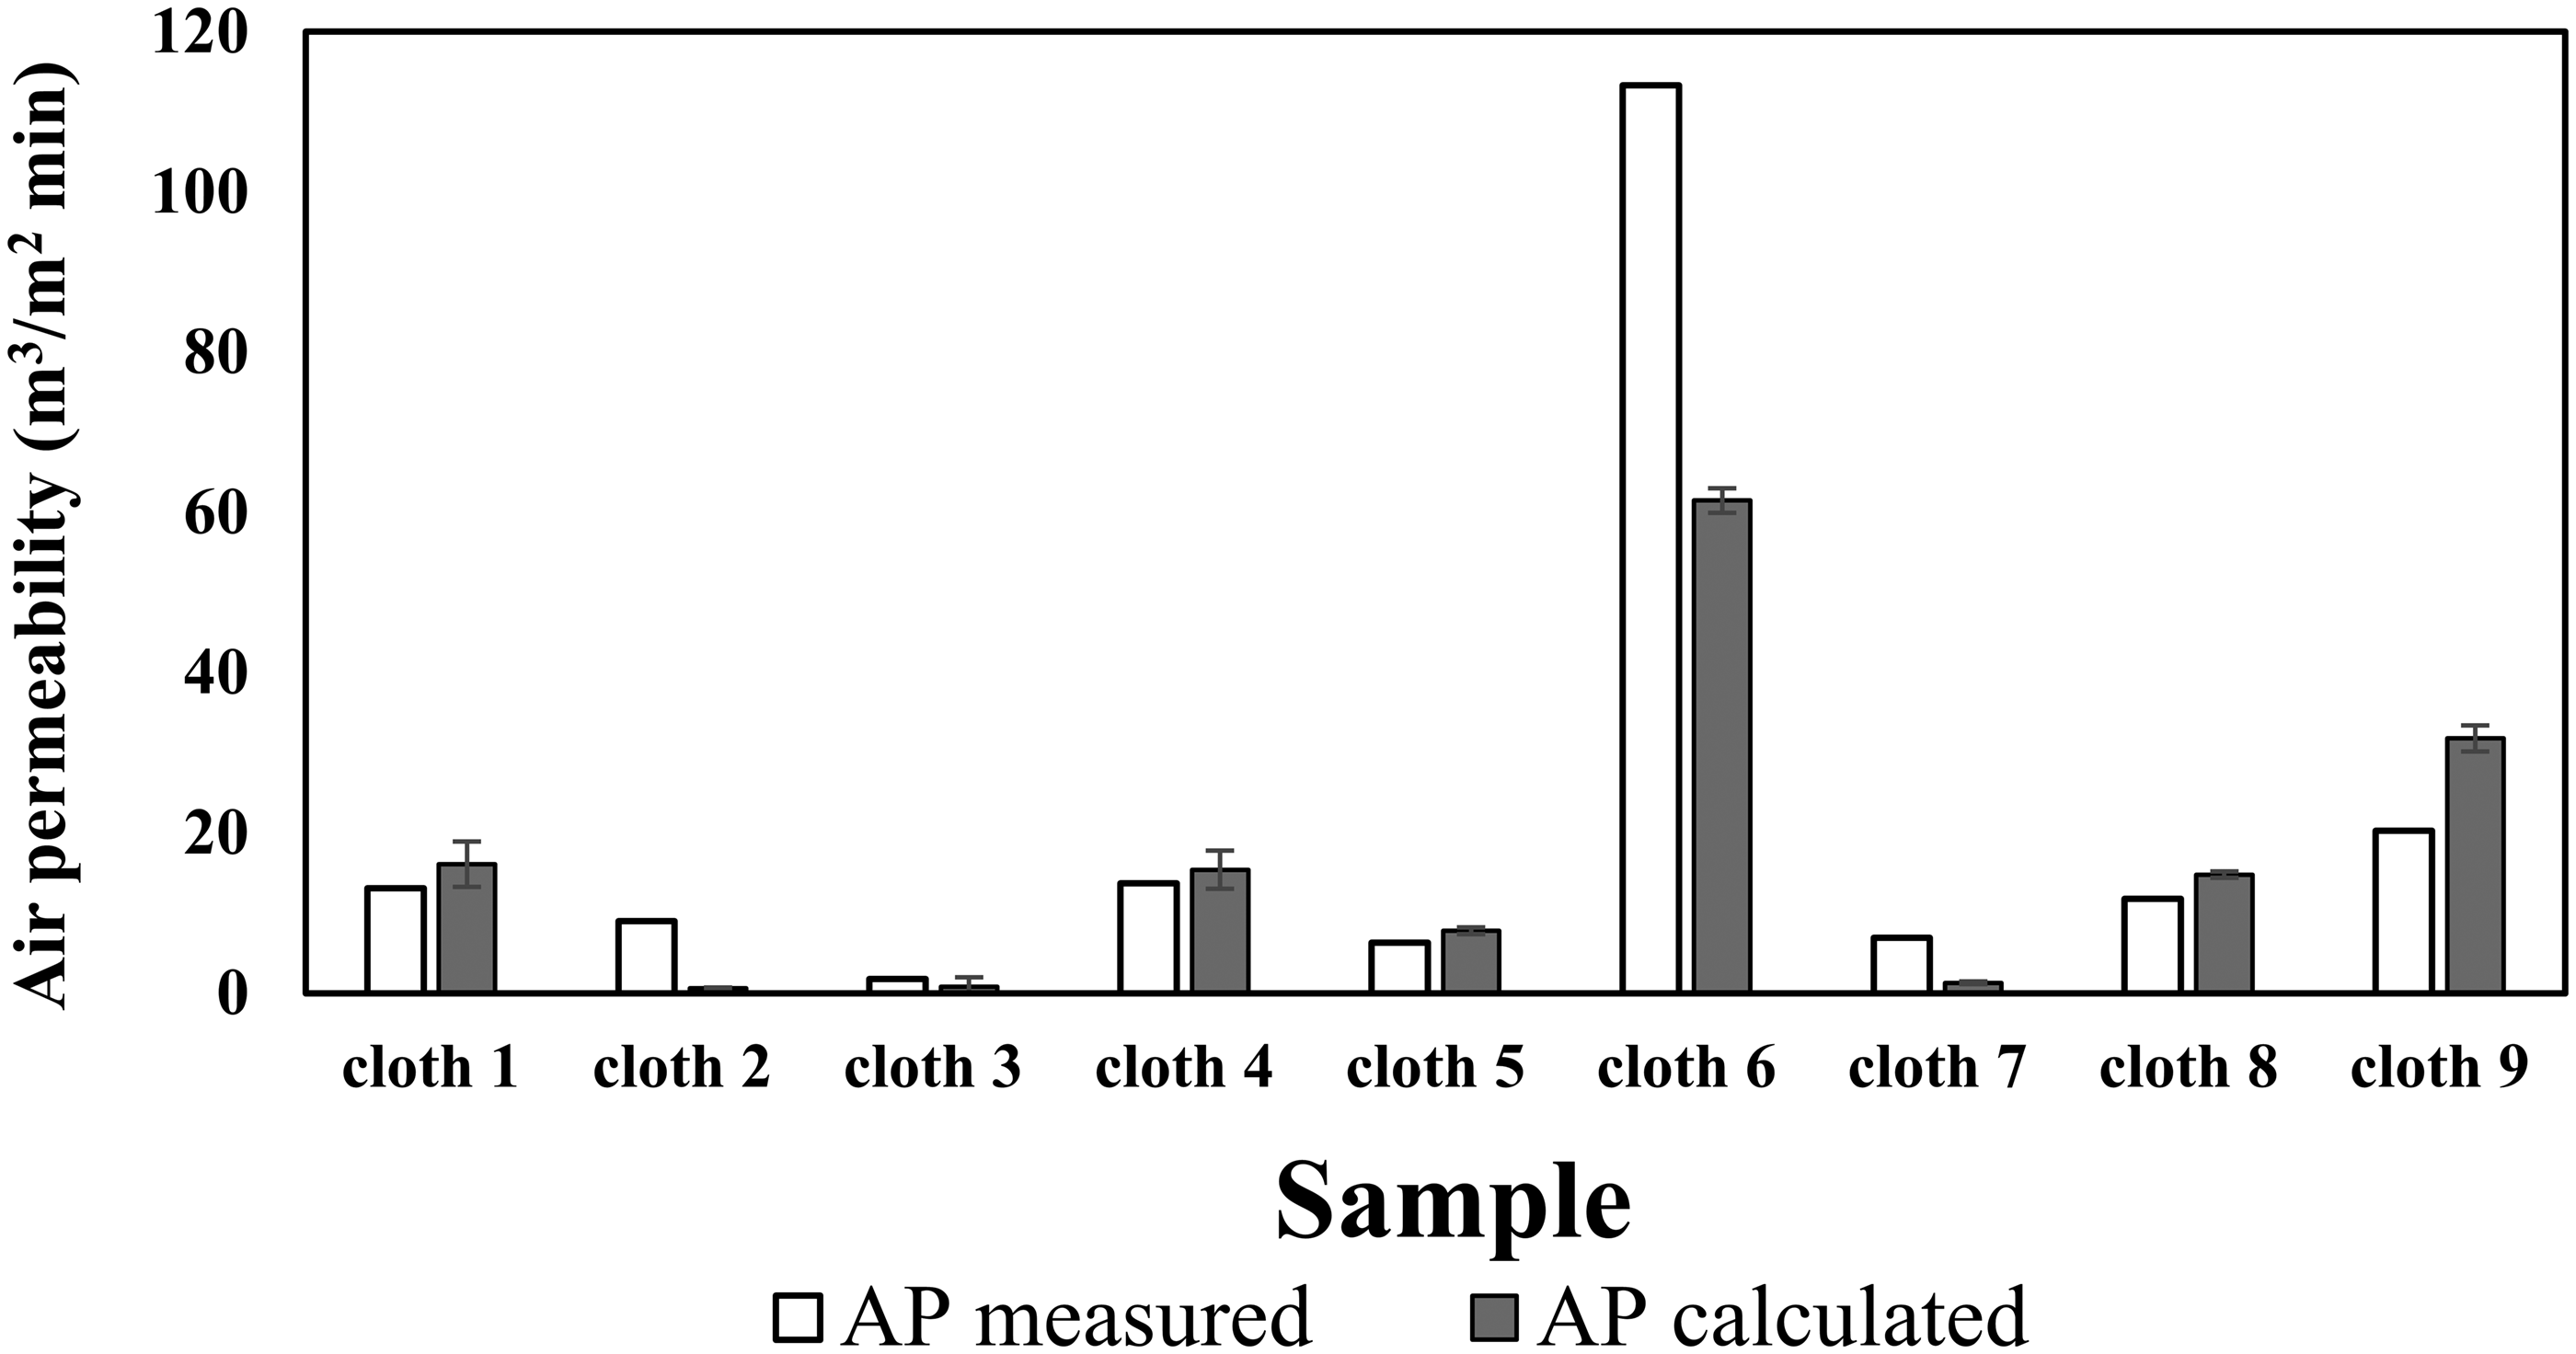
Comparison of air permeability (AP) values measured with a Textest FX 3300 and calculated from a dry curve obtained with the Porous Materials Inc. (PMI) equipment for fully dry conditions.
According to Figure 5, the air permeability values measured by two different methods were similar but not the same. Mainly, noticeable differences were observed for cloths 2, 6, 3 and 7. In cloth 2, the measured value was almost 15 times higher than the calculated value. Moreover, the dry curve obtained with the PMI equipment does not start from 0. With this equipment, the obtained raw data begin with a bubble point pressure and dry and wet flows corresponding to this pressure. When the pressure increases, the airflow might change from laminar to turbulent. Transitions can occur in the plot ‘air permeability versus differential pressure’ during this change, as described by Hassenboehler. 30 These changes in the plot have a significant influence on the calculation of air permeability. All the dry curves for the studied materials started with a pressure higher than 200 Pa used in the Textest FX 3300 equipment. The calculated air permeability was obtained from data extrapolation; therefore, discrepancies in the calculated and measured data were obtained. At this low pressure, the dry curve that started from the bubble point pressure, which was higher than 200 Pa for all the samples, was not a precise tool to predict the air permeability. However, the modification of the data representation by adding the datum starting from zero in the PMI equipment could improve the air permeability prediction process at low pressures. In addition, it should be noted that although the PMI equipment measured the volumetric flow rate of the pressured gas (often air or nitrogen), the measurement of air permeability was not performed according to the standard. 9 Therefore, these data should be double-checked.
Air permeability measured at a differential pressure of 0.1 to 0.5 bar is shown in Figure 6(a). According to this figure, the air permeability increased with the gas pressure. The same trend has been well described and studied by Hassenboehler 30 and mentioned by Scheidegger. 11 As shown in Figure 6(a), cloths 2, 3 and 7 had similar air permeability values. The air permeability calculated for these cloths at 200 Pa was in the same range – 0.62, 0.8 and 1.3. In contrast, the Textest FX 3300 values were not similar – 9, 1.8 and 6.9, respectively. Although the values calculated at 200 Pa pressure were obtained from extrapolation, the general trend for the air permeability values in cloths 2, 3 and 7 was identical for different pressures. An experimental error or a gas leakage could be the reason for the high values measured by the Textest FX 3300. Nevertheless, a better trend was observed for cloths 1, 4, 8 and 9, in which the measured and calculated values were in the same range.
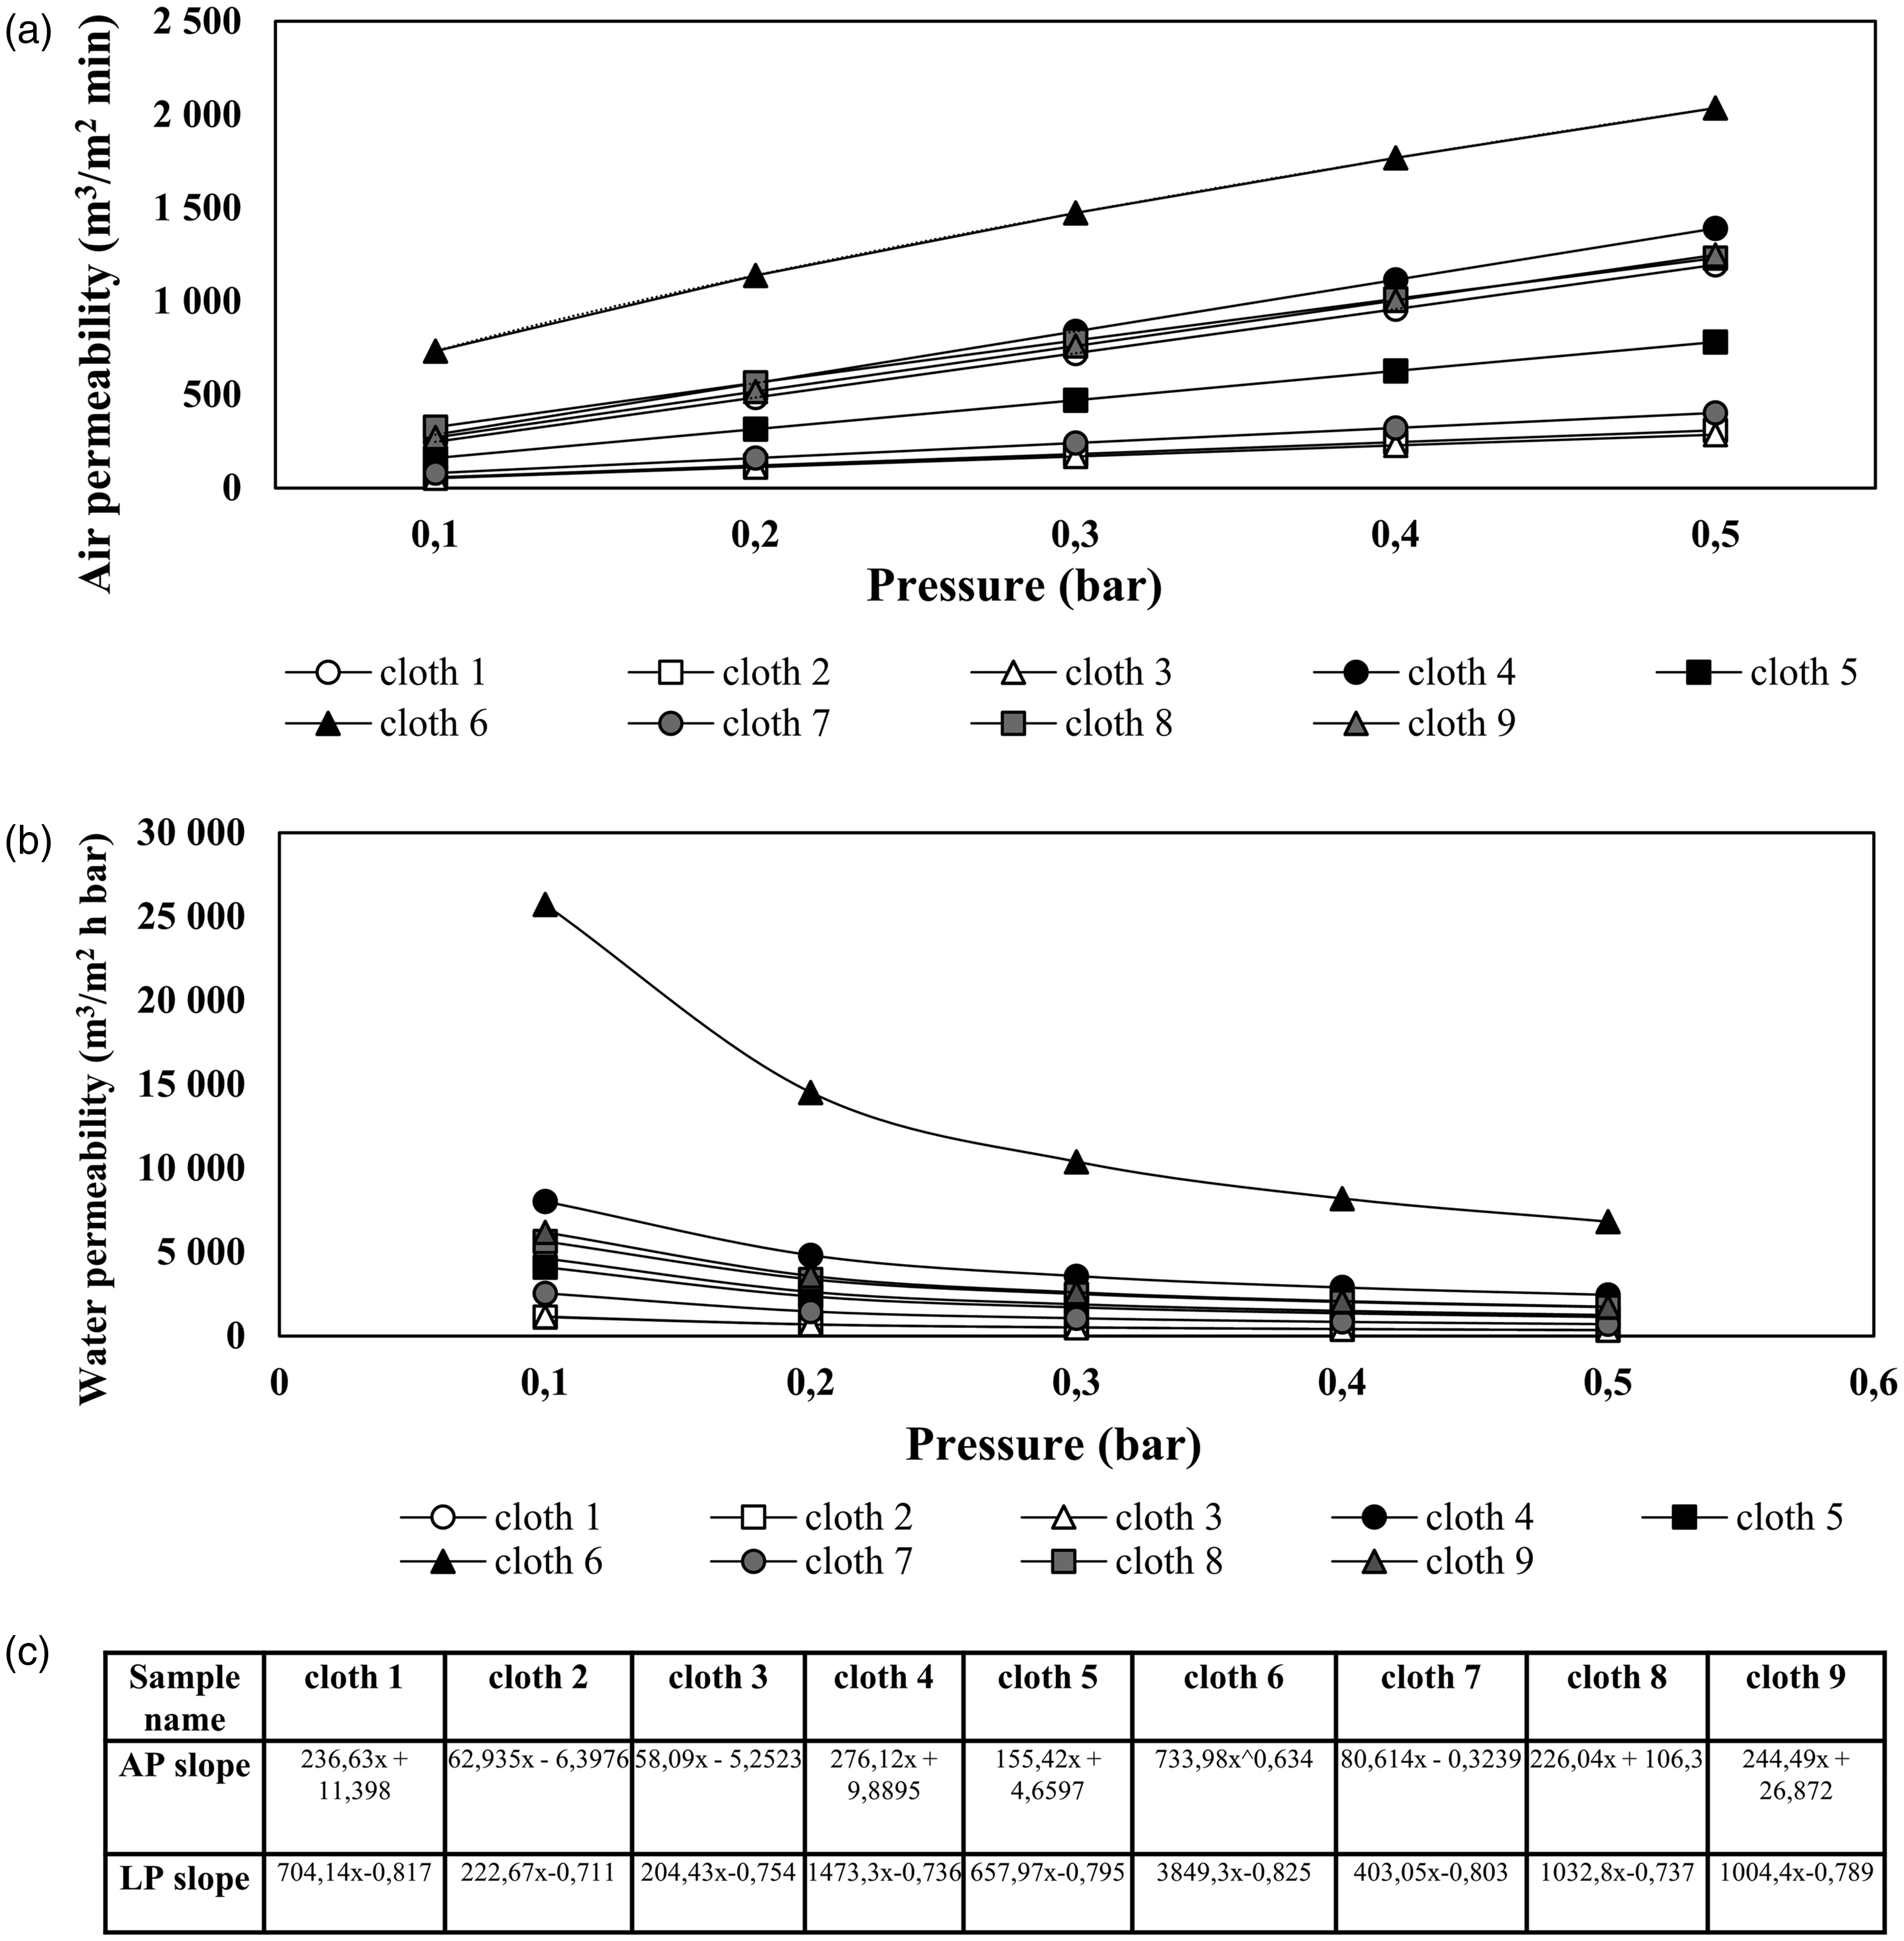
(a) Comparison of air permeability (AP) measured and calculated from a dry curve obtained with the Porous Materials Inc. (PMI) equipment for a differential pressure of 0.1 to 0.5 bars; (b) Water permeability measured at a declining pressure of 0.5 to 0.1 bars for all the studied samples, except cloth 6 and (c) A table consisting of equations used to describe slopes for parts (a) and (b).
The dependency described in Figure 6(a) was linear for all cloths except cloth 6. That curve was a nonlinear power function described by

Water permeability
Water permeability is a characteristic that describes the rate of liquid flowing through a porous medium. Water permeability measured at declining pressures of 0.5 to 0.1 bar for all the studied cloths, except cloth 6, is presented in Figure 6(b). As cloth 6 showed the same dependency as the other samples but stood much higher than them, not making it possible to assess the dependency for the remaining cloths, it was taken from the figure. As can be seen in Figure 6(b), the water permeability decreases with the increase in pressure and can be described by

According to Figure 6(b), the water permeability for cloths 2, 3 and 7 was the lowest, matching the data from the dry curve. Similarly, cloths 1, 4, 8 and 9 had water permeability values that matched the air permeability values. Cloths 2 and 3 showed very similar values of this parameter. Indeed, these cloths had similar structural characteristics and pore size distributions shown in Figures 3 and 4. However, if the woven filter media is judged by only a single value of air permeability measured by the standard SFS-EN ISO 9237 or ASTM D737-04, 9 as most manufacturers do,2,3,8 the inference will be erroneous. According to Table 1, the air permeability measured with the Textest FX 3300 for cloth 2 was 9 m3/(m2 min) and 1.8 m3/(m2 min) for cloth 3. A single value of air permeability measured at low pressure is not enough to assess the performance of woven filter media. Adequate characterization of woven filter media requires incorporating several different parameters, such as pore size distribution, air and water permeability.
Correlations between permeability and MFPD
Although the pore size distribution diagram is valuable information, this massive datum is practically impossible to use to assess its correlations with permeability. However, attempts to evaluate the relationships between permeability and pore size distribution were proposed in several research works.7,24,25,31 Here, the researchers used the mean pore size D50 to represent PSD, and Rezaee et al. 31 have found that this parameter yielded the best correlation coefficient for permeability. Epps and Leonas 32 have also found that air permeability was most highly correlated with mean pore size for the nonwoven samples. Epps and Leonas 32 stated that the mean pore sizes involved in the porometry test were also the size pores that were mostly involved in air permeability for spun-laced fabrics. Neither minimum nor maximum pore size was primarily responsible for air flow when the air permeability test was performed at the standard pressure differential. The relationships between the MFPD, or in other words D50, and water and air permeability are shown in Figure 7.
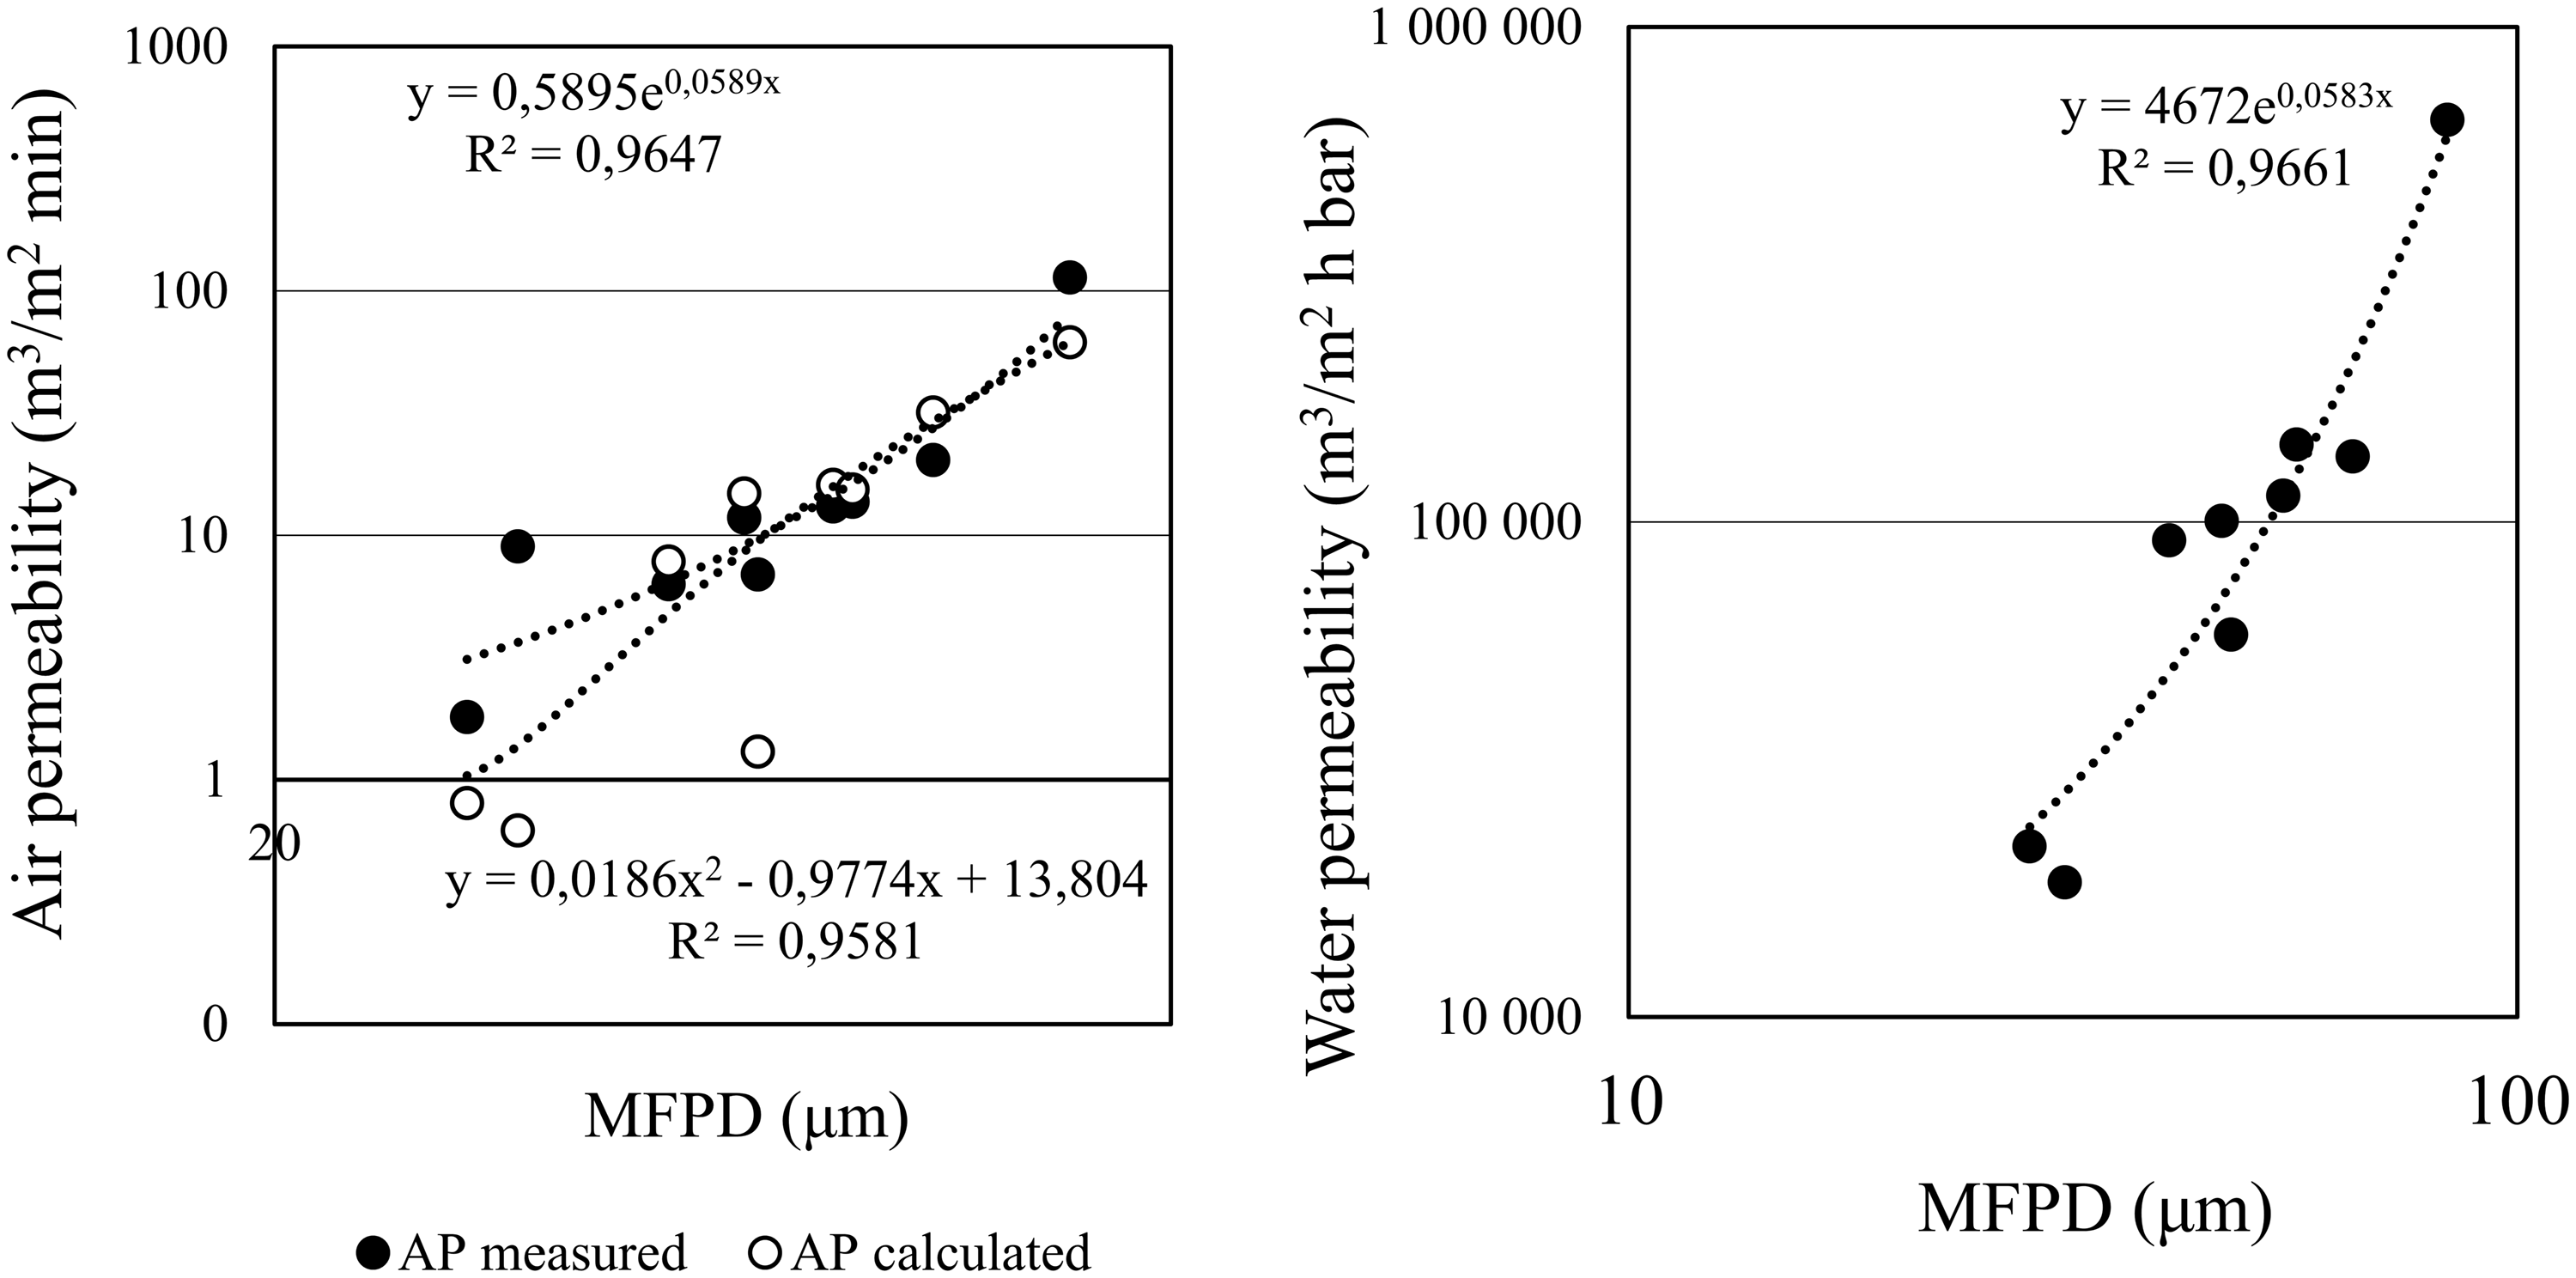
Relation between air permeability and mean flow pore diameter (MFPD) on the left and water permeability calculated at 200 Pa and MFPD on the right.
As can be seen in Figure 7, relatively satisfactory relationships existed between the MFPD and water and air permeability. The increase in the pore diameter corresponded to the increase in permeability. In the case of water permeability and the air permeability measured with a Textest FX 3300, the correlation could be expressed by an exponential function with the R2 being 0.96–0.97. The relationship between the calculated air permeability and MFPD could, in turn, be described by a polynomial function; R2 was 0.96. As can be seen in Figure 7, the data were scattered. Several reasons can explain such an outcome. First, the MFPD represents only a specific pore size in a medium, whereas the permeability results from all the pores. A woven filter medium sample consists of numerous pores with different pore diameters. In addition, the pressure drop through a cloth is related to the flow velocity through one pore of the mean diameter. In contrast, the actual flow velocity is associated with the volumetric flow rate through pores of all sizes in the sample. Thus, a single pore size cannot account for the total area of flow and using a single value of the mean pore diameter for characterizing the pore structure is not reliable or relevant. Second, as Tanaka et al. 25 have mentioned, the pore diameter is assumed to be an ideal cylindrical shape in the porometry. However, the shape of an actual pore in the woven filter media is not ideal and cylindrical. This fact can be easily recognized from the SEM images presented in Figure 2.
Air and water permeability correlations
Air and water permeability values are presented in Table 1. It should be noted that water permeability values presented in this table and calculated for 200 Pa might be erroneous. The calculations were done by extrapolating the measured data to 200 Pa used in the air permeability measurements. Water in the pipe of the equipment used to measure water permeability did not last till this low pressure. Depending on the sample, the end pressure was about 1800 and 6200 Pa. The flow might be different at 200 Pa and when the pressure is nine or even 31 times higher. Unfortunately, the water permeability equipment did not make it possible to measure this characteristic at low pressures, while the Textest FX 3300 could not measure air permeability at high pressures. Therefore, the comparison of these two pieces of equipment was impossible to implement correctly. However, the values obtained from the dry curve at different pressures were suitable for comparison with the water permeability measurements.
The measured values of water and air permeability at differential pressures of 0.1 to 0.5 bar and calculated in similar units of m3/m2 s are presented in Table 3. According to this table, air permeability was 20 or even 116 times higher than water permeability, depending on the sample. In their work, Loosveldt et al. 13 have mentioned that the water permeability coefficient was systematically one or two magnitudes lower than the air permeability of a mortar. Bamforth 12 has compared the permeability coefficients for concrete samples and found that air permeability can be as large as 100 times higher than water permeability at high-pressure values using a partial vacuum. Moreover, this difference was more significant for concrete with a low permeability. In the present study, the difference between air and water permeability in similar units of m3/m2 s was also the lowest for the high permeable sample 6. Klinkenberg’s 14 theory of slip in the flow of gas has explained this difference in permeability. The gas close to a capillary wall has a finite velocity and therefore the quantity of gas flowing through this capillary is larger than would be predicted from Poiseille’s equation.12,14 In their respective studies, Bloomfield and Williams 6 and Loosveldt et al. 13 have observed the same phenomena and associated it with the Klinkenberg slippage effect as well.
Air and water permeability measured at a differential pressure of 0.1 to 0.5 bar and calculated in units of m3/m2 s
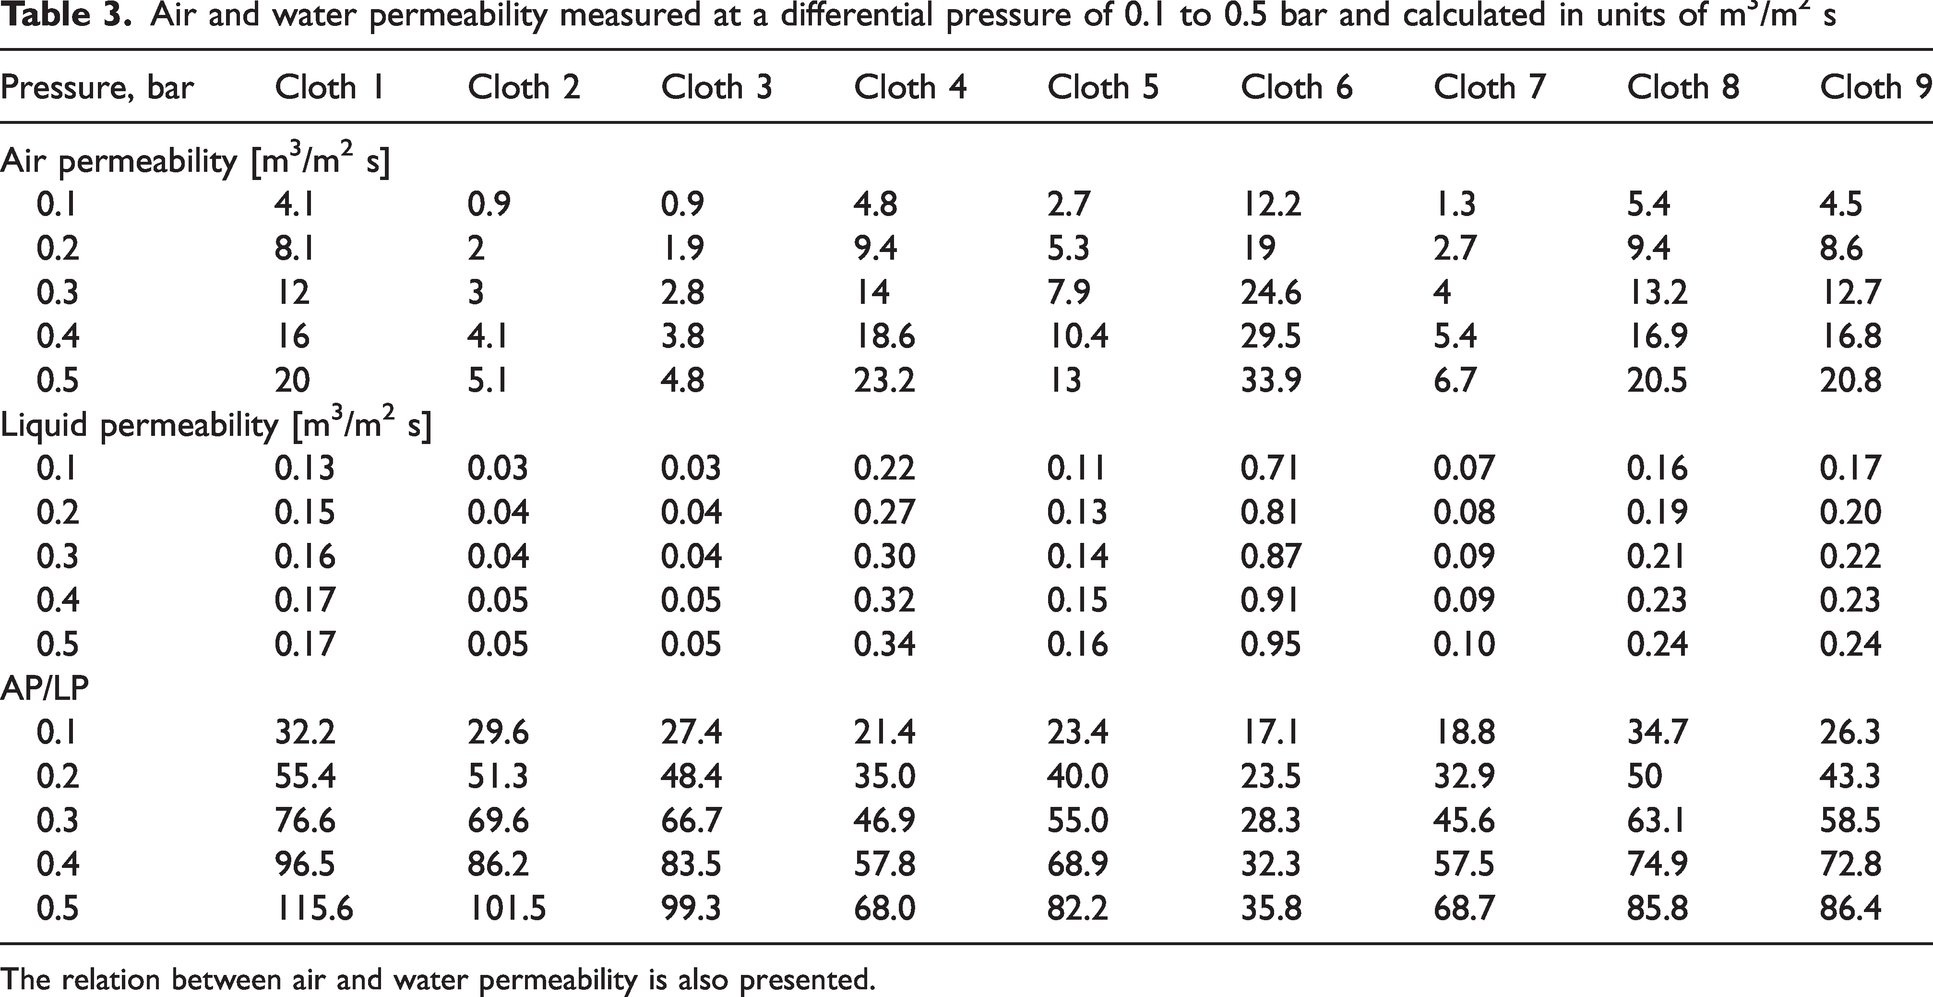
The relation between air and water permeability is also presented.
As can be seen in Figure 8, the difference between the air and liquid permeability increased with the increase in pressure. For example, this difference was 32.2 at 0.1 bar and increased 3.6 times for the pressure of 0.5 bar, becoming 115.6. A similar trend was observed for the rest of the cloths studied in the present study. According to Figure 8, this trend could be described by a linear function. As can be seen in Figure 6(a), air permeability increased with the pressure, while according to Figure 6(b), the trend was the opposite for the liquid permeability. The higher the pressure used in the measurement, the lower the liquid permeability was. The reason for such a phenomenon was explained in the section on water permeability. Therefore, the difference described in Figure 8 was expected. In other words, at the same pressure of 0.5 bar, many more gas molecules passed through the pore than water molecules.
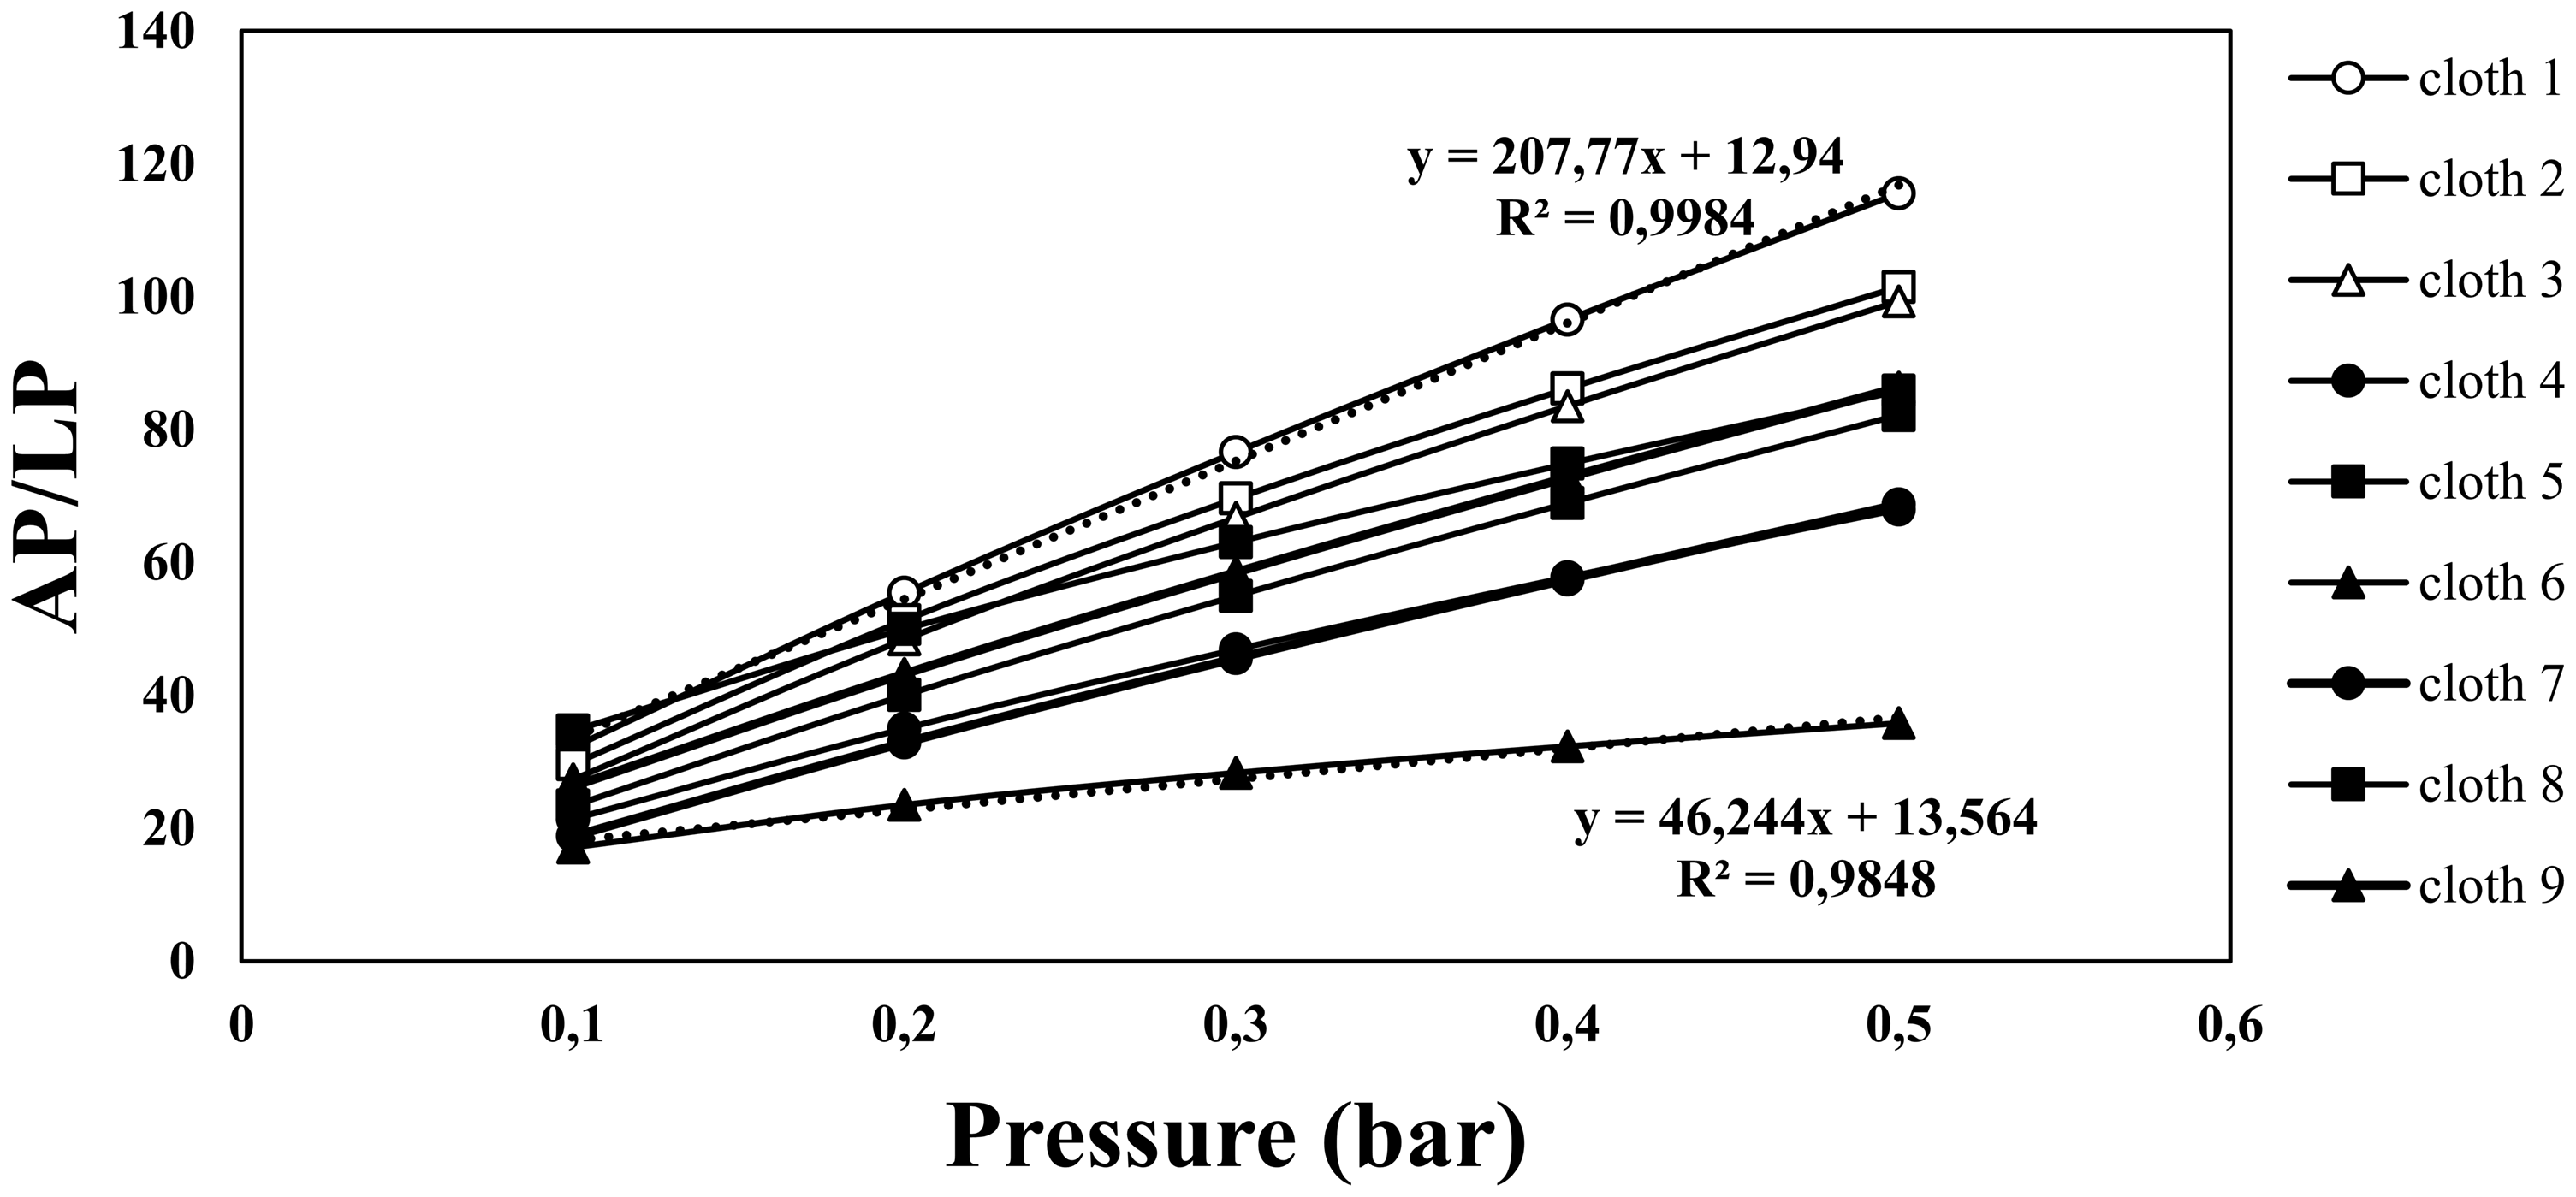
Difference between air and liquid permeability depending on the applied pressure. The relation between air and water permeability is also presented.
The correlation between the liquid and air permeability measured and calculated in similar units was also studied and is shown in Figure 9. According to this figure, the relationship between air and liquid permeability could be described by

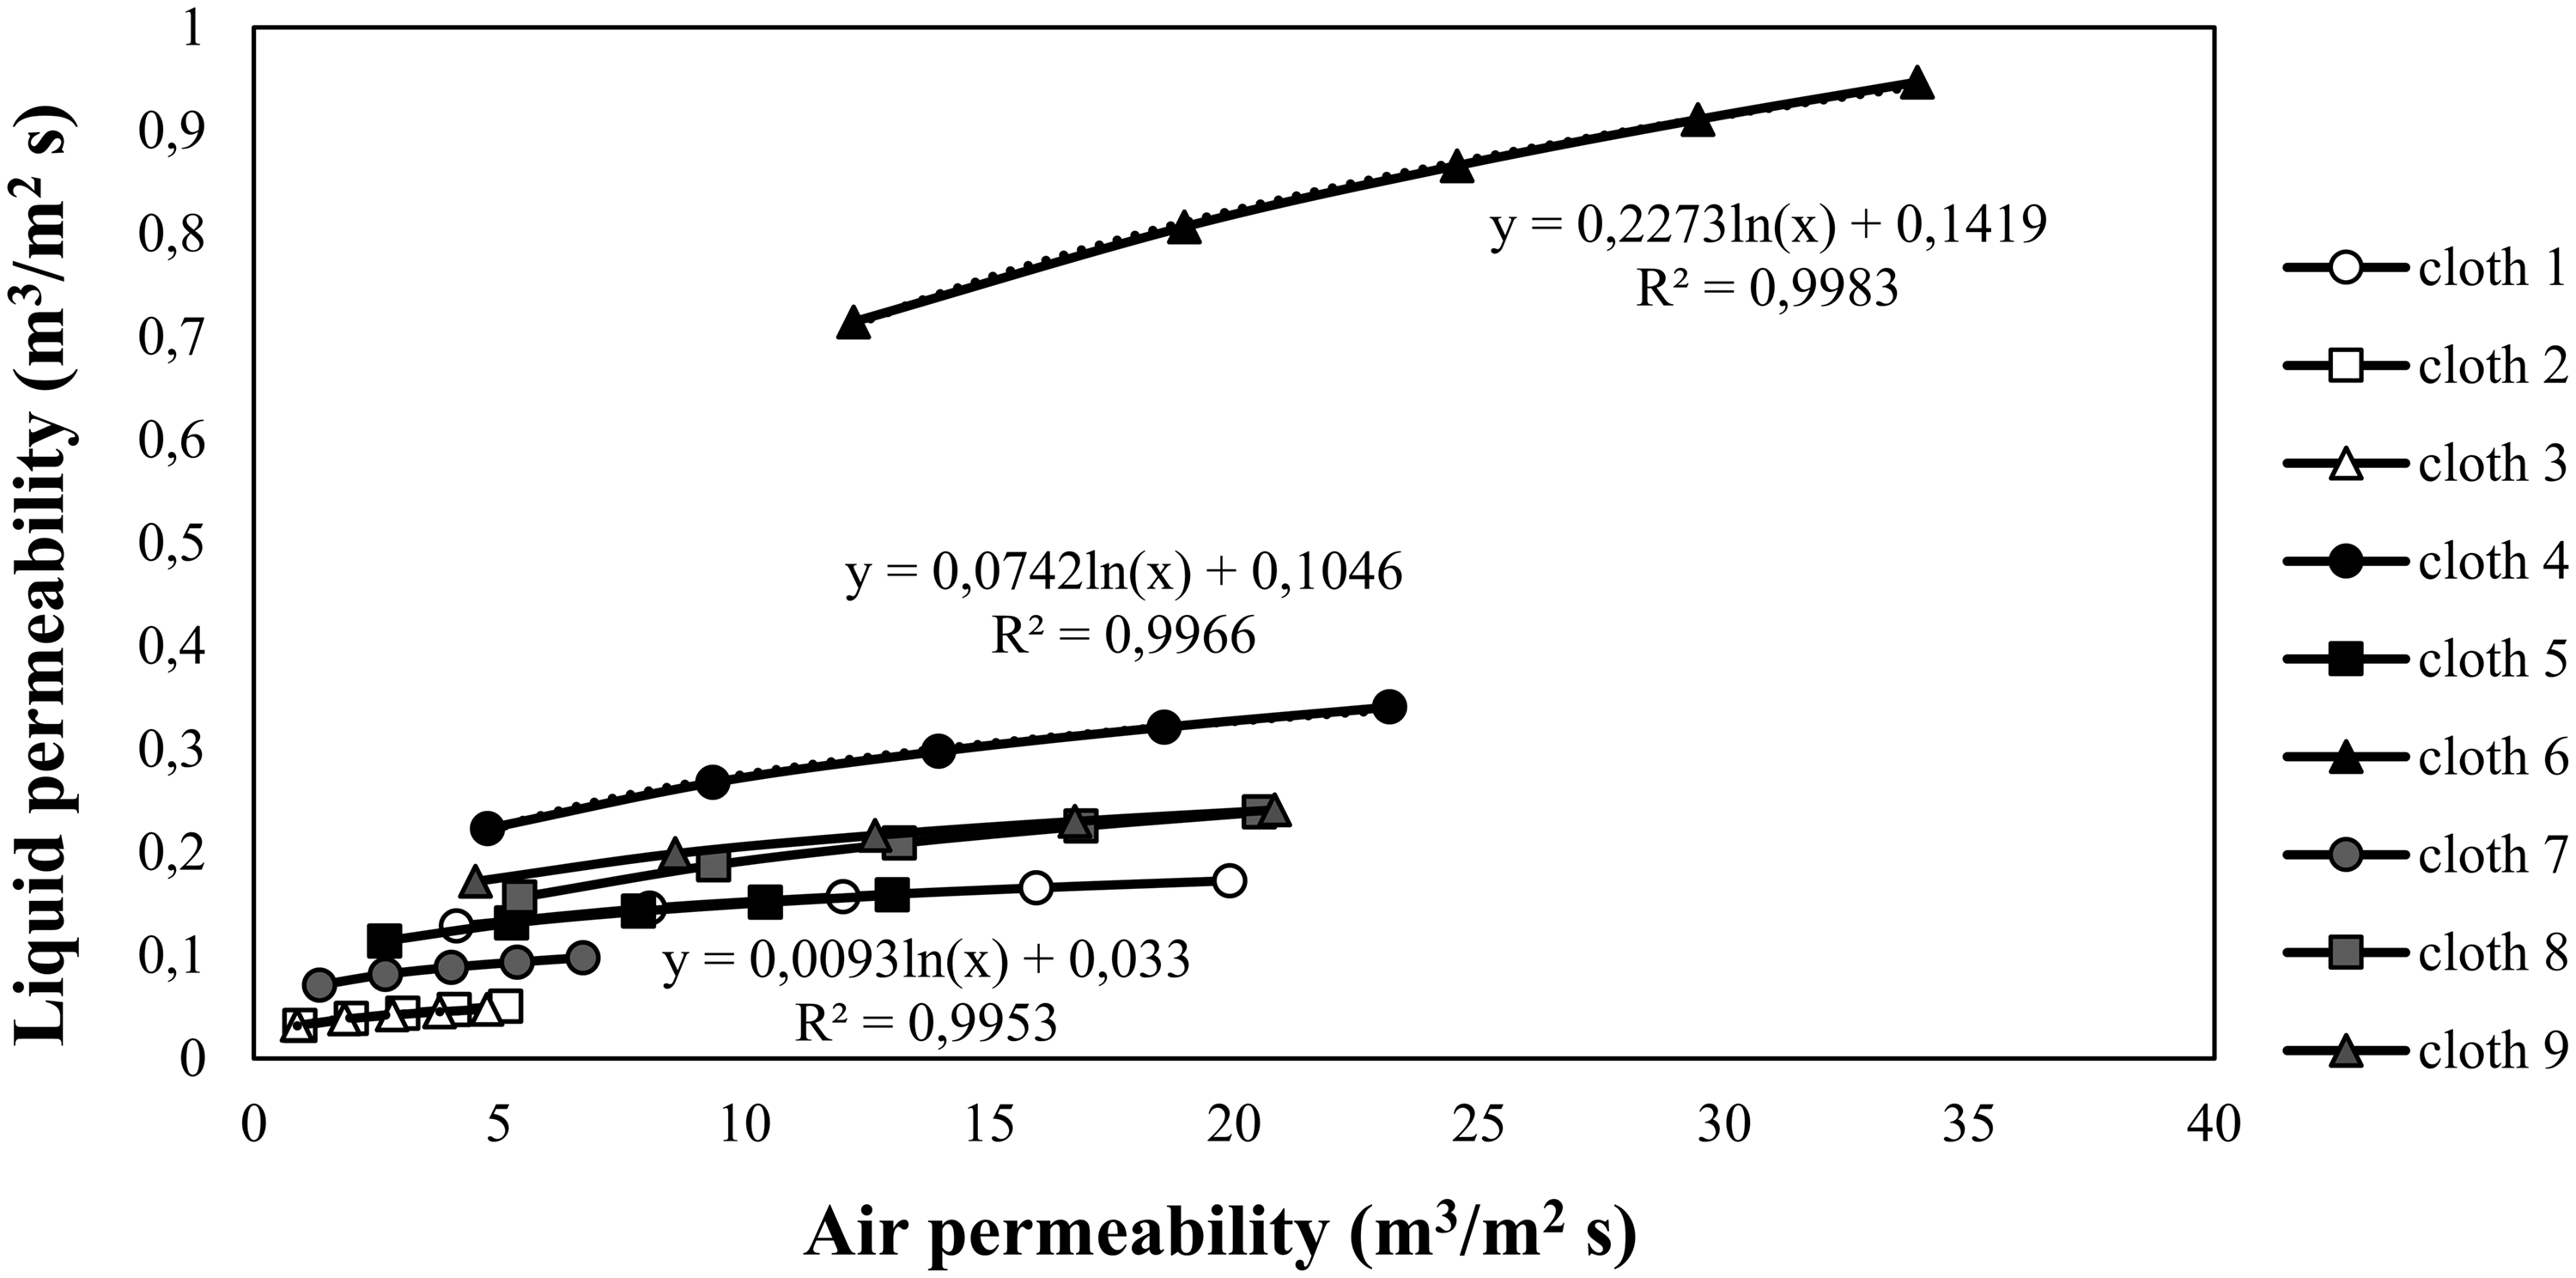
Correlations between liquid and air permeability measured and calculated in similar units of m3/m2 s.
Conclusions
Currently, the characterization of woven filter media in wet filtration is limited to air permeability and, in some rare occasions, to the pressure drop. Essential performance characteristics, such as water permeability, the pore size and the pore size distribution, are still not included in the characterization practice. Although air and water are both fluids, evaluating the performance of a filter cloth for wet filtration by air permeability only might lead to erroneous conclusions. Another crucial parameter – the pore size distribution of a woven filter medium – is rarely discussed, and including this in filter media characterization might also provide valuable insights regarding the actual filtration performance. Therefore, the present study aimed to investigate the performance-related characteristics of woven filter media, such as air and liquid permeability and pore size distribution, and to investigate, find and describe the correlations between these characteristics using empirical equations. These equations could be further used to simplify the characterization procedure or become the basis of a media indexing system in the future.
The investigation of the performance-related characteristics showed their importance in the characterization of woven filter media. Although the structural parameters might provide some ideas about the material performance, the pore size and the pore size distribution diagram illustrated accurate information about the pores and their relationship with the airflow passing through them in percentages. In addition, the correlation between the MFPD and permeability was found. The permeability increased with the increase of the pore diameter and was described by an exponential function in the case of water permeability and air permeability measured with the Textest FX 3300. For air permeability measured with the Textest FX 3300, the function was AP = 0.5895e0.0589MFDP, while for water permeability, it was LP = 4672e0.0583MFPD. The relationships between the air permeability measured on the porometer were described by a polynomial function, AP = 0.0186MFPD2 – 0.9774MFPD + 13.804.
Air permeability was found to be dependent on gas pressure: as pressure increases the air permeability increases as well. In the case of a highly permeable cloth, the rise in the pressure can lead to a change in the flow, that is, it might change from laminar to turbulent. Such changes provoke changes in the slope. The permeability–pressure dependency is described by a power function in this case, which makes the prediction of the permeability by using only one single value measured at a very low pressure of 200 Pa according to the standard D737-04 erroneous. Consequently, the use of several differential pressures to evaluate the air permeability would bring benefits to the cloth users.
Water permeability measured at a declining pressure and calculated in m3/m2 h bar decreased as the pressure increased. This characteristic was found 20 or even 116 times lower, depending on the sample, than air permeability when both were calculated in m3/m2 s. Due to Klinkenberg’s slippage effect, this difference was expected. Nevertheless, the dependency between air and water permeability could be described by a logarithmic function.
As a result of the present study, it has been proved that a single air permeability value is not enough to characterize the woven filter media. Adequate and modern characterization requires incorporating several different parameters, such as air and water permeability and pore size distribution.
Supplemental Material
sj-pdf-1-trj-10.1177_00405175231211953 - Supplemental material for Woven filter media used in wet filtration processes: investigation of pore size distribution, air and water permeability and finding correlations between them
Supplemental material, sj-pdf-1-trj-10.1177_00405175231211953 for Woven filter media used in wet filtration processes: investigation of pore size distribution, air and water permeability and finding correlations between them by Marina Ängeslevä, Riina Salmimies, Tuomas Sihvonen and Antti Häkkinen in Textile Research Journal
Footnotes
Data availability
All data generated or analyzed during this study are included in this published article. All tables and figures are the authors’ original work, and no permissions are required.
Declaration of conflicting interests
The author(s) declare that they have no known competing financial interests or personal relationships that could have appeared to influence the work reported in this paper.
Funding
The author(s) disclosed receipt of the following financial support for the research, authorship, and/or publication of this article: Teknologiateollisuuden 100-vuotissäätiö Metallinjalostajien rahasto and Tekniikan Edistämissäätiö are kindly acknowledged for their financial support.
References
Supplementary Material
Please find the following supplemental material available below.
For Open Access articles published under a Creative Commons License, all supplemental material carries the same license as the article it is associated with.
For non-Open Access articles published, all supplemental material carries a non-exclusive license, and permission requests for re-use of supplemental material or any part of supplemental material shall be sent directly to the copyright owner as specified in the copyright notice associated with the article.