
Abstract
The pore structure of coal reservoir is the primary space of natural gas adsorption and storage, and the structural characteristics of coal in thermal evolution are crucial for the enrichment and exploration of coalbed methane. However, the current research mainly concentrates on the pore structure change process in actual geology, and there is a lack of continuous analysis of the pore structural evolution characteristics of coal samples with different maturity through hydrous pyrolysis simulation experiments. Coal samples (Ro = 0.6%) were collected from the Hedong coalfield, and hydrous simulation experiments (a total of 5 coal samples, temperatures from 250°C to 450°C, 50°C interval, 24 h duration) were carried out using a large amounts of water and low-rank bituminous coal samples (1.5 mL water : 1 g coal) in a pyrolysis closed system to investigate the evolutionary of the pore structure parameters during the hydrocarbon-generating process. The results showed that the pore volume and specific surface area of ultra-micropore consistently dominated the pore structure. For micropores and transition pores, the aromatization and side-chain breakage result in a decrease in specific surface area and pore volume. The dissolution of organic acids and the release of volatile components lead to an increase in the specific surface area and pore volume of the transitional pores. Furthermore, the intensification of coalification, the rearrangement of pore structures, causes the secondary pores to be compressed, and the transitional pores further decrease. HQ-O exhibits a rough pore surface and an uneven pore structure, while as the temperature increases, the pore surface of HQ-250-HQ-450 becomes relatively rougher and the pore structure grows more uniform. With the increase of total gas yield, the coal structure is dense, resulting in the pores reduction or closure, and pore volume and the specific surface area decrease. Additionally, water promoted the minerals dissolution and the migration of Si and Al within the coal samples, which swell and deform the coal skeleton and merge to form new pores. The geological evolution of coal under the influence of temperature, gas generation, and water-coal interaction is divided into three stages, and the pore structural evolution model is established. By studying the pore structure evolution of coal samples at different coalification stages through hydrous pyrolysis simulation provides important scientific basis and guidance for the exploration and development of CBM resources in actual geological characteristics of coal reservoirs.
Keywords
Introduction
Coal is a porous medium with strong heterogeneity and anisotropy (Gan et al., 1972), and its pore system attributes directly affect the occurrence form of coalbed methane (CBM), the interactions among gas, water, and the coal matrix, as well as the diffusion and migration of CBM (Fu et al., 2005; Rodrigues and Lemos de Sousa, 2002; Zhen et al., 2023). The spatial distribution of pore structures are essential parameters for evaluating coal reservoir properties. The evolution of pore systems of different coal ranks reflects the response mechanism of coal metamorphism. Coalification significantly affects the physical properties and pore development in coal reservoirs and is a crucial factor in controlling pore volume (PV), specific surface area (SSA), and methane adsorption and desorption behavior (Hou et al., 2020; Liu et al., 2017; Nie et al., 2015; Tao et al., 2018; Zhang et al., 2022). Consequently, understanding evolutionary patterns of pore system across different coal ranks has significant implications for the efficient exploration and development of CBM resources (Chen et al., 2015; Hou et al., 2020; Li et al., 2023; Ren et al., 2021; Xin et al., 2019; Yan et al., 2020).
The influence of coalification on the pore system dynamic evolvement has become the core focus of numerous studies. For instance, Li et al. (2015) proposed that coalification is the dominant factor affecting pore structure, and Ren et al. (2021) observed that the macropores decrease and micropores increase with increasing of metamorphism. Similarly, Nie et al. (2015) reported that the mesopore structures are primarily affected by coalification in low-rank coals, whereas the smaller mesopores and micropores are gradually dominated by intensive compaction in high-rank coal. However, some studies suggest that the effect of coalification on pore system development is more complex, and there is no obvious relationship between pore structure and coal rank (Zhang et al., 2020). Hazra et al. (2025) established a quantitative correlation between pore complexity and thermal maturity using coal samples of varying ranks from the Raniganj and Jharia basins in India. Moreover, Yan et al. (2020) demonstrated that the total PV and SSA follow an asymmetric U-shaped trend with the increasing coal rank. These findings indicate that the development of coal reservoir pores is not only governed by thermal maturity, but also affected by factors such as compaction, mineral constituent, and formation water dissolution (Guan et al., 2022). There is a large amount of sedimentary water in the original depositional environment of coal reservoirs, which participates in a series of processes such as accumulation, compaction, drainage, and hydrocarbon generation, significantly affecting the pore structure characteristics (Liu et al., 2018; Si et al., 2021). For instance, Song et al. (2023) reported that water immersion experiments rarely effect on altering the pore morphology of coal but reduced the pore SSA while increasing total PV and pore diameter (PD). Nevertheless, due to the variability in geological conditions of coal-bearing strata and the complexity of pore system, the combined effects of coal metamorphism and groundwater on the quantitative characterization of pore structure parameters remain insufficiently studied. To elucidate the development mechanisms of pore structure during thermal evolution, it is essential to examine the evolutionary process of pore systems in coal reservoirs under water participation during the thermal maturation and analyze the synergistic influence of temperature and water on pore development and evolution.
Hydrous pyrolysis simulation experiments provide a reliable method to simulate the water-coal reaction across various coalification processes and to replicate the hydrocarbon-generating characteristics of organic matter in geological bodies (Kotarba et al., 2021a, 2021b; Kotarba and Lewan, 2013; Luo and Zhong, 2020). The experiment covers the immature or low maturity to the over-mature stage, enabling the prediction of pore structure evolutionary processes in organic matter under the different temperature and pressure conditions (Cao et al., 2021). Previous hydrous pyrolysis simulation experiments have shown that thermal maturity influences the pore structure transformation (Chen et al., 2016; Harza et al., 2024; Luo and Zhong, 2020), the gas adsorption mechanism of organic matter (Hu et al., 2015; Tang et al., 2015; Valentine et al., 2021) and the role of water in organic matter evolution (Liu et al., 2023a). However, hydrous pyrolysis simulation studies on coal reservoirs have predominantly focused on gaseous hydrocarbon evolution, hydrocarbon isotopes fractionation, and secondary hydrocarbon generation (Duan et al., 2012, 2016; Gao et al., 2014; Kotarba and Lewan, 2004; Liu et al., 2016; Susilawati et al., 2016). There remains a significant gap in understanding the pore structural characteristics, particularly the pore evolution during hydrocarbon generation. Hydrous pyrolysis simulation experiments can not only facilitate the characterization of coal product pore structure but also elucidate the evolutionary mechanism of pore generation in coal reservoirs, providing theoretical support for the development practice of deep and shallow CBM reservoirs.
The low-rank bituminous coal (Ro = 0.6%) from the Hequ open-pit coal mine in the eastern Ordos Basin was selected as the studying object, and water and coal samples (1.5 mL : 1 g) was used to conduct a hydrous pyrolysis simulation experiment at 250°C–450°C (HQ-250-HQ-450), and the mechanism of temperature, water, and gas on the influence mechanism of pore structure dynamic evolvement of coal samples was systematically analyzed (Zhang et al., 2024). The primary purposes of this study are (1) to quantitatively characterize the pore size distributions across different coal ranks through low-temperature CO2 adsorption and N2 adsorption methods; (2) to analyze pore structural variation in coal samples throughout the coalification processes; (3) to explore the intrinsic relationships among vitrinite reflectance, fractal dimension, coal quality, pore SSA, and PV; and (4) to systematically examine the impact of water-coal reaction on evolution of pore texture parameters. The research results provide critical insights into the mechanisms by which coalification process on pore structure and provide theoretical foundation for enhancing CBM resource development strategies.
Experiment and methods
The procedures for coal samples collection and preparation, the operational methods of hydrous pyrolysis simulation experiment, the collection of coal and gas samples, as well as the methodologies for proximate analysis, elemental composition determination, and gas geochemical analysis, are comprehensively described in detail by Zhang et al. (2024). It is noteworthy that the pyrolysis experiments were conducted at temperature ranging from 250°C to 450°C (HQ-250–HQ-450) for 24 h. Among them, HQ-O was the original low-rank bituminous coal sample (Ro = 0.6%) from Hequ coal mine, which was the unprocessed original sample before pyrolysis simulation experiment. HQ-250 to HQ-450 were the coal samples obtained from the original coal samples after water-containing pyrolysis at 250°C to 450°C (Ro = 0.76%–1.65%). To avoid redundancy, detailed procedures are not repeated in this study. Figure 1 primarily illustrates the equipment diagram of the pyrolysis simulation experiment equipment. The following section focuses on the methodology for the pore structure analysis of coal samples in detail.
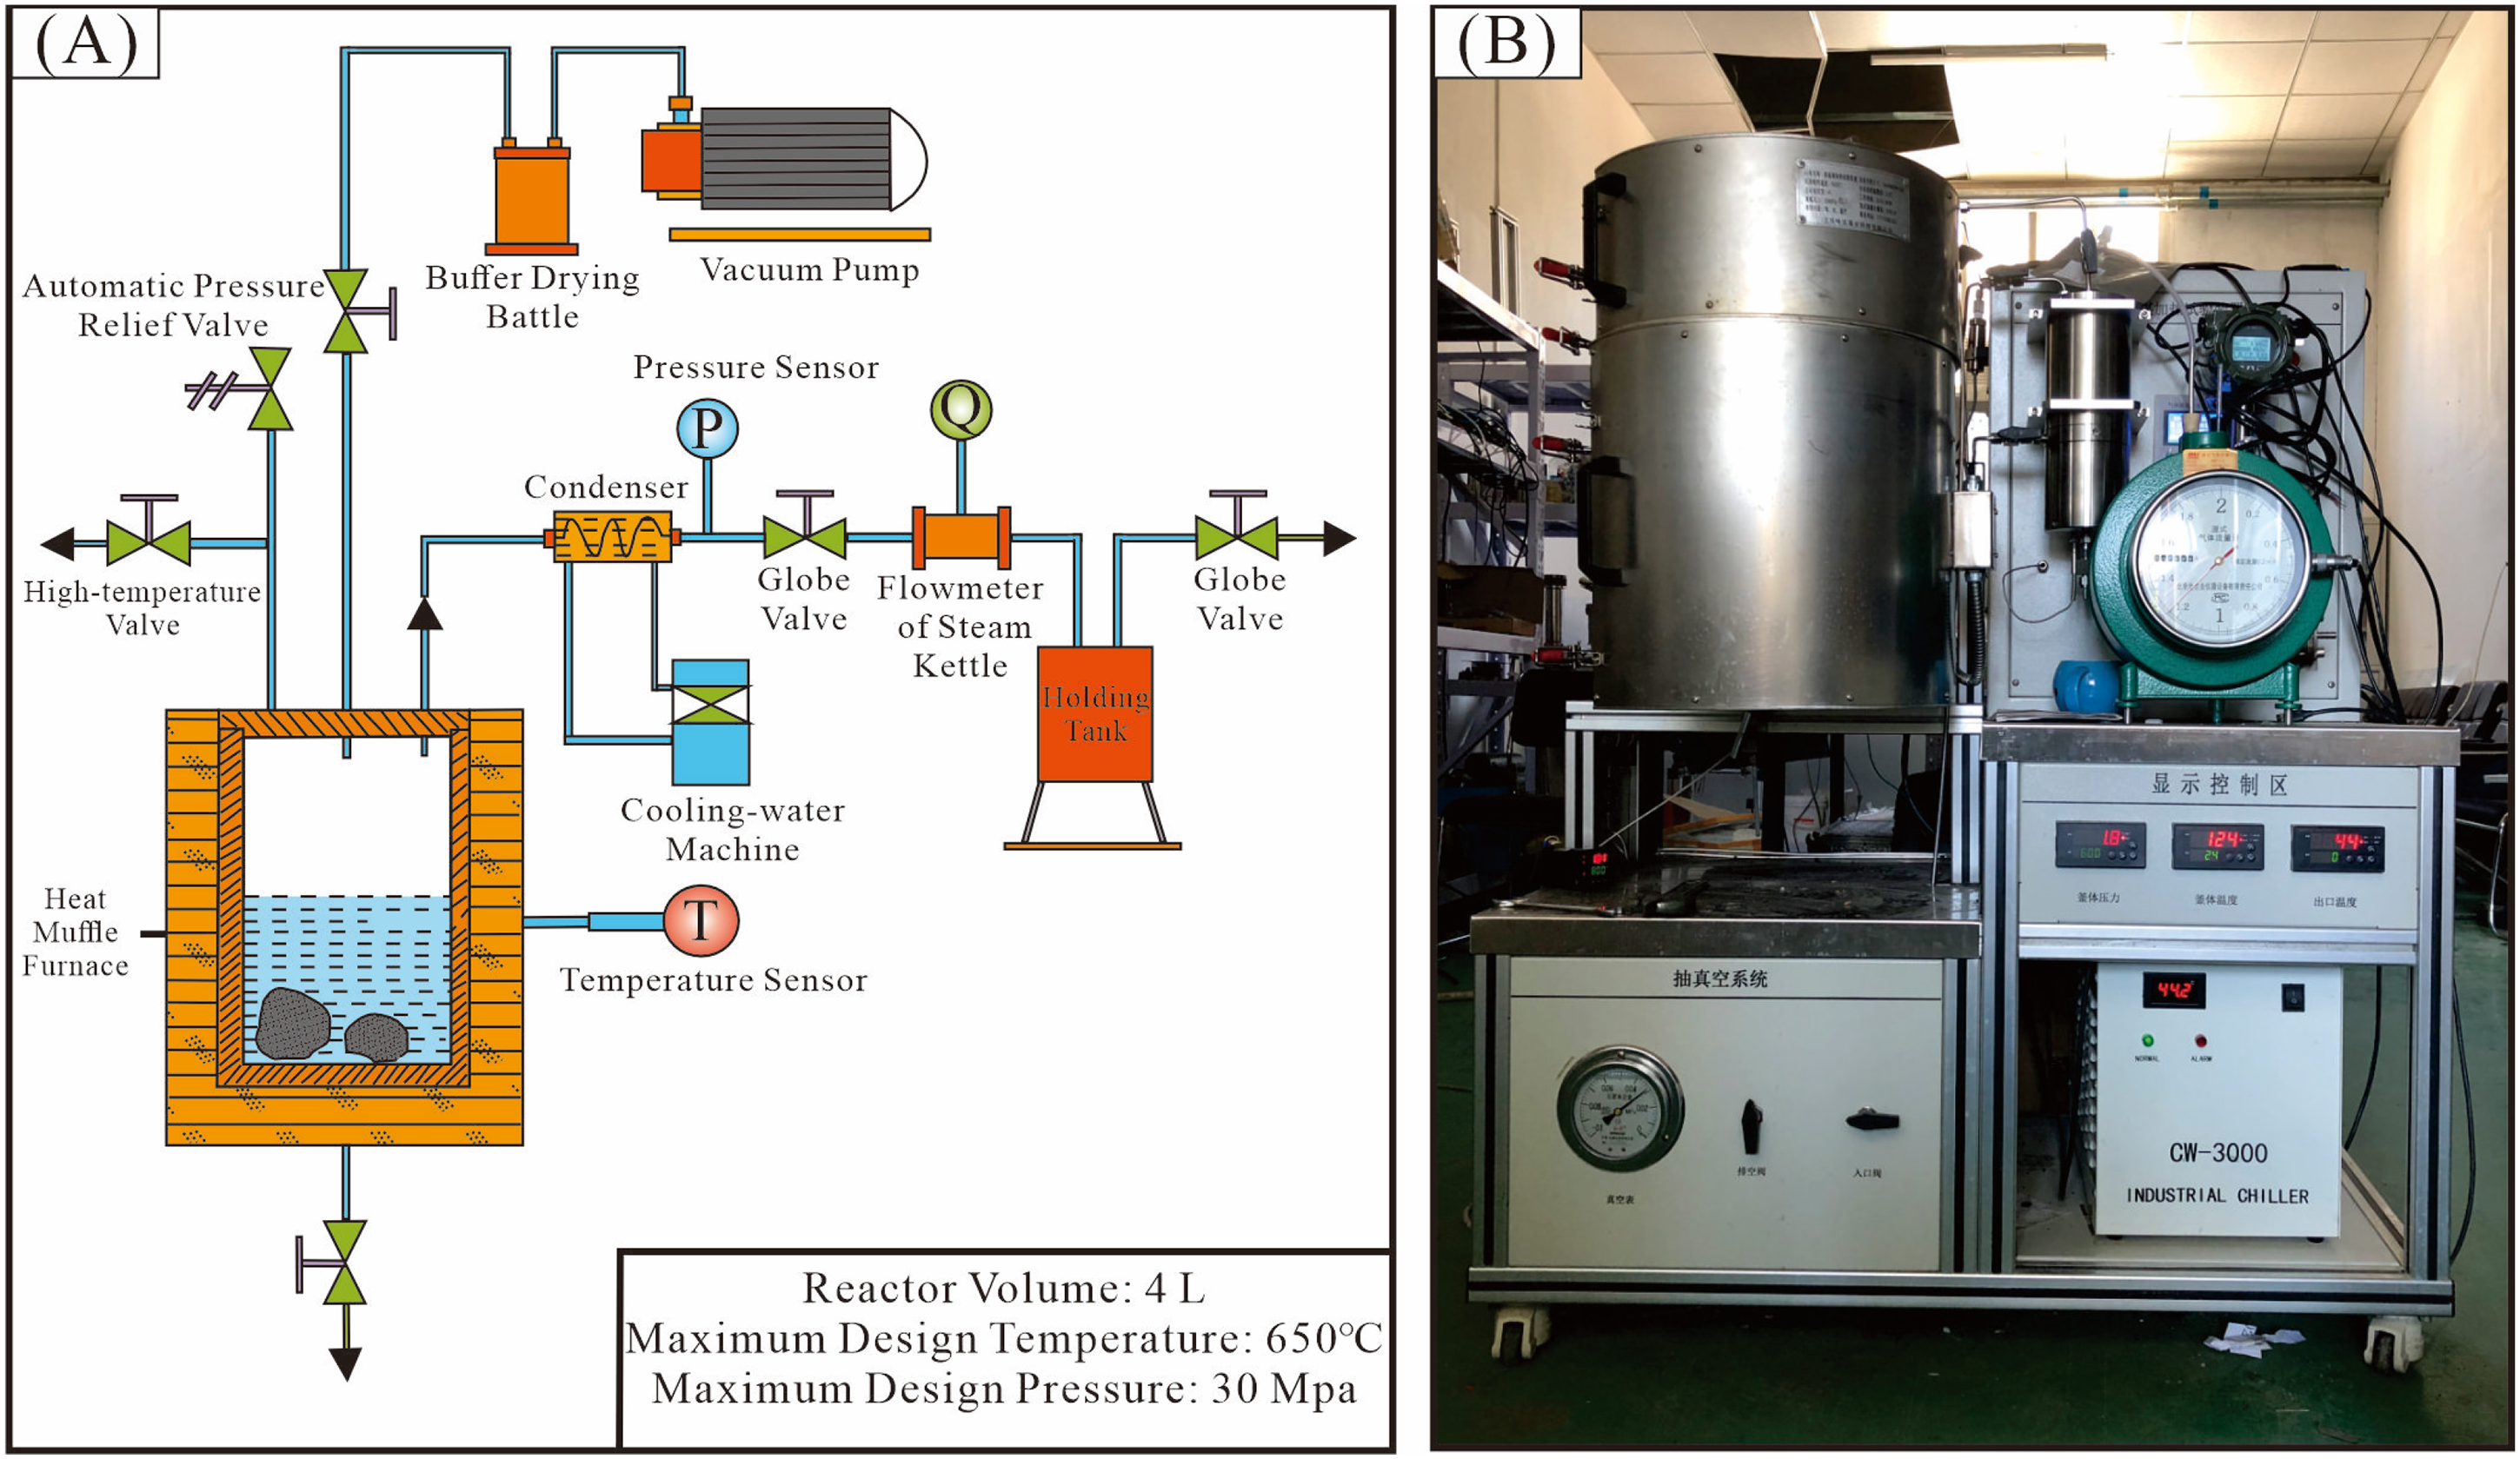
Diagram of the high temperature pyrolysis simulation experimental device for a closed system (Zhang et al., 2024).
The coal samples for the low-temperature nitrogen adsorption were crushed to 0.23–0.45 mm and subsequently subjected to vacuum drying at 105°C for 24 h to eliminate residual moisture. The Micromeritics ASAP-2460 automatic SSA analyzer was used in the experiment, which complies with Chinese oil and gas industry standard SY/T 6154-2019. The Brunauer–Emmett–Teller (BET) SSA, Barrett–Joyner–Halenda (BJH) PV, and PD distribution of all coal samples were determined at the relative pressure (P/P0) ranging from 0.01 to 0.995. The method primarily characterizes micropores, transitional pores and partial mesopores. The experimental equipment and procedures for the CO2 adsorption experiment were the same as those of the low-temperature liquid nitrogen adsorption experiment, and the same samples were used for both experiments. The CO2 adsorption experiment temperature was set at 273.15 K, and the instrument automatically carried out the adsorption experiments according to the set pressure conditions. The measurements were made of ultra-micropores with PD less than 2 nm (Gaucher et al., 2011).
Results
Samples composition characteristics
The vitrinite reflectance and the results of proximate and ultimate analyses for coal samples (HQ-O–HQ-450) at various temperature stages, are presented in Table 1. The original coal sample (HQ-O) exhibits low moisture content (Mad = 3.7%), medium-low ash yield (Aad = 16.8%), and high volatile matter content (Vdaf = 33.4%), characteristics typical of low-rank bituminous coal. For coal samples (HQ-250–HQ-450), the Mad content from 1.5% to 6.5%, and the Aad yield varies from 13.5% to 21.1%. The Vdaf content gradually decreases steadily from 31.3% at HQ-250 to 13.8% at HQ-450, while the fixed carbon content (FCdaf) progressively increases from 68.7% to 86.2%. The elemental composition of HQ-O includes carbon (C) at 55.0%, hydrogen (H) at 2.9%, oxygen (O) at 11.5%, nitrogen (N) at 1.0%, and sulfur (S) at 0.5% (Table 1). For HQ-250 to HQ-450, the content of C varies from 49.2% to 69.7%, while O and H contents range from 7.88% to 12.2% and from 2.5% to 4.2%, respectively. The contents of N (0.8%–1.3%) and S (0.4%–0.9%) remain relatively low (Table 1). Except for the significant decrease in the C content in HQ-450, an overall increasing trend in the C content is observed from HQ-250 to HQ-400 compared to HQ-O. With the simulated temperatures increase, the polycondensation degree of aromatic structure in coal gradually rises, and the contents of H and O decrease steadily from HQ-250 to HQ-450. The decreasing H/C atomic ratio with temperature reflects enhanced aromatization and coal maturity during the pyrolysis simulation. The vitrinite reflectance (Ro) increases from 0.8% at HQ-250 to 1.7% at HQ-450.
Proximate and ultimate analysis (%) along with vitrinite reflectance (%) of various coal samples.
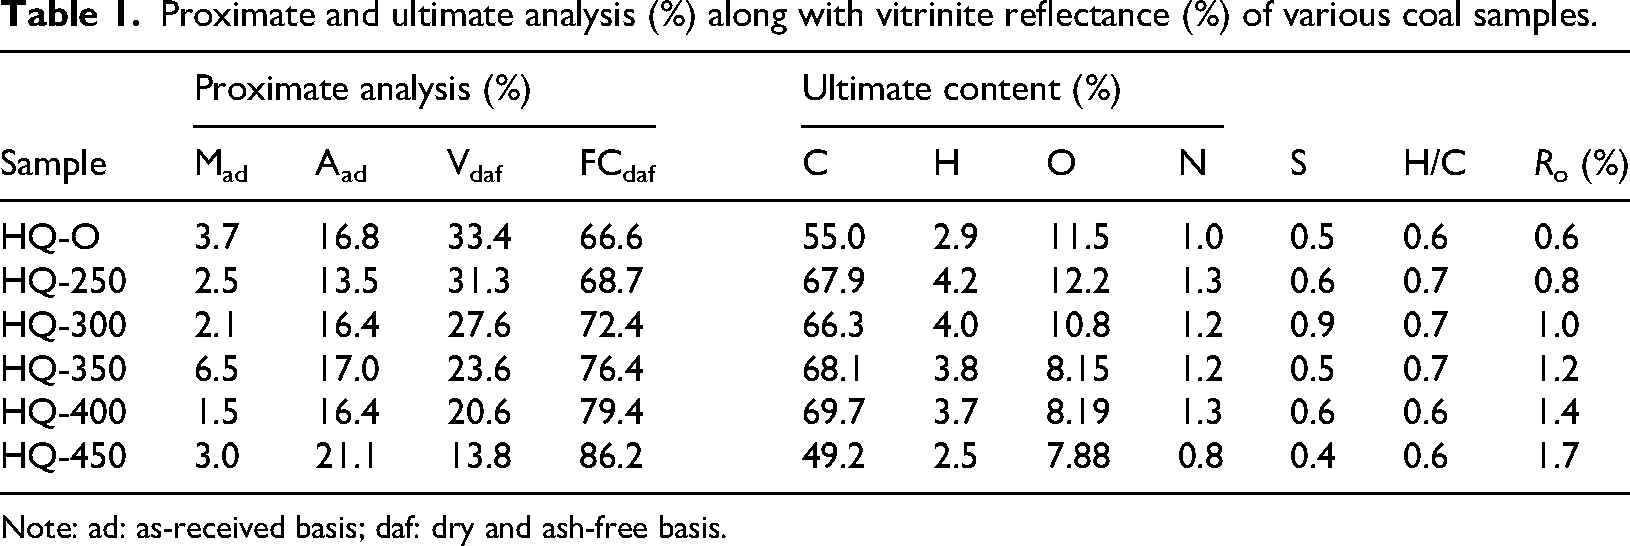
Note: ad: as-received basis; daf: dry and ash-free basis.
The results for gas yield and major elements have been comprehensively discussed in detail in Zhang et al. (2024) and are not reiterated here (Figure 2(A) and (B)). Major elements in coal constitute the primary components of inorganic matter, typically representing the main components of minerals. Combined with previous studies (Huang et al., 2021; Yang et al., 2018; Zhang et al., 2021) and the current analysis results, the dominant minerals in coal samples from this region mainly include clay minerals, quartz, sulfide minerals and oxide minerals, with clay minerals being the dominant component.
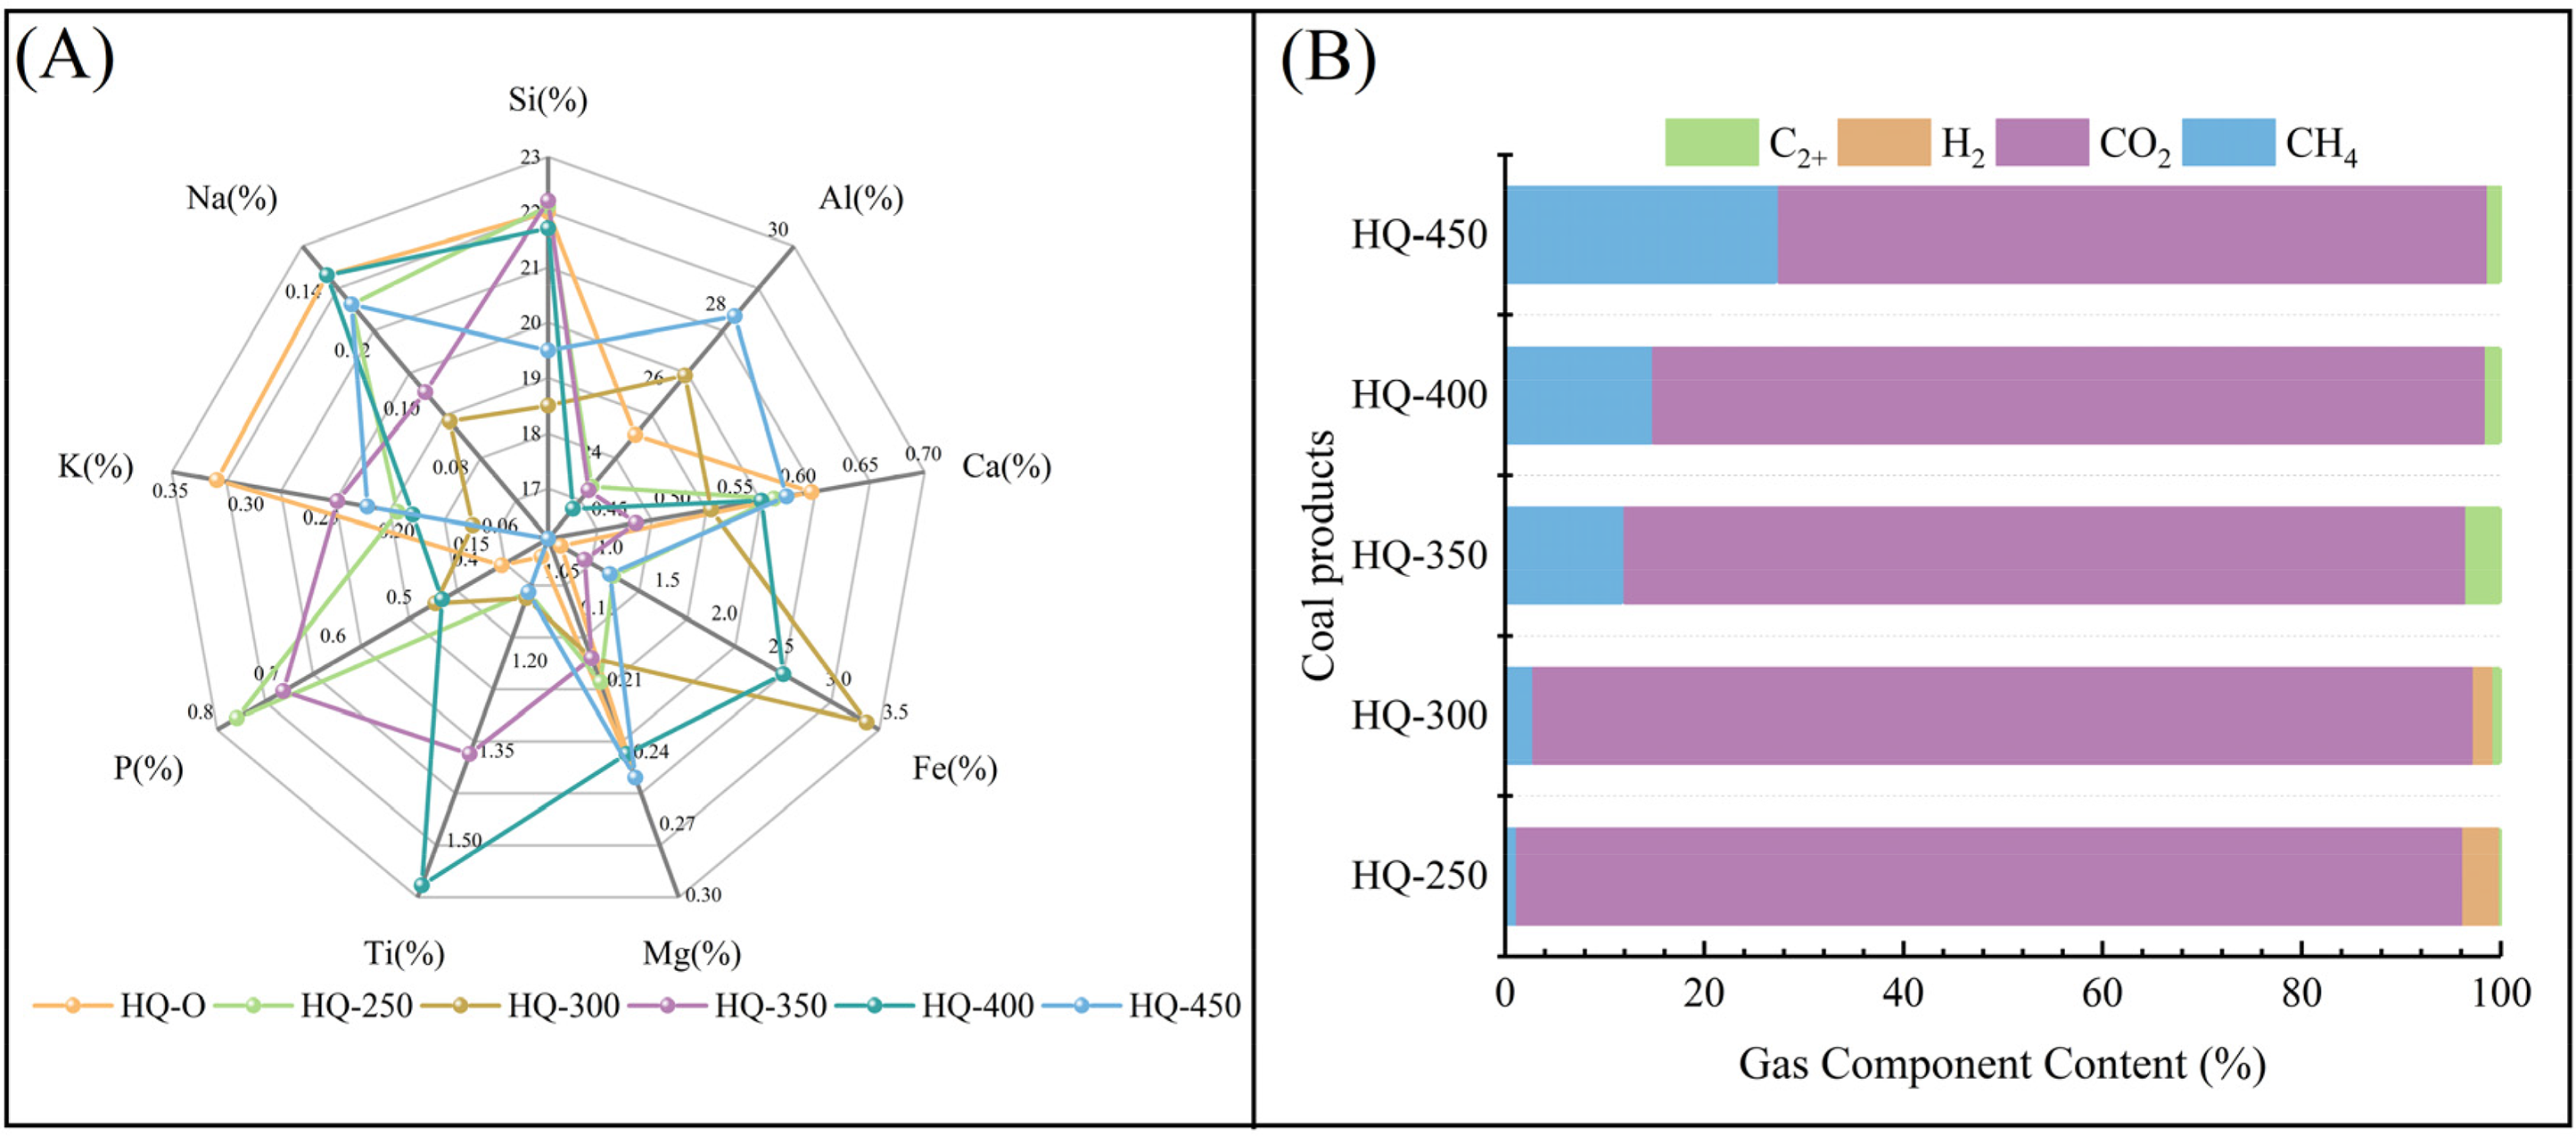
The proportion of major elements (%) (A) and gas components (%) (B) in coal samples (HQ-O–HQ-450).
CO2 adsorption test results
The CO2 adsorption isotherms of HQ-O–HQ-450 are presented in Figure. 3. The trends of the CO2 adsorption isotherms for coal samples are similar. In the relative pressure of P/P0 < 0.01, the adsorbing capacity increases rapidly, followed by a slower increase at P/P0 > 0.01. When P/P0 < 0.005, the adsorbing capacities of HQ-250, HQ-300, and HQ-350 are relatively similar, suggesting comparable development of ultra-micropores in these samples. At P/P0 < 0.01, the adsorption capacities of HQ-O, HQ-400, and HQ-450 converge. For P/P0 > 0.01, the maximum adsorption capacities of coal samples are as follows: HQ-250 > HQ-300 > HQ-400 > HQ-450 > HQ-O > HQ-350. The CO2 adsorption capacity of HQ-350 is the lowest, indicating that the least development of ultra-micropores. In contrast, the adsorption capacities of HQ-250 and HQ-300 are the maximum, which reflects that the ultra-micropores of HQ-250 and HQ-300 are relatively developed in the coal samples.
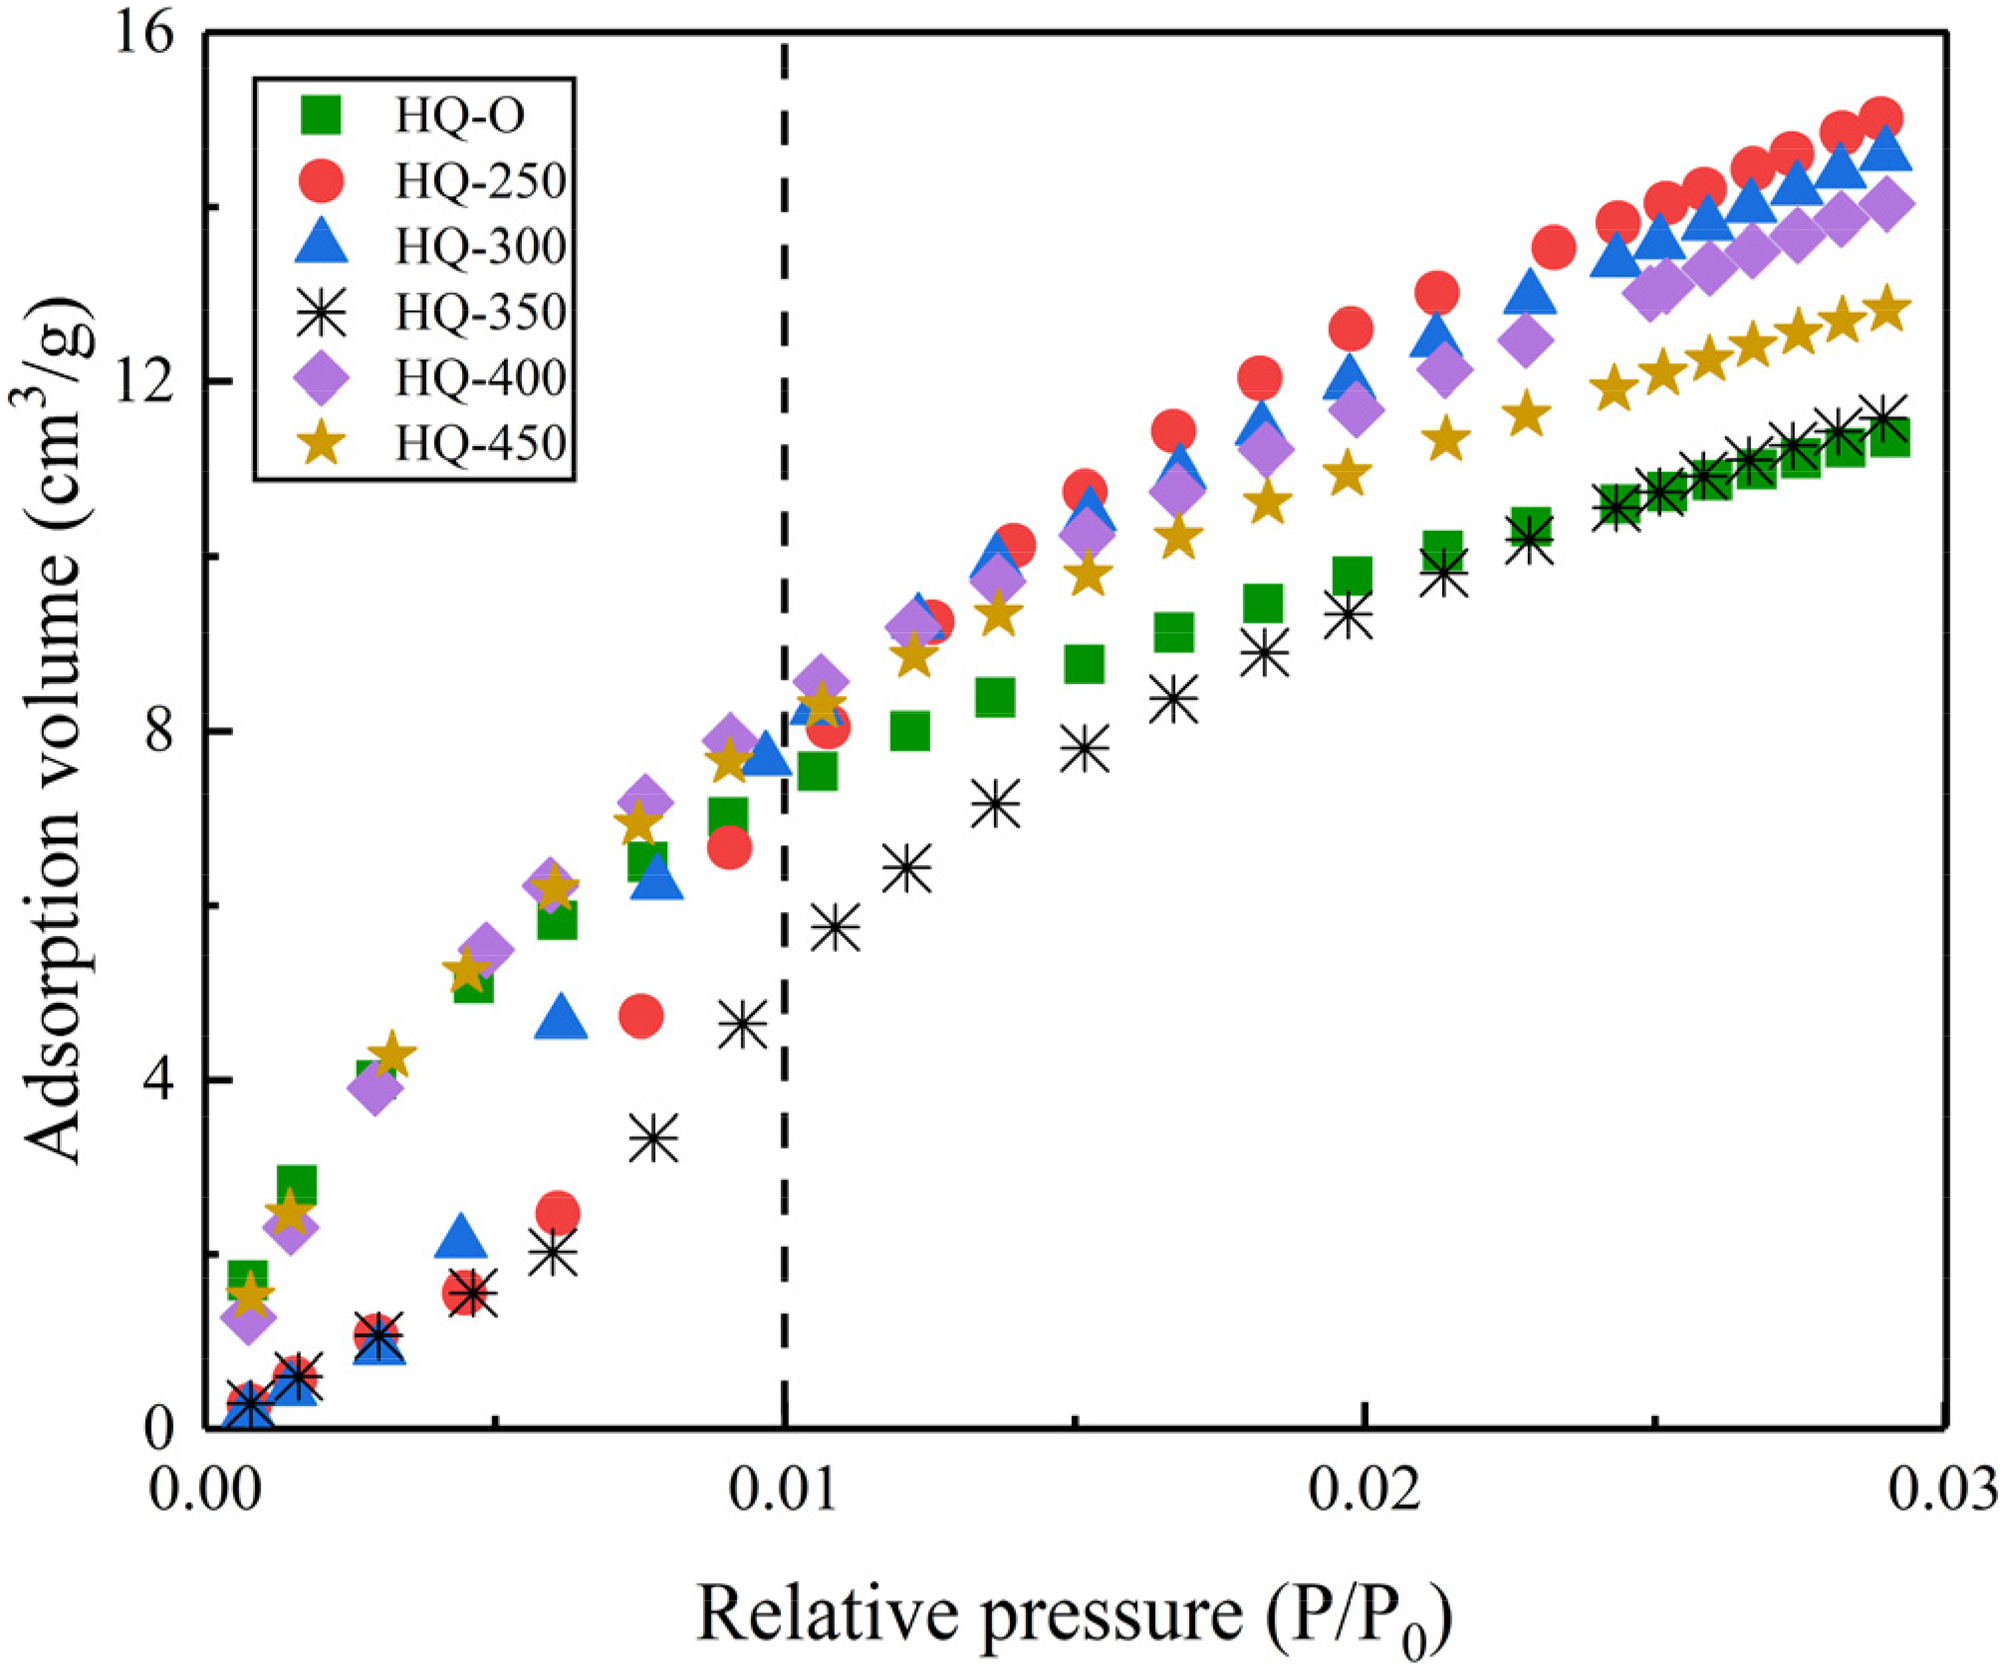
CO2 adsorption isotherms in coal samples (HQ-O–HQ-450).
The ultra-micropores size distribution demonstrates a characteristic “three-peak” pattern, with the peak positions of PV and SSA being highly consistent (Figure 4). The corresponding pore diameter at the three peaks are approximately 0.5–0.7 nm, 0.8–0.9 nm, and 0.1–1.1 nm. Among these, the ultra-micropores in HQ-250, HQ-300, and HQ-350 are predominantly distributed within the range of 0.7 nm to 1.0 nm, showing a relatively concentrated pore size distribution. From HQ-250 to HQ-400, both the SSA and PV generally decrease. The ultra-micropores of HQ-400 and HQ-450 are predominantly distributed in the range of 0.5–0.9 nm, and the pore size with a more dispersed pore distribution. The SSA and PV of HQ-400 and HQ-450 remain basically unchanged. When the PD exceeds 0.9 nm, only HQ-250 and HQ-350 contribute to PV and SSA, indicating that there is less micropore development. The “three-peak” distribution and corresponding peak pore size are primarily controlled by the macromolecular structure of coal during thermal maturation. The PV and SSA values derived from isothermal CO2 adsorption measurements for HQ-O to HQ-450 were calculated using the DFT model and are listed in Table 2. The SSA values of HQ-O–HQ-450 initially increased and then decreased overall, with values of 83.2, 87.5, 92.1, 81.8, 110.3, and 97.6 m2/g, respectively. The PV is highest in HQ-250 (38.6 × 10⁻³ cm3/g), followed by HQ-350 (23.2 × 10⁻³ cm3/g), while HQ-O has the lowest PV (17.3 × 10⁻³ cm3/g).
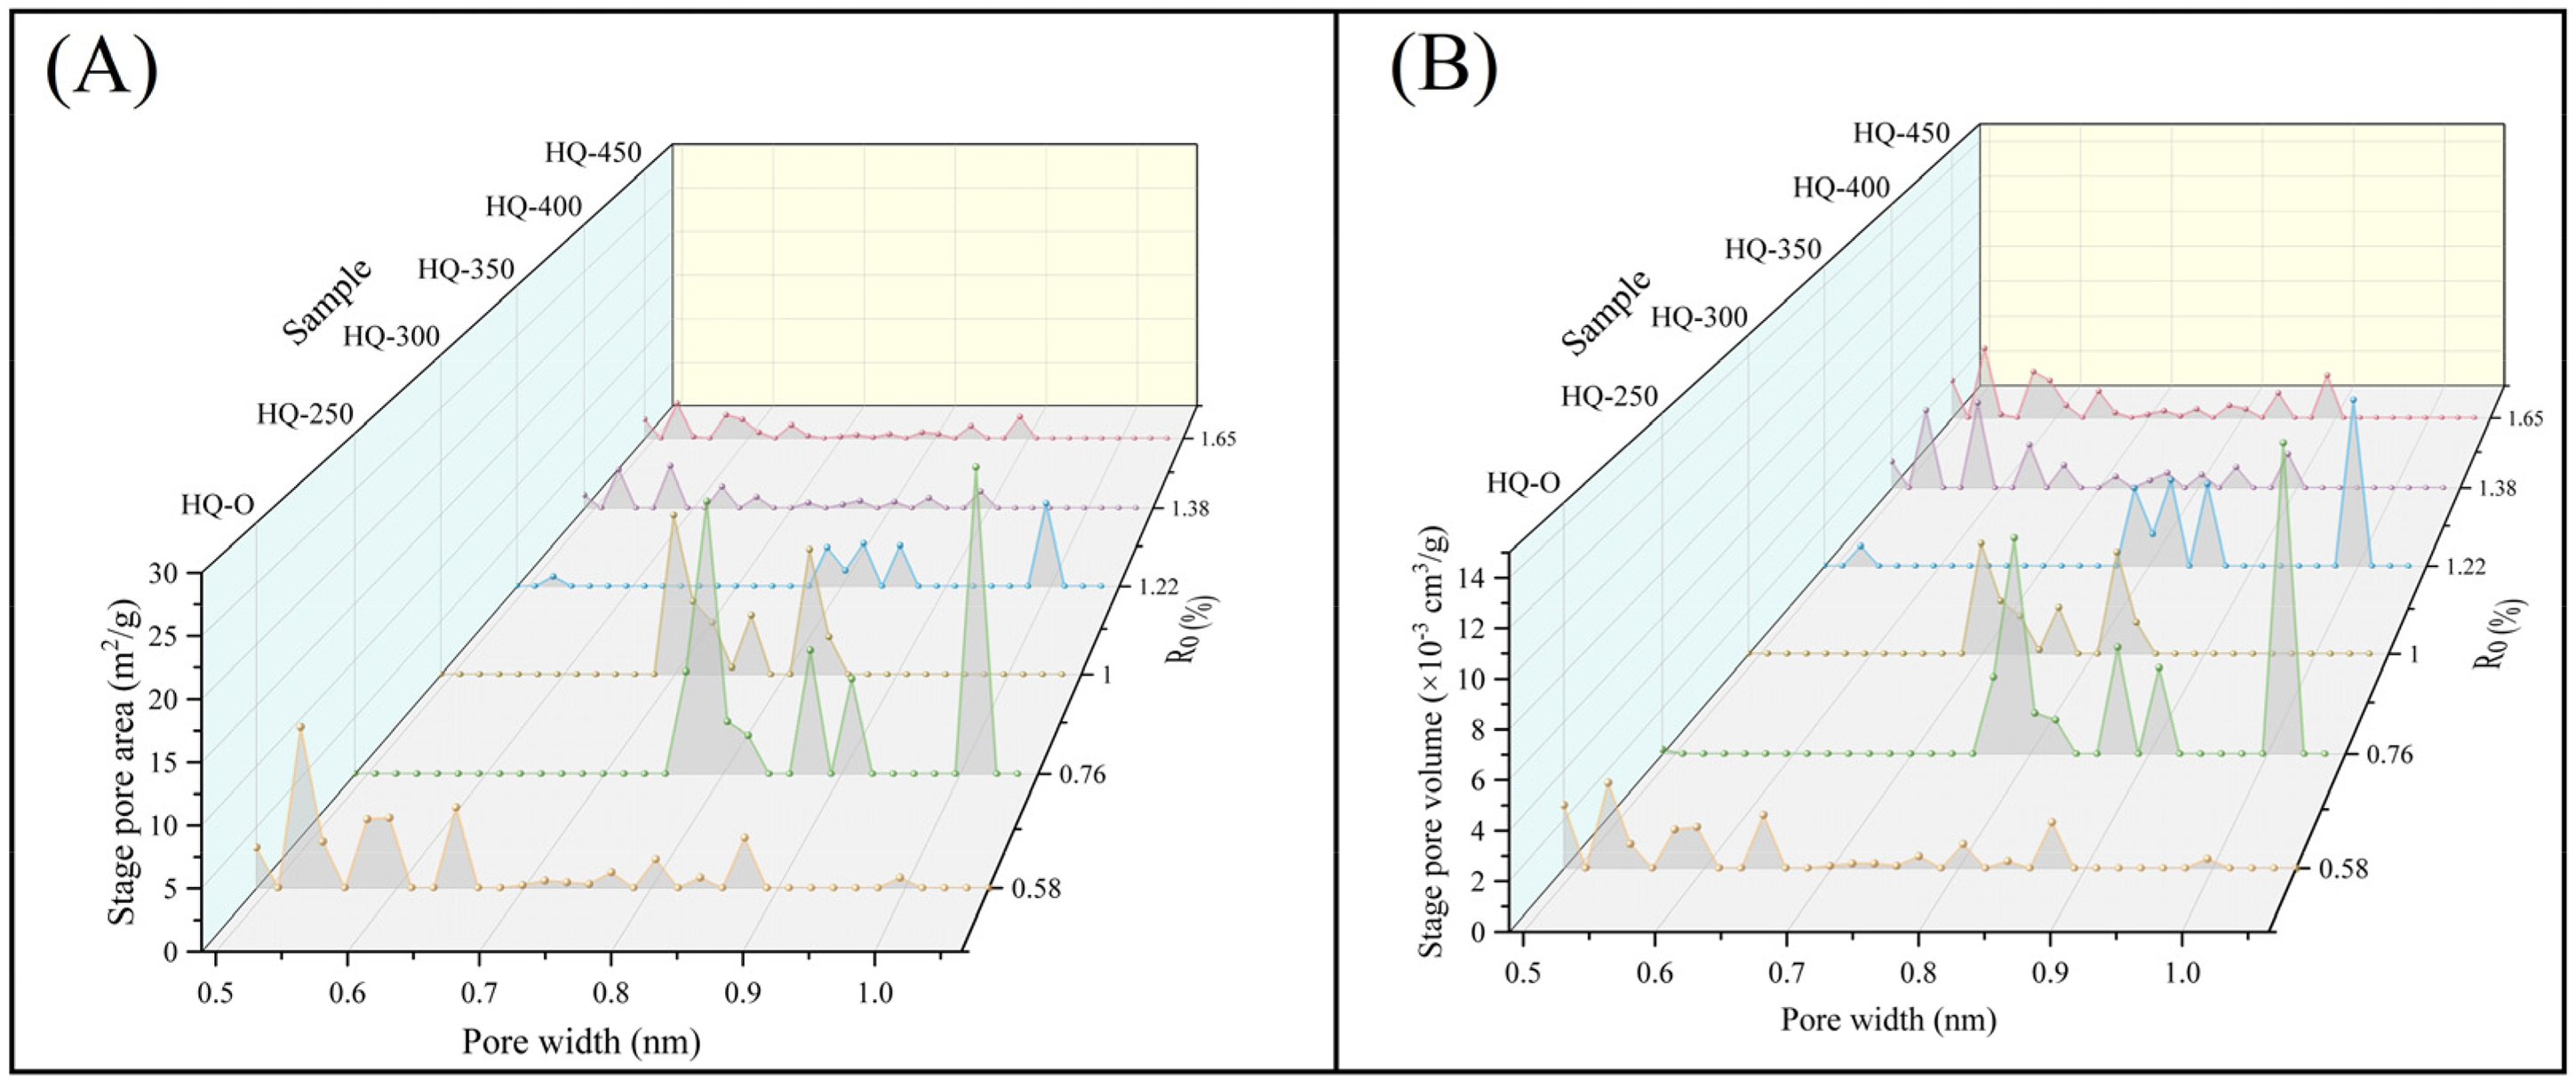
The stage pore area and stage pore volume distribution characteristics of ultra-micropore in different coal ranks (Ro = 0. 6–1.7%) of coal samples during the low-temperature CO2 adsorption experiment.
The pore parameters of different coal samples were tested by CO2 adsorption and low-temperature N2 isothermal adsorption.
Low-temperature N2 adsorption results and analysis
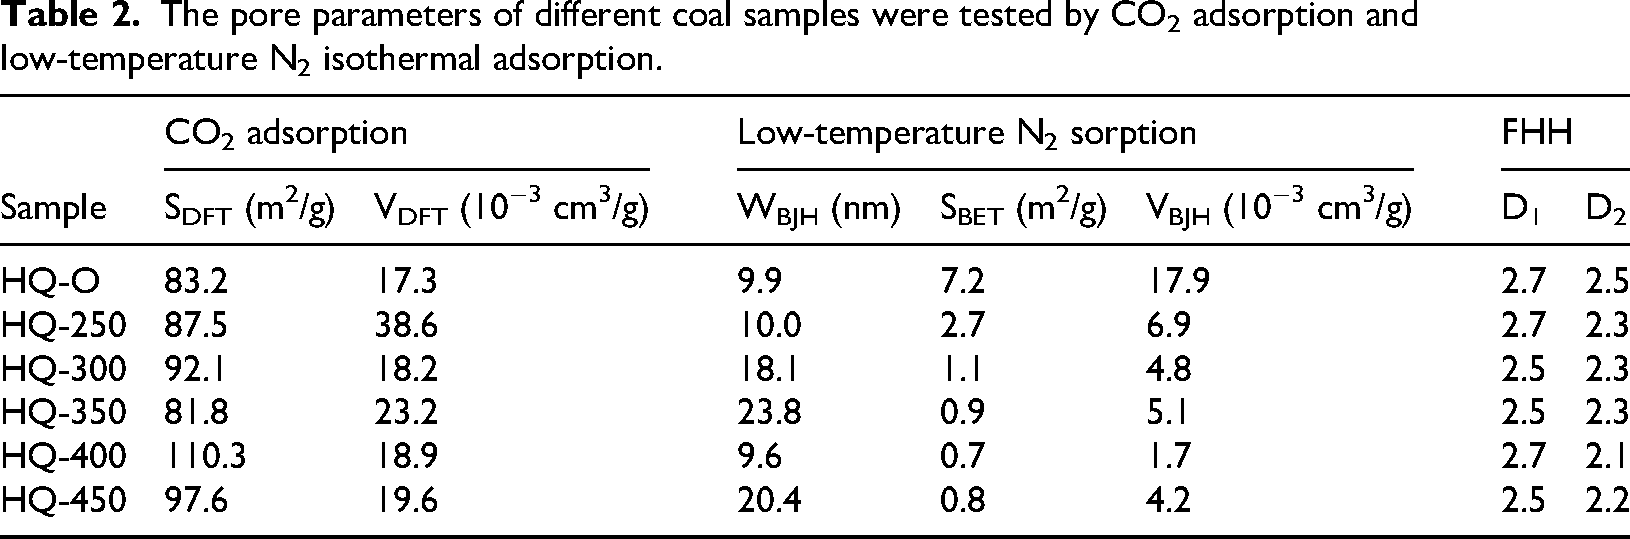
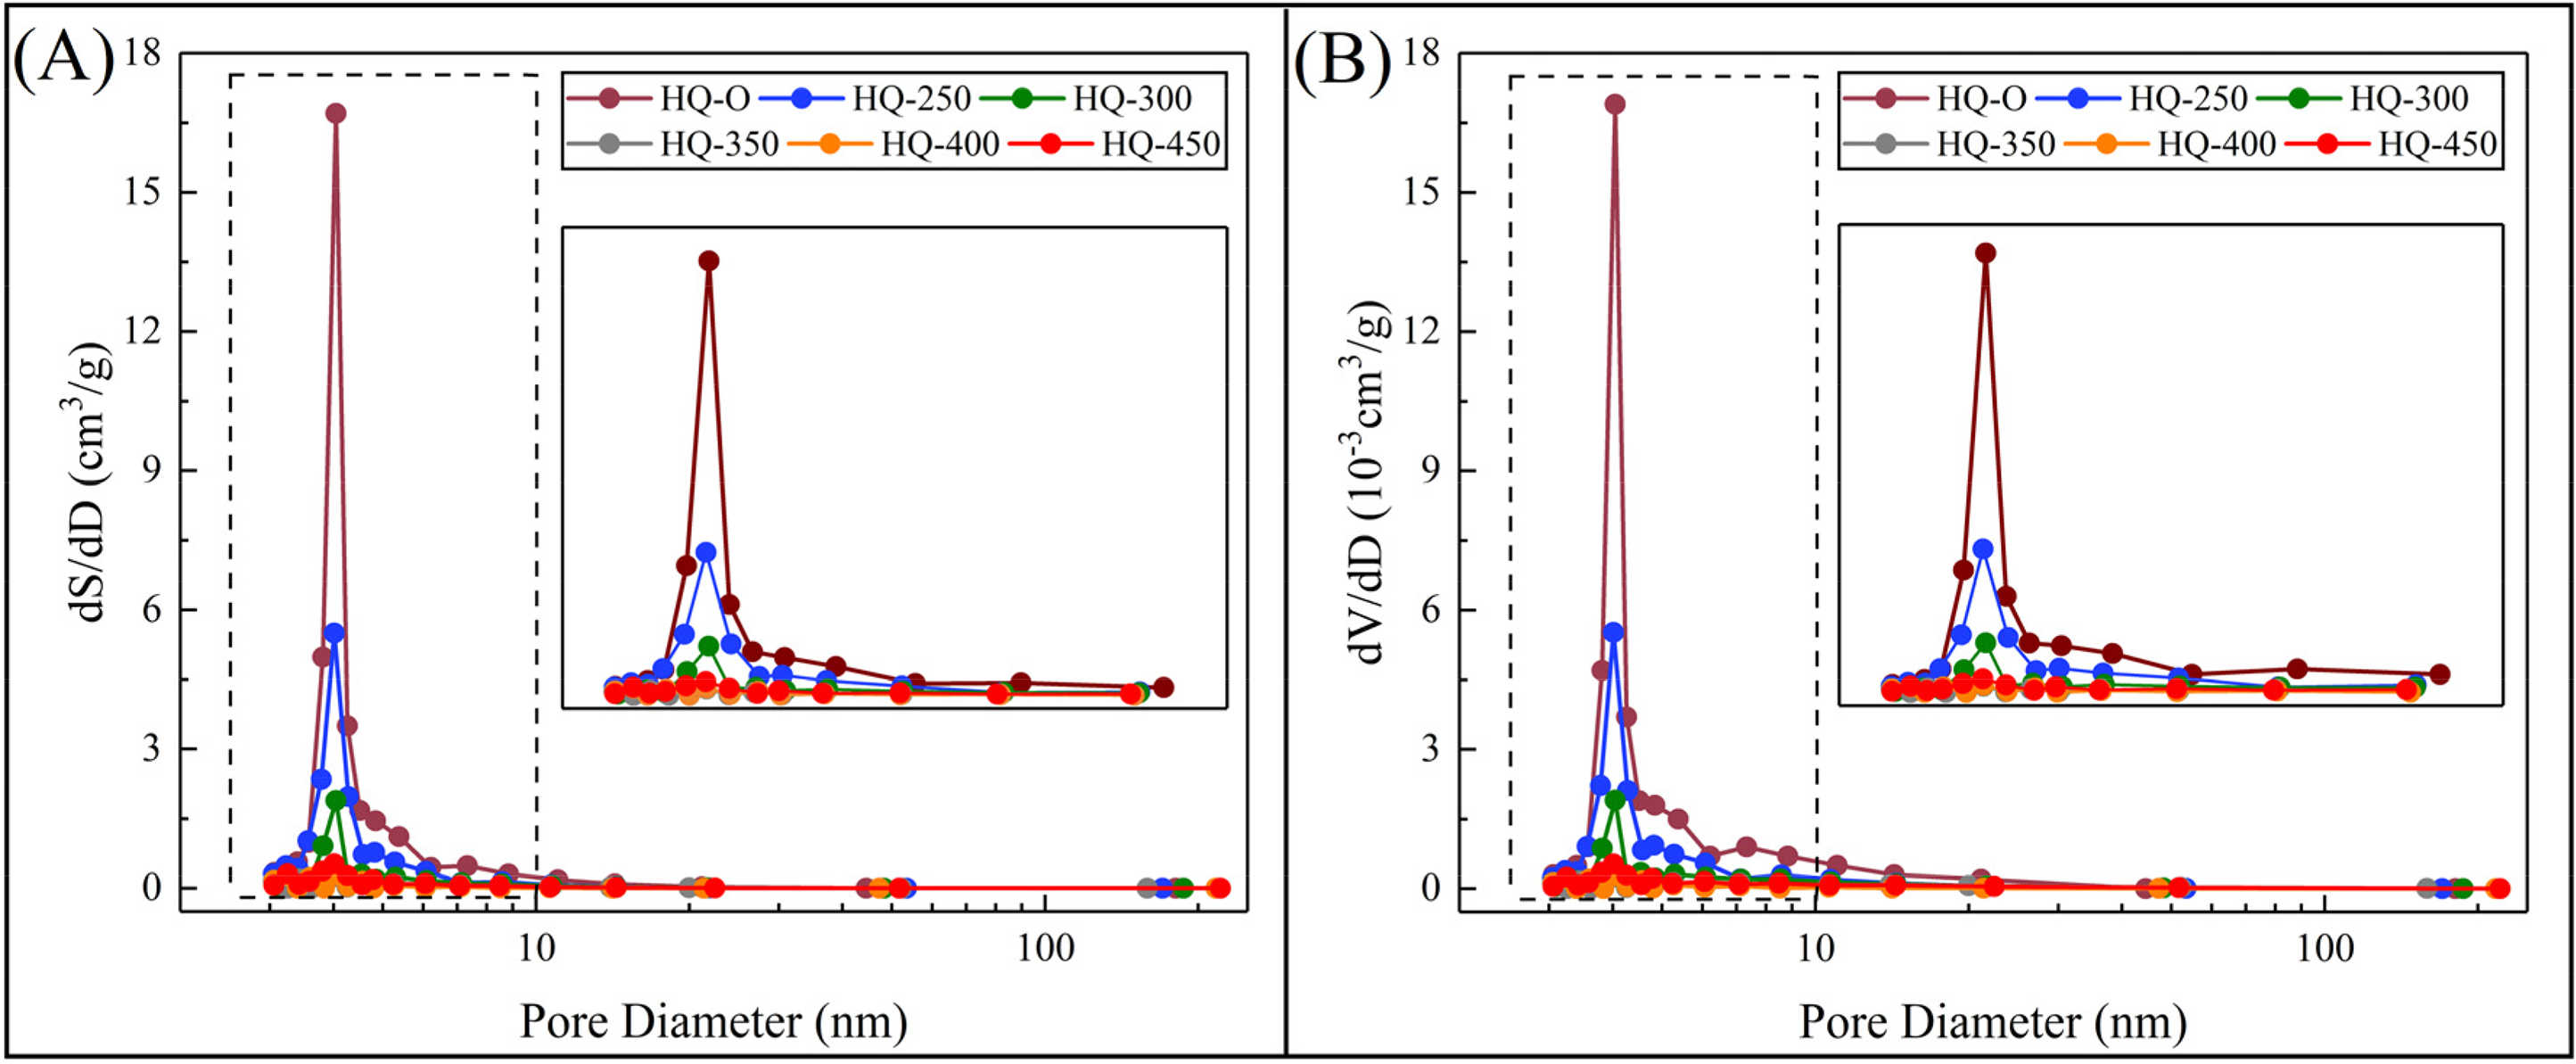
The BET SSA and BJH PV of coal samples HQ-O to HQ-450 were calculated using N2 testing analysis. The average PD and PV were determined by the BJH model. The BET SSA and BJH PV vary from 0.7 to 7.2 m2/g and from 1.7 × 10⁻³ to 17.9 × 10⁻³ cm3/g, respectively. The average PD in the range from 9.9 to 23.8 nm (Table 2). HQ-O has the highest SSA and PV content, whereas HQ-400 has the lowest SSA and PV content. When the temperature is below 350°C (T ≤ 350°C), the average PD gradually increases with increasing coal thermal maturity, displaying an opposite trend to that of SSA and PV. Specifically, the average PD from HQ-O to HQ-350 increases with coal thermal maturity, whereas the average PD of HQ-400 decreases to a minimum (9.6 nm) and then increased at HQ-450 (20.4 nm). Figure 5 illustrates the variation trends of PV and SSA for coal samples. For pore diameters less than 10 nm (≤ 10 nm), the SSA and PV decline significantly with increasing temperature, particularly for HQ-O. For PD greater than 10 nm (>10 nm), the SSA and PV of HQ-O to HQ-450 stabilize. The incremental PV curves of coal samples reveal notable differences in pore size distribution (Figure 6(A)). The pore distribution of HQ-O and HQ-250 presents multi-peak characteristics, with peaks primarily distributed in the micropore interval (≤10 nm), indicating that micropores contribute greatly to the coal pore volume. In contrast, the pore distribution of HQ-300 and HQ-350 is unimodal, with the peak for HQ-300 also distributed in the micropore region. However, the incremental pore volume of HQ-300 and HQ-350 increases significantly in the transition pore region. The pore distribution of HQ-400–HQ-450 is relatively smooth, and the incremental PV increases in the transition pore area. This phenomenon shows that the micropores and transitional pores of HQ-300 contribute significantly to the coal PV, whereas transitional and mesopores contribute more substantially in HQ-350 to HQ-450.
Change rates of pore volumes and surface area for various samples (HQ-O–HQ-450) throughout the entire N2 physisorption measurement.
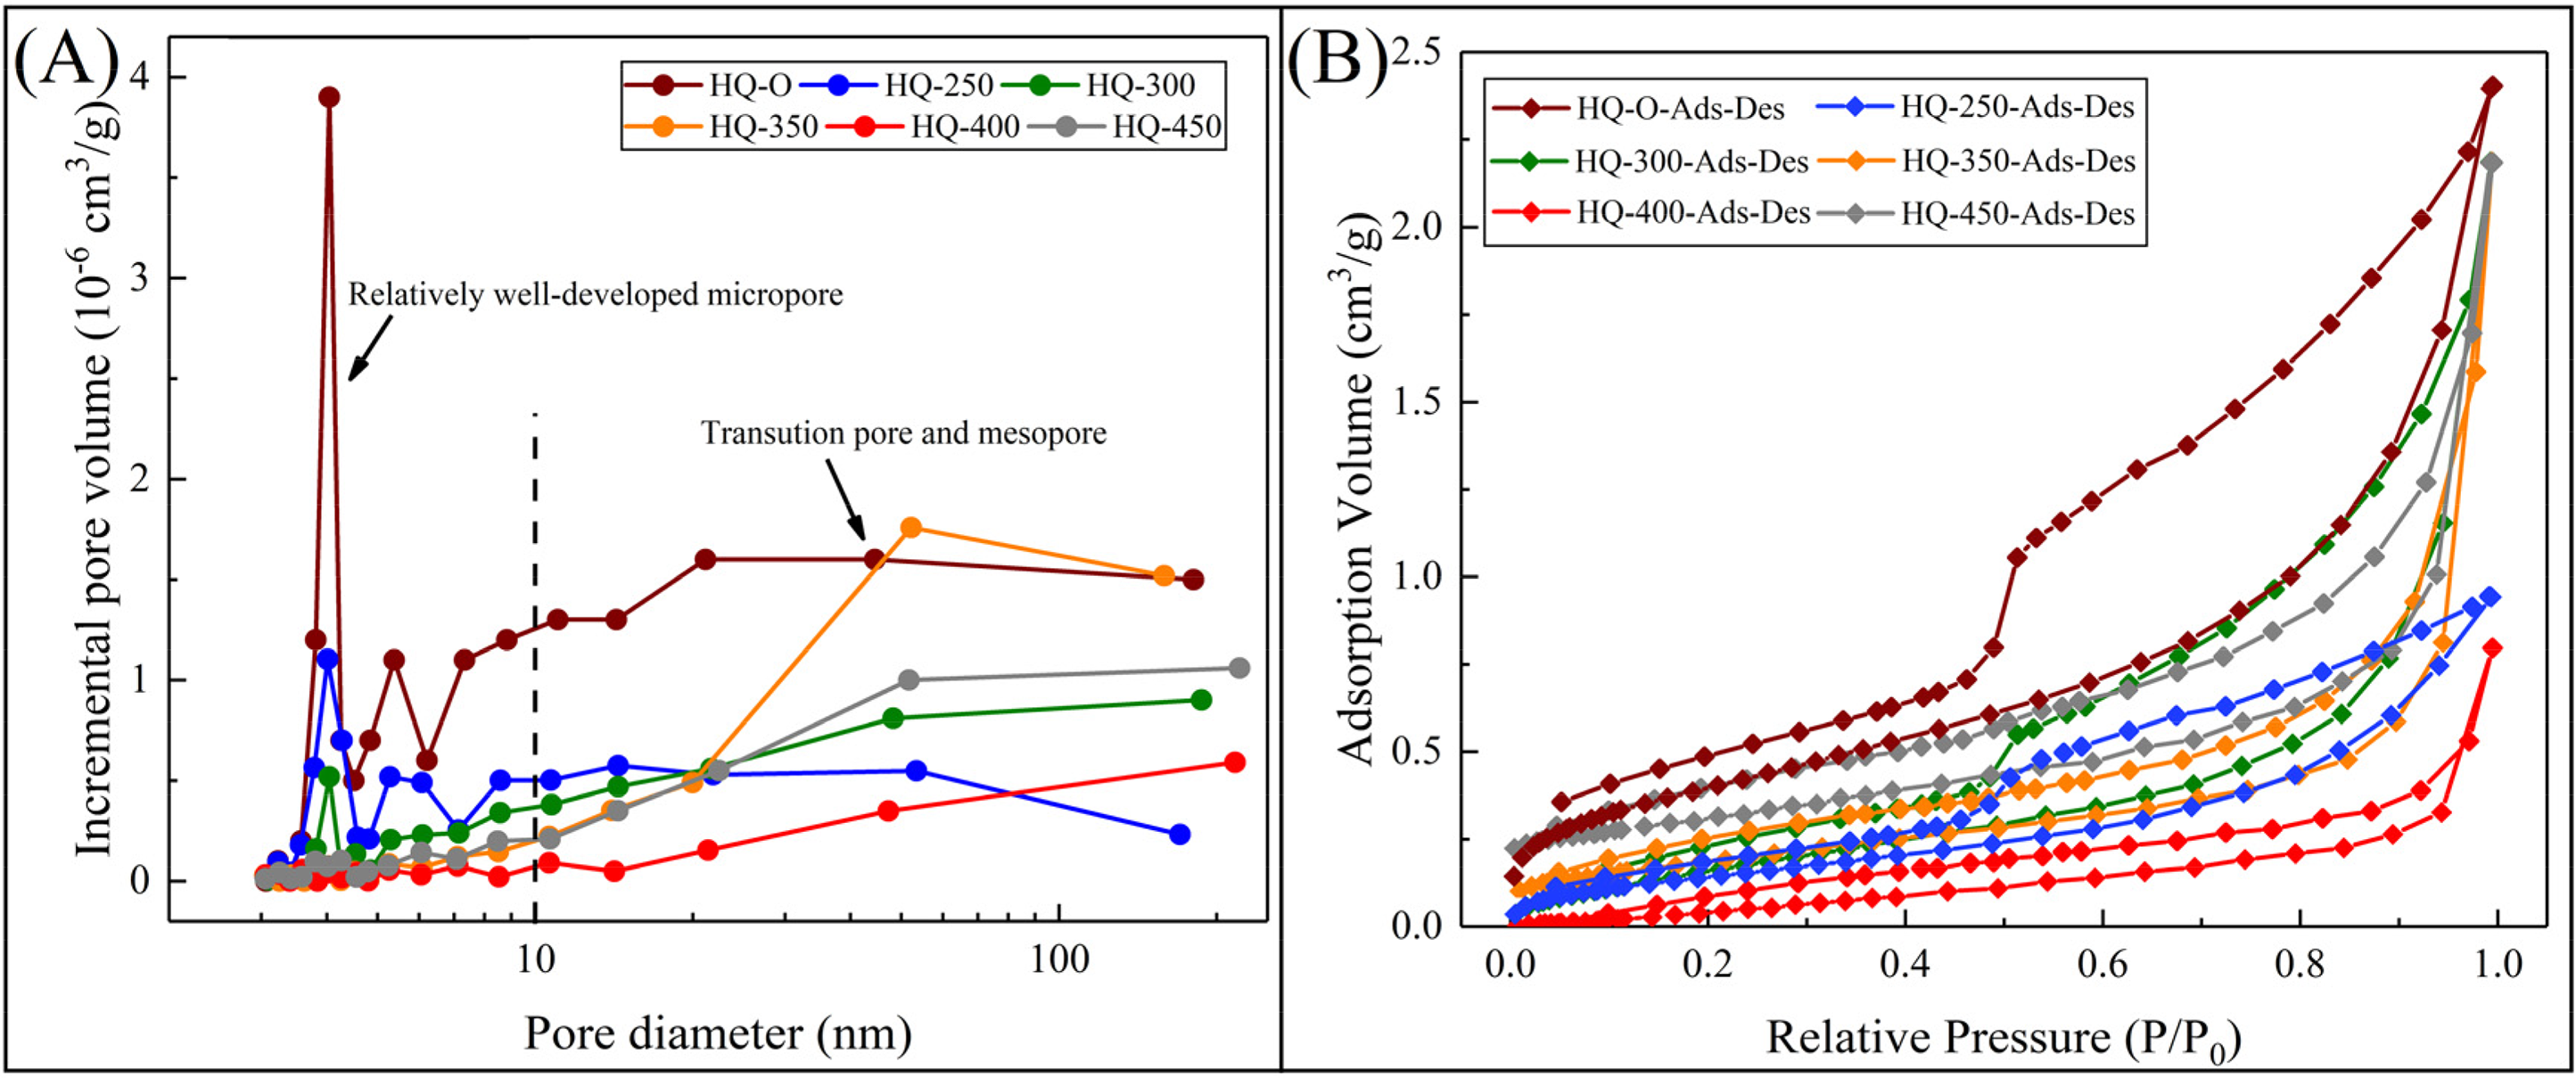
The relationship between the (A) incremental pore volume and pore diameter and adsorption/desorption isotherm curves (B) of coal samples in low-temperature N2 experiment.
The low-temperature N2 adsorption/desorption curves of HQ-O–HQ-450 are shown in Figure 6(B). The adsorption capacities of the samples range from 0.6 to 9.1 cm3/g, 0.1 to 36.0 cm3/g, 0.0 to 2.2 cm3/g, 0.0 to 2.1 cm3/g, 0.0 to 0.8 cm3/g, and 0.0 to 2.0 cm3/g, respectively. The adsorption capacity of HQ-400 is the lowest, while the capacities of other coal samples gradually decrease with the increasing experimental temperature. As P/P0 increases, the N2 absorbing capacities of HQ-O to HQ-450 consistently increases. In the low-pressure region (P/P0 = 0.0–0.1), the adsorption branches of HQ-O and HQ-250 are convex, indicating that micropores are predominantly filled, and single-layer physical adsorption is prone to occur on the pore walls. When P/P0 of HQ-O–HQ-450 is below 0.8, the capacity of coal samples increases gradually, with single-layer and multi-layer physical adsorption being the dominate mechanisms. When P/P0 approaches 1.0, the adsorption capacity rapid increases, and multi-molecular layer physical adsorption becomes dominant. The gas adsorption method has been widely utilized to research the pore texture of porous media (Li et al., 2018b; Li et al., 2023; Nie et al., 2015). The low-temperature N2 adsorption-desorption curves of coal samples reflect differences in pore morphology. According to the International Union of Pure and Applied Chemistry (IUPAC) classification of gas adsorption isotherms, the adsorption-desorption curves of HQ-O to HQ-450 can be divided into type IV isotherms, characterized by the presence of hysteresis loops (Figure 6(B)). The separation between the adsorption and desorption isotherm of HQ-O, HQ-250, and HQ-300 is significant, indicating that capillary condensation and hysteresis loop phenomenon are likely to occur in these samples. In porous media, the connectivity and surface roughness of pore networks affect adsorption hysteresis, which, in turn, can influence the pore morphology to some extent (Si et al., 2021). The hysteresis loop demonstrates an inflection point as P/P0 approaches 0.5, suggesting that the pore types of HQ-O, HQ-250, and HQ-300 are mainly ink bottle pores. HQ-350 and HQ-450 are categorized as H3 types, and there are parallel plate-shaped pores in the coal samples. HQ-400 belongs to the H4 type hysteresis loop, with slit-shaped pores being the dominant pore type.
Discussion
Effect of coal rank on composition and pore structure
Proximate analysis in relation to the coal rank
Coalification involves a series of complex physicochemical transformations, including carbon enrichment, dehydration gas production, and porosity reduction. The H/C atomic ratio of HQ-250 to HQ-450 decreases notably as the Ro values increased (Figure 7(A)), indicating that the thermal evolution process involves dehydrogenation reactions, which enhance hydrocarbon generation capacity. The distribution of Mad and Aad follows an asymmetric U-shaped trend with the rise of coal ranks (Figure 7(B) and (C)). The Mad content decreases to a minimum at HQ-400, and there is a strong correlation between Mad and Ro (R2 = 0.9307) (Figure 7(B)). The initial decrease in Mad content in HQ-250 and HQ-300 can be attributed to the weak water-coal interaction during the low-temperature stage of the hydrous pyrolysis simulation experiment, which led to the removal of a substantial amount of hydroxyl and carboxyl functional groups from the organic matter, thereby reducing hydrophilicity (Jena et al., 2008; Tao et al., 2018). During the hydrocarbon generation stage, liquid hydrocarbons envelop part of the water within the coal matrix, which results in the highest water content at 350°C. The strong correlation between Aad in coal and Ro (R2 = 0.7562) (Figure 7(C)), which decreases to the lowest point at 250°C and then gradually increases. The generation of gaseous samples and the migration of low molecular weight hydrocarbons during the hydrous pyrolysis simulation reduce the content in coal, thereby increasing the proportion of minerals, which is the primary factor affecting ash yield. Ro and Vdaf showed a significant linear negative correlation (R2 = 0.9645) (Figure 7(A)). With the increase of metamorphism, the number of aliphatic and alicyclic functional groups in coal samples gradually decreases, and the arrangement of aromatic rings becomes more orderly, resulting in the decrease in Vdaf yield and the increase of FCdaf (Ushakov et al., 2021; Wang et al., 2019).
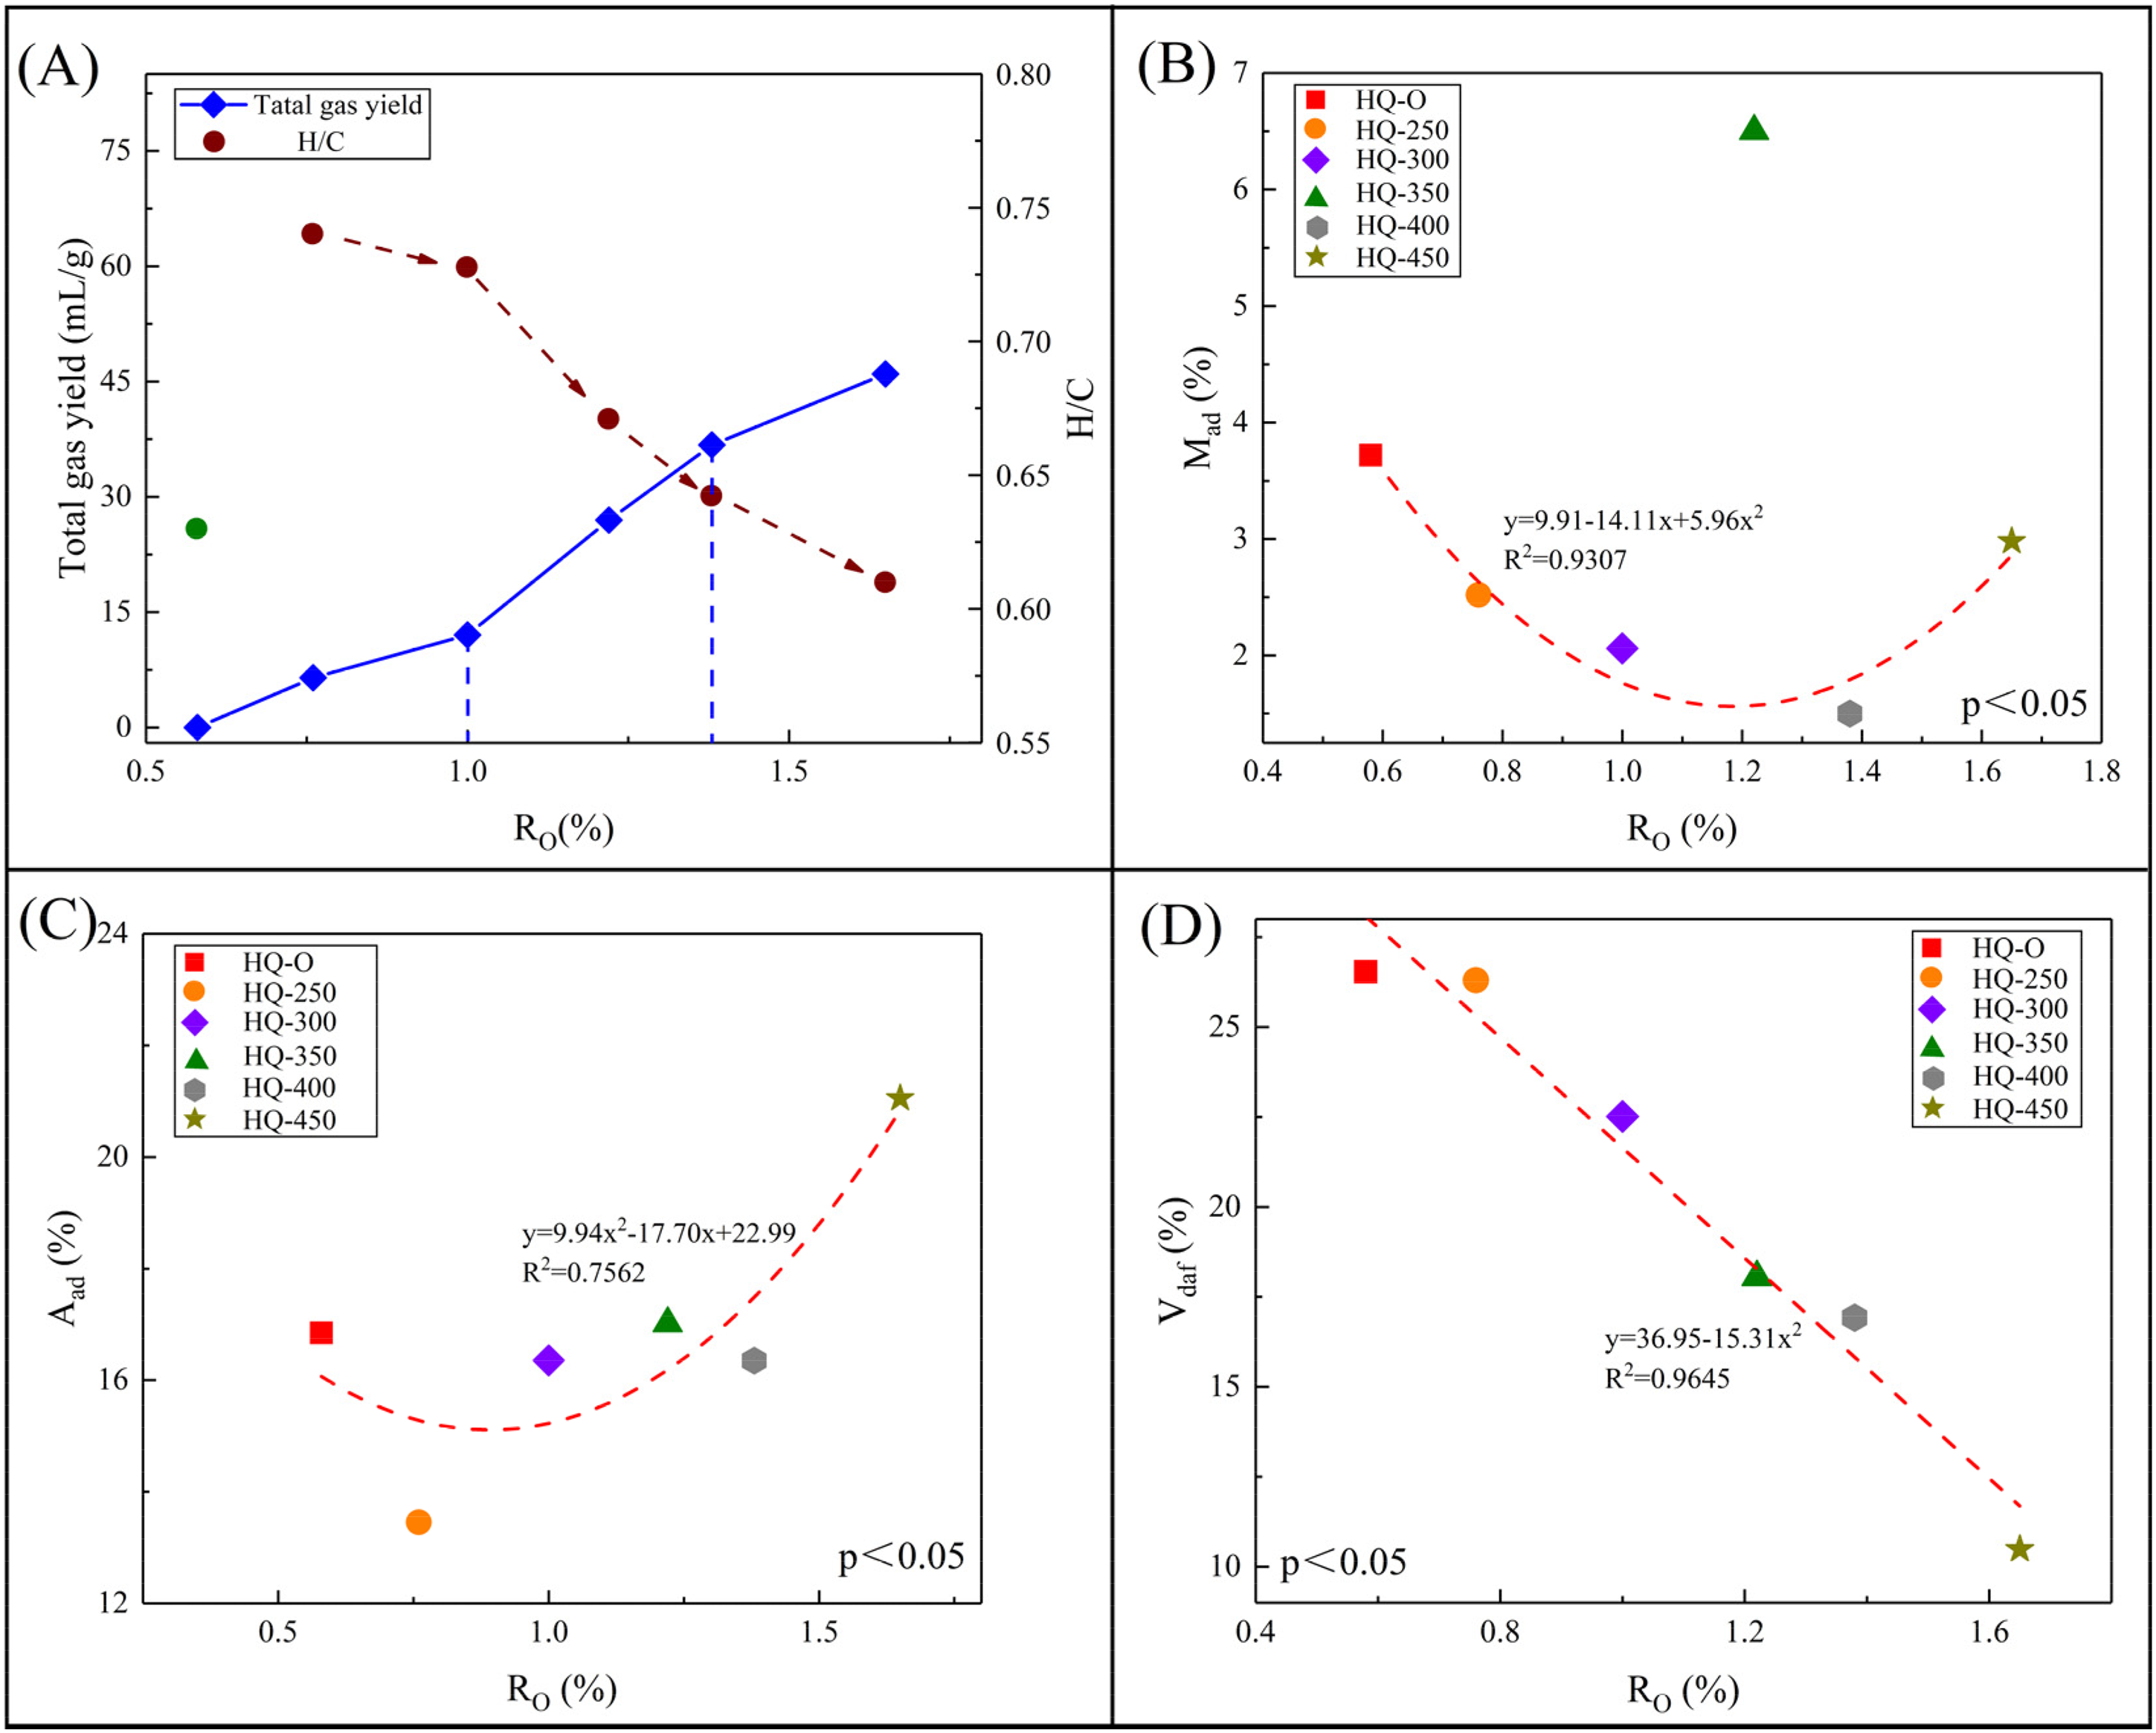
Scatter plot of the relationship between thermal maturity Ro and the total gas yield (A), Mad (B), Aad (C), and Vdaf (D) for pyrolyzed Hequ coal samples.
Variation of pore structure in various rank coals
For the quantitative characterization of coal reservoirs, previous researches have primarily concentrated on investigating the evolutionary pattern of pore in the influence of various factors at different geological stages (Hou et al., 2020; Jia et al., 2022; Tao et al., 2018). The micropore and transition pore structures of HQ-250 (Ro = 1.0%) and HQ-400 (Ro = 1.4%) were significantly changed in the hydrous simulation experiment. Among them, metamorphism at HQ-250 increased the degree of condensation in the coal molecular structure, reduced functional groups and side chains, and made the coal texture denser (Hoffmann and Huculak-Mączka, 2012; Shibaoka, 1978), leading to a reduction in PV and SSA. In addition, the fatty side chains further fall off at HQ-400, some fatty structures from small-scale aromatic rings through aromatization, coal is pyrolyzed to produce methane, the asphalt formed earlier is cracked into small molecular gaseous hydrocarbon (Cao et al., 2021), and the PV and SSA are reduced to the minimum. At HQ-450 (Ro = 1.7%), the aromatization and ring condensation rates increase, enhancing the orientation of the macromolecular basic structural units of coal and generating a large amount of pyrolysis methane (Li et al., 2018a), resulting in a gradual increase in PV and SSA.
As coalification increases, the pore structure of different diameters undergoes notable evolution. With increasing coal rank (0.6% ≤ Ro ≤ 1.4%), both SSA and PV of micropores gradually decrease. When Ro is 1.4%, the SSA and PV of micropores are reduced to the minimum values (Figure 8(A)). The decrease is primarily attributed to the increased polycondensation of the aromatic nucleus during coalification, accompanied by the removal of functional groups and the breakage of side chains, which results in the coals structure more compact and decreases the PV. Different from the changing trend of the SSA and PV of micropores, the SSA and PV of transition pores undergo two cycles of increase and decrease (Figure 8(B)). As coal rank rises, the SSA and PV first decrease and then increase, followed by another decrease and subsequent increase. The evolution of transition pores is controlled by the modification of primary pores and the generation of secondary pores. This is because the SSA and PV of transitional pores decrease with the aromatic condensation and structural densification of primary pores. As thermal evolution increases, organic acids dissolve minerals such as carbonates and feldspar in coal reservoirs, forming secondary dissolution pores and contributing to the increase in PV (Jiang et al., 2023; Li et al., 2020). As coalification intensifies, the secondary pores are compressed again due to thermal stress or structural rearrangement, resulting in a secondary reduction in the transition pores. During the high-temperature pyrolysis stage, a large amount of volatile components are released, further expanding the transition pores, leading to a secondary increase in SSA and PV.
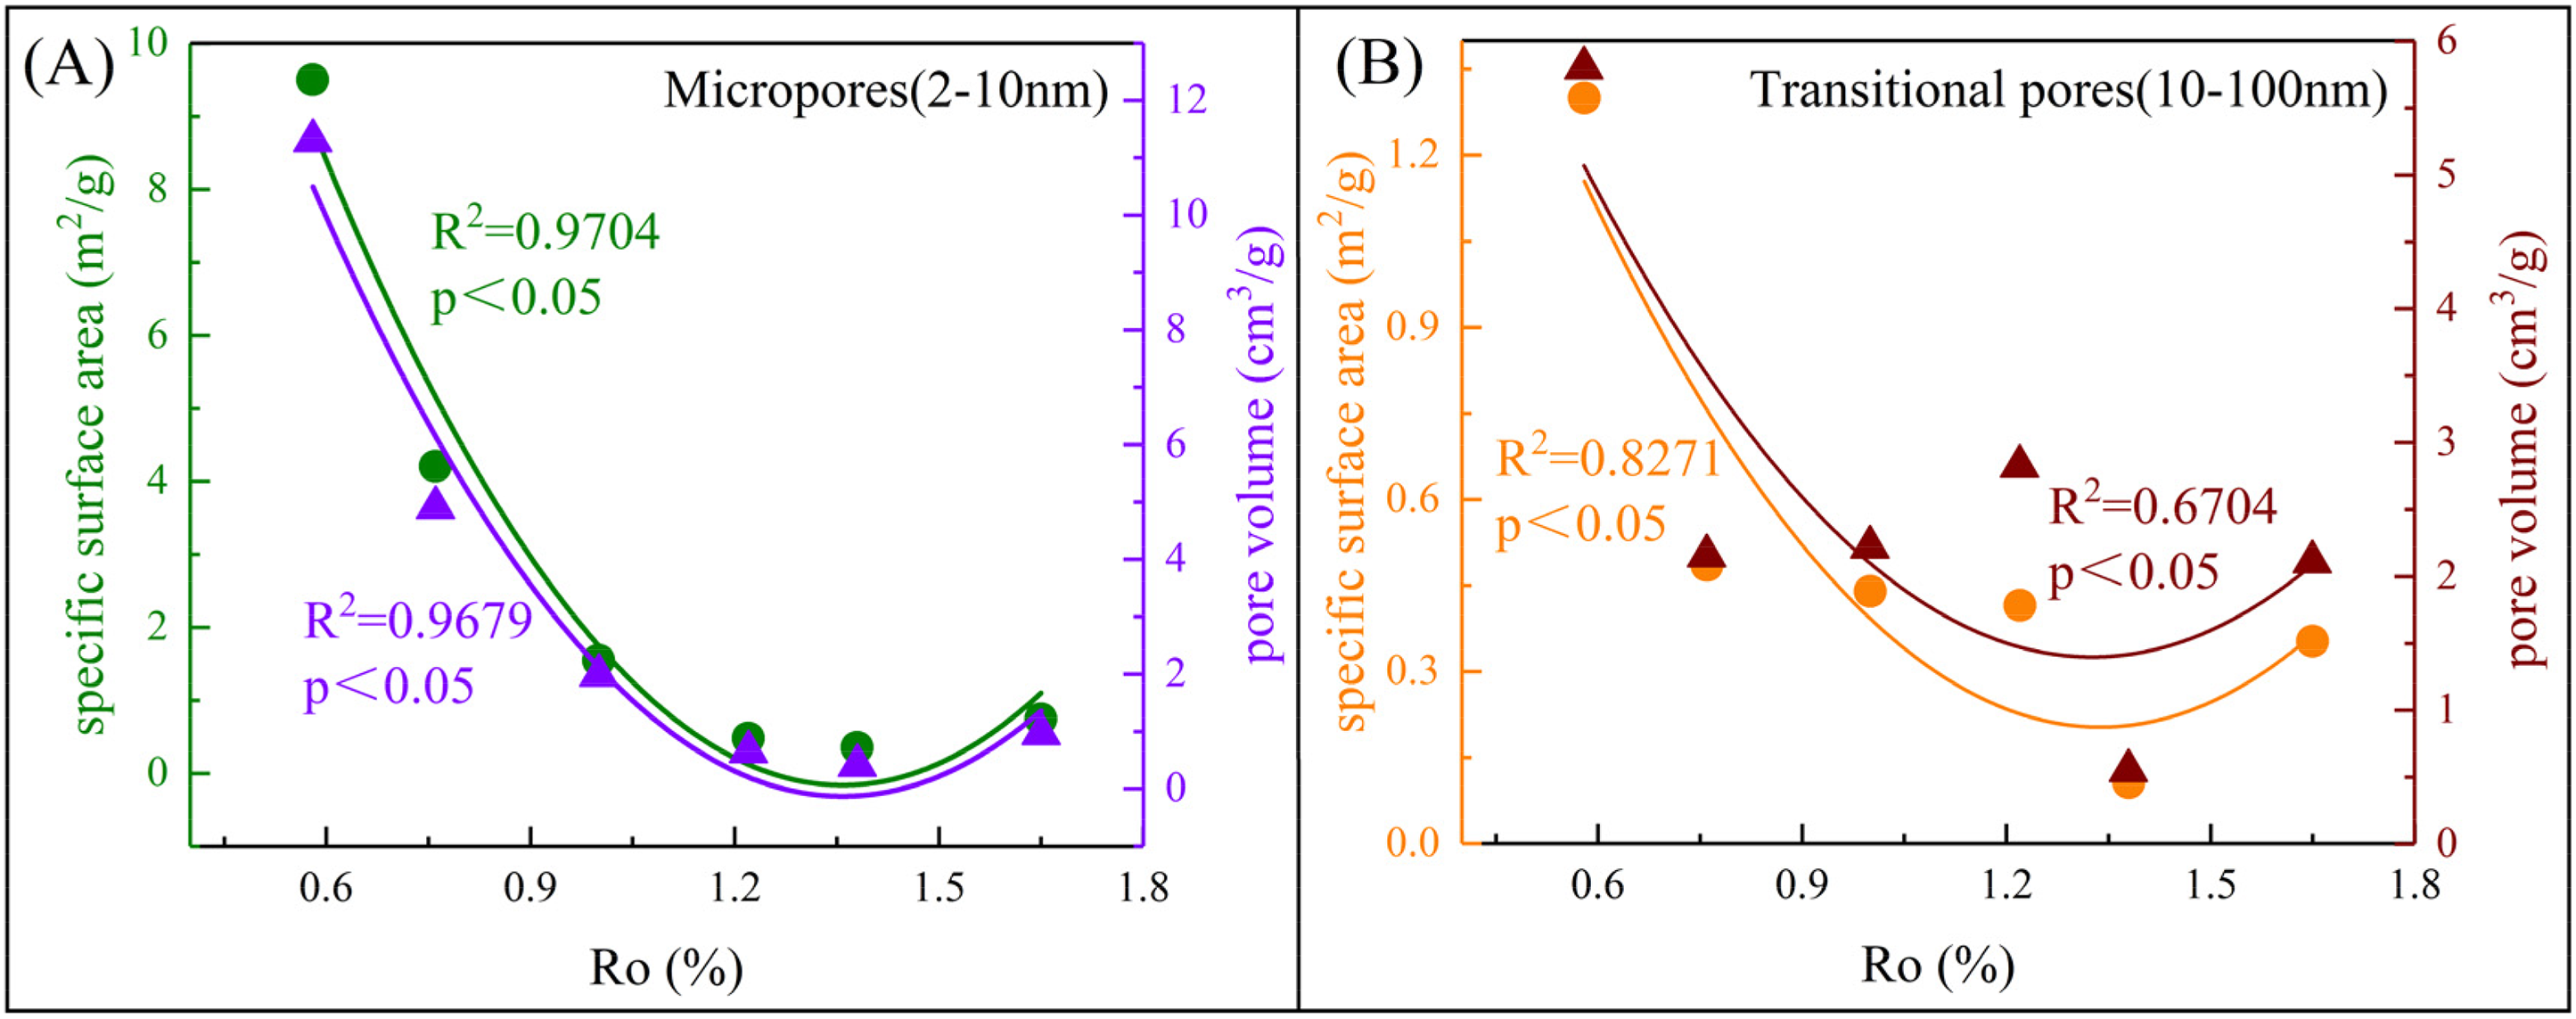
Correlation of thermal maturity Ro with varied pore surface area (SSA) and total pore volume (PV) of micropores and transitional pores from pyrolyzed Hequ coal samples.
The BET SSA of HQ-250 to HQ-450 has a negative correlation with Aad yield (R2 = 0.5029), but there is no significant relationship between BJH PV and Aad content (Figure 9(A)). The overall increasing trend of Aad content and the decreasing trend of SSA for HQ-250 to HQ-450 indicate that pores development is governed by the inorganic mineral composition. When minerals content in coal increases and fills the pores, the SSA of the coal decreases. A strong positive correlation (R2 = 0.5129, 0.5460) exists between the SSA, PV, and Vdaf yield in coal samples (Figure 9(B)). With the increase of temperature, the Vdaf yield decreased with a corresponding decrease in SSA and PV. These findings further confirm that SSA and PV are intrinsically linked to the thermo-evolution of organic material, with the release of volatile substances influencing the changes in both SSA and PV.
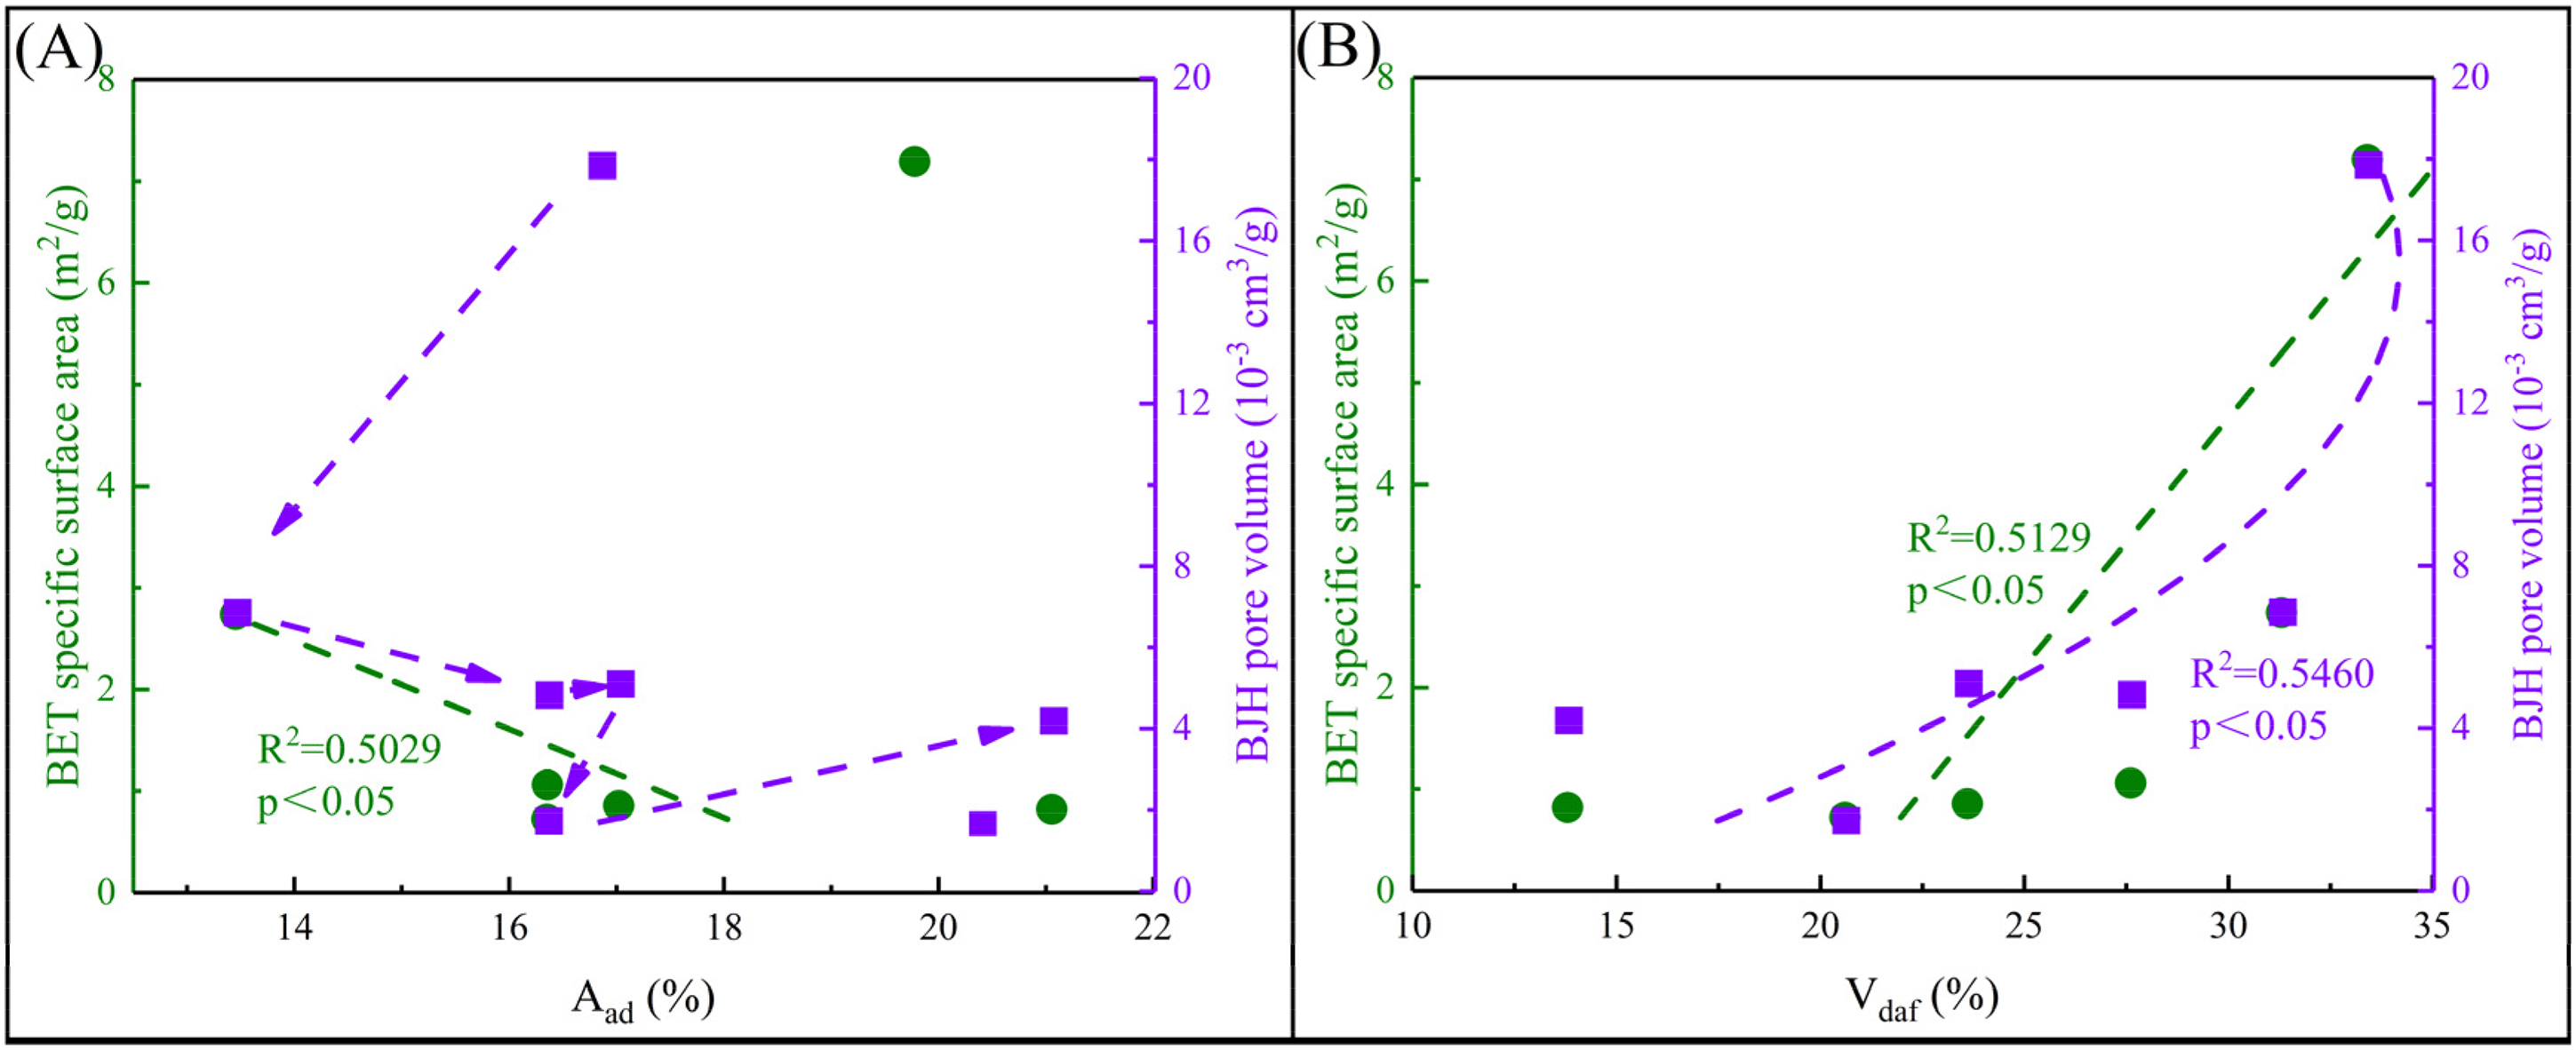
The correlation of Aad and Vdaf with specific surface area (SSA) and pore volume (PV) in pyrolyzed Hequ coal samples.
Heterogeneity of pore structure and fractal characterization from LTNA
The fractal dimensions of coal samples were computed from the N2 adsorption–desorption data. In the low-pressure zone (P/P0 < 0.5), gas molecules are adsorbed on the micropore surface of coal samples by van der Waals force. In the high-pressure regime (P/P0 > 0.5), the gas adsorption behavior is predominantly governed by the capillary condensation effect. Therefore, the determination of fractal dimension is based on segmented analysis of the desorption curve, which can be characterized by the complexity and heterogeneity of pore structure of coal samples in different pressure regions (Nie et al., 2016, Yang et al., 2016). There are many methods to calculate fractal dimensions D1 and D2, among which the Frenkel–Halsey–Hill (FHH) model is diffusely applicable and easy to compute (Pfeifer et al., 1989). The calculation method is shown in Equation (1):
Where V is the volume of gas molecules in the adsorption phase at the equilibrium pressure (P); V0, the monolayer coverage volume; A, the power law index; and P0, the saturation pressure of the gas. The slope of the curve between ln(V/V0) and ln(ln(P0/P)) is equal to A, and the fractal dimension D is determined by the expression A = D-3. Based on the classical fractal geometry theory, the D typically ranges between 2 and 3. Among them, a D value closer to 2 indicates a relatively smooth pore surface and a more uniform pore structure in coal samples. Conversely, a D value closer to 3 suggests a more irregular pore surface and a more complex the pore network.
The high-pressure and low-pressure zones are divided into D1 and D2. D1 and D2 represent the irregularity of pore surface of coal samples and the structural complexity, respectively. The D1 and D2 values for each coal sample are calculated and listed in Table 2. The ln(ln(P0/P)) and lnV of each coal product have a distinct linear fitting relationship (Figure 10), with the R2 values greater than 0.97, confirming the reliability of the calculated results. The D1 values of HQ-O to HQ-450 range from 2.0 to 2.4, while the D2 values range from 2.5 to 2.7, all of which are between 2.0 and 3.0, consistent with classical fractal theory. The molecular structure of low-rank coal transitions from a highly disordered, loose spatial structure with large spacing between aromatic layer and long side chains to a high-rank coal with reduced side chains, tight arrangement of aromatic flakes and regular spatial structure (Li et al., 2023). With increasing thermal metamorphism, the D1 and D2 values for HQ-O to HQ-450 showed a wave-like trend, initially increasing before decreasing, although D2 showed an overall downward trend. The D1 and D2 values of HQ-O are nearer to 3.0, indicating that a rough pore surface and highly heterogeneous pore structure. In contrast, the D1 values of other coal samples are larger, while the D2 values are generally smaller, suggesting that the pore surfaces of HQ-250 to HQ-450 are relatively rough, with a more uniform pore structure (Table 2).
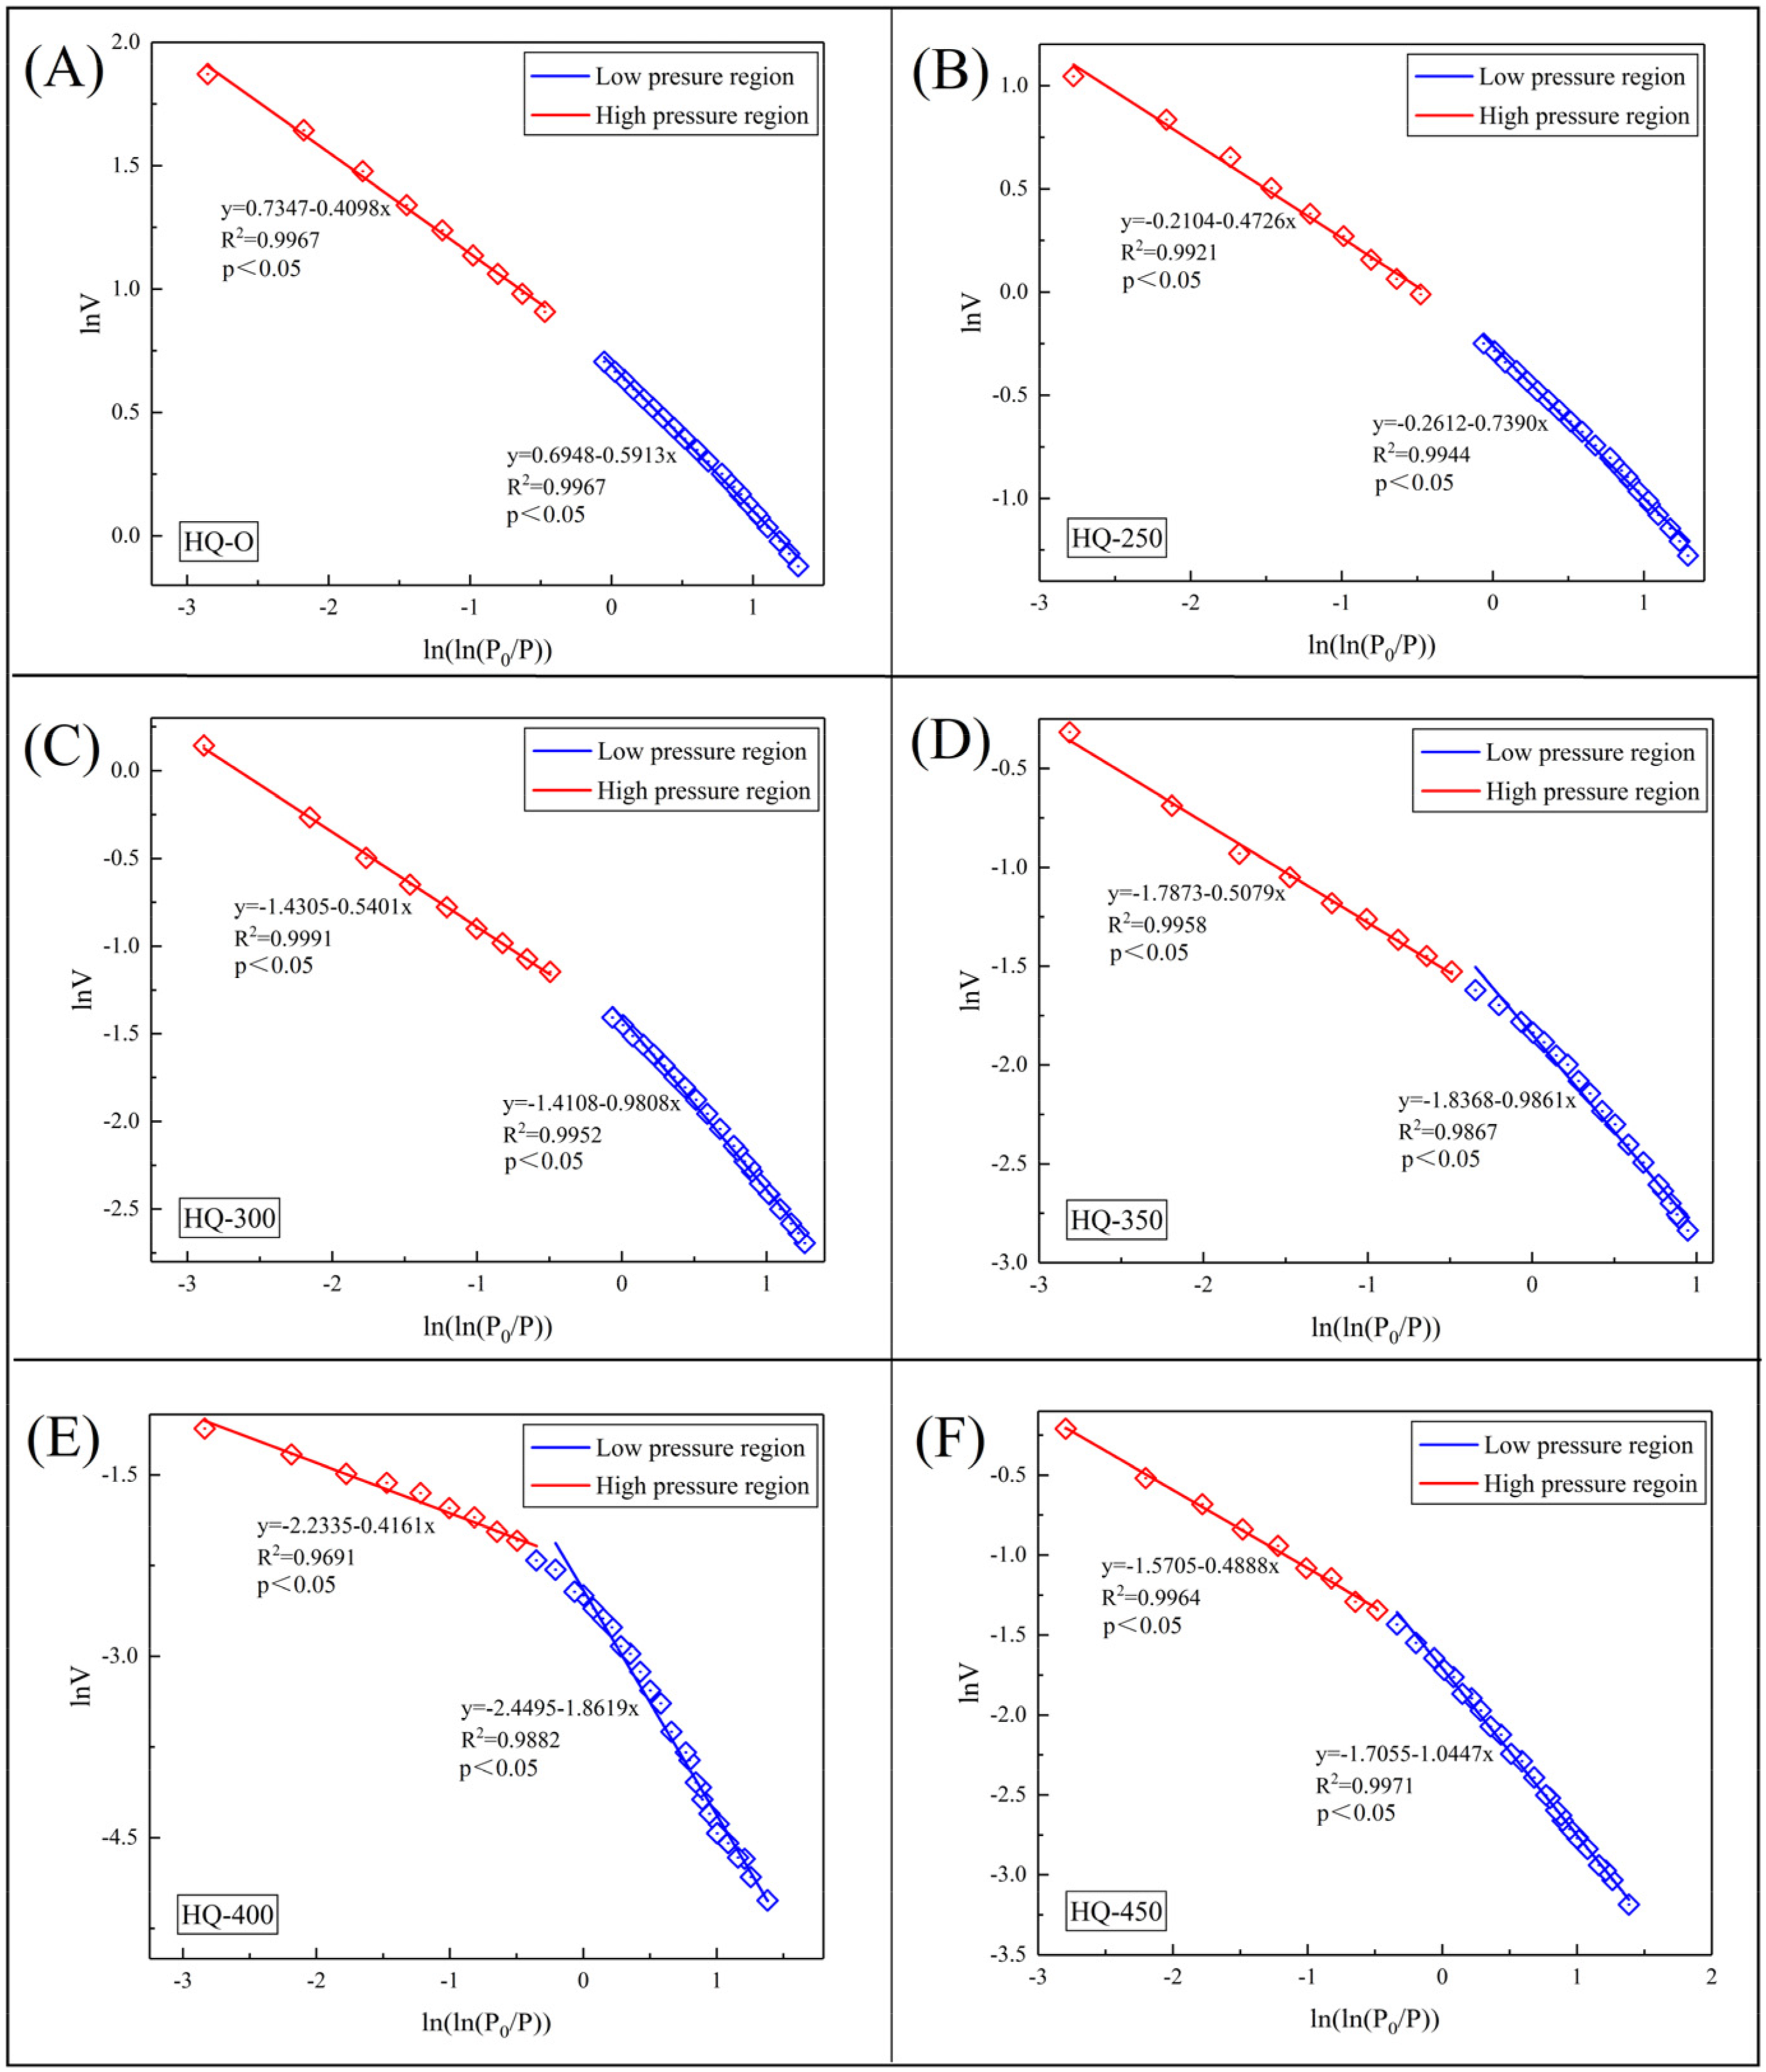
Calculation plots of lnV versus ln(ln(P0/P)) of low-temperature N2 adsorption analysis (FHH model) for coal samples (HQ-O–HQ-450).
Coalification significantly influenced the evolution of fractal dimensions of coal reservoir pores (Li et al., 2023; Liu et al., 2023b, Nie, 2016). The pore structural heterogeneity of different coal ranks was quantitatively revealed by hydrous pyrolysis simulation experiments. There is a strong negative relationship between Ro and D1 (Figure 11(A), R2 = 0.6630), indicating that the pore surface becomes progressively smoother with the increase of Ro. The relationship between Aad and D2 follows an inverted “C” shape, while Vdaf and D2 show a positive “C” shape distribution (Figure 11(A) and (B)). With the increase of thermal evolution (HQ-O–HQ-300), the Aad yield increases, the Vdaf yield decreases, and mineral composition influences the pore structure, leading to increased heterogeneity. With coalification continues (HQ-350–HQ-450), Aad yield decreases, Vdaf yield increases, and the volatile components generated by organic matter during the pyrolysis simulation dominate, resulting in the development of more complex and heterogeneous pore structures. A strong positive correlation between PV, SSA, and D1 further confirms that increased PV and SSA are associated with rougher pore surfaces (Figure 11(C) and (D)). Conversely, PD has a significant negative linear relationship with D2. With decreasing pore diameter, the structural anisotropy of the pore network becomes more pronounced, resulting in a corresponding increase in the D2 value. Therefore, PV, SSA, and PD play a crucial role in determining pore surface and pore structure. Specifically, SSA and PV influence the surface roughness characteristics of the pore, while PD predominantly controls the structural heterogeneity within the pore system.
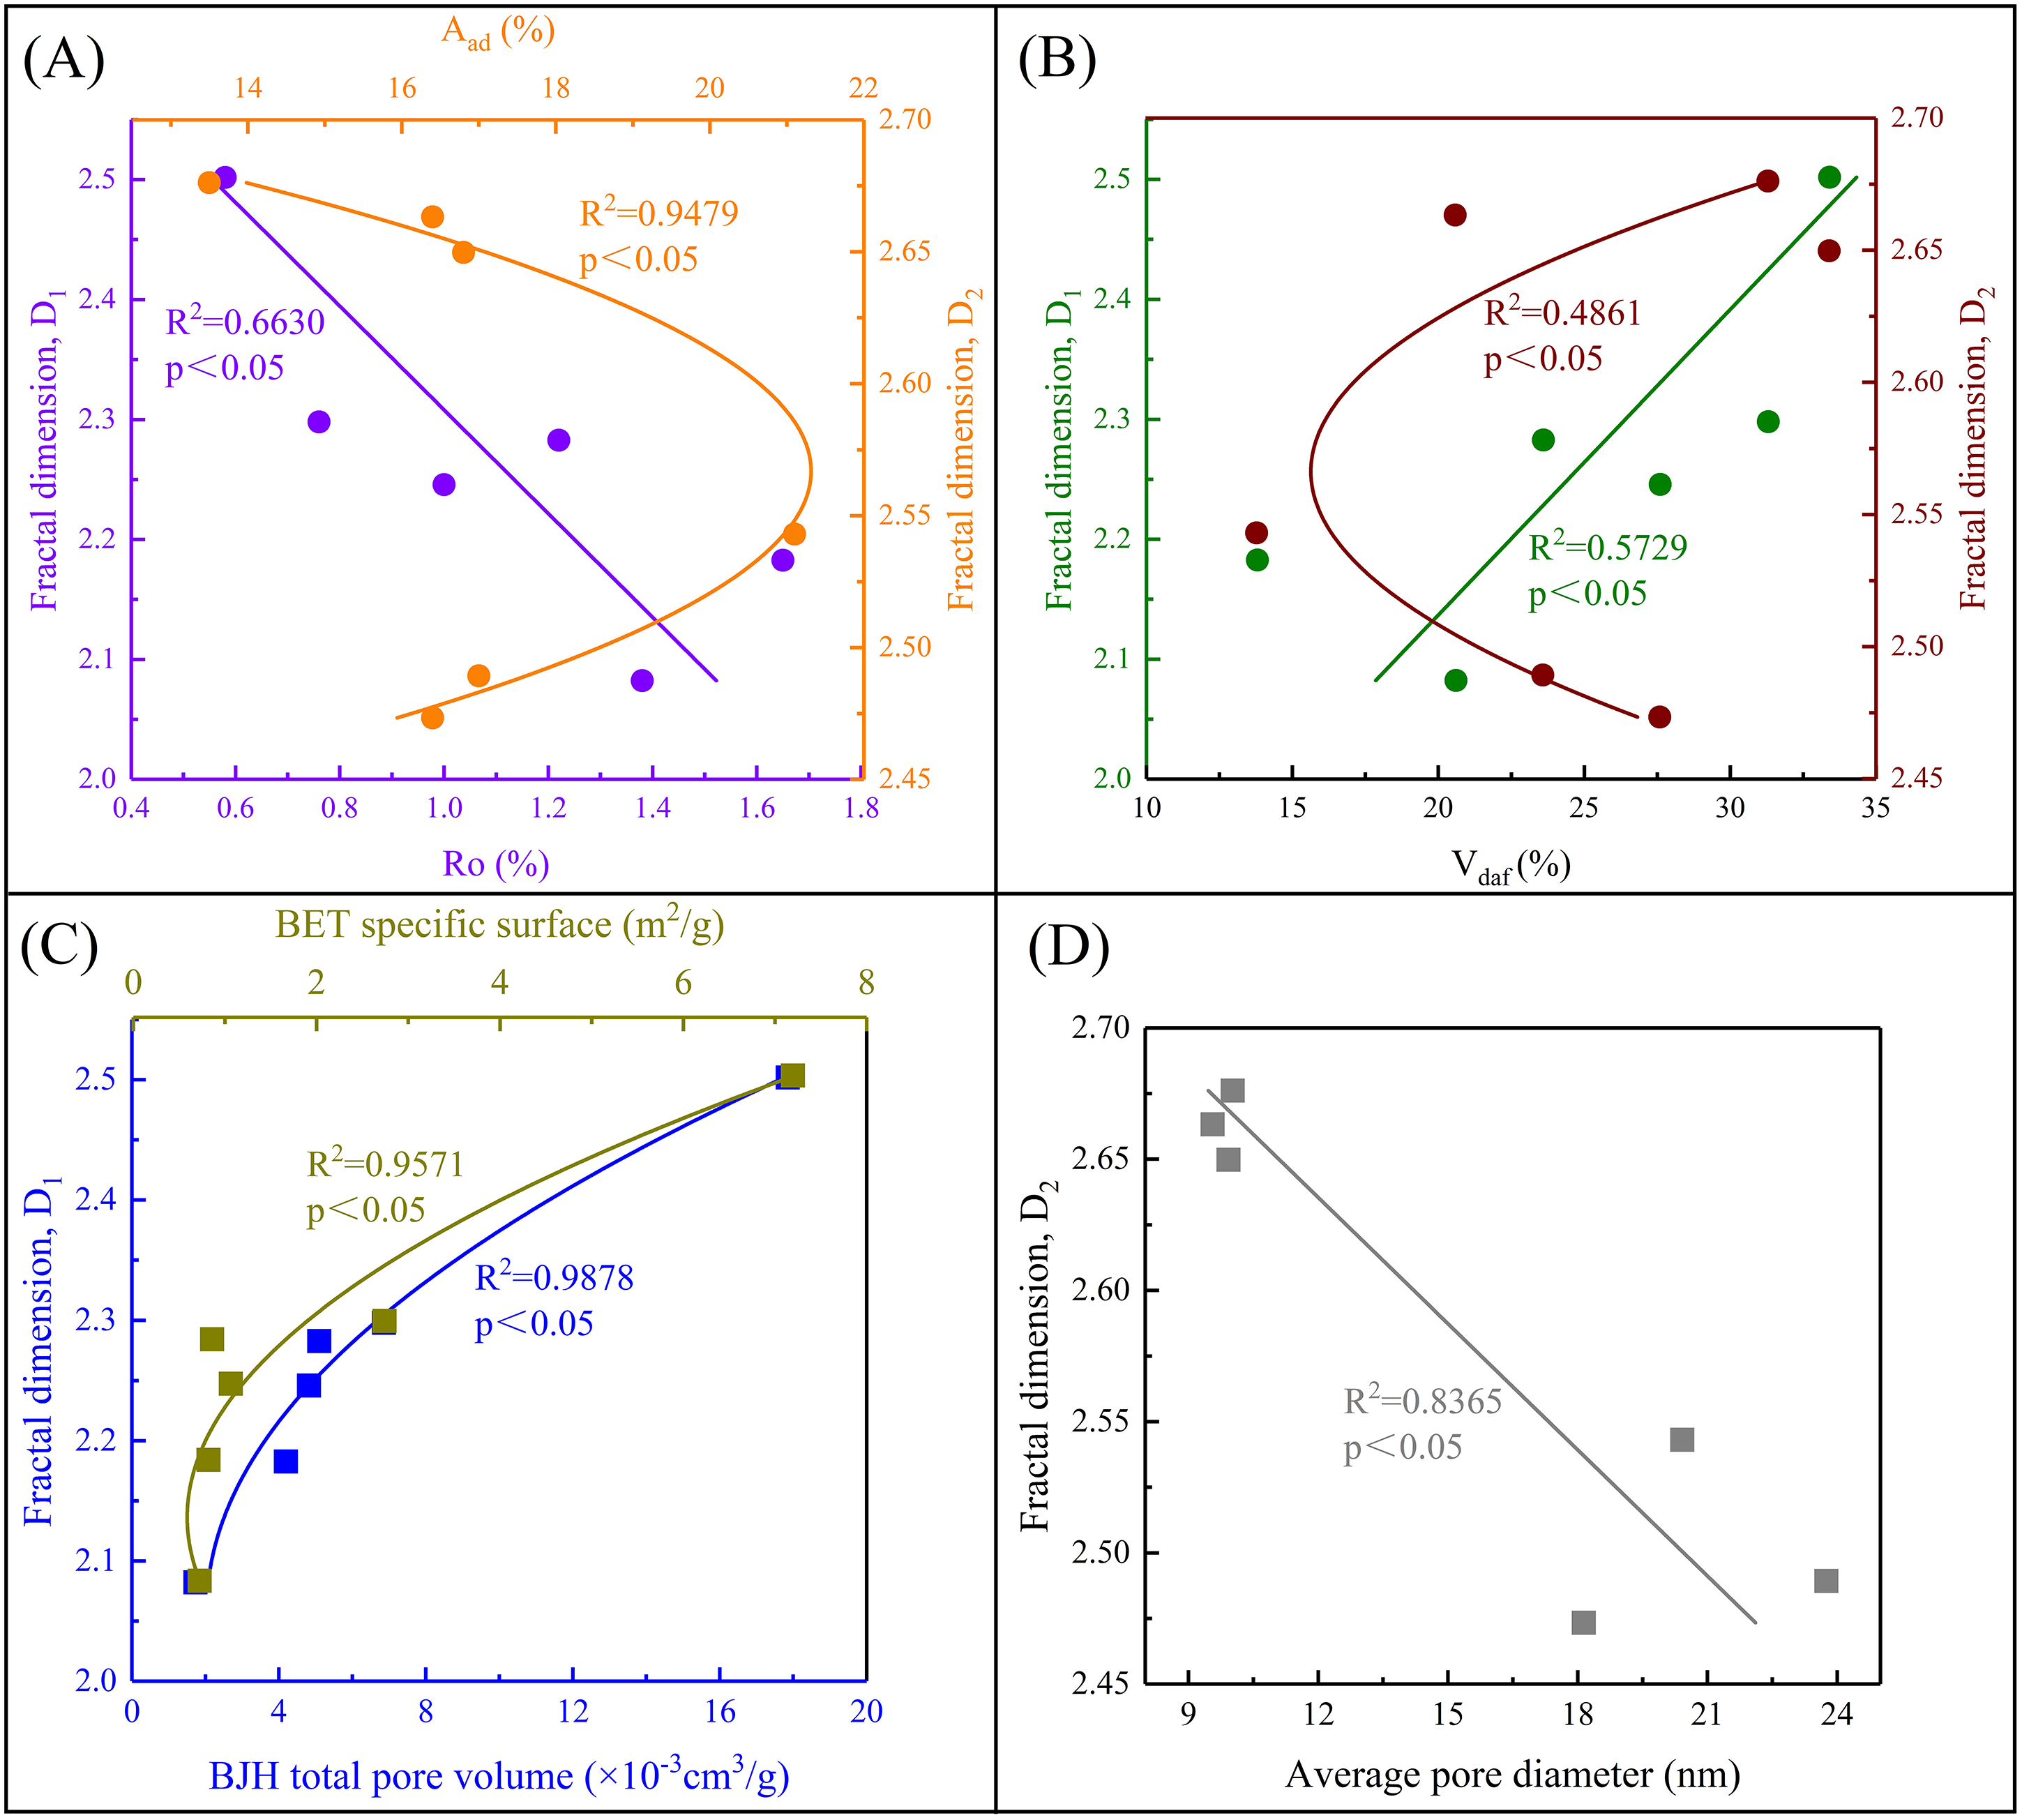
Interrelationships among proximate analysis, pore structural parameters, and fractal dimensions in the coal samples.
Effect of total gas content and water on pore structure of coal
During coalification, the pore structures of coal matrix affect the storage capacity and migration characteristics of gas within coal reservoirs. In the hydrous pyrolysis simulation process, the total gas yield showed an overall upward trend, with the gas samples from HQ-O to HQ-450 primarily consisting of CO2, followed by CH4. CO2 in coal samples is generated through the decarboxylation of organic matter during pyrolysis simulation, and some of its originating from the dissolution of carbonate minerals (Clayton, 1998; Lewan and Kotarba, 2014; Li et al., 2022; Zhang et al., 2024). CH4 is mainly formed by the decomposition of functional groups at low temperatures and the cleavage of long-chain hydrocarbons at high temperatures. These gaseous samples (CO2 and CH4) exert a substantial influence on the formation and evolution of pore structures during thermal maturation processes (Mastalerz et al., 2012; Xu et al., 2021). Except for HQ-400, total gas yields are positively correlated with PD (R2 = 0.8858) (Figure 12(A)), that is, the increase of PD leads to a higher total gas yield. The SSA and PV of HQ-250–HQ-450 demonstrate a strong negative correlation with the total gas yield respectively (Figure 12(B) and (C)). The increase of total gas yield leads to the decrease of the SSA and PV, indicating that the coal structure tends to be denser, with a reduction or closure pores, and a decrease in pore anisotropy. Pyrolysis gases form new pores at high temperatures, potentially disrupting the original pore structure, which contributes to the observed decline in SSA and PV. Furthermore, the total gas production is linearly negatively correlated with D1 (R2 = 0.7260) (Figure 12(D)). As the total gas production increases, the original pores in the coal are destroyed, and secondary pores are formed, resulting in a reduction in SSA and PV, while the heterogeneity of the pore surface decreases. Notably, the relationship between PD, SSA, PV, and other parameters that did not exhibit significant correlations (with R2 below 0.5) have been excluded from the text to maintain conciseness and avoid unnecessary lengthening of the articles.
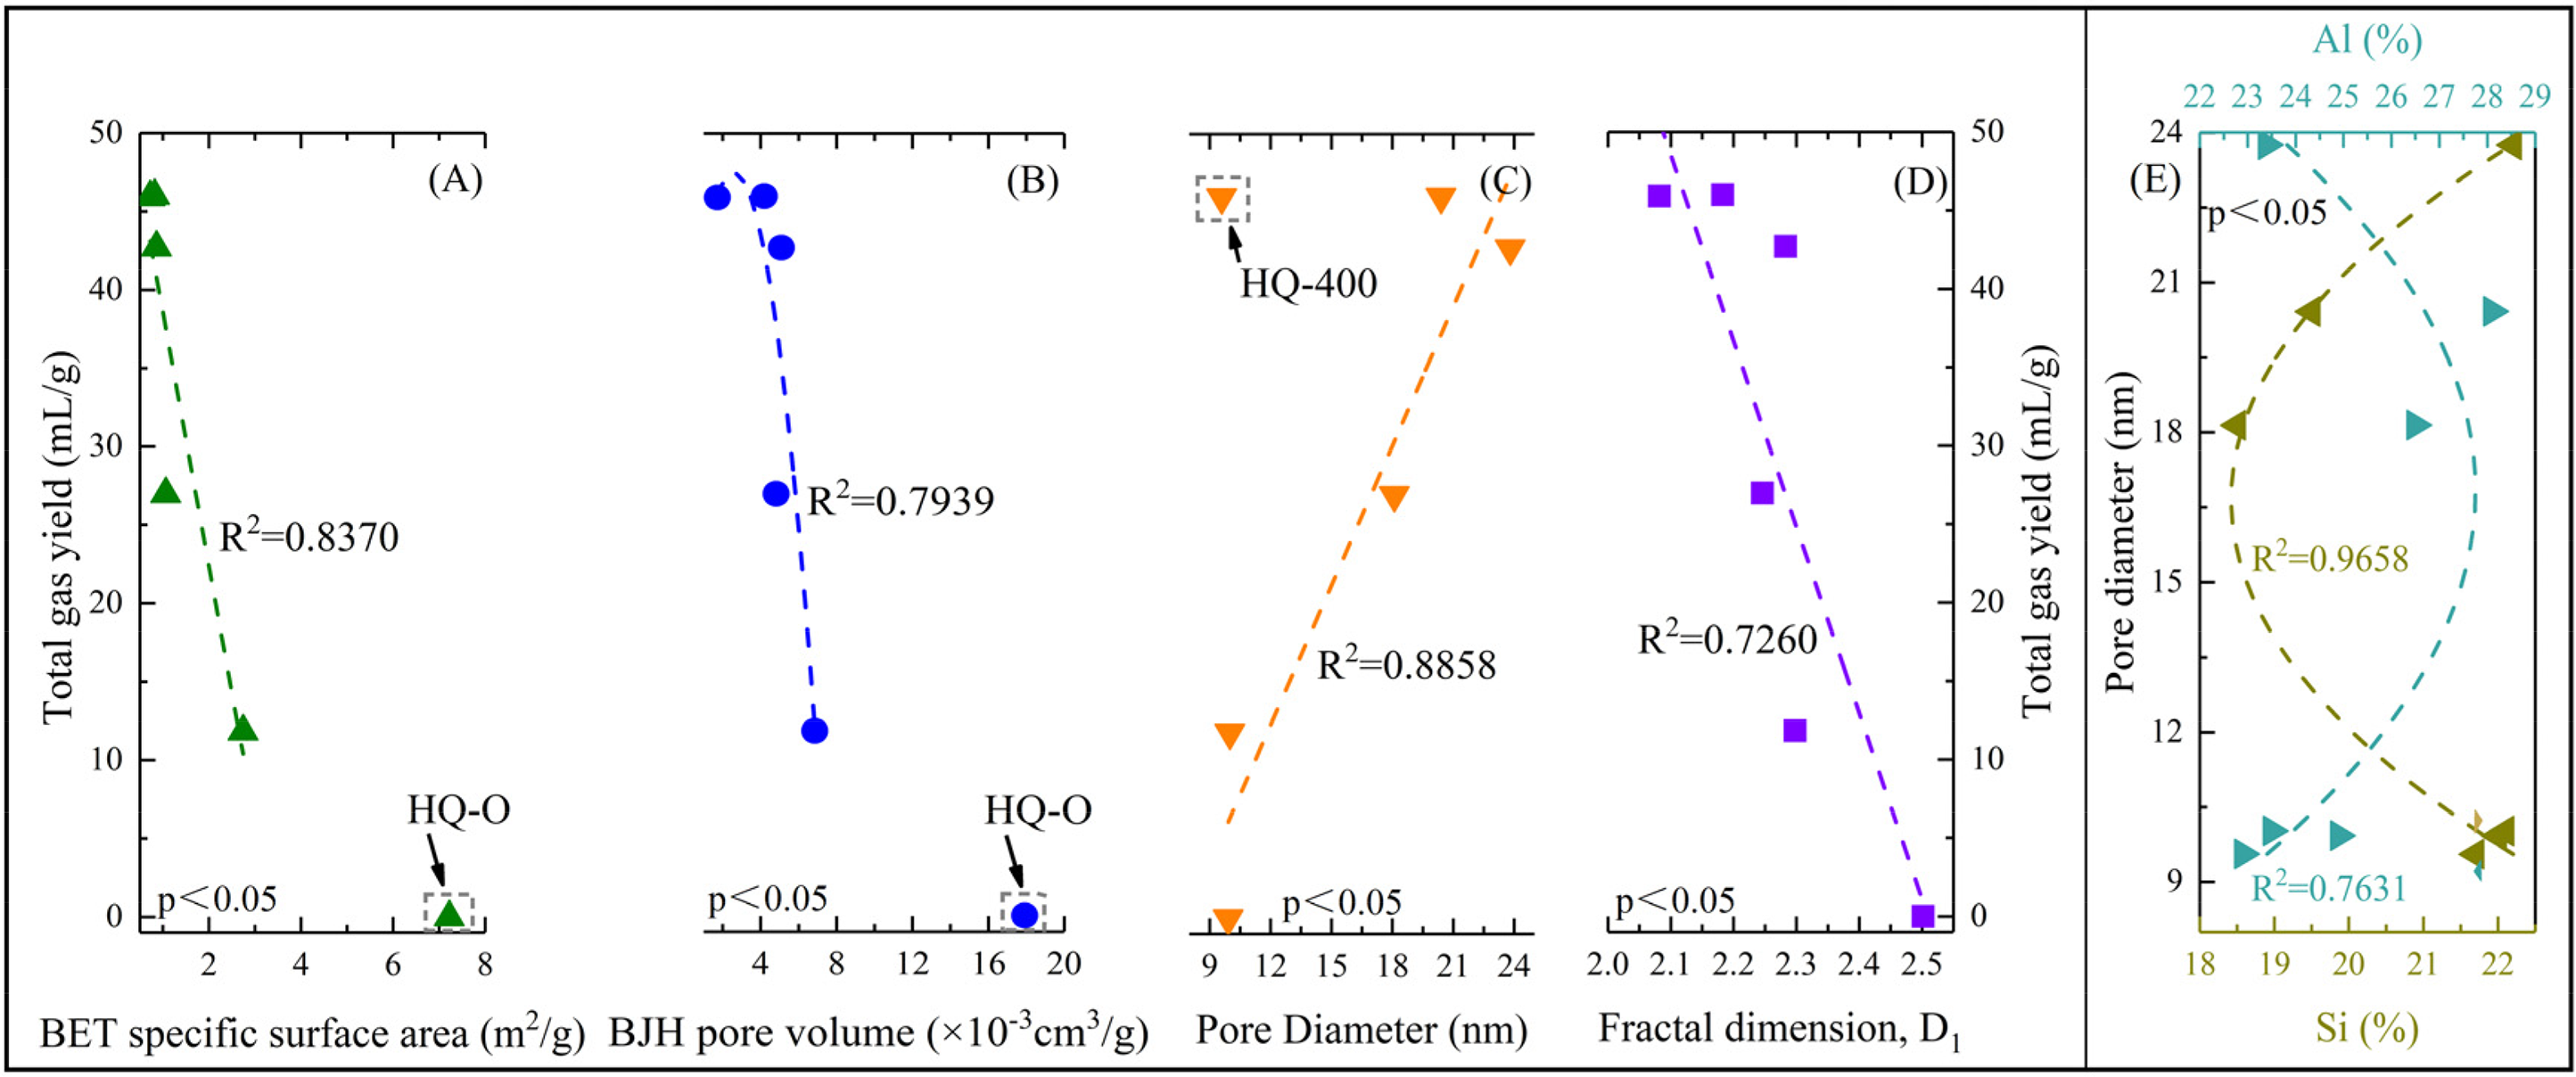
Plots of pore diameter (A), BET SSA (B), BJH PV (C), and fractal dimension D1 (D) versus the total gas yield of coal samples (HQ-O–HQ-450). Major elements Al and Si in relation to pore diameter (E).
Water molecular, as polar molecules, can disrupt the hydrogen bonds between coal molecules when reacting with coal and reduce the cross-linking density between coal molecules, leading to the expansion and swelling of the coal skeleton (Si et al., 2021). Liu et al. (2023a) investigated pore structure at different temperatures through hydrous and anhydrous pyrolysis experiments, and used random forest algorithms to model and predict pore structure changes. The experimental results demonstrated that the influence of water on the transformation of organic matter pore system was greater than that of temperature. Consequently, water has a control effect on the formation and development of organic matter pore structure systems in hydrous pyrolysis simulation experiments, which cannot be ignored by pore system characterization. The swelling effect of water molecular on the coal matrix leads to the expansion and deformation of coal skeleton, and then causes the PV and SSA to decrease in varying degrees (Si et al., 2021). In the CO2 adsorption experiments, both the SSA and PV of ultra-micropores in the coal sample demonstrated an obvious downward trend, which may be due to the influence of water medium on the structural pores.
Water-coal interactions can modify the pore structure when the formation water is involved in CBM storage and transport processes (Liu et al., 2023a; Sun et al., 2015). As temperature increases, the hydrophilicity of kaolinite minerals is enhanced, and its water stability decreases, which are the key geological factors controlling the dynamic evolvement of coal reservoir pore system. In the main coal seams of the Shanxi Formation in the Hedong coalfield, Al mainly exists in the form of aluminosilicate minerals such as kaolinite and illite (Wang et al., 2021). Zhang et al. (2025) analyzed coal samples at different temperatures and found that Al is mainly present in clay minerals, and quartz is one of the main carriers of Si. As shown in Figure 12(E), the contents of Al and PD are distributed in an “inverted C-shape,” while the contents of Si and PD have a “positive C-shape” distribution. The relationship between Si and Al contents in coal samples follows a pattern of “one aspect wanes, the other waxes.” Al occurs in clay minerals, while quartz serves as the main carrier of Si. As the temperature increases, the low melting point of clay minerals contrasts with the high melting point of quartz, resulting in greater fluctuations in Al content compared to Si (Zhang et al., 2025). Initially, the decomposition of clay minerals in coal samples increases the Al content, but at higher temperatures, the Al migrates to the water or gas phase, reducing its concentration in the coal samples. Therefore, due to the involvement of water and the decomposition and migration of minerals, the swelling of clay minerals enlarges the original pores and even merges to form new large pores during swelling and deformation (Lahann et al., 2013; Lu et al., 2016; Yin et al., 2016), thereby enhancing pore connectivity (Figure 13).
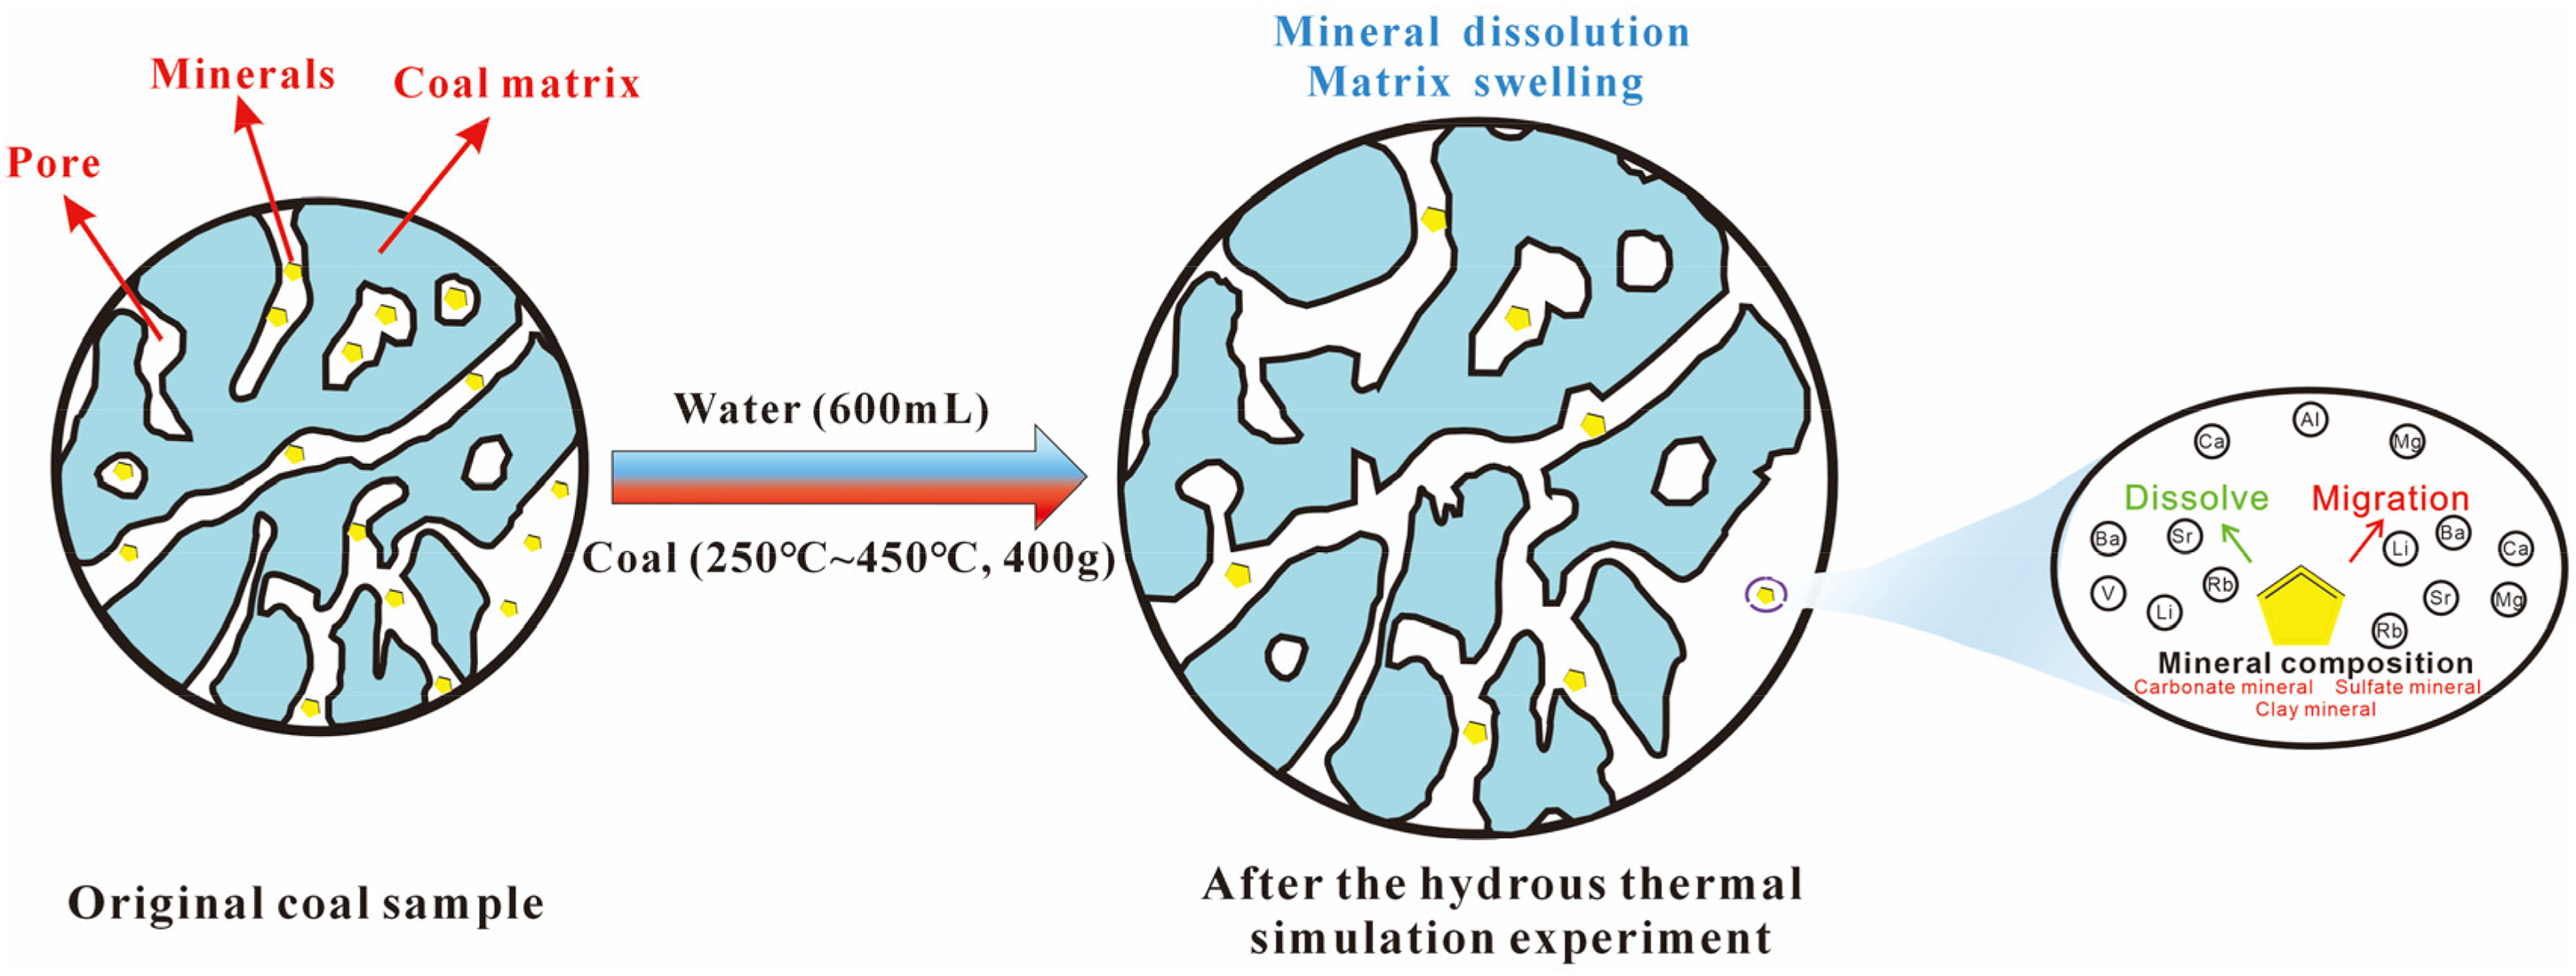
Study on the mechanism of influence of water medium on pore structure of coal samples (modified from Si et al., 2021).
Pore structure evolution model during hydrous pyrolysis simulation
The transformation of pore structures in coal reservoirs is governed by various factors, including the degree of coal metamorphism, maceral composition, geological deformation, and mineral composition. Several studies have analyzed the pore structures across varying coal ranks (Chen et al., 2015; Li et al., 2023; Nie et al., 2015; Wang et al., 2024; Yan et al., 2020). With increasing metamorphism, the contribution of ultra-micropore (LPGA-CO2) to the relative SSA and PV gradually increased. Hydrous pyrolysis simulation experiments effectively simulate the evolution of the pore system in coal samples during thermal evolution and allow for comparisons with the pore evolution of the coal reservoirs at the eastern margin of the Ordos Basin. The interactions of organic matter thermal evolution, gas yields, element content, and pore structure have been studied through the artificial maturation of low-mature coal samples. This research quantitatively analyzes the dynamic evolution of pore network structure and fractal features, and the evolution model of pore structure has been established. Under the influence of temperature, gas and water medium, pore evolution in hydrous pyrolysis simulation can be categorized into three stages (Figure 14).
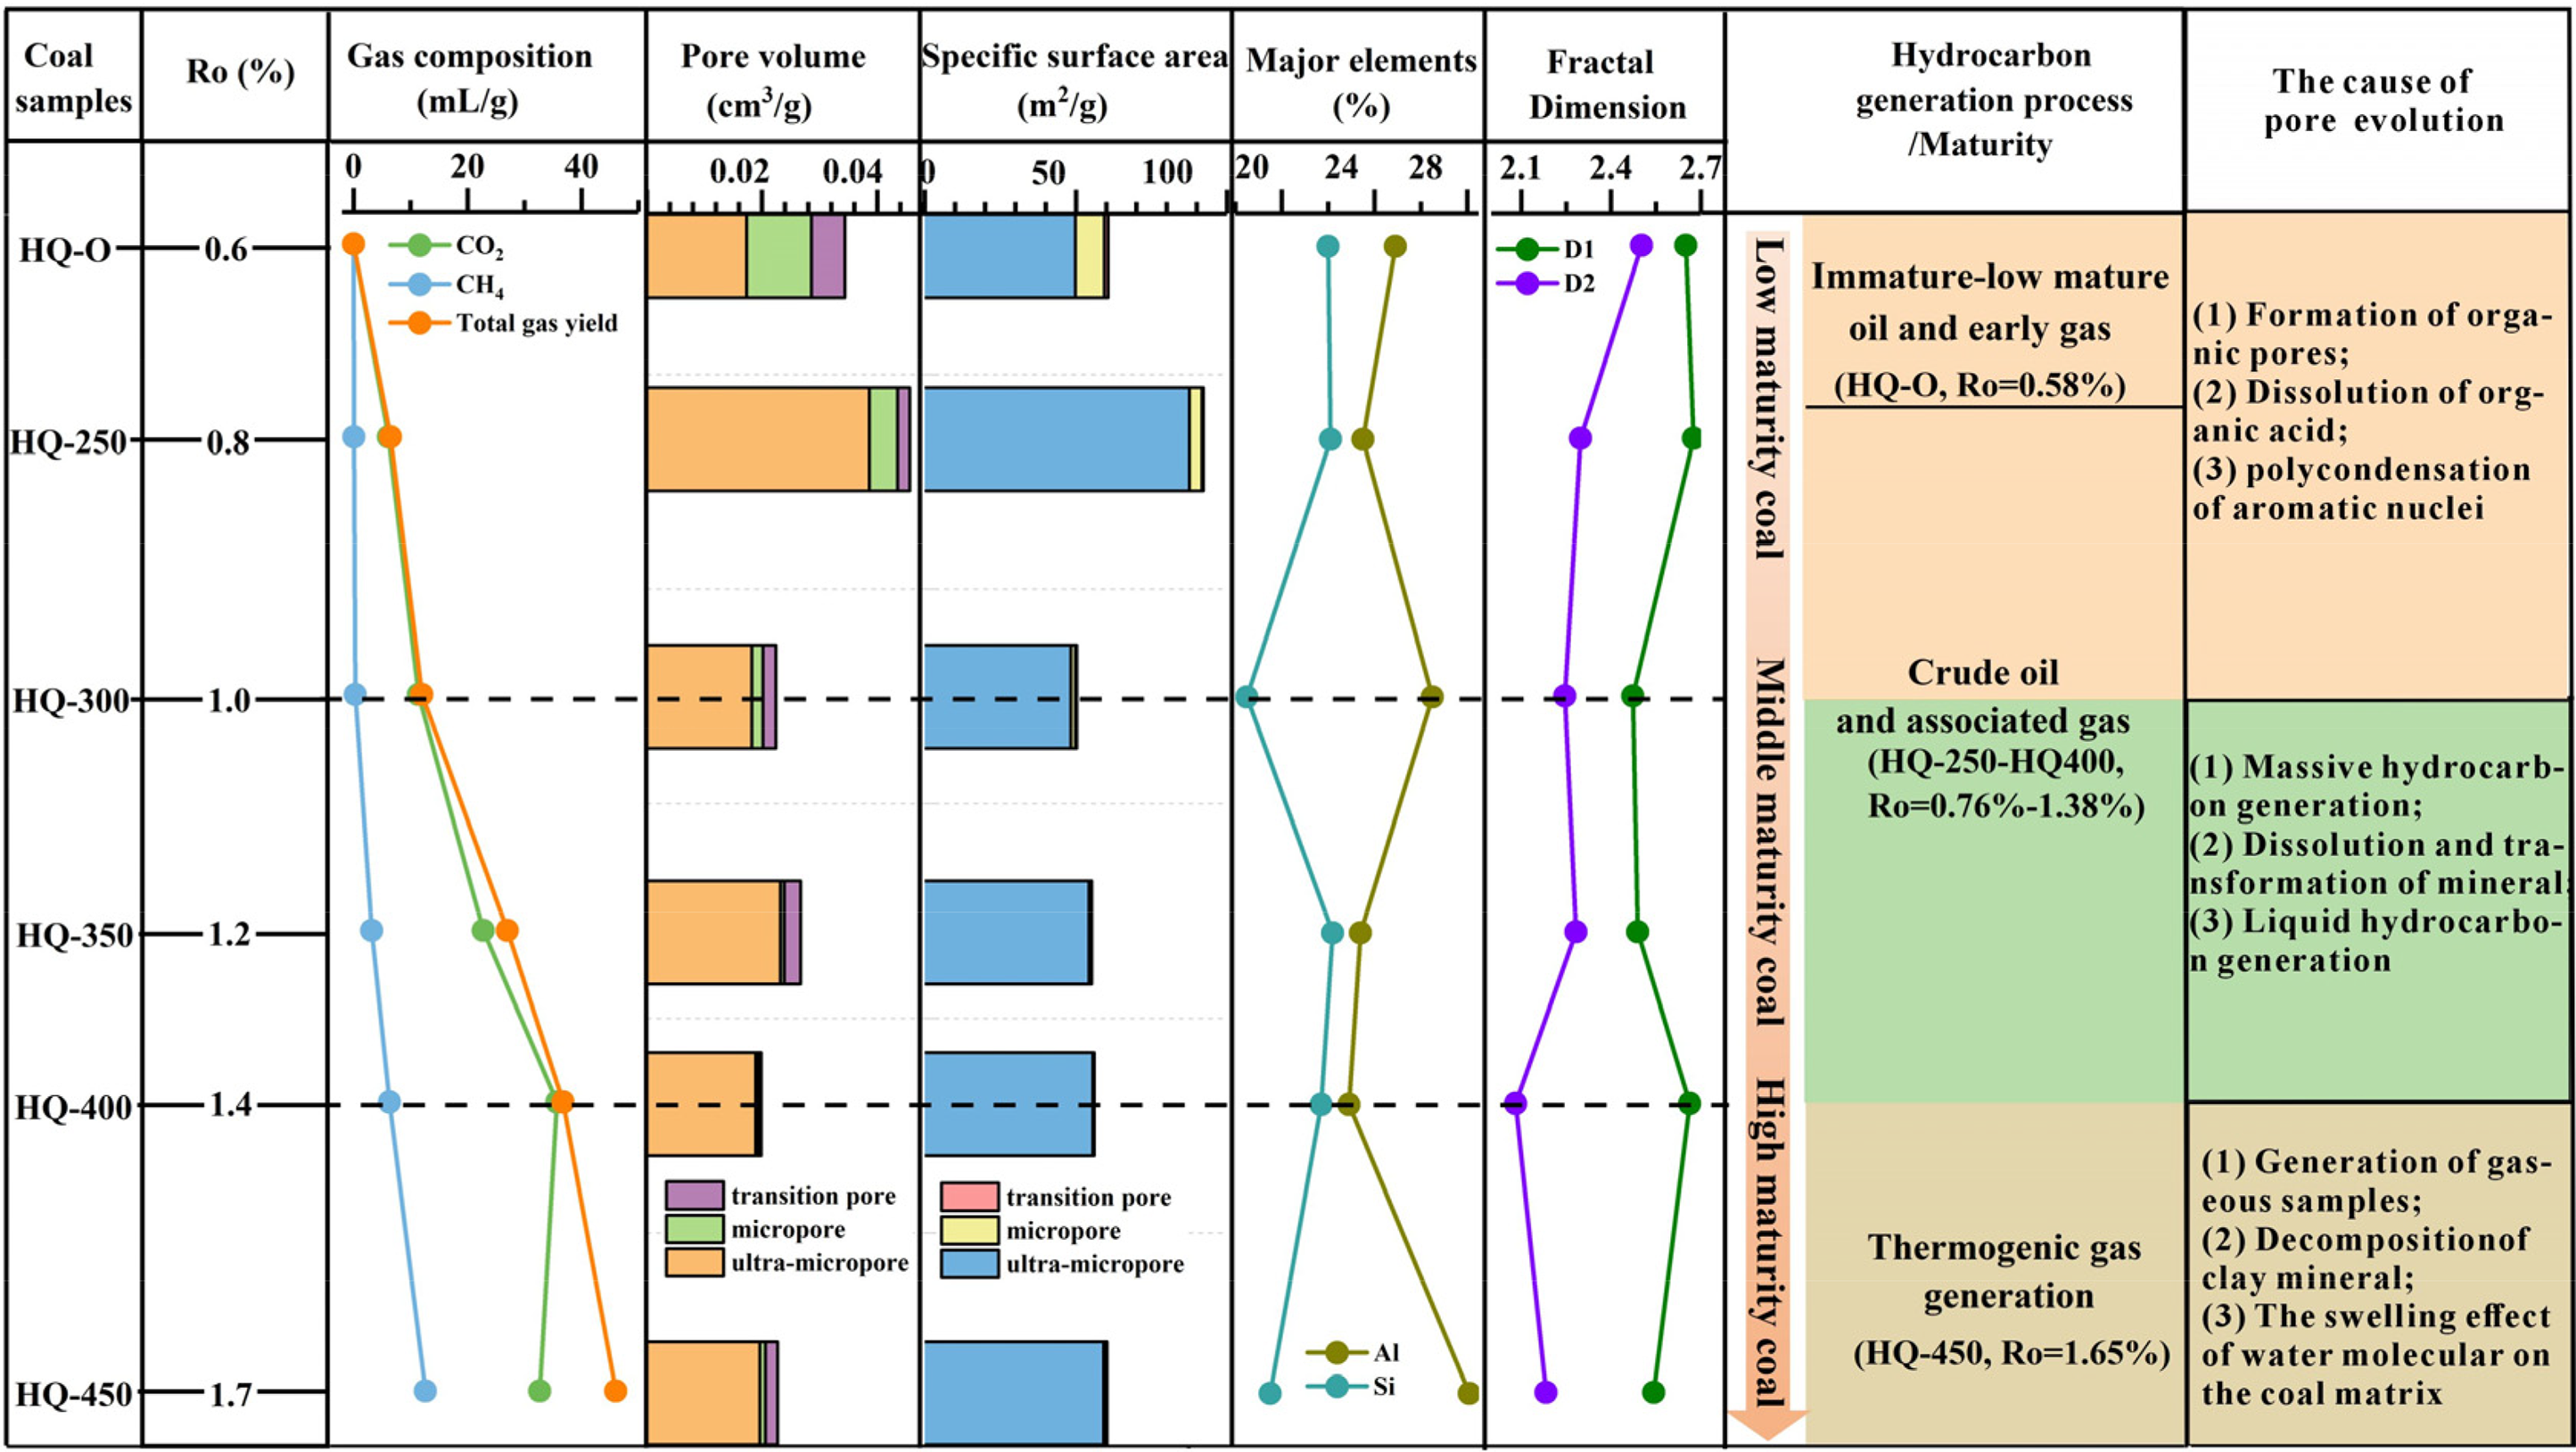
Evolutionary model of pore structure in the processes of hydrocarbon generation.
In the low to medium maturity stage (0.6% ≤ Ro < 1.0%), organic matter generated hydrocarbon slowly, organic matter pores were formed, a small amount of gaseous samples were generated, accompanied by the dissolution of organic acids, and the total PV and SSA increased. The proportion of ultra-micropores increased, resulting in increased PV and SSA. Metamorphism increased the degree of polycondensation of aromatic nuclei, reduced functional groups and side chains, and densified molecular structures, leading to a decrease in PV and SSA proportion of micropores and mesopores. Simultaneously, minor amounts of liquid hydrocarbons and bitumen partially blocked the original pores, causing significantly lower PV and SSA. Correspondingly, both D1 and D2 show a downward trend.
During the medium maturity stage (1.0% ≤ Ro ≤ 1.4%), organic matter evolution enters the stage of massive hydrocarbon generation. With the increase of metamorphism, fatty side chains are broken off, and the asphalt is cracked into small molecular gaseous hydrocarbons, resulting in the increase of gaseous product yields. Affected by dissolution and transformation, the elements in clay minerals migrate, resulting in a decrease in Al content. The proportion of SSA and PV of ultra-micropores increased significantly, and the total PV and SSA increased. In addition, kerogen pyrolysis generates a small amount of liquid hydrocarbons, which blocked some pores and reduced the total PV. D1 increases, while D2 decreases and approaches values close to 2.0, suggesting increased pore surface roughness but greater structural uniformity.
In the high maturity stage (Ro = 1.7%), the gaseous sample yields increase sharply, the pyrolysis creates secondary pores, enhancing overall pore connectively. Ultra-micropores continued to dominate the pore system, and both PV and SSA increased. The swelling effect of water molecular on the coal matrix is enhanced at high temperatures, further causing the expansion and deformation of the coal skeleton. Additionally, decomposition of clay minerals intensifies, releasing Al content into the coal system. Transition pores contribute increasingly to the total PV. Fractal dimension D1 decreases gradually, whereas D2 increases slightly.
Hydrous pyrolysis simulation experiments are widely employed to simulate hydrocarbon generation and evolution of pore structures in the geological timescales, and to elucidate the influence of each single factor on the evolution pattern of the pore system through the control variable methods. Previous studies predominantly focused on the evolutionary mechanism of organic pore structure in shale under the hydrous thermal condition (Cao et al., 2021; Chen et al., 2016; Guan et al., 2022; Sun et al., 2015; Xu et al., 2021), while systematic studies on dynamic evolution of pore structure in coal samples are relatively scarce. This study addresses the gap by referring to the pore evolution characteristics of type III kerogen, and clarifies the quantitative evolution models of pore systems at various thermal evolution stages. Moreover, the pore structure of organic materials is clearly affected by gas generation and mineral dissolution during thermal evolution, but it is debatable whether the change of mineral compositions in coal affects the pore structure. This uncertainty highlights the need for future research to analyze the occurrence and transformation of minerals in coal, which will enhance our understanding of the mechanism driving pore structure evolution. It is worth noting that this discussion has only employed quantitative methods to demonstrate the process of studying pore structure, but in-depth qualitative characterization has not yet been carried out, which will be addressed in subsequent studies.
Conclusions
Hydrous pyrolysis simulation experiments were conducted on six coal samples with different metamorphisms (HQ-O–HQ-450) as research objects. The study systematically analyzed the CO2 isothermal adsorption curves, nitrogen adsorption/desorption curves, pore morphology, and pore structural parameters in six coal samples. The changes in pore structure were quantified by combining fractal dimensions, and the effects of gas yield and water on pore structure were examined. Additionally, the variation characteristics of pore structure parameters with metamorphism and the correlation between pore parameters were investigated, resulting in the establishment of a coal pore structure evolution model in coal reservoir. The following conclusions are drawn.
(1) The matrix pores in HQ-O to HQ-450 mainly include ultra-micropores, micropores, transition pores, and a smaller proportion of mesopores. The N2 adsorption capacity of HQ-O to HQ-450 increases with the relative pressure increases, and the adsorption process of N2 in coal samples mainly manifests as single-layer adsorption and multi-layer adsorption. The adsorption/desorption isotherms of HQ-O, HQ-250, and HQ-300 exhibit hysteresis loops, indicating the existence of ink bottle pores. HQ-350 and HQ-450 are characterized by parallel plate shaped pores (H3 type), while the pore type of HQ-400 is slit shaped pores (H4 type).
(2) The thermal evolution of organic material significantly affects the micropore and transition pore structures. At HQ-250 (Ro = 0.8%), aromatic condensation and side chain loss resulted in a denser molecular structure, thereby reducing PV and SSA. At HQ-400 (Ro = 1.4%), aromatization and the formation of small gaseous hydrocarbon reduce the PV and SSA to the minimum. The pronounced gas generation of HQ-450 (Ro = 1.7%) and the enhanced expansion effect of water molecules lead to the expansion and deformation of the coal skeleton, forming secondary pores, which promoted the increase of PV and SSA. The roughness of pore surfaces is affected by SSA and PV of micropores and transition pores, while pore diameter influences the heterogeneity of the pore structure. As the temperature increases, the decomposition of clay minerals increases the Al content, which subsequently migrates into the water or gas phase, reducing its concentration in the coal matrix. The involvement of water and mineral dissolution, the expansion of clay minerals of the original pores, and the merging of pores ultimately enhance pore connectivity.
(3) Under the influence of temperature, gas, and water media, the pore evolution model during the hydrous pyrolysis simulation can be categorized into three distinct stages: low-to-medium maturity (0.6% ≤ Ro < 1.0%), middle maturity (1.0% ≤ Ro < 1.4%), and high maturity (1.4% ≤ Ro ≤ 1.7%). The development of pore systems in coal samples is jointly driven by hydrocarbon generation from organic matter, the generation of gaseous samples, and the dissolution, decomposition, and migration of clay minerals. Throughout all stages, ultra-micropores consistently dominated the SSA and PV contributions of the pore system.
Footnotes
Funding
The authors disclosed receipt of the following financial support for the research, authorship, and/or publication of this article: The project was funded by the National Natural Science Foundation of China (numbers: 42472235 and 42430805) and the tackling applied science and technology projects of China National Petroleum Corporation (number: 2023ZZ18YJ01).
Declaration of conflicting interests
The authors declared no potential conflicts of interest with respect to the research, authorship, and/or publication of this article.