
Abstract
Pore size distribution is one of the most important structural characteristics of filter cloths and can, in theory, be used to predict filtration performance. Capillary flow porometry is a common method to determine the pore diameter(s) and the pore size distribution of a porous material. Equipment applying this method has many advantages, but data processing and further calculations still require refining to be fit for purpose in calculations of flow capacity. The present study aims to develop a new procedure for processing volumetric flow rate data and corresponding pressure, which are measured by capillary flow porometry. The processed data are further used to calculate the pore size distribution of textile materials. Six industrial samples of polypropylene filter cloth were examined using scanning electron microscopy and capillary flow porometry. The raw data measured by the capillary flow porometer were processed using the developed method that considers changes in flow regimes as pressure increases. In addition, the nonideality of pores, originating from tortuosity, an irregular cross-sectional shape of the pore, and the number of pores, were considered in calculations by combining all these characteristics in one single parameter. This work shows that pores in a textile material are not ideal cylinders. The standard pore size distribution calculations should consider an imperfect pore structure and, therefore, be corrected.
The filter medium is one of the essential components of a filter and determines the performance of the whole filtration process.1,2 Various physical and chemical properties of polymers and large numbers of threads interlacing and forming weave patterns result in industrial fabrics which are widely used on the market as filter cloths. 3 Out of all possible cloth materials, polypropylene is the most widely used. 4
The central role of any filter medium in solid/liquid separation is to ensure the separation of a suspension into solids and clean filtrate.2,4 Thus, the cloth works as a barrier for holding the solids on/or inside its surface, wherein the filtrate passes through the porous structure of the fabric. The success of this separation process and the capacity partially depend on the porous structure of the material. This structure determines hydrodynamic resistance, adsorption, and other medium properties. 5
The porous structure of a cloth material consists of a relatively large number of voids or pores that are either connected or not connected and distributed within the material in an ordered or unordered manner. 6 The main parameters that describe the porous structure of the cloth are pore diameter, porosity, pore size distribution (PSD), pore volume, specific surface area, etc. In addition, identifying the most common pore sizes is vital because these pores define the majority of the fluid flow and filtration processes occurring in the filter cloth. 5
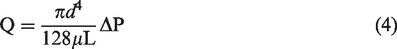
Existing methods for measuring the porous structure of material provide a wide range of data, starting from the determination of the bubble point pore diameter (BPPD) and ending with a PSD. One of these methods is capillary flow porometry, which is of particular interest because it directly imitates those capillary processes that determine the functional properties of porous materials. 5 The main principle of capillary flow porometry is to measure the pressure necessary to blow air through pores filled with a liquid. The pores are considered capillaries; that is, the distance between the walls of these pores is comparable to the radius of curvature of the liquid surface that is located in these pores. An example of a pore filled with a wetting liquid is shown in Figure 1.
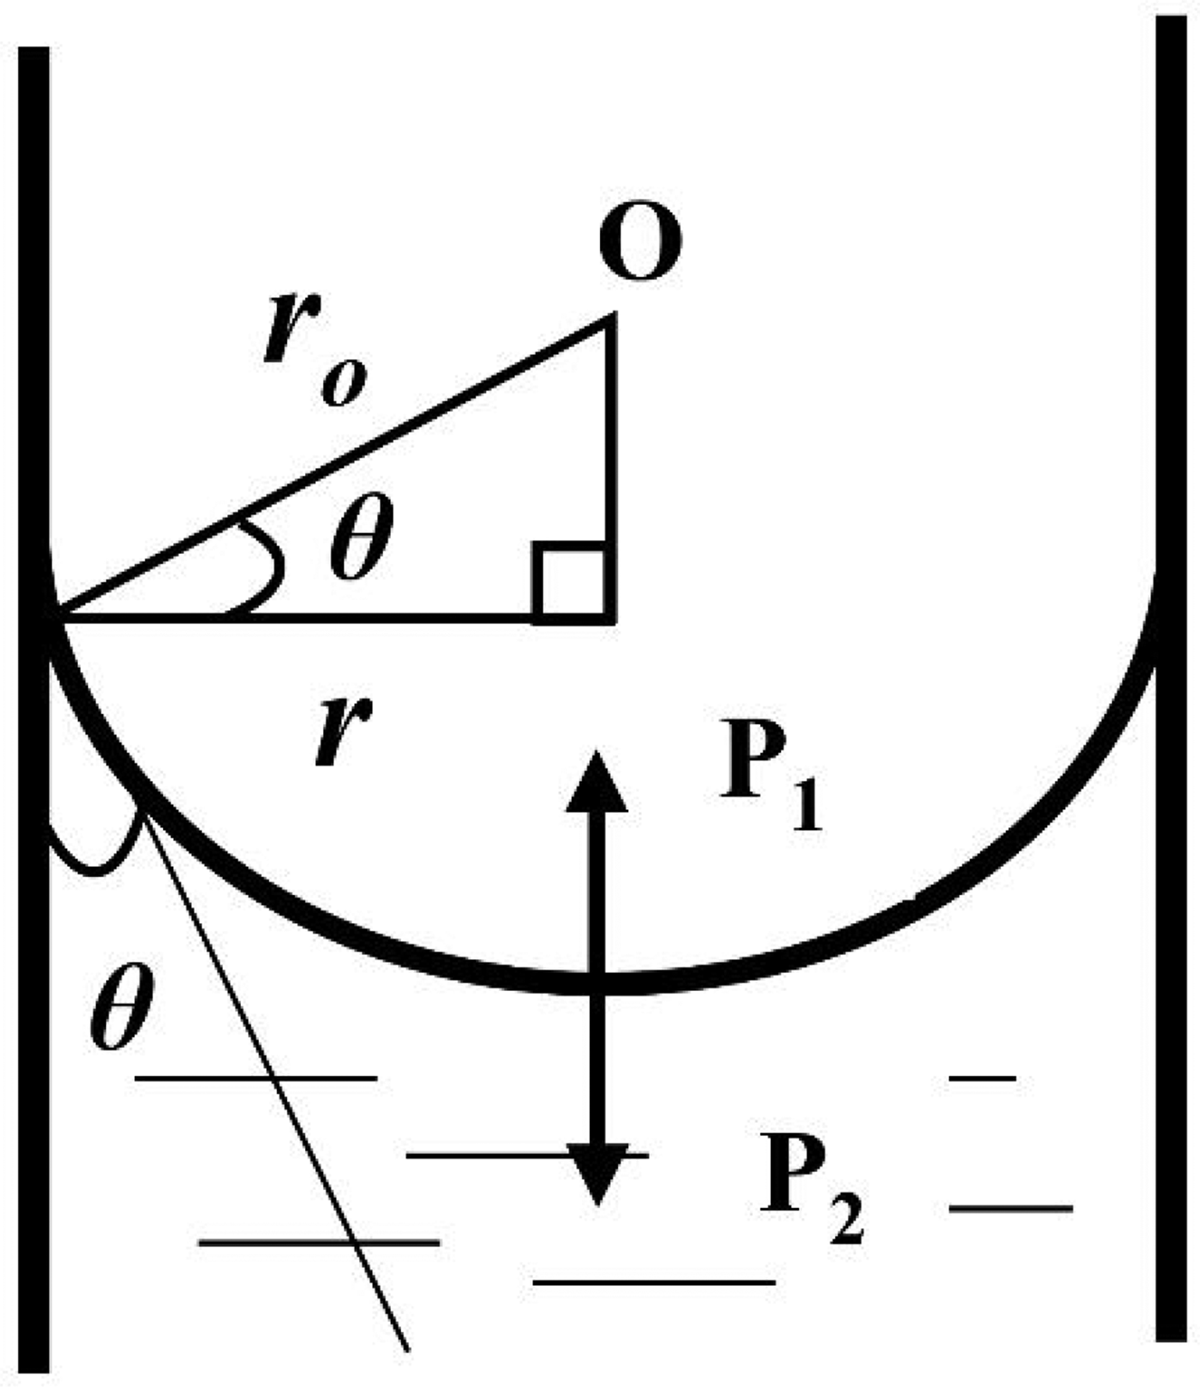
Parameters related to the meniscus: O is the centre point; θ is the contact angle between the filter cloth surface and wetting liquid; r0 is the meniscus radius; r is the pore radius; P1 is the Laplace pressure; P2 is the hydrostatic pressure.
A wetting liquid can rise in the pores due to the liquid surface pressure and the forces on the gas–liquid interface; that is, Laplace pressure (P1). This pressure (P1) is directed towards the centre of curvature of the meniscus and is equal to 2σ/r0, where σ is the surface tension of the liquid (mN/m) and r0 is the radius of the meniscus (m). Gravity influences the liquid inside the pore too, and is naturally directed downwards. Thus, the liquid rises until the hydrostatic pressure (ρgh, P2) is equal to the Laplace pressure (P1):7,8
The meniscus can be expressed as part of a sphere with a centre point O, as shown in Figure 1. The contact angle θ (o) between the filter cloth surface and the liquid would equal 0; that is, when the wetting liquid wets the cloth surface completely. If r is the pore radius, then r0 = r/cosθ. Equation 1 can then be re-written as 2σcosθ/r = ρgh. When ρgh is designated as ΔP, and pore diameter (d) instead of radius (r) is used, the pressure to overcome the Laplace pressure and the surface tension of the liquid to empty the pore can be calculated as follows:7,8
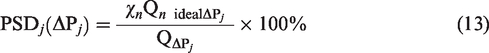
The pressure from equation (2) is called the bubble point pressure because a gas bubble could pass through the emptied pore at this pressure. Based on the standard ASTM F316 describing the calculations used in porometry, equation (2) is modified and consists of a capillary constant.9,10 Then, equation (2) can be rewritten:

The diameter of this opened pore is called the bubble point pore diameter (BPPD). It follows from equation (2) that the smaller the pore diameter, the greater the pressure must be to empty the pore.10,13,14
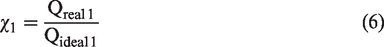
The gas flow that passes through the porous cloth sample can be measured as a function of pressure. In capillary porometry, a sample is measured twice – when it is dry and completely wetted by a wetting liquid. Sufficient wetting is required to satisfy the precondition that all the pores in the sample are completely wetted; that is, the contact angle between the cloth surface and the liquid is equal to zero.5,10 The gas pressure is applied over the sample. Following this, the pressure gradually increases until the first pore and all the subsequent pores are emptied of the wetting liquid, and the gas can pass through those pores. The differential pressure as a function of the gas flow rate is also measured using the same pressure range for the dry sample measured. A curve obtained as a result of the test with the wetted sample is used to determine the pore diameters in the sample. The test with the dry sample provides a curve that allows for determining the air permeability of the sample. In addition, these curves are later used to calculate the PSD. An example of the dry and wet curves is shown in Figure 2.10,14
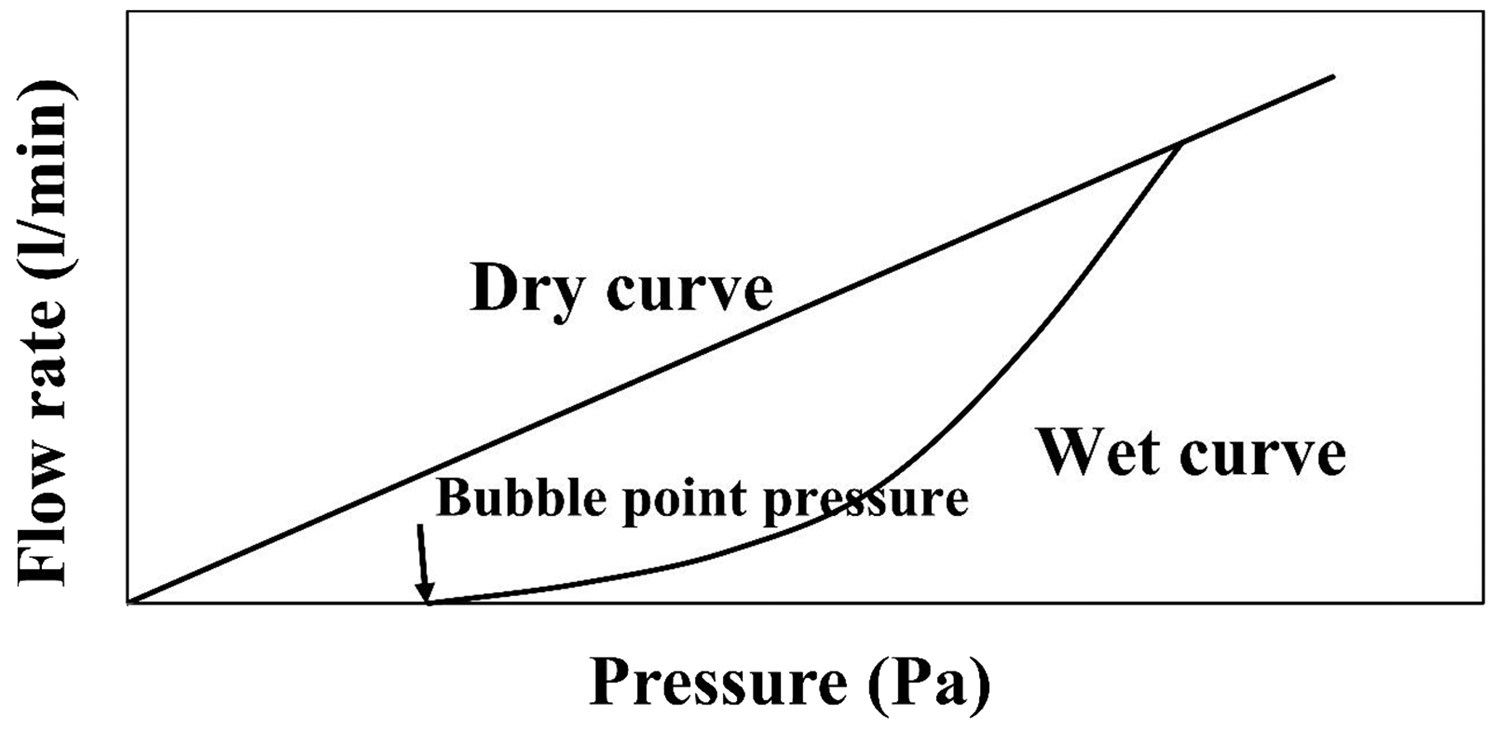
An example of a dry and a wet curve obtained in porometry. The dry curve is measured with a dry sample, while the wet curve is obtained after wetting the sample with the wetting liquid.
This technique is described and used in several technical papers4,13–26 and has many advantages, one of which is the possibility to measure numerous characteristics of a porous material, such as the largest and mean pore sizes, the PSD, gas permeability, and the envelope surface area. This nondestructive technique does not damage the sample and thus allows the reuse of the sample several times. Unlike mercury intrusion porosimetry, the technique does not require toxic substances,5,13,14 and is simple, robust, and versatile. 15
Although capillary flow porometry has many advantages, it has also been criticized by some scientists. For example, pore volume and blind pores cannot be measured or detected. 14 Lydon et al. 16 pointed out that the exact measurement of the bubble point in capillary flow porometry is also crucial because the bubble point signifies the starting point of the PSD, and the determination of the remainder of the PSD depends on this starting point, among other factors. In addition, repeatability has been poor in some cases, and the results depend on operating conditions and parameters. 22 However, one of the main disadvantages of capillary flow porometry is that it assumes that a porous material can be represented as a bundle of parallel cylindrical tubes with circular cross-sections.10,20,22–25 After all, it is widely acknowledged18,22,23,25,26 that most filter media have a complex porous structure. Viswanathan et al. 24 pointed out that this simplified representation of the porous geometry, which neglects the complexities associated with an irregular cross-section of the pores, can be a source of error in the estimated filter properties. It has thus been under scrutiny as to whether capillary flow porometry really allows measuring and determining the PSD in porous structures whose structure departs from a simple system of cylindrical pores in parallel.18,22,23,25
Although the pores in woven filter media might be located in parallel due to the relatively organized structure of such materials, the shape of the pores in such materials is far from ideally cylindrical. Lydon et al. 16 stated that the cross-sectional path through the woven filter media is tortuous, especially in a composed or double-layered weave structure. For their fabrics, Lydon et al.16 used a tortuosity factor equal to 1.7. Mourhatch et al. 19 and Agarwal et al. 25 mentioned that the morphology of a pore space, which includes pore tortuosity, length, shape, size, and density, strongly affects the flow, transport, reaction, separation processes, and accurate and realistic characterization of the filter medium. Agarwal et al. 25 have studied the effect of pore tortuosity on the results obtained in porometry and found that the bubble point pore size significantly decreases and merges with the mean flow pore size with increasing tortuosity. The authors also reported that a porometer user needs to account for the shape factor to get unbiased results. Mourhatch et al. 19 postulated that the measured data are usually utilized by fitting them into a model that is thought to represent faithfully the structure of the porous material under consideration. However, if such a model does not contain enough information on the crucial characteristics of a porous material, it cannot be expected to provide accurate results. The tortuosity factor and any other parameters associated with the pore morphology must be considered and involved in the calculations of PSD to obtain reliable and scientifically approved results. Therefore, one of the main targets of this paper is to determine a specific value able to describe the porous morphology and include it in the calculation procedure of the PSD.
Another issue associated with the criticism of the standard calculations of the PSD used in porometry is that the PSD obtained by this technique does not differentiate between the pore throats and bodies. Maalal et al. 22 state that the pore throat is defined as constrictions in the pore space, while the pore body is defined as the local larger cavities. Making such a distinction between the pore body and throat is decisive and crucial for transport phenomena. Moreover, Maalal et al. 22 stated that ‘the pressure drop between two adjacent pore bodies can be controlled by the constriction connecting them when this constriction is sufficiently narrow compared to the pore body size’. Maalal et al. 20 stated that the constrictions in the pore space that correspond to the throat play an essential role because the menisci tend to get pinned in the constrictions during a drainage process, which is the result of capillary effects. As well as these points, Mourhatch et al. 19 mentioned that the flow and transport processes through the porous materials are strong functions of the pore distribution in the pore space and their connection to one another. Besides Mourhatch et al., 19 Islam et al. 21 postulated that the law governing gas flow through capillaries under conditions of porometry data acquisition seemed to be not well formulated. The authors mentioned that the software for the commercial porometers practically applies only the Young-Laplace equation mentioned in equation (2) for pore diameter determination. Thus, it treats the porometry flow data phenomenologically, relating the portion of gas flow to a given pore diameter range. In such circumstances, a flux equation is avoided, and consequently, no information can be obtained about the pore tortuosity, pore uniformity and pore number density distribution. The increase in pressure leads to a rise in the flow rate that causes the loss of order and turbulent flow. 27 Moreover, DeNevers 28 reported that the tortuous pore structure could also lead to changes in the flow direction, creating vortices and, therefore, turbulent flow. The raw data obtained in capillary flow porometry provide us with the volumetric flow rate and pressure. To obtain results that describe the actual pore structure with its tortuosity and shape factors which influence the flow states, the changes in the flow states during the pressure increase must also be considered. Therefore, another main goal of the present study is to evaluate and include information about the change in flow during pressure increase.
An assumption could be made that comparing the wet sample with the dry sample in porometry can eliminate the effects of tortuosity, shape factor, etc. Indeed, this concept can be relevant in the case of pores with an ideal cylindrical shape when only one value of the measured pore diameter is sufficient to characterize it. In this case, the porometer measures and records the value of the most constricted part of the pore diameter. This single diameter value is enough to describe the whole pore because it has an ideal cylindrical shape. Then, the equipment measures the volumetric flow rate through this pore. After that, the PSD is calculated based on the measured volumetric flow rates. This is how the current calculation method of capillary flow porometry works.
When considering a textile material or industrial woven filter cloth used in this work, the pores in such material are far from ideal cylinders; in fact, they are tortuous, and their inlets can have various shapes. As previously mentioned, the porometer measures the diameter of the most constricted part of a pore. However, as Maalal and colleagues20,22 have mentioned, the pore has its body and throat; that is, the pore diameter above and below the most constricted part can be much larger than the measured one. Therefore, the volumetric flow rate calculation through this imperfect pore will differ from that calculated for an ideal pore. Consequently, the PSD, calculated based on the values of the volumetric flow rates, will also vary.
When calculating the PSD for actual textile samples with nonideal cylindrical pores, the user cannot be sure that a single pore diameter value can describe their pore. Therefore, the user cannot be sure that the recorded value of the volumetric flow rate corresponds to a single diameter value in a pore. Rather, it corresponds to the whole pore, which is described by the various values of diameters. Therefore, the user cannot trust the PSD values measured for ideal cylindrical pores while working with a material having imperfect pores.
Thus, the purpose of the present study is to propose a new method for calculating the PSDs of woven filter cloths, whose actual pores do not have ideal cylindrical shapes. For this purpose, equipment applying capillary porometry is used to obtain raw data of differential pressure and the volumetric flow rate passing through wet and dry samples. These data are further processed to calculate the pore diameter of the most constricted part of a pore. The volumetric flow rate through a pore having an ideal cylindrical shape with the measured diameter is calculated. Then, the obtained value is compared with the measured value of the volumetric flow rate through a real pore with the same pore diameter. A coefficient obtained during this comparison will describe the nonideal structure of a pore. In addition, the changes in the flow regimes due to an increase in the differential pressure for each pore range are also considered and applied to the calculations. Based on the refinements, information on PSD for materials with nonideal pore structures, such as woven filter media, can be obtained.
Development of the calculation methodology
To calculate the PSDs of woven filter media, data obtained directly from the measurement of airflow through dry and wet samples and the corresponding pressures necessary to overcome the surface tension forces of the wetting liquid and the capillary forces; that is, the pressures required to empty the pores, were used.
A cloth material can be considered a structure containing separate channels; that is, pores, with varying diameters – essentially cylinders with circular cross-sections. When airflow passes through pores that resemble long straight cylinders, the volumetric flow rate can be calculated by the Hagen–Poiseuille equation:
29
An increase in the flow rate due to constantly increasing pressure leads to a loss of order, creating vortices; that is, turbulent flow. 27 The relationship between the flow rate and the pressure in such conditions would not be linear as in equation (4). According to Hassenboehler, 30 turbulent gas flow is described by many empirical constants and dimensionless numbers. However, these constants are not universal for all porous structures and textiles. Therefore, Hassenboehler 30 proposed an approach with less constants that required assumptions derived from fluid mechanics to describe the turbulent gas flow through fabrics. According to this approach, the turbulent flow through textile structures is proportional to one half of the power of the pressure drop. Hassenboehler 30 mentioned that this was also a widely observed empirical result for turbulent flow through porous textiles. A similar approach to describing the turbulent flow through textile materials was also used by Jaksic and Jaksic. 31
According to Hassenboehler,
30
when the fluid flows through channels of different sizes, each size contributes to the energy loss factor for the combined parallel flows. When laminar and turbulent flows are combined at some ΔP, the resultant flow versus pressure drop can be expressed as a power function having an intermediate exponent n between 1 and ½:

Characteristics of the pore and the porous structure
Equation (4) provides the volumetric airflow rate through an ideal pore with a diameter corresponding to the bubble point pressure. It must be mentioned that this discussion refers only to the first stages of the measurements. The equipment also records the actual value of Q through this BPPD. However, the real pore is not an ideal cylinder with a circular cross-section, as real pores in a cloth sample have irregular shapes and structures, especially in industrial cloths and multilayered samples. 16 Due to the flexible nature of yarns and different weave structures, the pore sizes and shapes in a fabric are not uniform over the entire surface. 4
Gupta 14 has explained that the shape factor, λ = dp/d, of a pore is the ratio of the maximum diameter of the particle, dp, which could pass through the measured diameter d. The particle diameter correlates to the pore diameter through the relationship dp = λd, where the value of λ for a slit cross-section is 0.71, and for a square cross-section, it is 1. 14 Despite the relatively ordered structure of a cloth weave, each pore in a cloth has an individual cross-section; that is, the shape factor λ would have a unique value for each pore. Averaging over a sample would supposedly result in a significant error, and two samples with distinctly different porous structures could result in the same PSD despite differences in pore shape.
A tortuous path within a pore of a filter cloth affects the airflow rate. The tortuosity factor (τ) can be expressed as the ratio of the actual length of the flow path L e to the thickness of the porous medium L, or in other words, to its thickness. 35 Lydon et al. 16 and Vallabh et al. 35 concluded that the tortuosity factor for textile materials would be above 1 and not higher than 2. Several factors influence tortuosity, such as fibre diameter, fibre web thickness, and porosity. Subsequently, tortuosity is quite challenging to measure, 35 and most likely, tortuosity is specific for each pore in a cloth sample.
The number of pores also influences the airflow passing through a filter cloth – the more pores in a cloth sample, the more free space for air to flow. Seitz and Maurer 36 pointed out that the number of pores significantly influences the filter cloth selection along with the pore shape, pore size, and air permeability. Determination of the number of pores in multifilament cloths is a rather complicated procedure due to the tiny pores located between the fibres within the multifilament yarns.
Coefficient of nonideality and PSD calculations
The calculation procedure starts by processing the raw data obtained by the porometer, namely the corresponding pressures measured for the dry and wet samples and the volumetric flow rates.
The dry curve; that is, the flow through the dry sample against the pressure drop, is plotted to analyze possible transitions from laminar to turbulent flows. When the changes in the flow regimes occur, the sharp transitions in the dry curve indicate the flow change from laminar to turbulent and can be described by the exponent n 30 mentioned in equation (5). Thus, the exponent n for each pressure step is determined separately.
The pressure required to empty the pores in a wet sample is used to calculate the pore diameter. It should be mentioned that the capillary constant, which is used to calculate the pore diameter by equation (3), is unknown for the studied samples and would require further investigation. However, such investigation of the capillary constant requires particulate analysis and experimentation and is out of the scope of this paper. Therefore, equation (2) is used to calculate the pore diameter.
The initial steps in capillary porometry include wetting the textile sample, which leads to filling all the pores with the wetting liquid. The porometer increases the flow up to the point at which the gas pressure can empty the largest pore in the sample. This pressure is called the bubble point pressure, and the diameter of the pore(s) opened at this pressure is the BPPD(s). The pore is emptied, and the airflow can then easily pass through it. The porometer registers the airflow as a volumetric flow rate through a wet sample.
Initially, it can be assumed that the studied sample consists of only one pore of cylindrical shape. As the bubble point, pressure and pore diameter are known, the volumetric flow rate through an ideal cylindrical pore with the bubble point diameter can be calculated by equation (4). Thus, Qideal 1, or the volumetric flow rate, valid only for a cylindrical pore with a circular cross-section corresponding to the bubble point diameter, is obtained.
As mentioned above, an actual pore in a textile sample is not an ideal cylinder, but rather is usually tortuous with different shapes of the inlet and outlet. Moreover, the airflow passing through a pore can undergo gas slippage effects, better known as the Klinkenberg effects.
37
The comparison of the volumetric flow calculated for the ideal cylindrical pore with the BPPD and the volumetric flow rate recorded by the porometer at the same pressure results in a new coefficient, calculated as follows:
Thus, this new coefficient χ replaces A in equation (5), complementing it with all other effects used to describe the pore structure and possible gas slippage and compressibility effects:

After the porometer empties the pore(s) which have the bubble point diameter, the gas pressure increases again until the subsequent assembly of pores with a diameter smaller than the previously opened pores is empty from the wetting liquid. These pores opened at ΔP2 are again assumed to be ideal cylinders. Q2 ideal ΔP2 can be calculated by equation (4).
When these pores are emptied, the air now passes through these new pores and the pores previously opened by the bubble point pressure. Thus, the total airflow, which is recorded by the equipment, is a sum of flows through the first and second range of pores:
38

QΔP2 is a known parameter measured by the equipment. The calculation of the volumetric flow rate by equation (7) through the first range of pores with the diameter d1 at ΔP2 and the coefficient χ1 (see equation (6)) provides the values for Q1ΔP2. Equation (8) can be rewritten then:

χ2 is now known. Then, Q2 ΔP for all the pressure steps can be calculated now using equation (7).
A further increase in the gas pressure leads to emptying all the subsequent pores in the sample. The calculation procedure is repeated until the flow through all the pore diameters is processed and computed. Equation (9) can be rewritten:

Now, when all the flows through all the pore diameters are calculated at each pressure step, the PSD can be found. The PSD of a cloth sample can be compiled as the fraction of flow in percentage through each pore size range PSD
i
(ΔP
j
) at the last pressure step. This final pressure ΔP
j
empties all the pores in the sample; that is, the sample is free from the wetting liquid. The PSD is calculated by the equation:
Materials and methods
Materials
In the present work, woven filter media manufacturers provided the samples, six of which were selected for testing. According to the information provided by the manufacturers, all the samples were made of 100% polypropylene yarns. The reason for selecting woven filter media made of polypropylene was based on the filtration characteristics of such cloths. In their work, Purchas and Sutherland 4 mentioned that polypropylene and polyesters are the most widely used polymers for producing fibres and filaments for filter media. Most monofilament and multifilament cloths for liquid filtration are made of polypropylene. The main criteria for selecting woven filter media made of polypropylene is their ability to operate for a considerable period of time at moderately high temperatures (120–125°C), in addition to their cost and filtration properties. Woven filter cloths made of polypropylene show excellent chemical resistance against attack of biological agents, alkalis, mineral and organic acids, and fair resistance against oxidizing agents and organic solvents. The physical properties of the polypropylene fibres are as follows: maximum safe continuous temperature is 120°C; specific gravity is 0.91; absorbency for water (% wt) is 0.01–0.1; wet breaking tenacity (g/den) is 4–8; elongation at breaking (%) is 15–35; resistance to wear is good. 4
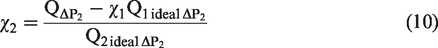
Three samples consisted of only monofilament yarns (cloths 4, 5 and 6). The porous structure in such fabrics is relatively simple; that is, pores are located only between the interlacing points of the yarns. The other three samples (cloths 1, 2, and 3) consisted of a combination of mono and multifilament yarns. In such cloths, the pore structure is already more complex; that is, the flow passes through and around the yarns. Thus, the applicability of the developed technique described in this paper to mono and multifilament cloths can be tested. Another reason for the selection of the studied samples was their diversity. Table 1 shows that almost all the samples had different weave patterns providing various pore shape factors. Moreover, all the samples had different thicknesses, and two of the cloths (cloths 1 and 2) were double layered, which implied a tortuous path of their pores. All these parameters mentioned have a potential effect on flow, and the set of samples chosen is a good representation of the variety of filter cloths used in the industry. The specific characteristics of the cloths are presented in Table 1. All the cloths were calendared from both sides. Except for the square weight measured by weighting, all the data presented in the table were determined using scanning electron microscope (SEM) images, as shown in Figure 3. The warp and weft density, thickness, and the square weight values represent the average of three measurements for each cloth.
Structural characteristics of the studied filter cloths obtained with scanning electron microscopy images
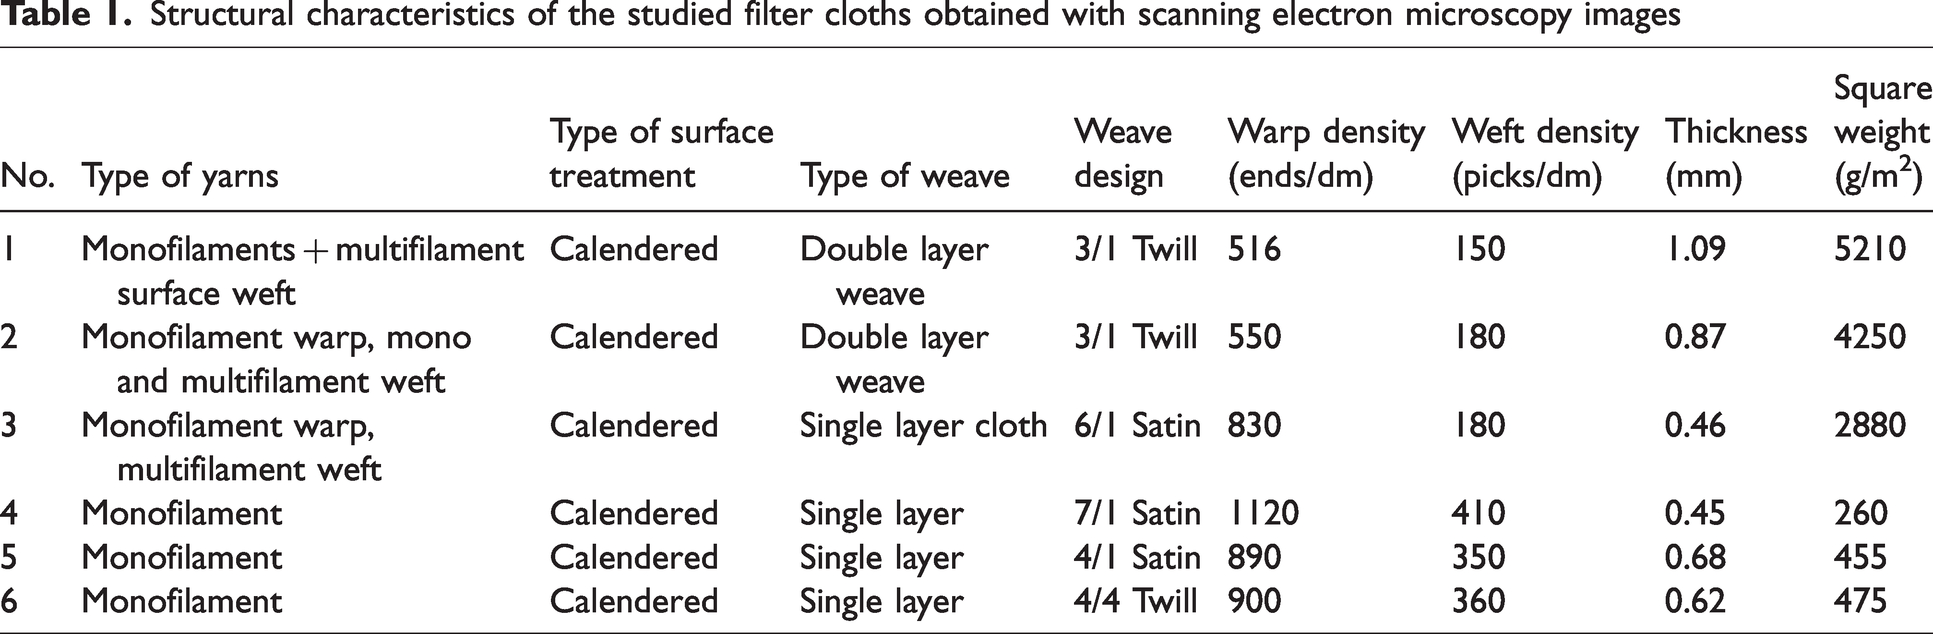
Scanning electron microscopy images of the surfaces and cross-sections of the six filter cloths with sample codes. The numbering corresponds to Table 1. Triangular, rectangular, and slit shapes are added to illustrate the shape factors.
Scanning electron microscopy
To investigate the structure of the cloth surfaces and the cross-sections, a SEM was used. Thus, a rough estimate of the pore shape, tortuosity, and the number of pores in the samples could be obtained. A JEOL JSM-5800 SEM with a BE/C detector was used for obtaining the SEM images. To increase electrical conductivity for imaging, all the samples were first gold coated with an Edwards Scancoat Six sputter coater. The acceleration voltage was 15 kV.
Contact angle measurement
To carry out reliable tests with the capillary flow porometer, the contact angle of the wetting liquid against the testing materials should be measured. According to the standard ASTM F316, 10 the wetting liquid must completely wet the test material. Therefore, the contact angle between the filter cloth surface and the wetting liquid should equal 0.
The contact angle between the Silwick wetting liquid and the polypropylene sample was measured by an Attension Theta Optical Tensiometer (Biolin Scientific AB). The polypropylene sample was without any pores that could disrupt the measurement. A drop of a wetting liquid of 3 µL was placed on the surface of the polypropylene sample with a micro syringe. The equipment recorded the contact angle in the solid-liquid–air interface. Five measurements were performed to ensure the repeatability of the results. The average of these data was used as the final result. The temperature during the measurements was 23°C.
Capillary flow porometry
The PSDs of the six cloth samples were measured with a PMI advanced capillary flow porometer. The general principle of capillary flow porometry was previously described in the first section.
Silwick wetting liquid, or silicon oil (surface tension 0.0201 N/m), was chosen as the wetting liquid to perform the experiments. The manufacturer of the PMI equipment provided this wetting liquid. All the samples were placed in a silicon oil bath under a vacuum for 1 h to facilitate wetting. Then, the wetted sample was inserted into a sealed chamber, and the gas pressure was applied over the wetted sample. When the pore (pores) was free from the wetting liquid, air passed through it freely, and the equipment recorded the airflow rate. Increasing the flow rate further resulted in smaller pores being emptied from the wetting liquid. The gas pressure was gradually increased until all the pores in the sample were free from the wetting fluid. Thus, the porometer provides the values of airflow rates and pressures for each range of pores. The measurement was repeated on a dry sample, and the equipment recorded the airflow values through the dry sample at different pressure steps.
The PMI method consists of electromechanical components, electronics, software, and control parameters. Electromechanical components include a control valve for the flow, a detector of the volumetric airflow, and sealing devices. The valve position is measured by the computer in counts, where 1 count equals 0.1 cc/min. The counts are further converted to conventional units (L/min) seen in the report. The lowest number of counts possible for each incremental opening of the regulator, 5 counts, was used.
The pressure regulator incrementation, or the number of counts to increment the regulator, controls the amount of pressure let into the system. The lowest number of counts, 0.3 counts, was chosen to provide the most accurate result.
Before each test, a F/PT factor is adjusted because this factor is associated with the determination of the BPPD: F means flow, P is pressure, and T is time. When the F/PT factor becomes equal to the set value of the parameter, the bubble point pressure is recorded. The proper adjustment of this factor is crucial because it influences the quality of the measured data. Based on initial investigations, the F/PT factor was set to 100, and the bubble flow value was set at 2.4 cm3/min to produce accurate results.
The diameter of the circular testing area was 16 mm, the pressure range was from 0 to 0.5 bar, and the tests were performed for all the cloth samples. On each piece of cloth, the tests with the porometer were repeated three times. Then the measured data were processed to produce the PSD for each sample using the average of three replicates. All the parameters described in this section and used for testing the studied samples were chosen based on the initial investigation. Thus, they influence the accuracy of the measurements and duration of the test. Parameters were tested and developed only for woven filter cloths. The standard deviation for the BPPD was between 1.5% and 7%.
Results and discussion
Sample characteristics
The SEM analysis provided images of the surface and cross-section of the cloth samples. All the images are shown in Figure 3.
As can be seen in Figure 3, all the cloths have their unique structure. Each of these cloth samples had pores with different shapes and cross-sections. However, it can be noted that all samples had some pores with a slit cross-section, which means that the shape factor of such pores is 0.71. 14 Some pores in cloths 1, 3, 4, and 5 had a triangular shape (shape factor is 1.0), while cloth 6 had some pores with a rectangular shape (shape factor is 0.75). Some pores whose pore shape resembles a slit, triangle, or rectangle are marked in Figure 3 according to their shape. A factor capable of describing the cross-section of each of the pores in a cloth sample is not easy to define based on SEM images. The flow path is impossible to determine or predict as well. Moreover, the number of pores cannot be calculated precisely, especially for the multifilament cloths 1, 2, and 3, because these cloths consisted of some tiny pores located between the fibres of the multifilament yarns.
Results of the contact angle measurement
As the standard ASTM F316 states, 10 the wetting liquid must completely wet the material to perform the test with the capillary flow porometer. The material is considered to be completely wetted when the contact angle is zero. Gupta 14 explained that when the contact angle between the wetting liquid and material equals 0, the wetting liquid can spontaneously fill the pores in the solid without any external aid. The user manual of the porometer 39 advises using Silwick, developed by the manufacturer of this equipment, because this liquid has a low surface tension and vapour pressure, and it wets the porous sample quickly. Measurement results of the contact angle between the Silwick wetting liquid and polypropylene material confirmed that this wetting liquid wetted the sample completely with zero contact angle. In the present study, the Attension Theta Optical Tensiometer could not record any pictures or data because the wetting liquid wetted the surface immediately. However, zero contact angle was the target, which was achieved. The contact angle measurements proved that Silwick could be used in further measurements with the porometer.
Determining flow regimes
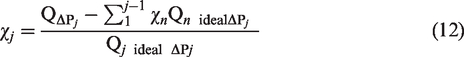
The capillary flow porometer provided information about the pressure needed to empty the pores in the wet samples and the volumetric flow rate that passed through the wet and the dry samples at this pressure. The relationship between the pressure and the volumetric flow rate for one of the cloth samples for a dry sample is presented in Figure 4, which shows that the dependency between the pressure and the volumetric flow rate was not linear, indicating transitions in flow states. As previously proposed, the observed curvature might be due to the flow changing from laminar to turbulent. 29 Hassenboehler 30 mentioned that most textiles are described by a power function, as in equation (5). The coefficient n is associated with the nature of the flow and can be precisely determined from the plot of the flow rate against pressure. The data identified two specific cases: (a) those in which n was practically unchanged with increasing pressure; and (b) those in which n would change as pressure increased.
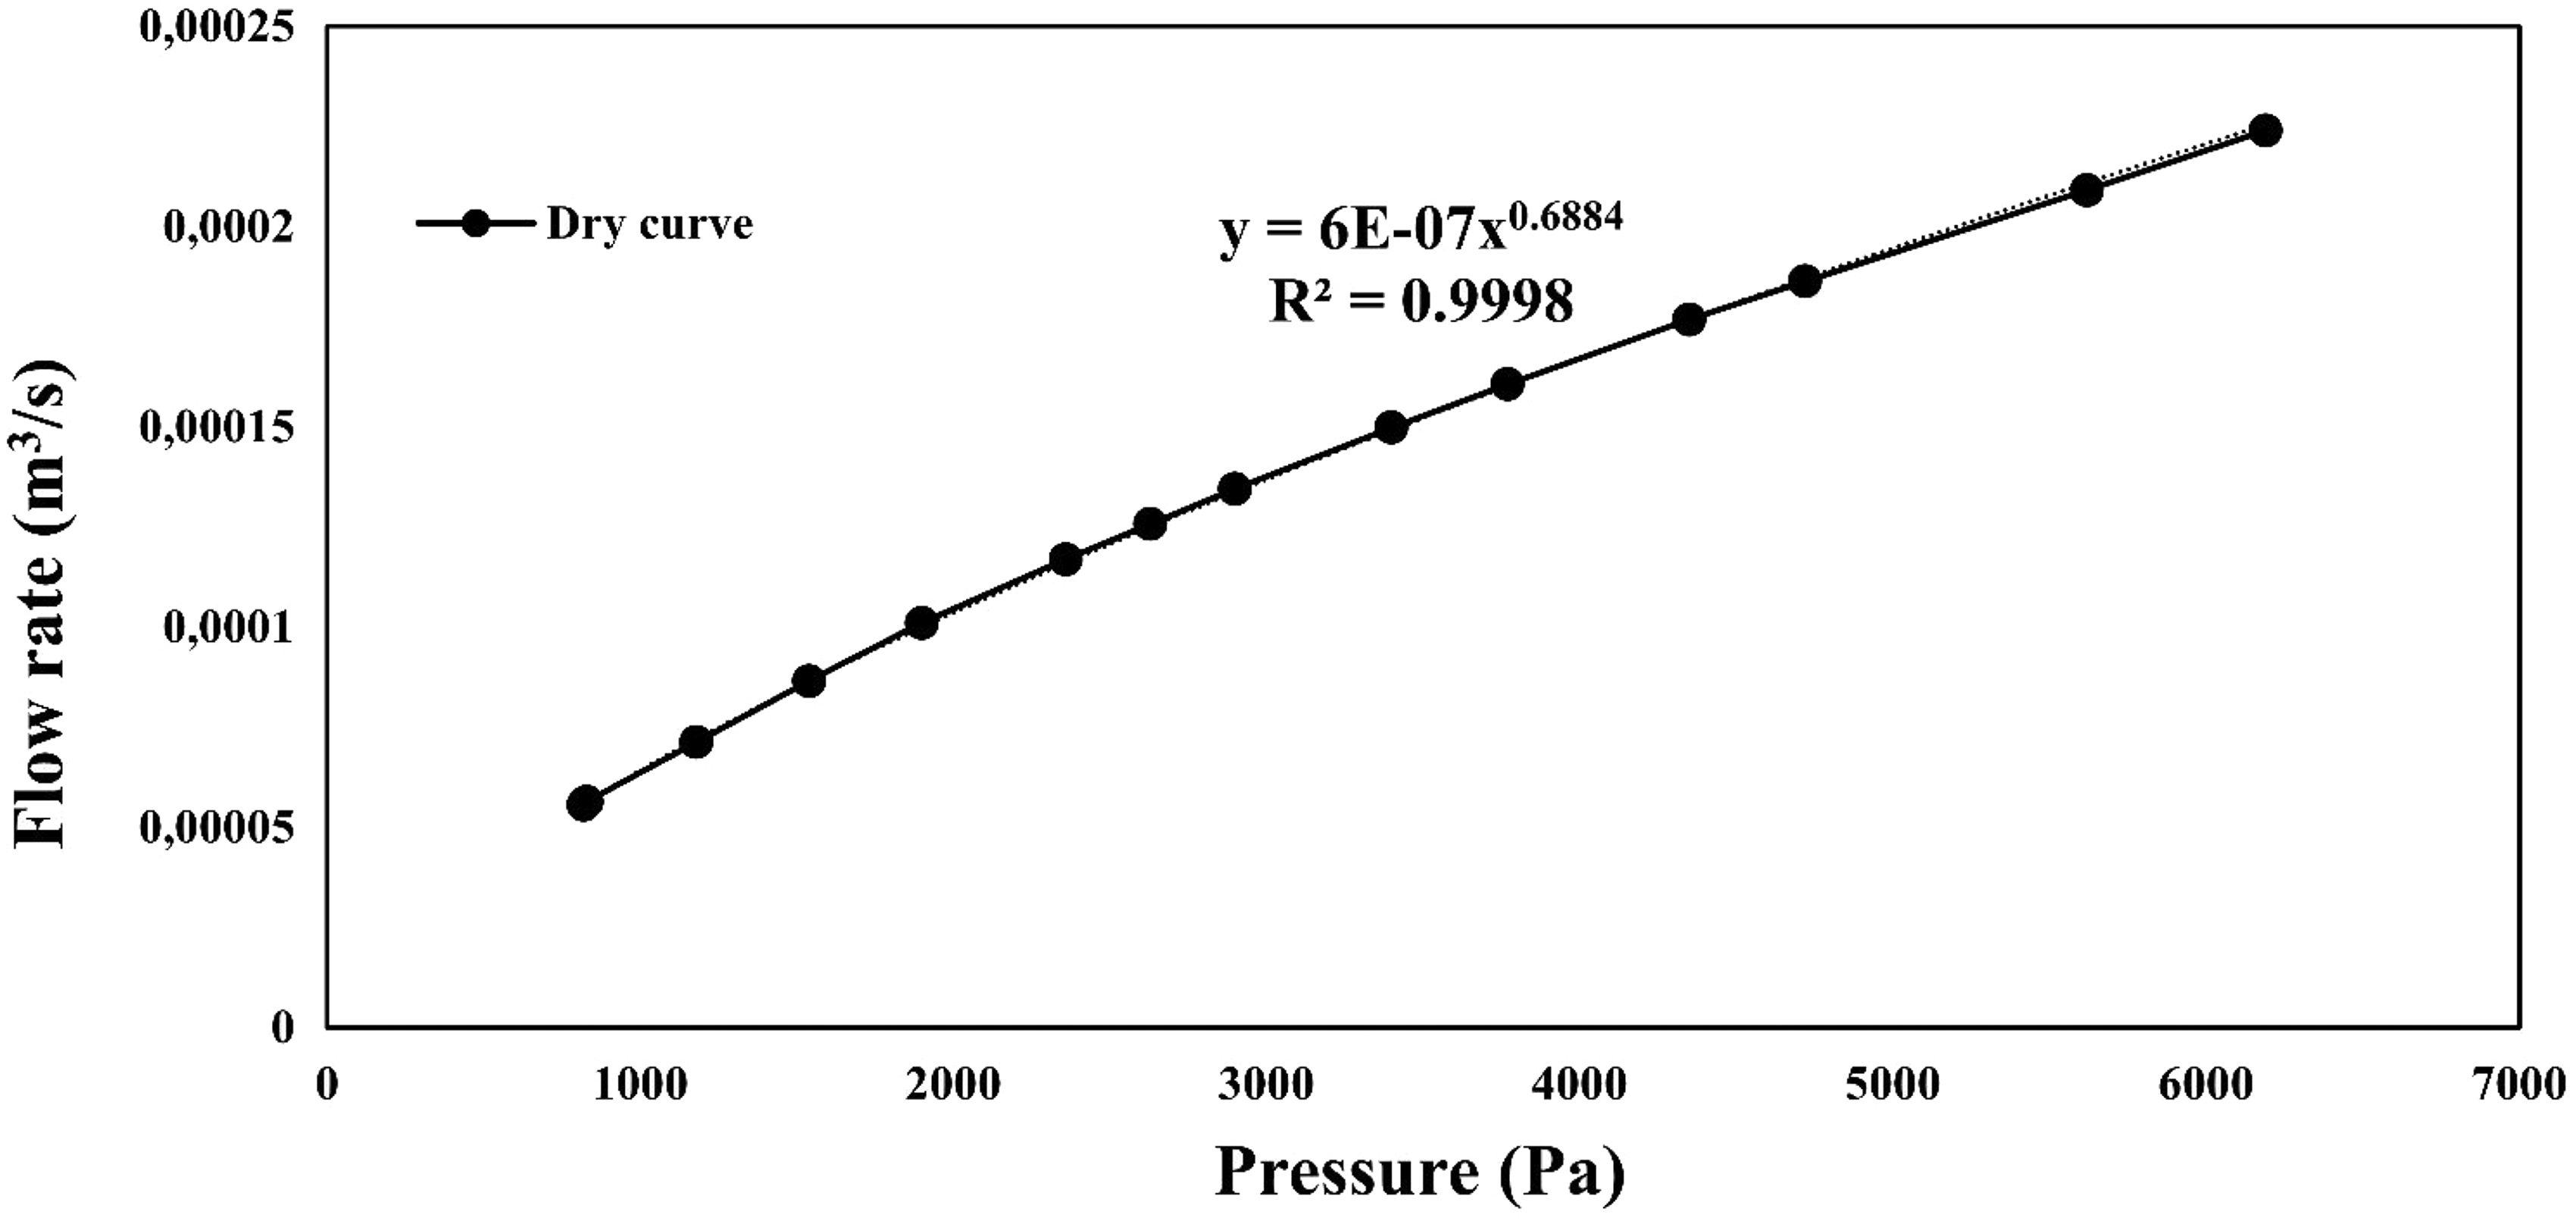
The dependency between the differential pressure and the volumetric flow rate (a dry curve) for monofilament cloth 5 with a slope n = 0.6884.
In some cases, when the coefficient exceeded 0.8, or the cloth had a fairly narrow PSD, a single value of the coefficient n was possible and sufficient. However, accurate data are obtained only when considering all the coefficients n indicating a change in flow regimes in a test. As shown in Figure 4, the coefficient n for a monofilament cloth (cloth 5) is 0.6884 when determining a single overall value. As shown in Figure 4, there is some deviation in the results from the fitted curve at high pressures, and a single value of n is not accurate enough in this case. In addition, there were several cloths for which the determination of the coefficient n with increasing pressure; that is, for each change in flow behavior, was essential. The case for the monofilament cloth (cloth 5) is shown in Figure 5. If this breakdown had not been performed, and a single overall value had been used to calculate the PSD, only 70% of the PSD would have been covered. This was especially typical for samples with a wide PSD. In those cases, the coefficient n was commonly between 0.5 and 0.75.
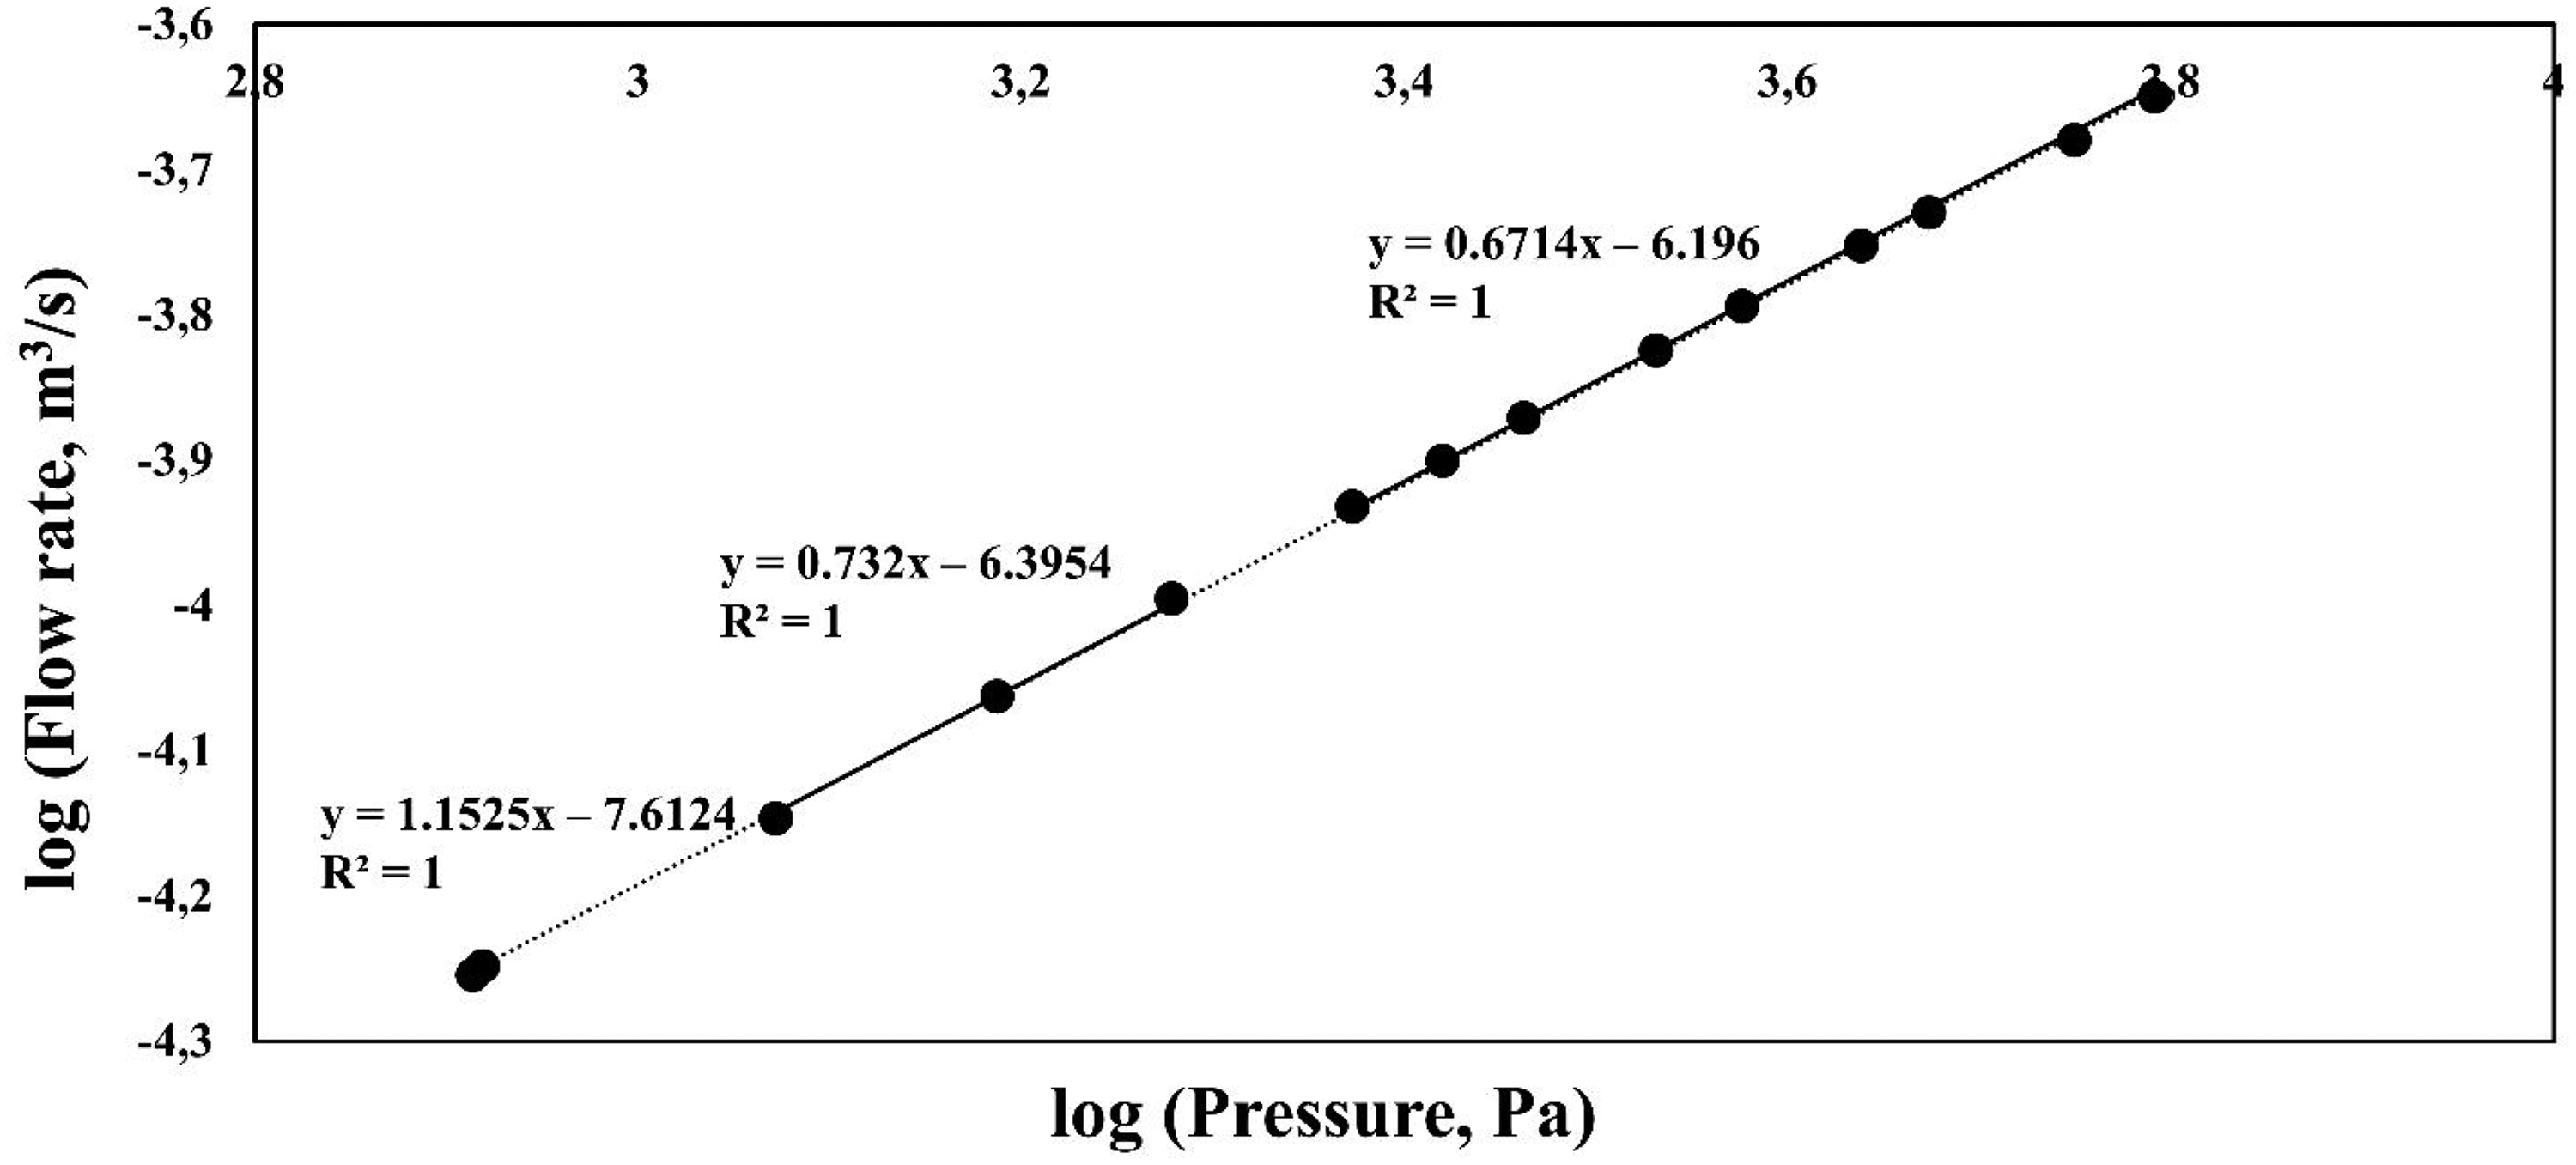
Log–log plots of flow versus the differential pressure (a dry curve) for monofilament cloth 5. The plot is divided into sections with different n values.
The dependency between the flow and the pressure in Figure 4 represents the whole body of data for cloth 5, and is essentially a combination of all the different flow conditions and different n-coefficients describing those flow conditions. Identifying changing flow conditions required the use of a logarithmic scale shown in Figure 5, in which the changes in slope represent changes in flow conditions. The first two data points formed a series with a slope n > 1 (1.1525), followed by a slope n = 0.732. The final series on the graph had a slope of n = 0.6714. While laminar flow is characterized by a slope equal to 1, the slope for highly turbulent flow is 0.5.30,31 The first slope in this graph represented laminar flow. The rest of the slopes in Figure 5 indicated that the flow conditions were neither purely laminar nor turbulent but rather a combination of the two. Sample 5 was a single-layer satin cloth with a wide PSD. Probably, the flow in some pores of this sample is laminar, while the flow in other pores is turbulent depending on the pore size, and thus, on average, an intermediate value for n is observed. Energy losses described by these slopes n, could be due to changes in flow direction caused by the tortuous pore structure, as DeNevers 28 has argued.
As seen in Figures 4 and 5, the flow that passes through a filter cloth cannot be simply described by the Hagen–Poiseuille equation. Flow conditions change but can be described by the value of n and can, thus, be taken into account in calculating the PSD of a cloth.
Both linear and nonlinear dependencies between the pressure and flow were observed for the studied samples (Figure 6). The linear dependency corresponding to a laminar flow was observed for cloths 1, 2, and 6. The coefficient n = 1 was used for cloth 6 and the first 4 points in cloths 1 and 2. However, when the pressure increased after the fifth point, the slope was lower than 1 (approximately between 0.99 and 0.85). These changes in the slope influenced the calculations of the PSD and could not be omitted. The slope n for the rest of the cloths (cloths 3, 4, and 5) corresponded to combined flow. However, these values were different for each fabric. The pure turbulent flow condition when n = 0.5 were not observed for any samples. A correlation between the type of yarns and the n values was not observed either. The samples made both from monofilament and multifilament yarns showed linear and nonlinear dependencies. The n values were individual for each cloth, and this was most likely determined by the characteristics of individual pores in the fabric rather than any macroscopic properties.
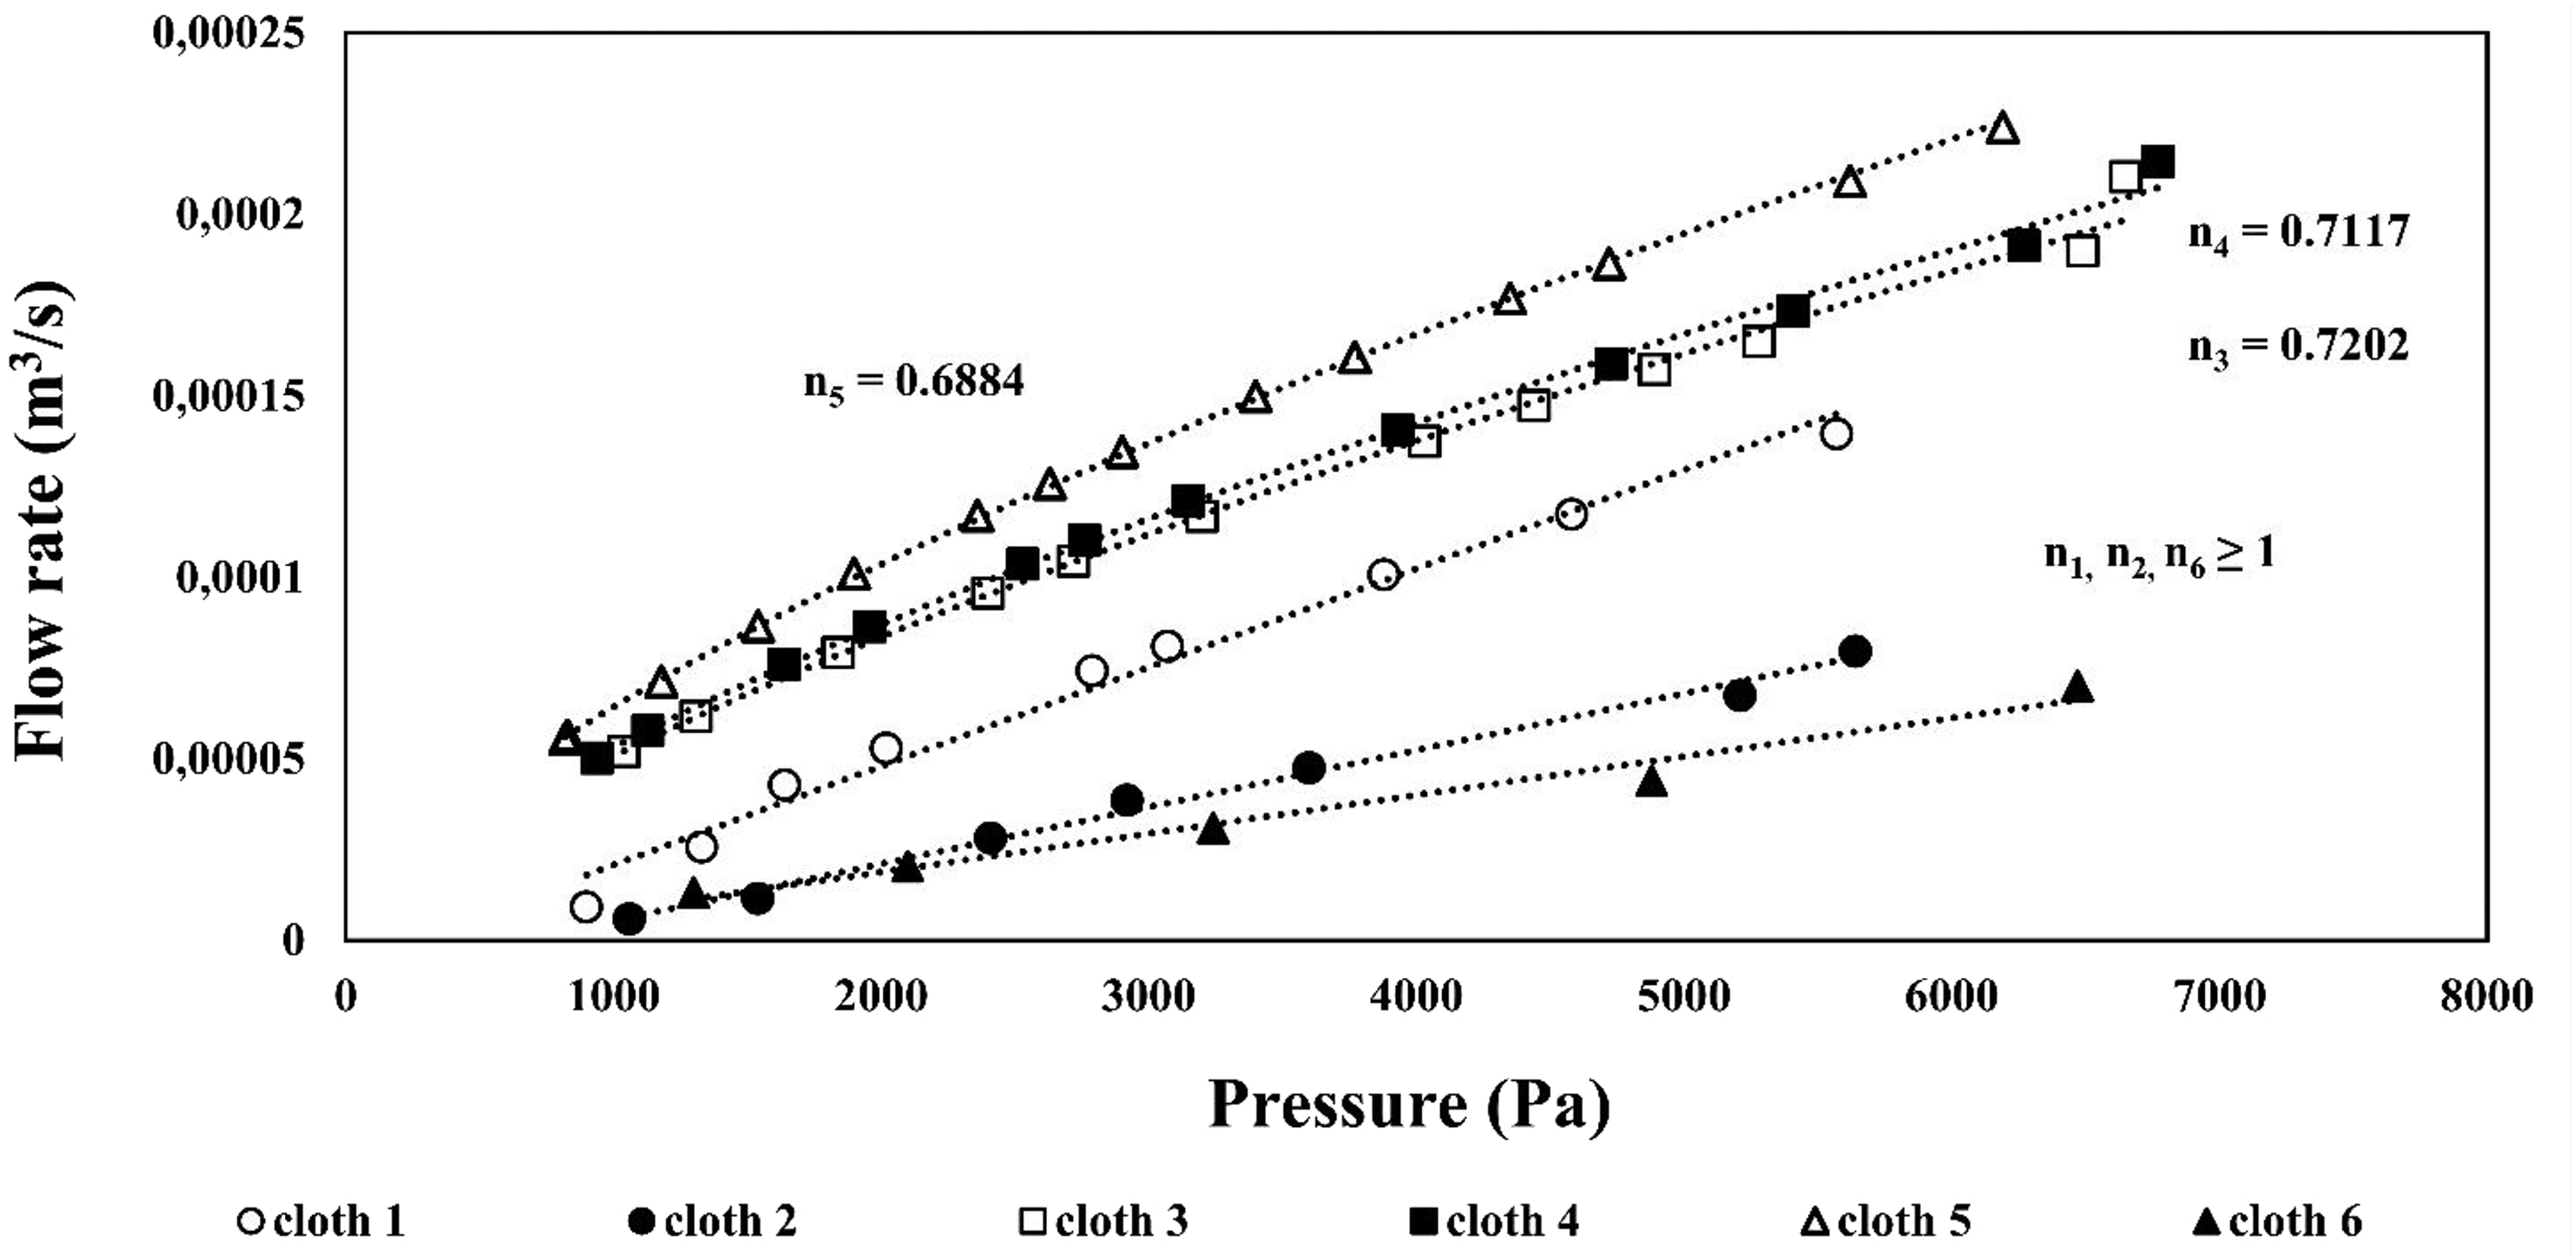
The dependency between the differential pressure and the volumetric flow rate (dry curves) for cloths 1–6.
The Reynolds number for screens or porous woven filter media can be calculated by the equation proposed by Ergun:
40
Parameters measured in capillary flow porometry: bubble point pressure and bubble point pore diameter
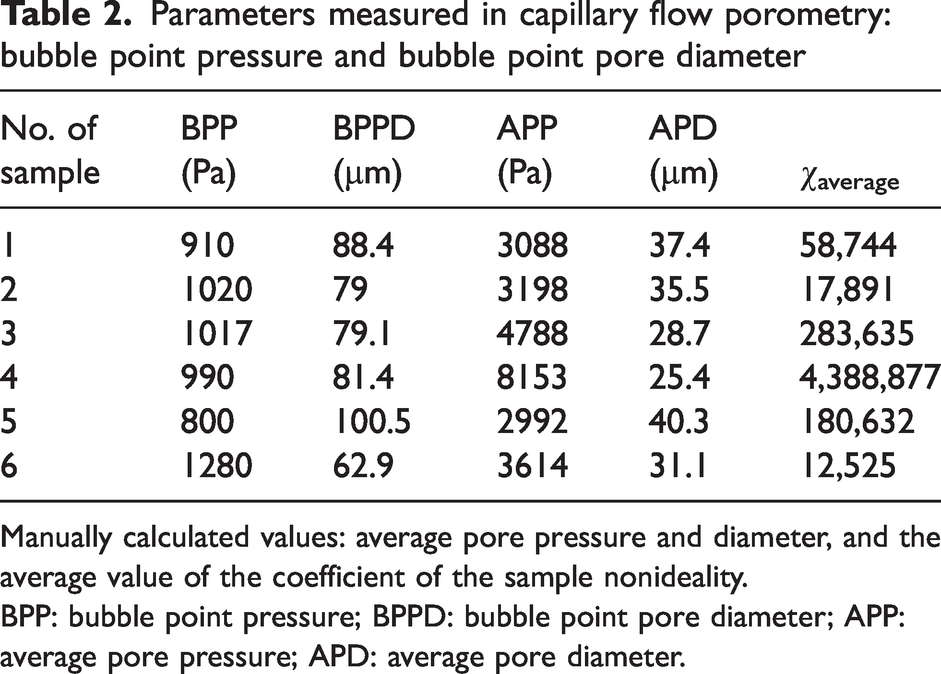
Manually calculated values: average pore pressure and diameter, and the average value of the coefficient of the sample nonideality.
BPP: bubble point pressure; BPPD: bubble point pore diameter; APP: average pore pressure; APD: average pore diameter.
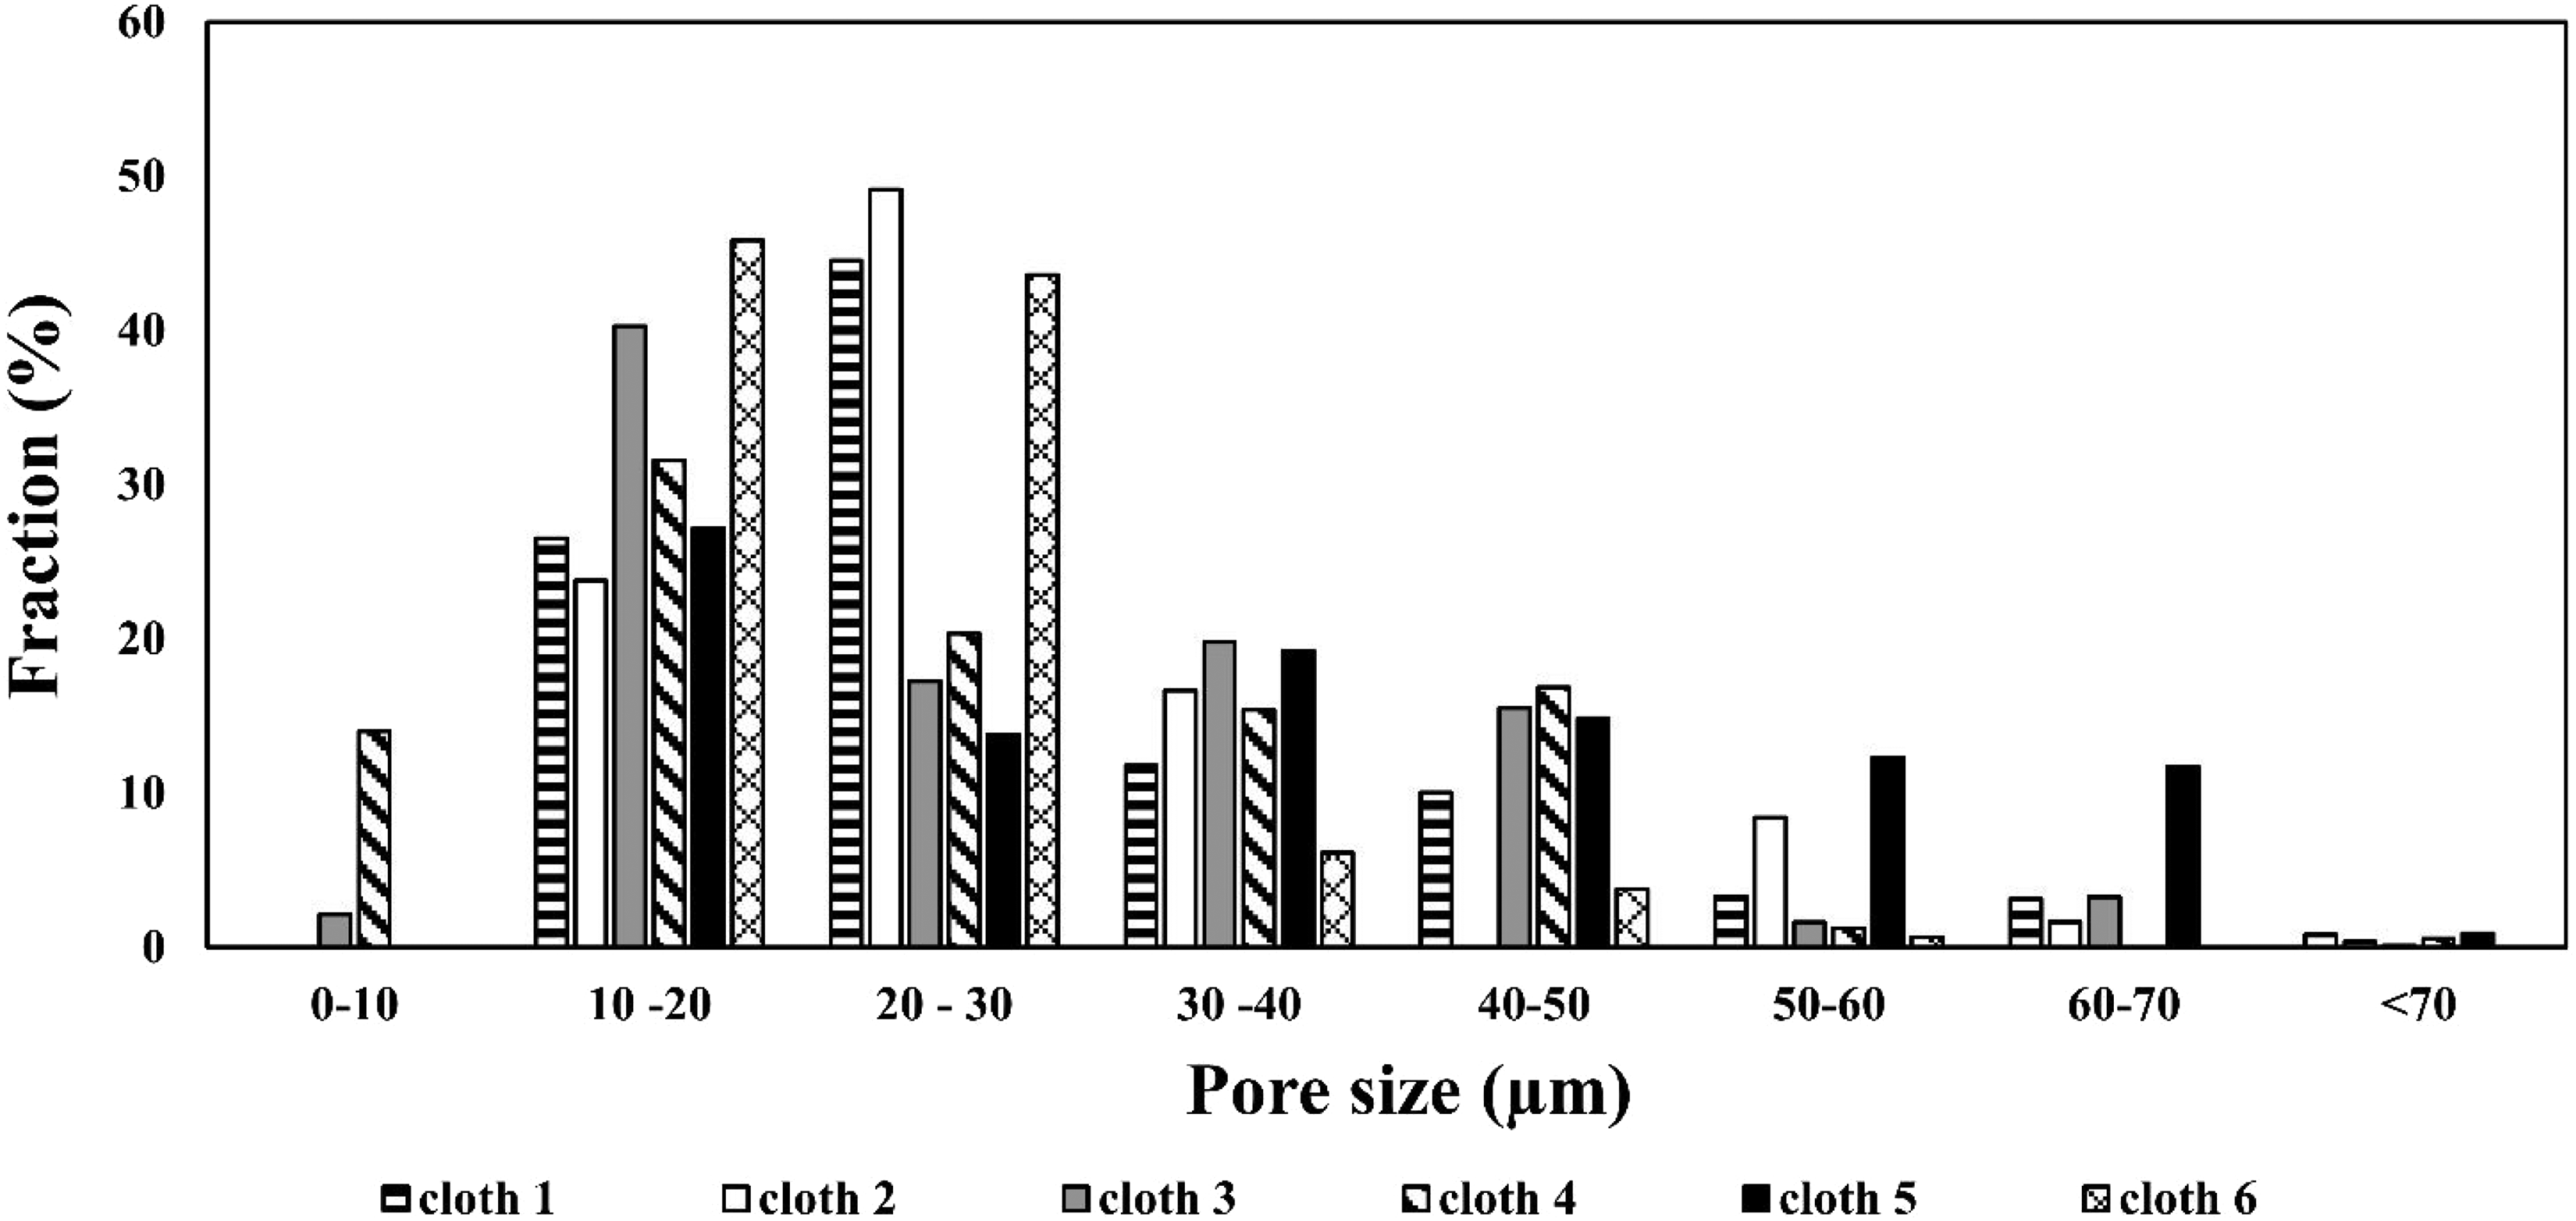
The pore size distribution diagram for all the cloths.
Flow through the pores
To investigate flow through a pore, the pore characteristics and pore diameter have to be known. The correct determination of pore diameter is vital in this case. As mentioned above, the pore diameter calculation for each pressure step could be performed using equation (3) based on the standard ASTM F316-03. 10 This equation includes a capillary constant B. The standard does not explain the physical meaning of this constant and the applicability of this constant in the calculation. However, as with all other parameters included in equation (3), the capillary constant influences the calculated result of the pore diameter and PSD. This parameter is still not well understood and requires further research and investigation. Indeed, the meaning and application of the capillary constant would merit a publication of its own.
A partial representation of the data in the form of the BPPD and the average pore diameter, calculated using the arithmetic mean of the dataset, are shown in Table 2. As can be seen, the BPPD has values between 62.9 and 100.5 µm, while the largest value of the BPPD and average pore pressure was observed for a 4/1 satin single-layered monofilament cloth 5. Figure 6 also showed that the volumetric flow rates were the highest through this open cloth. The figure also confirmed that all satin cloths (cloths 3, 4, and 5) had higher volumetric flow rates than the twill samples, even though they all had different and unique structural characteristics. All the twill samples (cloths 1, 2, and 6) were described by a linear dependency, as seen in Figure 6. Purchas and Sutherland 4 mentioned that a satin weave is more flexible than twill because of the ease of yarn-to-yarn movement. Such a structure most likely led to a more open porous space in cloths 3, 4, and 5 available for the airflow. Although the twill cloths showed similar tendencies described in Figure 6, their BPPD varied. The BPPD reflects only the largest pores and does not provide any information on the other pores in the sample. The average pore diameter cannot be used as a general characteristics of the porous structure either. Although the data in Table 2 provide valuable information about the pore sizes, they do not provide information about the PSD of the cloths. The only calculation, overview, and analysis of the PSD could provide additional details on the porous structure of a filter cloth.
The calculations of the pore diameter enabled the consequent calculation of the corresponding volumetric flow rate through the first opened bubble point pore. By considering coefficient n that described the flow behavior (equation (5)), the calculation was performed according to the Hagen–Poiseuille equation. The calculated value of the volumetric flow rate through the first bubble point pore, for example, for cloth 3, was 1.83E-08 m3/s. The actual flow that passed through all the pores with this diameter and was recorded by the capillary flow porometer was 9.08E-08 m3/s. The ratio between these two flows, designated as the coefficient of nonideality χ1, was 4.97. As seen in the SEM images in Figure 3, a dense weave of the yarns in cloth 3 formed the pores whose cross-section resembled more a slit or a triangle than a circle. The figure shows that the pore path for any samples was not a straight line and was tortuous. Moreover, there were probably a few pores with the same bubble pore diameter. The coefficient of nonideality takes into account these features for each pore range and considers also the gas compressibility and slippage effects. Each pore range, thus, had its own value of the coefficient χ.
Table 2 shows that the average value of this coefficient varied quite significantly, from 12,525 to 4,388,877. Interestingly, the low coefficients containing five numbers were observed for cloths 1, 2, and 6. As previously mentioned, the PSD for those cloths was narrow compared with the rest of the samples. Coefficient χ includes the information about the number of pores in a sample, the tortuosity, the shape factor, and other factors that differentiate an ideal cylindrical pore from the real one, together with the gas slippage and compressibility effects. The narrower the PSD, the less information about the pore traits it contains. This, in turn, influences the value of the coefficient χ. The coefficient χ is a combination of several factors that describe the nonideal structure of a pore in a cloth sample and the Klinkenberg effect. This coefficient is unique for each pore and can be easily calculated by equations (6) and (12).
Apart from the effect of the weave pattern on the measured BPPD, which was described above, other structural parameters did not significantly influence this parameter. No clear correlations were found between the measured BPPD and the weft and warp densities and thickness. It can be assumed that the square weight does not influence the measured results either. Although yarn and cloth can be heavy or light, this characteristic does not affect the structure of a pore and the flow passing through it. Cloth is a unique combination of structural characteristics, each of which contributes to the formation of the pore space. However, as the samples provided for testing did not have an organized structure (e.g. when only one parameter changes and the remaining ones keep the same), it was challenging and scientifically incorrect to conclude the effect of a particular structural characteristic on the measured BPPD.
The PSD results
The PSDs of the samples were calculated by the developed method, and the PSD diagrams are shown in Figure 7. These distributions represent how the airflow develops as more pores of different sizes become available for flow to pass through. The distribution of airflow could provide information about the structure of the cloths and their performance characteristics, such as permeability. This diagram also confirmed the observations described above. Cloths 3, 4, and 5 had a much wider PSD, covering almost the whole range of presented pores, compared with cloths 1, 2, and 6. Further, cloths 3 and 4 were characterized by the smallest pores (lower than 10 µm), which required the highest pressure for their opening. The smaller the pores, the higher the pressure required to empty those pores. The higher the gas pressure, the more vortexes are created when the flow starts to contact the pores, and this leads to the appearance of a turbulent behavior of the flow.29,30 It could also be assumed that the multifilament cloth would rather have the smallest pores than a monofilament cloth. However, as Figure 7 demonstrates, tiny (less than 10 µm) pores were observed both for monofilament cloth 4 and mono and multifilament cloth 3. Thus, this structural characteristic of the cloths, as a type of yarn, cannot be used to predict the pore diameters or flow behavior. Only detailed PSD can provide valuable and precise information about the pores and flow distribution through these pores in a cloth sample.
In addition, cloths 3, 4, and 5 also had the largest pores (more than 60 µm). The larger the pore diameter, the higher the Reynolds number will be. Higher Reynolds numbers indicate the presence of turbulent nonlinear flow in these samples. This observation explains the n-values less than 1 typical for combined nonlinear flow (from 0.6884 to 0.7202) through to cloths 3, 4, and 5. In contrast, airflow in cloths 1, 2, and 6 was mainly distributed only in the ranges from 10 to 50 µm. The flow through these cloths was mainly laminar, as mentioned above.
The developed method of calculating the PSD provides information about the volumetric flow rate for each pore range in a cloth sample. The calculation of the airflow through pores with the diameter di, by taking into account the coefficient of nonideality and the flow states, provides additional information about flow distribution through the pores in a cloth sample.
The PSD calculated by the procedure proposed in this study was compared with the PSD obtained with the standard software of the PMI-porometer. The obtained results showed a clear difference between the distributions for all the studied samples. An example of cloth 1 is illustrated in Figure 8. The PSD obtained with the capillary flow porometer showed a relatively even distribution through the whole range of available pores. However, the PSD obtained by the proposed calculation procedure, considering the nonideal structure and the changes in flow conditions, demonstrated that the majority of the flow (about 71%) occurred through pores with diameters between 10 and 30 µm. As shown in Figure 8, 26.5% of the volumetric flow rate calculated by a proposed method passed through the first range of pores (from 10 to 20 µm), while the porometer estimated that only 9.9% passed through it. The difference remains for the rest of the openings, for example, 44.5% against 14.6%, 11.8% versus 26.9%, etc. The nonideality of the pores and changes in flow conditions affect the volumetric flow rate, which is used to calculate the PSD, and therefore a difference in the distributions is observed. As seen in the SEM images in Figure 3, no ideal cylindrical pores with zero tortuosity were found in any of the cloths. Although the flow was mainly laminar through cloth 1 (the average n-value was ≥1), a careful examination of the pressure-flow dependency demonstrated the existence of different flow conditions over the pressure range used. There, the flow tended to become combined after the fifth pressure opening, which was confirmed by the break of the flow curve into sections when the value of the coefficient n was lower than 1 (between 0.89 and 0.84).
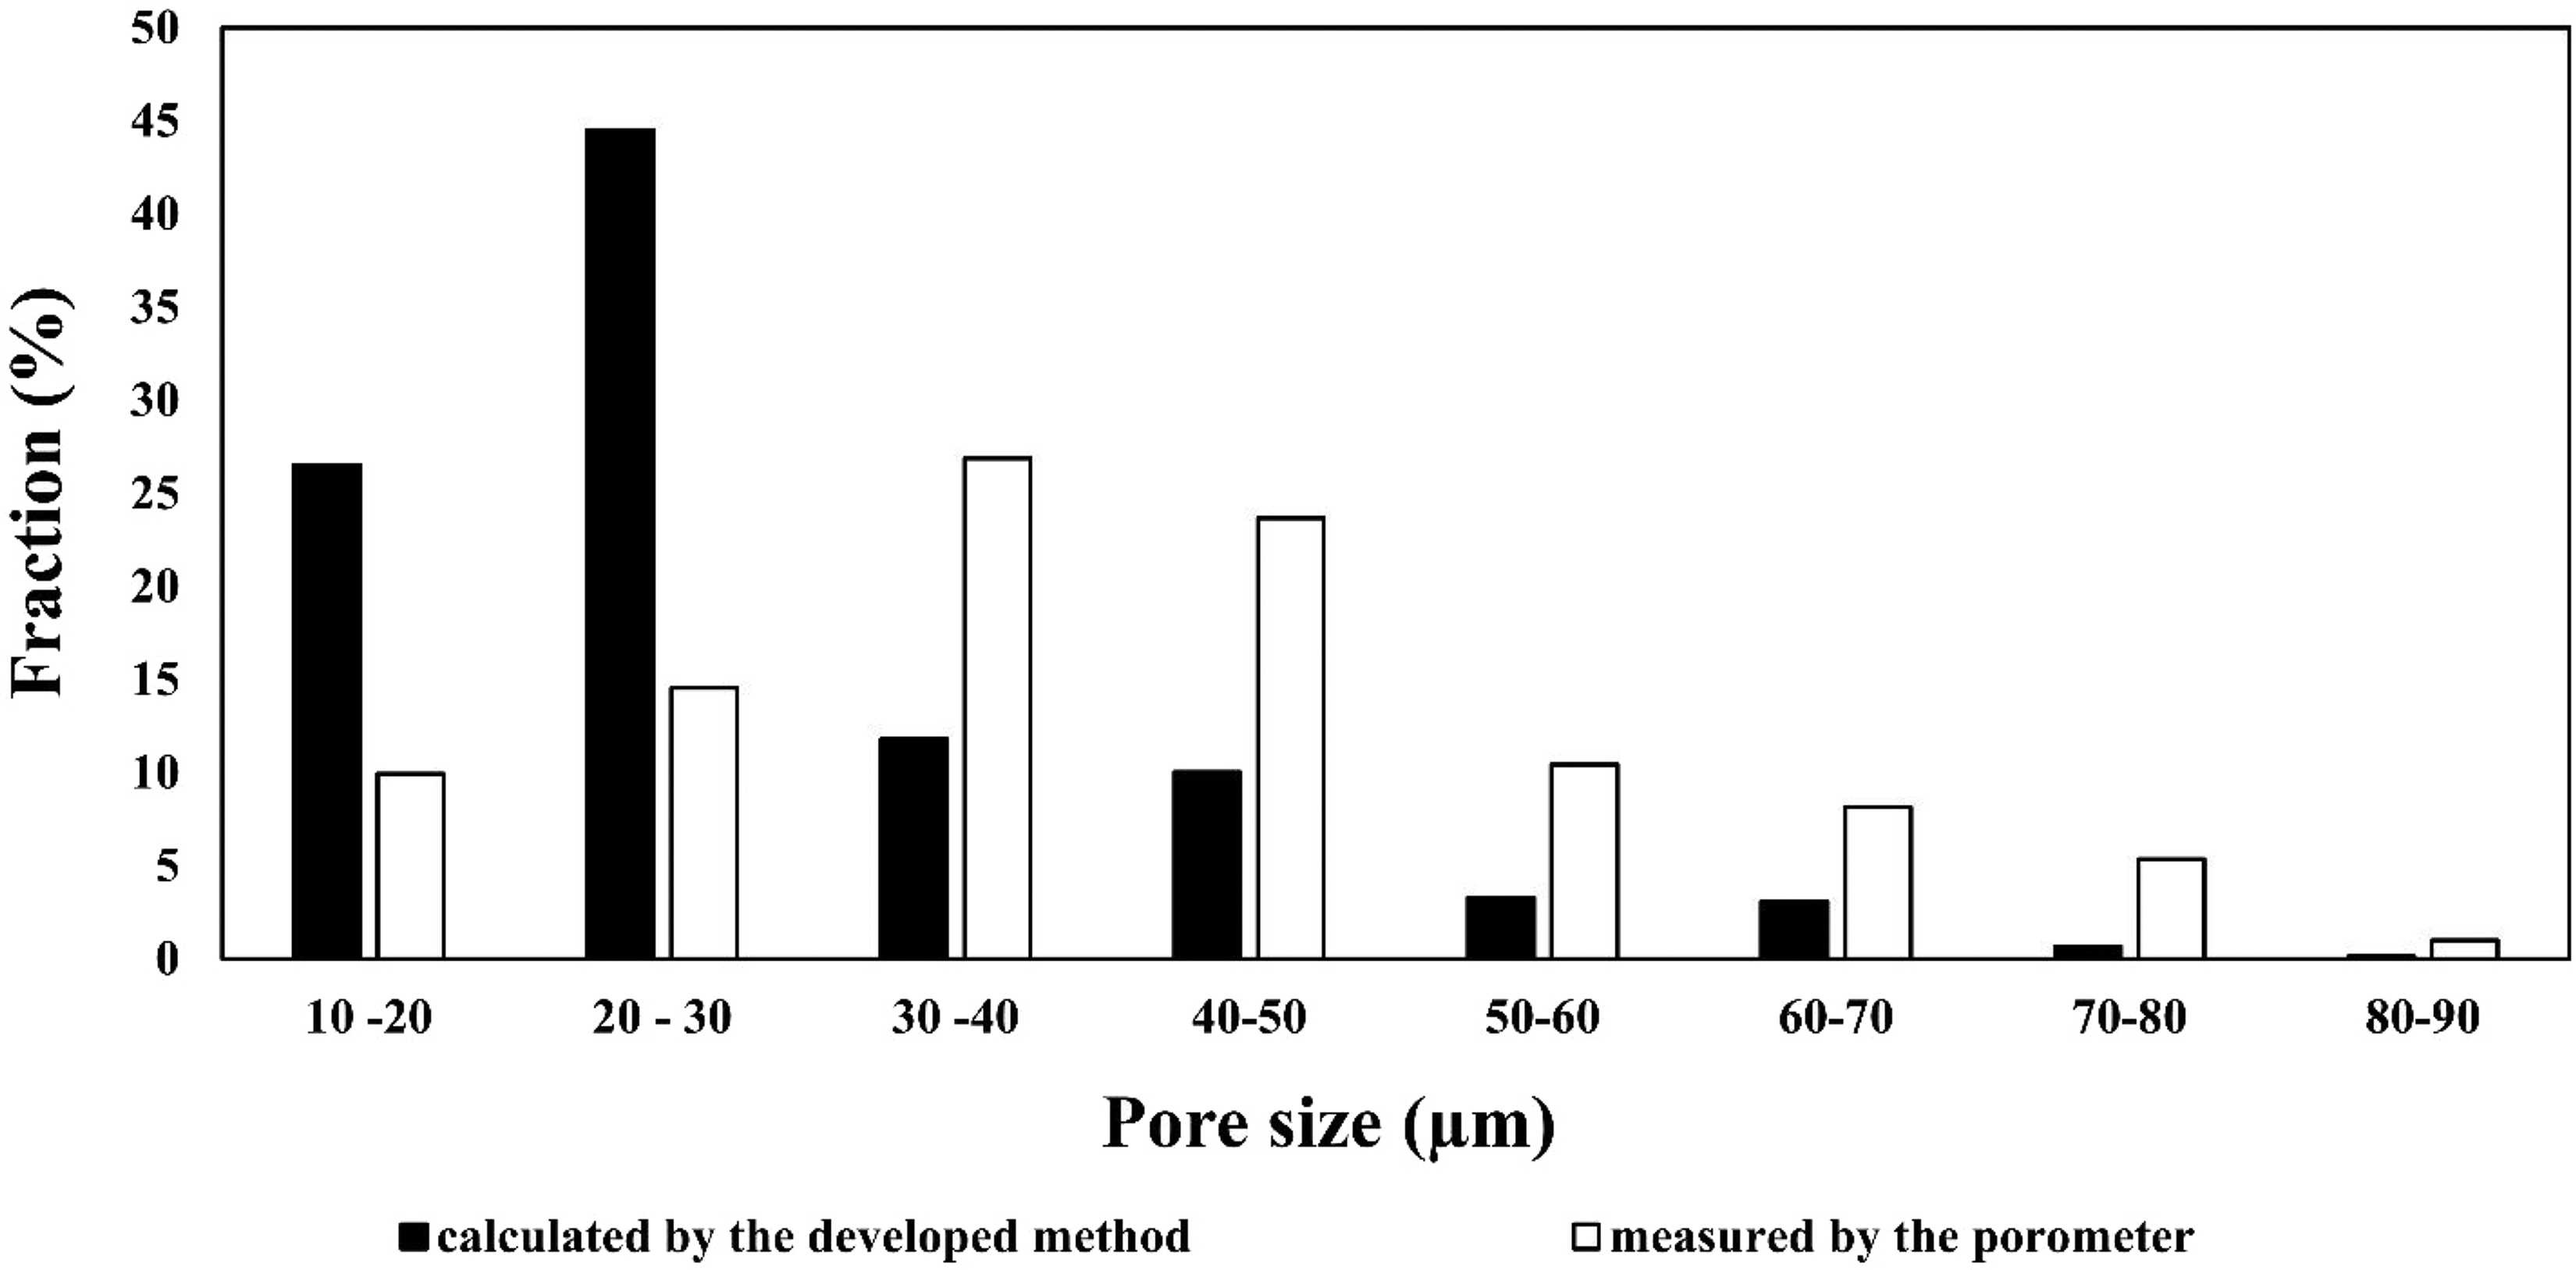
The comparison of the pore size distribution diagrams obtained from the porometer and calculated by the developed method for cloth 1.
The present study attempts to provide a more detailed physiological and mathematical method for calculating PSDs from pressure and flow data. It does not provide experimental validation for the presented method. However, this is not provided in the literature for the current calculation method used in the capillary flow porometry either. Nevertheless, our approach considers the characteristics of actual pores, while the original method assumes that pores are ideal cylinders. Experimental validation is provided for the nonideality of the pores; that is, they are not perfect cylinders and thus prove the assumptions made for the current method of calculation to be scientifically incorrect. Finally, looking at the PSDs, it is evident that our method and the current method provide very different results and the differences are significant.
Conclusions
PSD is one of the most essential and fundamental parameters for characterizing a porous structure, and capillary flow porometry is one of the most popular and common techniques for measuring this structure. Most equipment applying this technique consider a pore an ideal cylinder with a circular cross-section. However, only a few materials might have such well-defined pores. Most materials, especially filter cloths used for filtration, have a complex structure and tortuous pores with different cross-sections. Thus, the present study aimed to develop a new procedure for calculating the PSD of woven filter cloths so that the procedure would also consider the inherent imperfection of the porous structure.
A new procedure developed for calculating the PSD considers the unideal structure of the pore(s) in the filter cloth. For this purpose, a coefficient of nonideality was developed, which was derived from comparing the actual flow passing through a pore and the ideal flow calculated by the Hagen–Poiseuille equation. The coefficient of nonideality combines different factors, such as tortuosity, cross-section, the number of pores, possible gas slippage effects, etc. Applying this coefficient to the PSD calculations changes the final PSD in comparison with not using it.
Data obtained by the capillary flow porometer provides compelling evidence that changes in flow regimes during the measurement and building of a dry curve should be considered in calculating the PSD. The flow changes from laminar to turbulent under increasing gas pressure as the PSD is measured. These changes can be described by a coefficient n, which is characteristic of each cloth. The use of this coefficient significantly influences the PSD results. The presented approach was based on a theory describing the turbulent flows through textile materials developed by Hassenboehler. 32 Therefore, the method proposed in this paper is applicable only to calculating the PSD of textile materials made of polypropylene. The present study does not claim the suitability of the proposed method for other materials.
The calculation of the pore diameter is one of the critical points in capillary flow porometry as it directly influences the calculation of the PSD and the accuracy of the technique itself. The standard ASTM F316 includes a capillary constant in calculating the pore diameter. However, the physical meaning and any additional information related to this constant were not represented in the standard. This constant might have a significant effect on the calculated pore diameter and the PSD. Therefore, additional research and understanding of this capillary constant are of interest, and a further look into the capillary constant to refine the calculations is required.
The present study aimed to demonstrate the need to modify the method for calculating PSDs in capillary flow porometry. Chiefly, the calculating method developed in this paper can be helpful for porometer manufacturers. An improved approach can be valid for engineers working with porometers. Moreover, the experimental results and calculating approach proposed in this paper are relevant for scientists who use capillary porometry for sample characterization in their research.
Footnotes
Data availability
All data generated or analyzed during this study are included in this published article. All tables and figures are the authors’ original work, and no permissions are required.
Declaration of conflicting interests
The author(s) declared no potential conflicts of interest with respect to the research, authorship, and/or publication of this article.
Funding
The author(s) disclosed the receipt of the following financial support for the research, authorship, and/or publication of this article: Teknologiateollisuuden 100-vuotissäätiö Metallinjalostajien rahasto is kindly acknowledged for their financial support.