
Abstract
Distinguishing the differences of pore characters between different mixed lithofacies shales is helpful for improving shale gas development efficiencies. In this study, the targeted Longmaxi shale (L1) of the Southern Sichuan Basin was selected as the research object. Two kinds of mixed lithofacies shale were identified by analyzing total organic carbon and X-ray diffraction results. The forming depositional environment of mixed lithofacies shale was researched by elements analyses. Pores in different mixed lithofacies shale were observed using field emission scanning electronic microscope. Low-field nuclear magnetic resonance and low-temperature nitrogen adsorption were conducted to analyze pore characters of different mixed lithofacies shale. The results showed that L1 were mainly composed of organic rich clay–siliceous mixed shales (OR-M-1) and organic extreme rich calcareous–siliceous mixed shales (OER-M-3). OR-M-1 and OER-M-3 were formed in high paleo-producing dysoxic–oxic seawater and anoxic waterbody, respectively. Micro-pore and meso-pore volumes of OER-M-3 were greater than those of OR-M-1 while macro-pore volume of OER-M-3 was lower than that of OR-M-1. Meso-pore surficial and structural complexities of OER-M-3 were greater than those of OR-M-1. OER-M-3 were greater in oil-wetting micro-pore structural complexities while lower in water-wetting micro-pore structural complexities, compared with OR-M-1. The inherent relationships between lithofacies type and sedimentary environment, total organic carbon, as well as pore characters, respectively, were quite close.
Keywords
Introduction
Shale gas, with recoverable resources in China estimated to be 25.1 × 10¹² m3 (Hu et al., 2017), is regarded as a key replenishment for natural gas supply. Identification of shale lithofacies is important in predicting total organic carbon (TOC) content, designing completion strategies, and determining optimal horizontal well trajectories (Wang and Carr, 2012; Wang et al., 2016). Shale is also a heterogeneous porous medium containing nanometer scaled pores (Yang et al., 2019), which provide spaces for gas adsorption and seepage. Considering that different lithofacies have differences in depositional environments and pore structure complexities (Li et al., 2019), joint research on shale lithofacies, depositional environment, and shale pores is significant for a reasonable determination of targeted shale reservoirs.
Previous scholars classified shale lithofacies mainly based on geochemical, petrological, and sedimentological parameters (Lin et al., 2019b; Loucks and Ruppel, 2007; Yang et al., 2018), and they summarized that sedimentary environment and thermal evolution are the essence that control shale lithofacies (Wang et al., 2017). Shale lithofacies classifications considering mineral composition and organic matter (OM) richness are proved to be significant and meaningful for identifying the reservoir with high content of gas (Tang et al., 2016) and brittle minerals (Wang et al., 2017). Overall, as burial depth increases, clay content decreases, whereas TOC and quartz content increase noticeably (Sun et al., 2016; Yang et al., 2019). Therefore, shale lithofacies may vary successively in a vertical profile, and a comprehensive understanding on the variation can provide instructions on gas producing ability of different intervals.
Shale pores can be categorized into micro-pores with pore diameter <2 nm, meso-pores with pore diameter between 2 and 50 nm, and macro-pores with pore diameter >50 nm (Rouquerolb et al., 1994). Considering the material composition, shale pores can be classified as OM pores and inorganic pores (Yang et al., 2016), and the latter are composed of interparticle pores (InterP) and intraparticle pores (IntraP) (Loucks et al., 2012; Shao et al., 2017; Shi et al., 2015). Factors such as maturity, mechanical compaction, and organic acids, play key roles in the development of shale pores (Hu et al., 2017; Mastalerz et al., 2013). Minerals and OM controlled the pore size distribution (PSD) in shale (Liu et al., 2017); for instance, micro-pores are generally associated with grains of OM, while pores related to quartz are macro-pores and those related to clay aggregates are usually meso- or micro-pores (Ji et al., 2017; Shi et al., 2015). As TOC content increases, micro-pore, meso-pore, and total pore volumes increase (Clarkson et al., 2013; Milliken et al., 2013; Ross and Bustin, 2009), considering that volatiles were generated and expelled from the kerogens and the occurring of secondary cracking (Curtis et al., 2012; Mastalerz et al., 2013; Milliken et al., 2013; Modica and Lapierre, 2012). Factors affecting the meso- and macro-pore volumes are complicated because both organic and inorganic matters have influences on meso- and macro-pores (Sun et al., 2016). Mineral-associated porosities decrease as thermal maturity increases, due to compaction, cementation, and bitumen infill (Hu et al., 2017). OM-hosted porosity increases initially and then decreases during the late post-mature stage (Klaver et al., 2016). A brief summary of previous researches on shale pores can be concluded that sedimentary, diagenesis, and evolution of shale have significant influences on shale pore type, distribution, shape, and structural complexity.
Though previous studies have provided deep insight into shale lithofacies and shale pores, there is an urgent need of the study on pores of mixed lithofacies shales (MLS), which were chosen for studying because of their high potential for high yields in the Southern Sichuan Basin. Firstly, the study of lithofacies and pores of shale in a successive vertical profile can provide deep understanding on targeted reservoir characters and helps for optimizing fracturing intervals’ selection. Secondly, it can provide insights into the inherent relationships between lithofacies type and sedimentary environment, TOC, as well as pore characters, respectively. To address these issues, (1) a new lithofacies classification method considering mineral composition and TOC was proposed, and two different kinds of MLS were identified; (2) the forming mechanisms of different MLS were researched by means of conducting major and trace elements analyses; (3) morphologies of OM pores, InterP, and IntraP in different MLS were observed by means of field emission scanning electron microscopy (FE-SEM); (4) low-field nuclear magnetic resonance (LF-NMR) and low-temperature nitrogen adsorption (LTN2A) tests were conducted using different MLS samples; and (5) the inherent relations among lithofacies type, sedimentary environment, TOC, and pore characters of different MLS were discussed.
Geological background
Y105 well belongs to the Sinopec DM Block located in the southern border of Sichuan Basin, China. DM Block is surrounded by Dalou Mountain in succession with Weixin Depression in the south and Zhaotong Depression in the west (Figure 1). The Sichuan Basin is a tectonically stable and oil–gas superimposed basin located in the Yangtze Craton, covering an area of more than 18 × 104 km2 (Chen et al., 2017). Structurally, the research area was influenced by the joint effects of the Southern Sichuan Basin and the Weixin Depression, leading to the strata deformation intensity of the south and west that is stronger than that of the north and west. The Longmaxi Formation (Fm), which was regarded as the main target strata for shale gas development and was divided into four sections, i.e. L1, L2, L3, and L4 (Figure 2), was mainly formed in the sedimentary facies of shallow shelf and deep shelf. L1 and L2 mainly consist of black siliceous shales, black carbonaceous shales, and grey–black calcareous mudstones. L3 and L4 mainly consist of grey–green mudstones, yellow–green mudstones, and argillaceous siltstones. Currently, L1 shale, which is the research object of this work, is the targeted fracturing interval with the highest gas contents and TOC values.
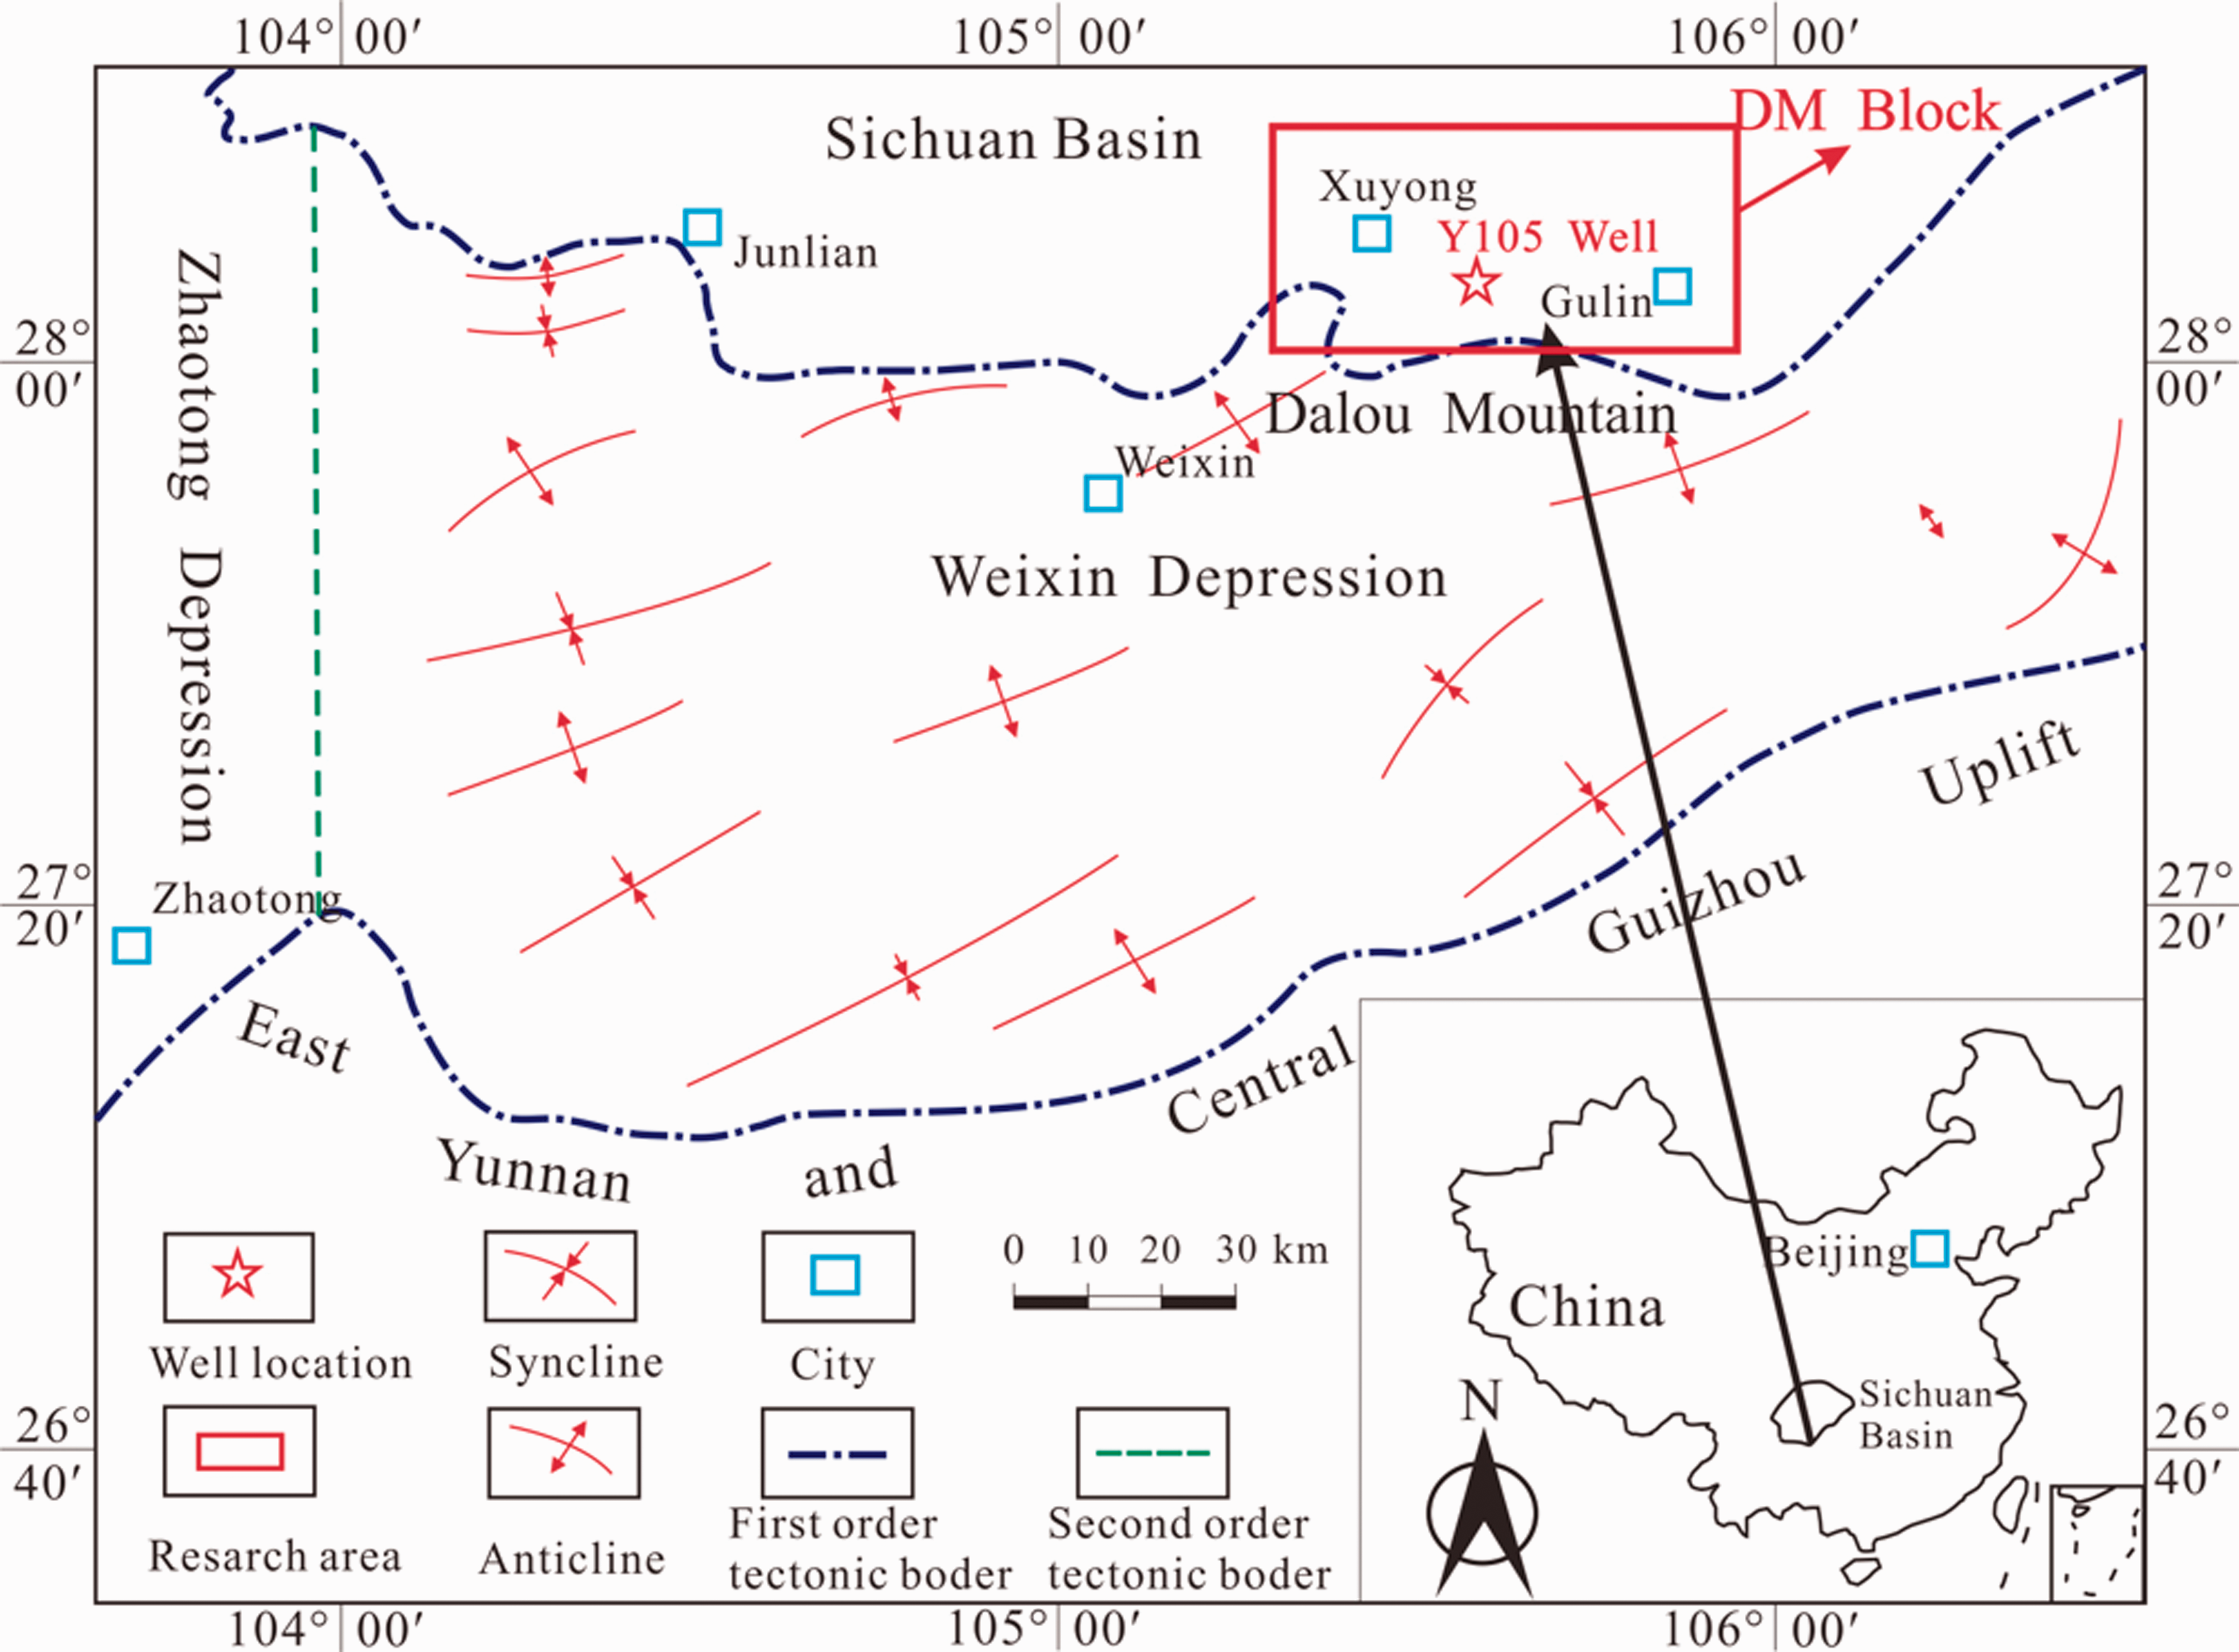
Tectonic structural map of the research area.
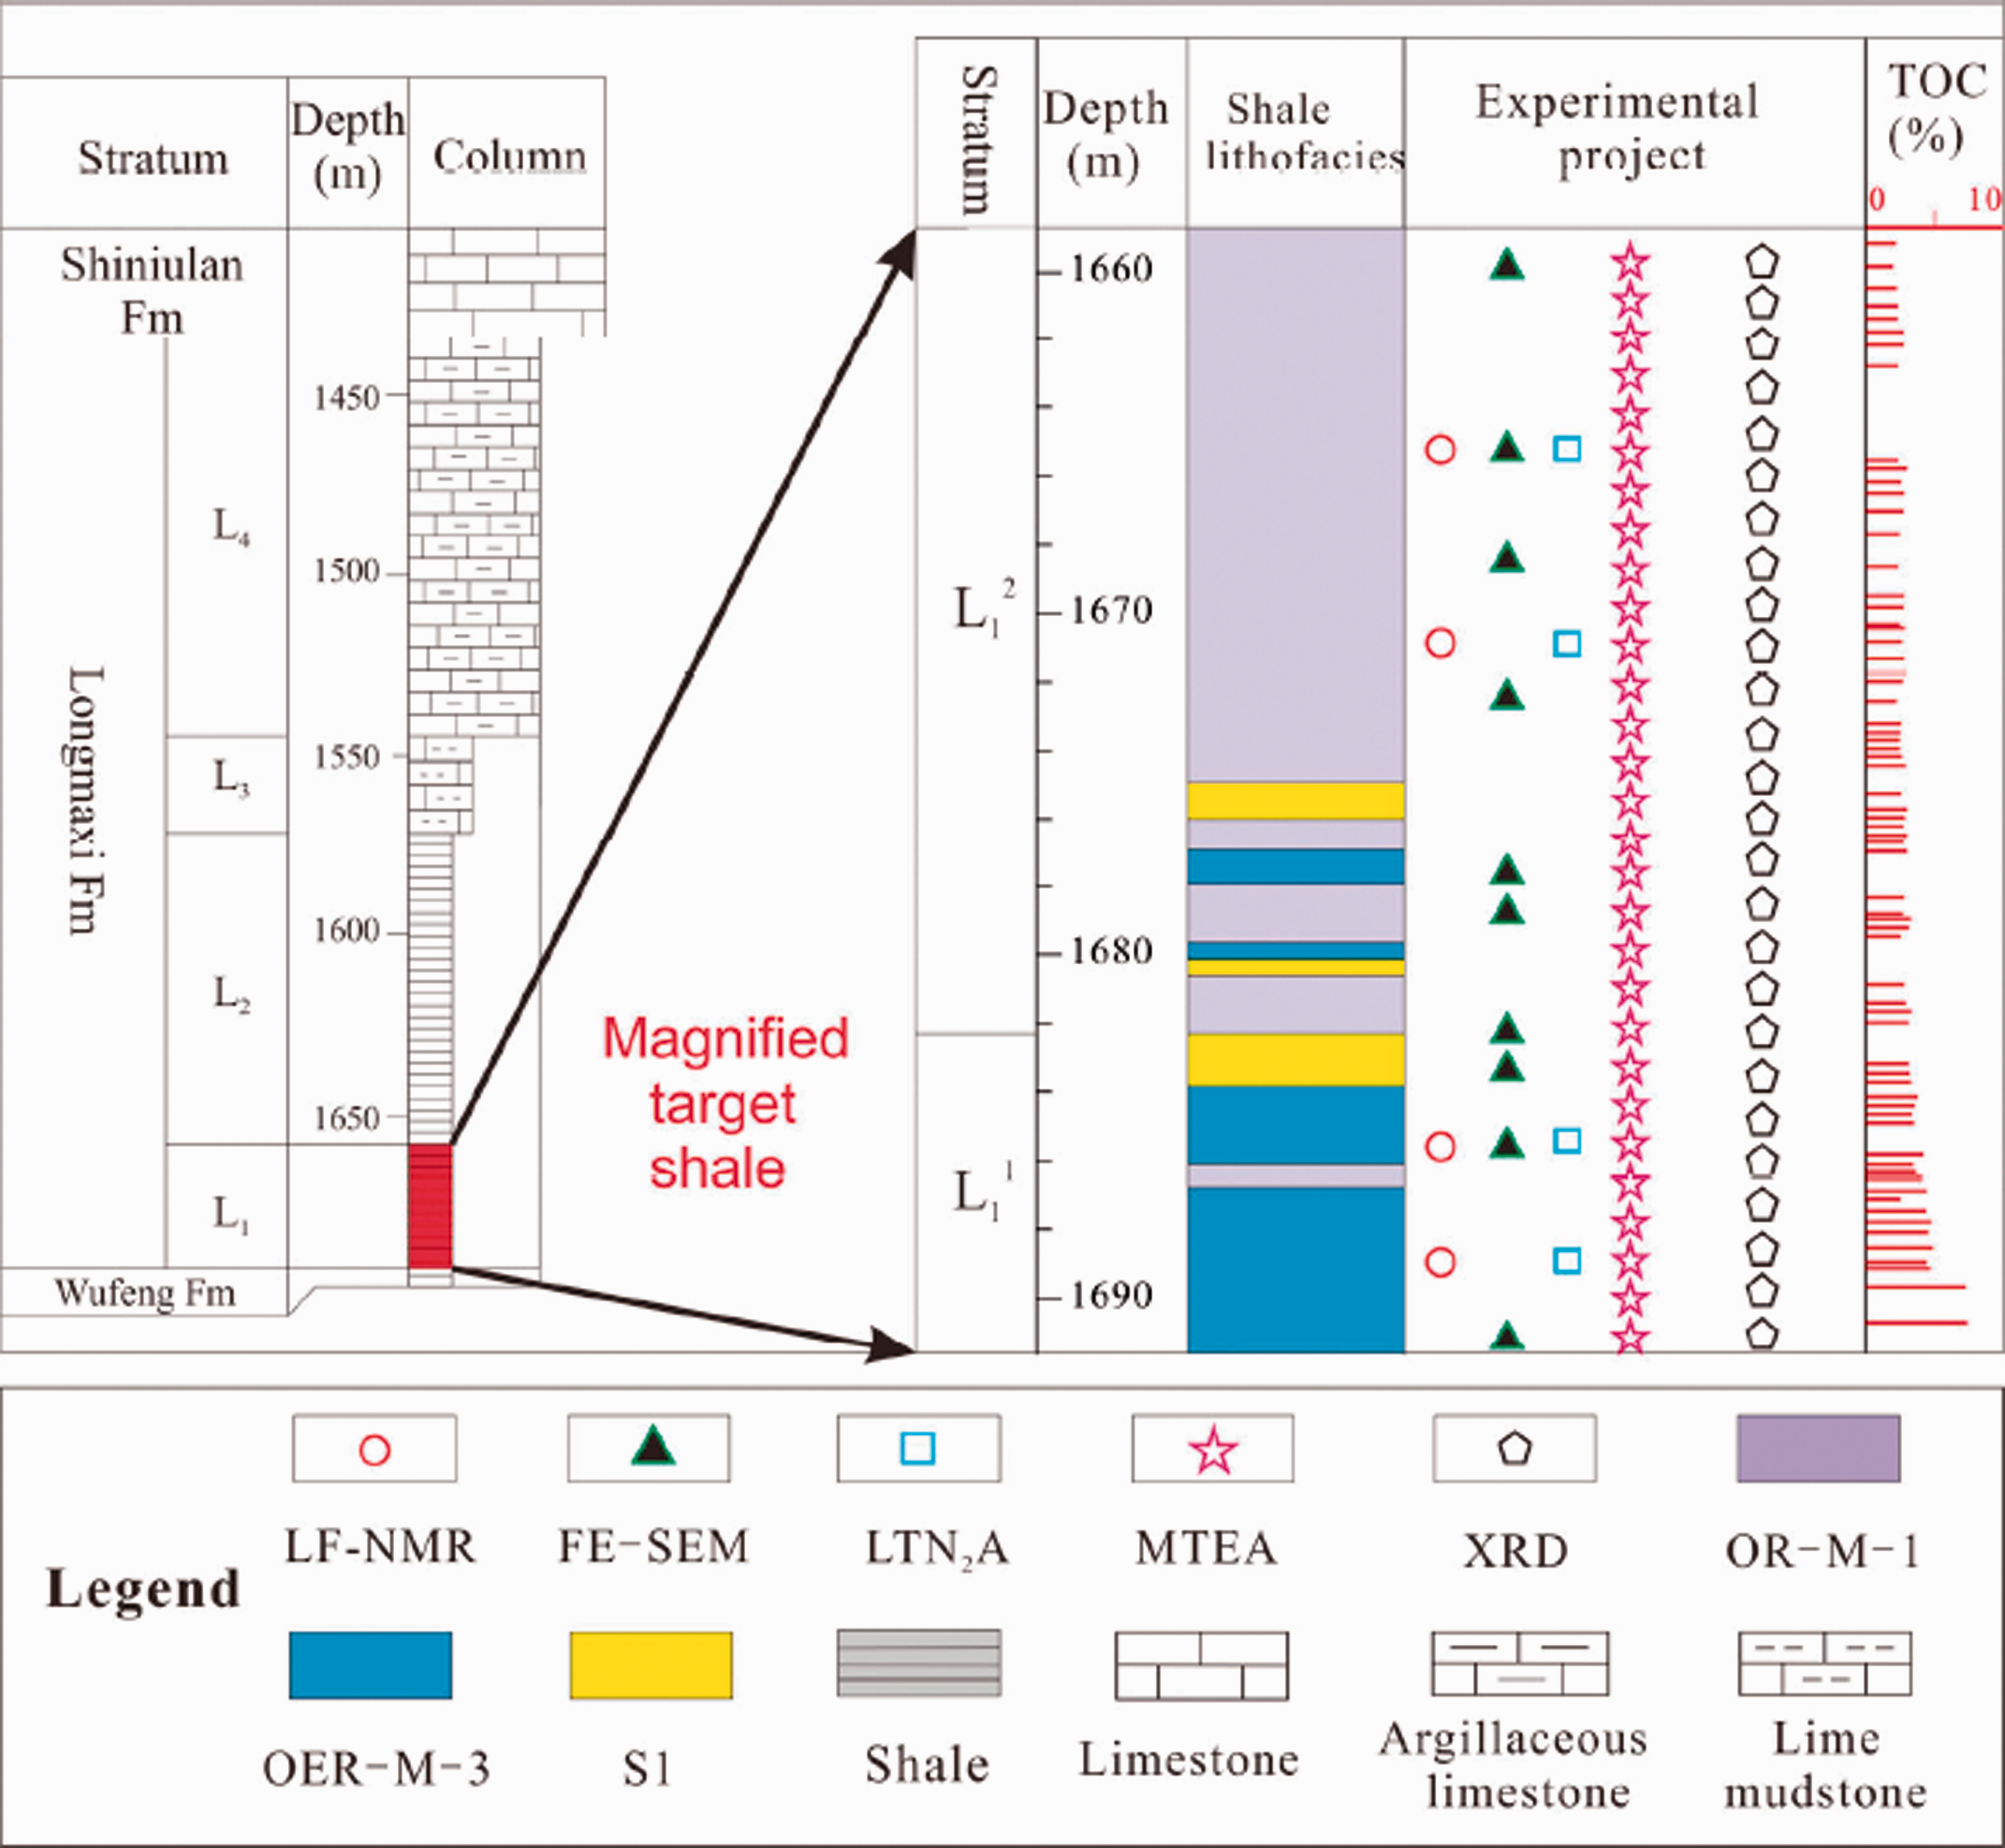
Column map of Longmaxi Fm and the adjacent stratum.
Methods
Samples treatment
Cylindrical shale samples were sampled during the drilling process of Y105 well. Samples collected from different intervals distributing successively in L1 were treated into five types, namely S-I, S-II, S-III, S-IV, and S-V. Samples S-I were powder shale samples (200 mesh) for X-ray diffraction (XRD) tests and TOC measurements. Samples S-II, S-III, S-IV, and S-V were obtained from the same drilled shale cores as samples S-I. Samples S-II were crushed into 200 mesh as well and for the use of major and trace elements analyses. Samples S-III were 10 mm × 10 mm × 3 mm in dimension and used for FE-SEM observations. Samples S-IV were powder shale (60–80 mesh) for LTN2A tests. Samples S-V were a number of cylindrical shales with 25 mm diameter and 40 mm length, approximately, for LF-NMR tests. Details on the sampling location and corresponding usage of samples for different experiments are displayed in Figure 2.
TOC and vitrinite reflectance measurements
TOC values were measured with CLECO CS-230 carbon/sulfur analyzer at 60°C–80°C, using 10% dry HCl completely dissolved sample powders (Sample S-I), according to Chinese National Standard (GB/T 19145–2003). Thermal maturity data were determined by vitrinite reflectance (Ro) and pyrobitumen reflectance (Rb). Rb was determined by MPV-III microscope photometer using the polished block shale samples, and Ro was calculated by a formulation proposed by Jacob (1989), i.e. Ro = 0.618 Rb +0.4.
MLS classification
Mineral composition tests using S-I samples were conducted by XRD method applying a device named RINT-TTR3. Mineral species was determined by standard card provided by the “Joint Committee on Power Diffraction Standards” while the mineral contents were quantified based on the diffraction intensity of different minerals (Zhang et al., 2019b). In this study, Quartz + feldspar + pyrite, carbonate minerals (calcite + dolomite), and clay minerals were regarded as three key factors that determine the lithofacies. Details on the classification methods can be referred from Han et al. (2016). Firstly, four first-class lithofacies, i.e. siliceous shale, calcareous shale, argillaceous shale, and mixed shale, were defined. Secondly, nine second-class lithofacies were classified by means of considering the critical mineral content values of 25%, 50%, and 75%, as displayed in the ternary map of Figure 3.
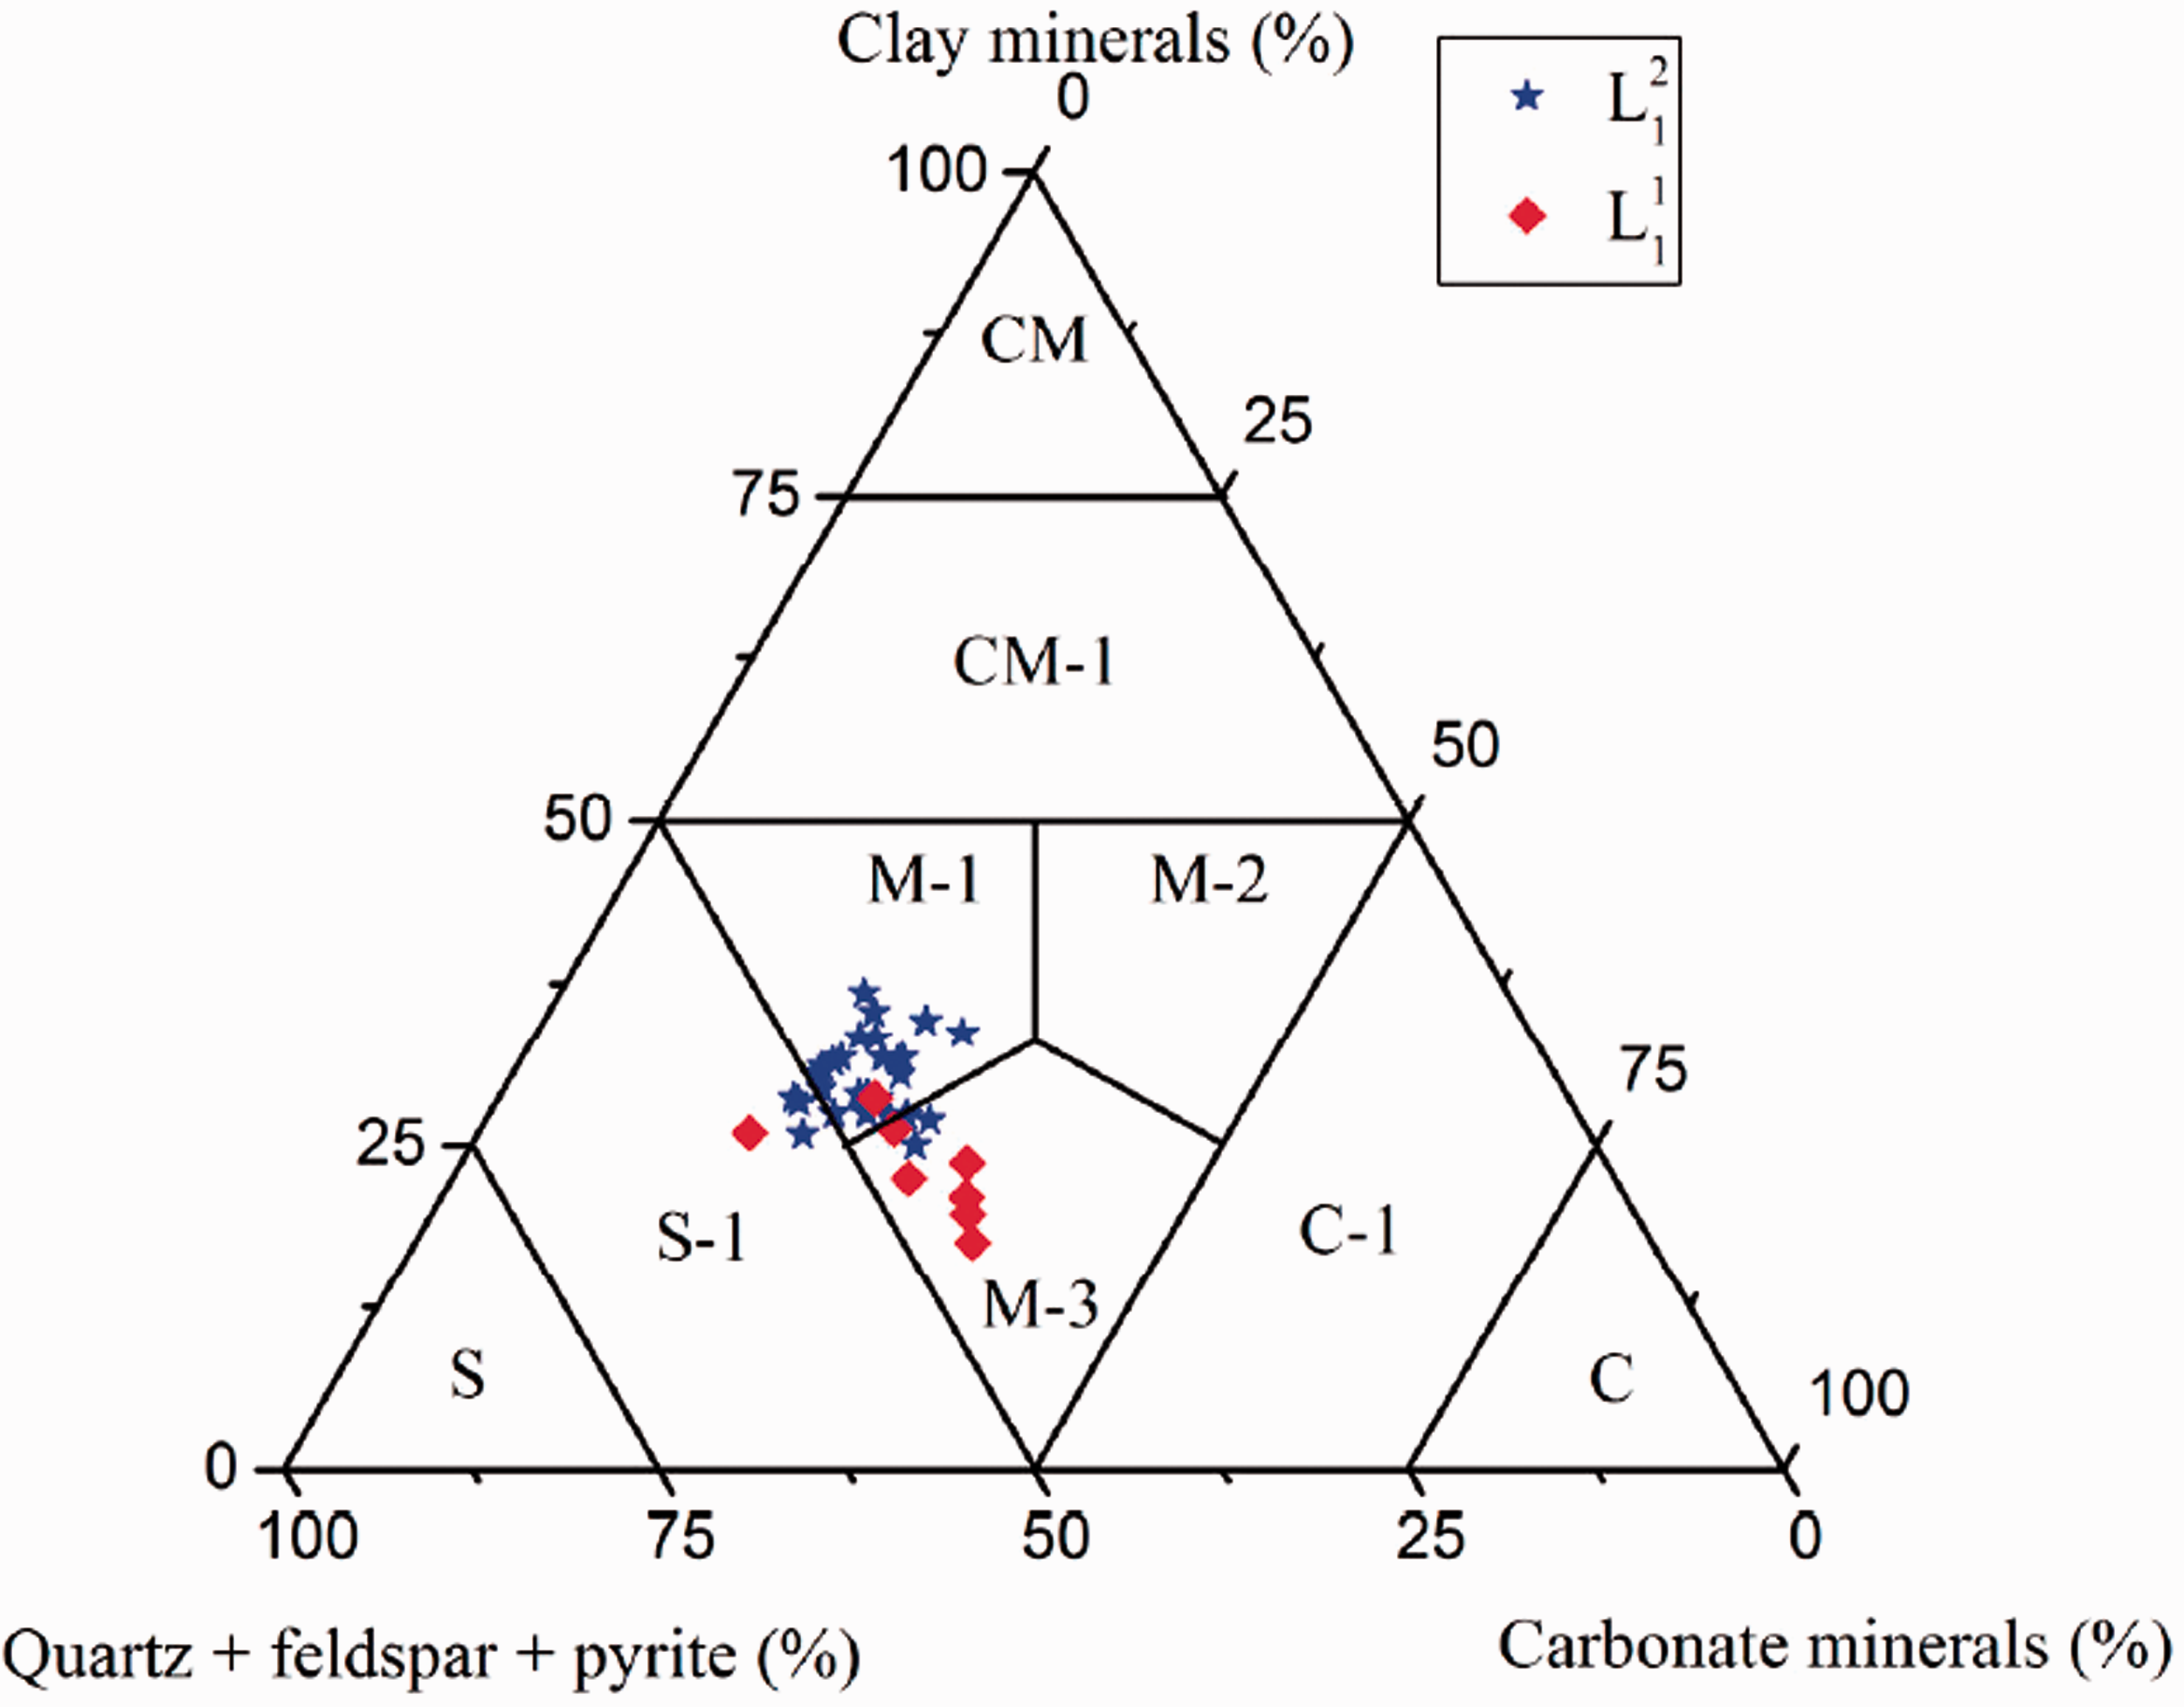
Triangular graph of the classifying results.
Commonly, shales with TOC >2% are regarded organic rich shales (Gao et al., 2018). In this study, we defined shales with averaged TOC ranged between 2% and 4% as organic rich shales, and those with averaged TOC >4% were extreme organic rich shales. Thus, a new lithofacies classification combining mineral composition and TOC data together can be proposed. For example, calcareous–siliceous mixed shales with TOC >4% can be regarded as organic extreme rich calcareous–siliceous mixed shales (OER-M-3), and clay–siliceous mixed shales with TOC >2% but <4% can be classified as organic rich clay–siliceous mixed shales (OR-M-1).
Major and trace elements analyses
Major and trace elements analyses, respectively, were conducted using S-II samples with a Rigaku 100E X-ray Fluorescence device and an Agilent 7500 A Inductively Coupled Plasma Mass Spectrometry, according to Chinese National Standard (GB/T14506.28–2010) and Chinese Geology and Mineral Industry Standard (DZ/T0223–2001). Before major elements analyses, powdered shale samples were calcined under 700°C to completely remove OM. Prior to trace elements analyses, shale samples were placed into a polytetrafluoroethylene vessel with a mixed solution of HClO4, HF, and HNO3 to dissolve powdered samples.
Field emission scanning electronic microscope, low-temperature nitrogen adsorption, and low-field nuclear magnetic resonance
Surfaces vertical to the bedding layer of dry S-III samples were firstly polished using abrasive paper. Subsequently, HITACHI IM4000 argon polishing device was used for polishing these surfaces, and finally, FE-SEM map describing shale morphology of these surfaces was observed using a double-beam electron microscope system named FEI Helio 650.
LTN2A tests of S-IV samples from different intervals of L1 were conducted using an automatic specific surface and pore analyzer named Tristar II3020. After high-temperature drying and degassing process (Song et al., 2017), S-IV samples were applied for LTN2A tests at 77.3 K. Relative pressures were ranged from 0.001 to 0.995. PSD and total pore volume were determined according to Barret-Joyner-Halenda (BJH) model (Barrett et al., 1951).
There is a consistent one-to-one match between T2 value and the pore radius, and the greater the T2 value, the greater is the corresponding pore radius (Li et al., 2018, 2019c). Hence, the PSD can be obtained by means of LF-NMR experiments, which were conducted using S-V samples by applying a RecCore 2500 instrument with a constant magnetic field strength of 0.12 T and a resonance frequency of 2.38 MHz. The LF-NMR experiments were performed on brine-saturated shale samples. The echo spacing, waiting time, number of echoes, number of scans, and test temperature were 0.3 ms, 6 s, 2048, 128, and 35°C, respectively.
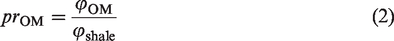
OM pore proportion estimation using FE-SEM image
Shi et al. (2015) proposed a method to calculate OM pore proportion, namely

Results and discussions
MLS types
Mineral compositions of MLS are displayed in Tables 1 and 2. The L1 shale could be divided into three types, i.e. siliceous shale (S-1), clay–siliceous mixed shale (M-1), and calcareous–siliceous mixed shale (M-3) (Figure 3). S-1, M-1, and M-3 shale, respectively, accounted for 7.1%, 68.6%, and 24.3% of the total thickness of L1. The primary lithofacies at the depth ranging in 1658 − 1681 m and 1683 − 1691 m of L1, respectively, were M-1 shale and M-3 shale (Figure 2). Therefore, the L1 shale was divided into two sub-intervals, i.e. L11 and L12 (Figure 2), according to the vertical profile MLS classifying results. The TOC contents of M-1 and M-3 (Figure 2 and Table 1) were ranged from 1.55% to 4.76% (avg. 2.68%) and from 2.56% to 7.35% (avg. 4.86%), respectively. Hence, combing the characters of mineral composition and TOC content together, shales in L11 were classified as OR-M-1 and those in L12 were classified as OER-M-3.
XRD and shale lithofacies identification results.
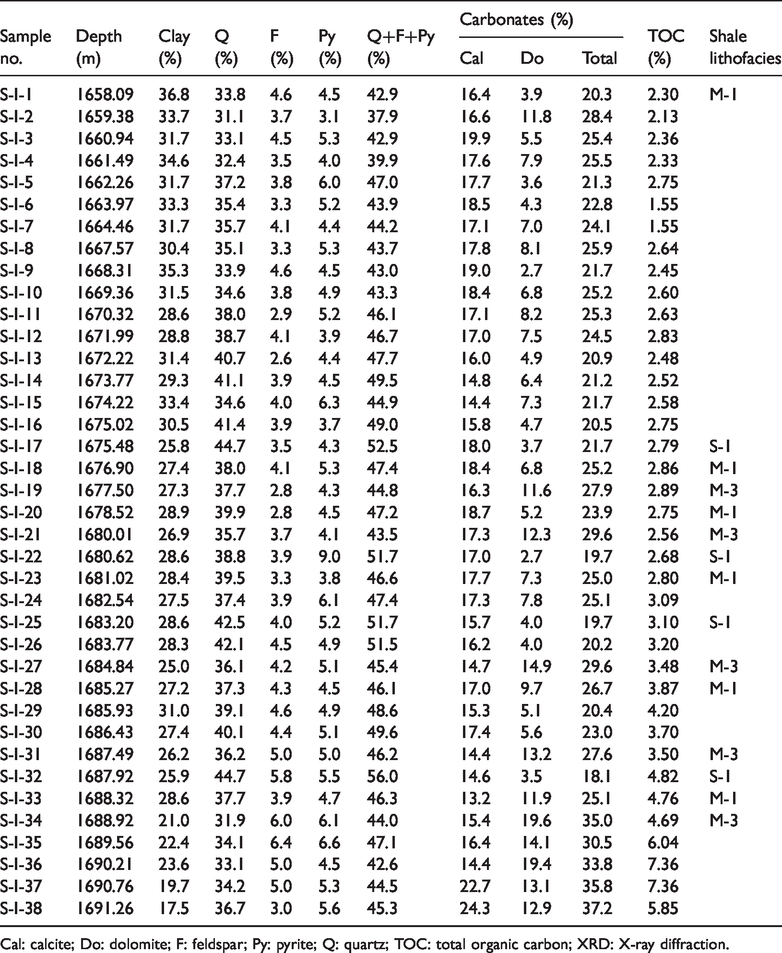
Cal: calcite; Do: dolomite; F: feldspar; Py: pyrite; Q: quartz; TOC: total organic carbon; XRD: X-ray diffraction.
XRD results of clay minerals.
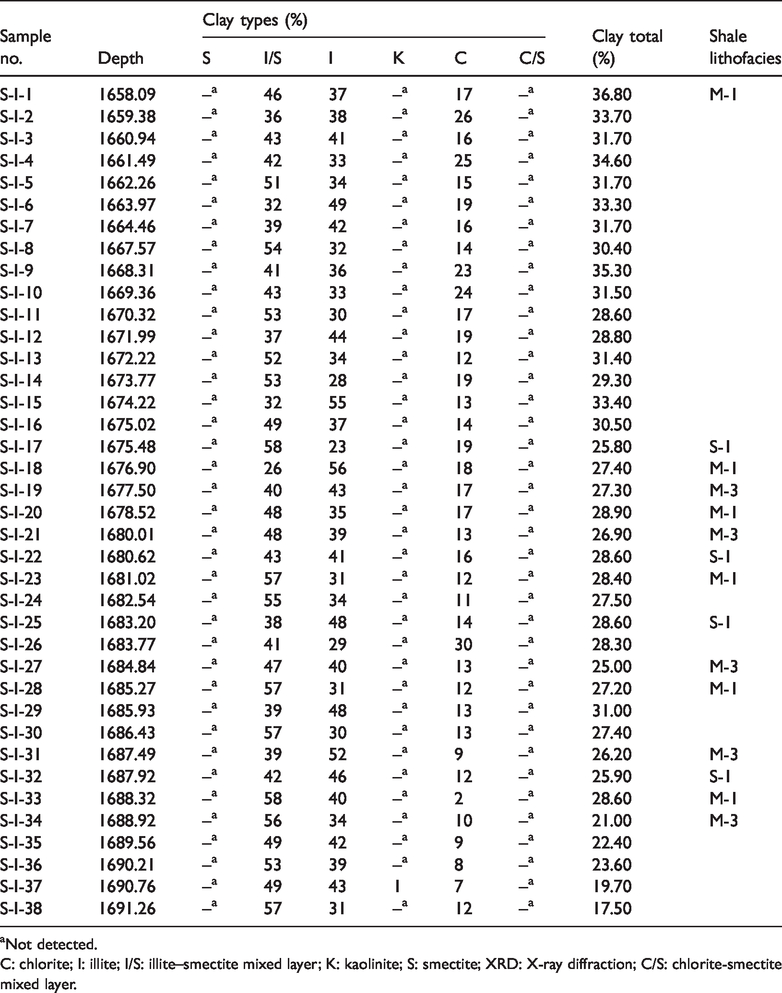
aNot detected.
C: chlorite; I: illite; I/S: illite–smectite mixed layer; K: kaolinite; S: smectite; XRD: X-ray diffraction; C/S: chlorite-smectite mixed layer.
Depositional environment of different MLS
Previous results on the relationship between trace elements ratios and redox environment of seawater are summarized: (1) V/Cr < 2, Ni/Co < 5, and U/Th < 0.75 correspond to an oxic condition; (2) 2 < V/Cr < 4.25, 5 < Ni/Co < 7, and 0.75 < U/Th <1.25 indicate a dysoxic environment; (3) V/Cr > 4.25, Ni/Co > 7, and U/Th > 1.25 suggest an anoxic environment (Jones and Manning, 1994; Rimmer, 2004; Wignall and Twitchett, 1996). As displayed in Figure 4, two noticeable phenomena could be found: (1) decreased trends of V/Cr, Ni/Co, and U/Th could be found, as burial depth of L1 shale increased; (2) V/Cr, Ni/Co, and U/Th values of OR-M-1, primarily locating in L11, were ranged in 1.51 − 3.66 (avg. 2.59), 2.51 − 7.13 (avg. 5.16), and 0.42 − 1.08 (avg. 0.71), respectively. However, those of OER-M-3, primarily locating in L12, were ranged in 2.47 − 8.34 (avg. 4.57), 5.49 − 16.30 (avg. 9.88), and 0.68 − 4.04 (avg. 1.95), respectively. These two phenomena indicated that OR-M-1 were formed in dysoxic–oxic seawater, while OER-M-3 were primarily formed in an anoxic waterbody (Figure 5).
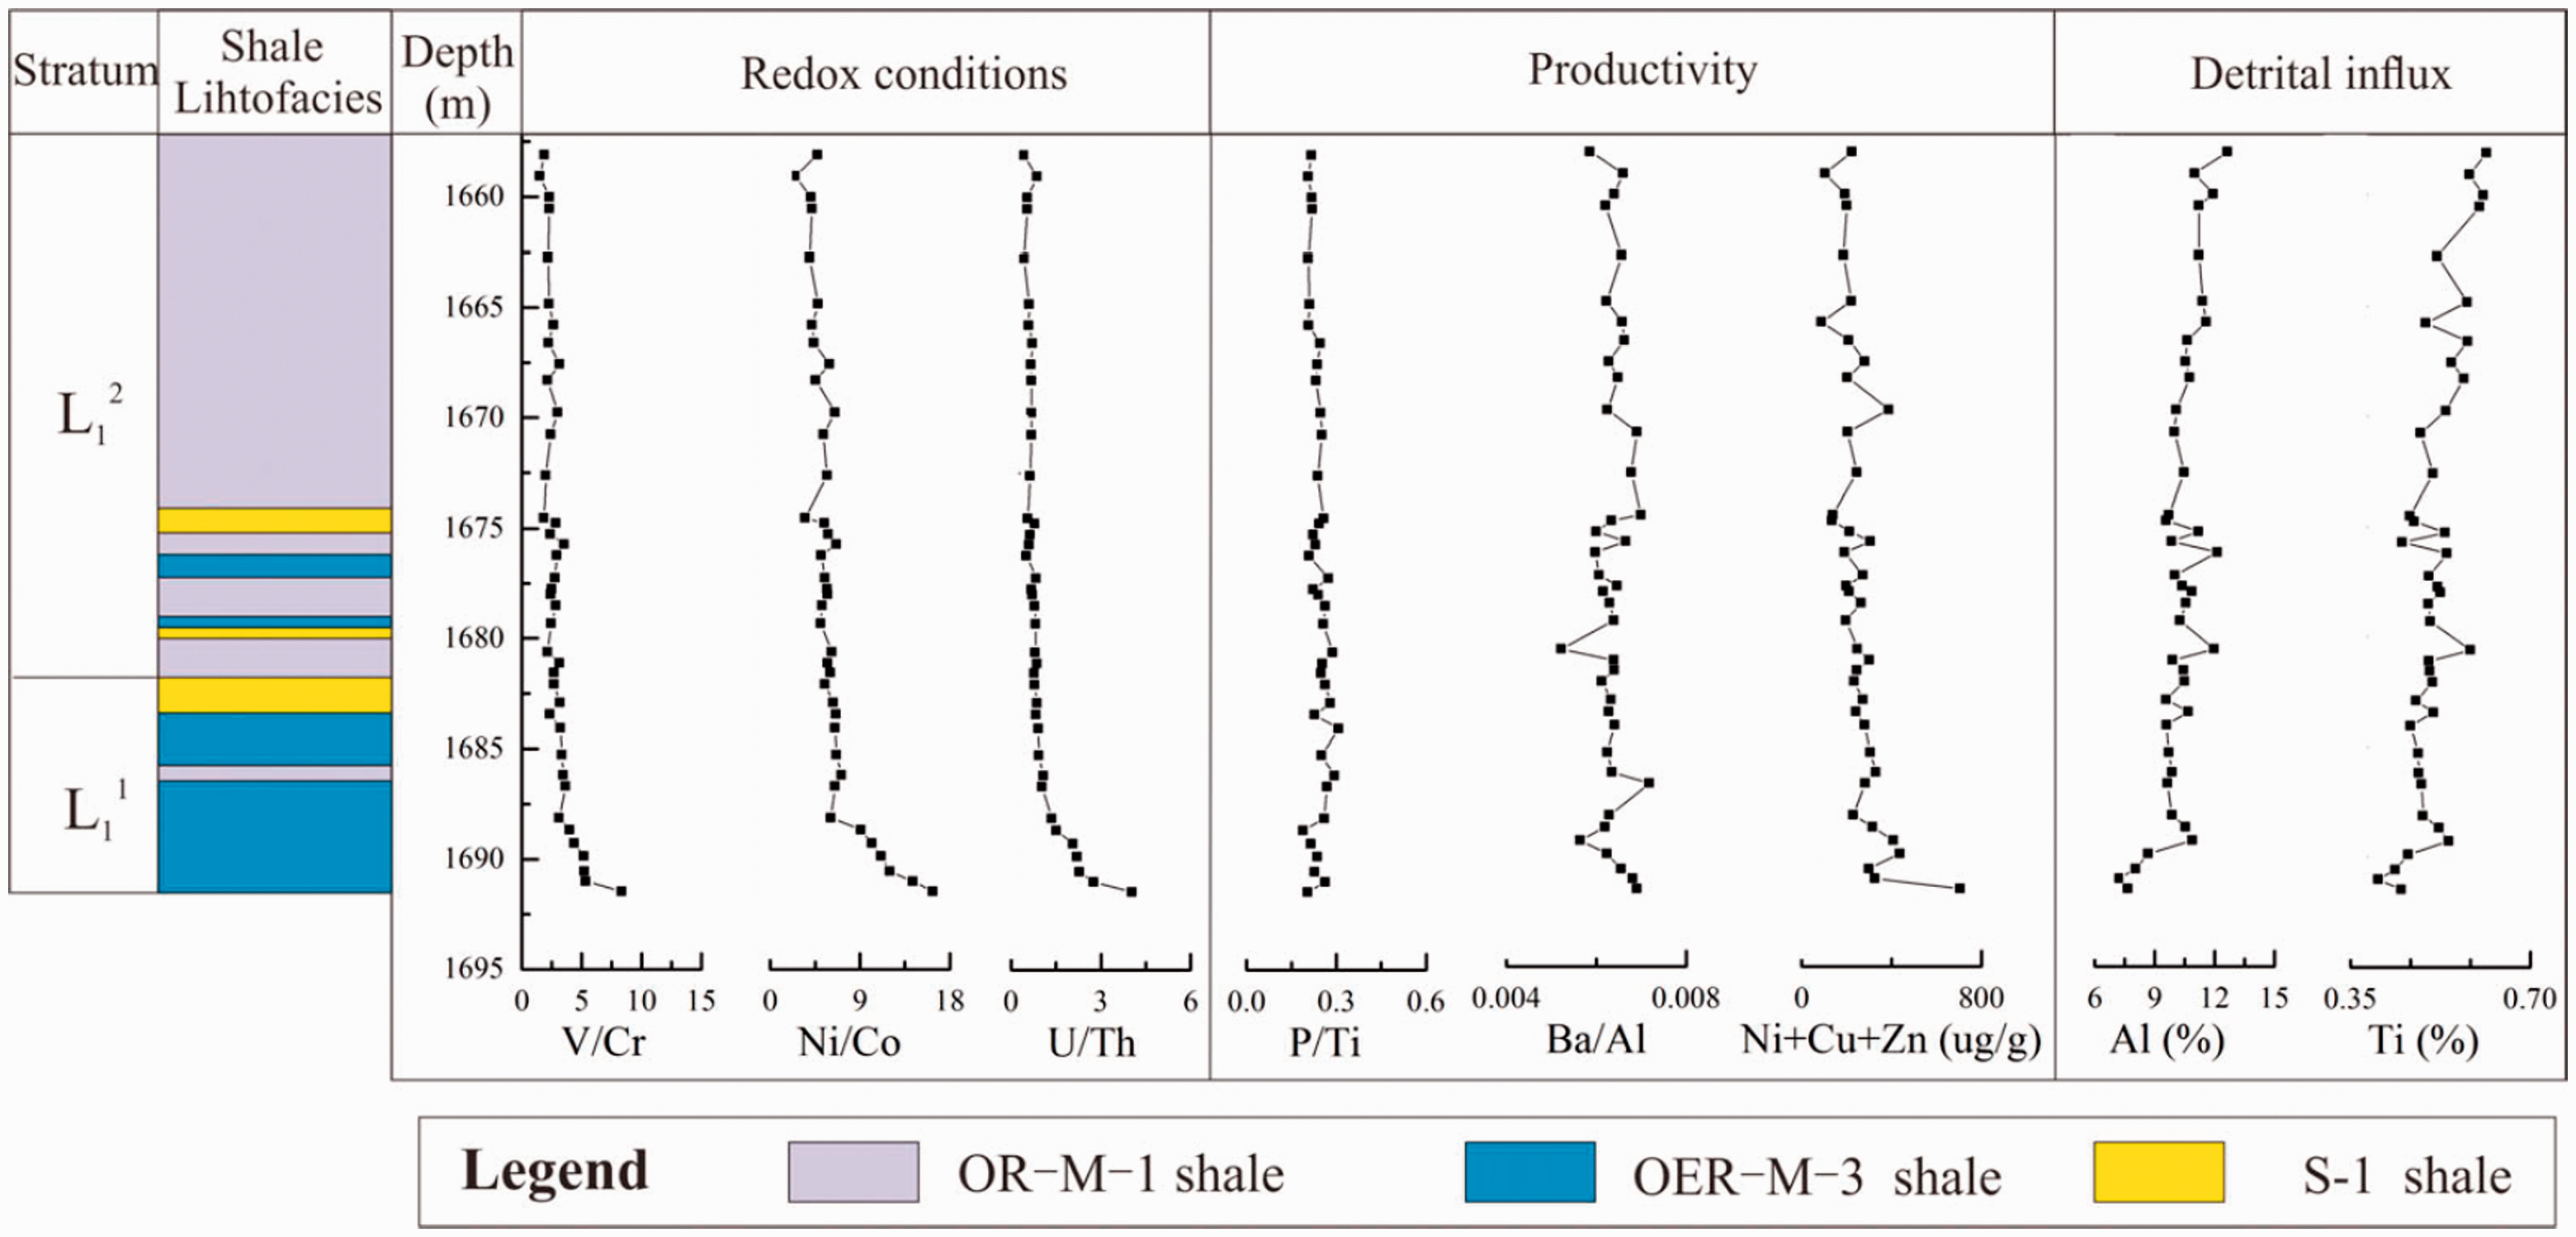
Stratigraphic distributions of redox indicators (V/Cr, Ni/Co, and U/Th), paleo-productivity indicators (P/Ti, Ba/Al, and Ni+Cu+Zn), and detrital influx indicators (Al and Ti) of L1 in Y105 well.
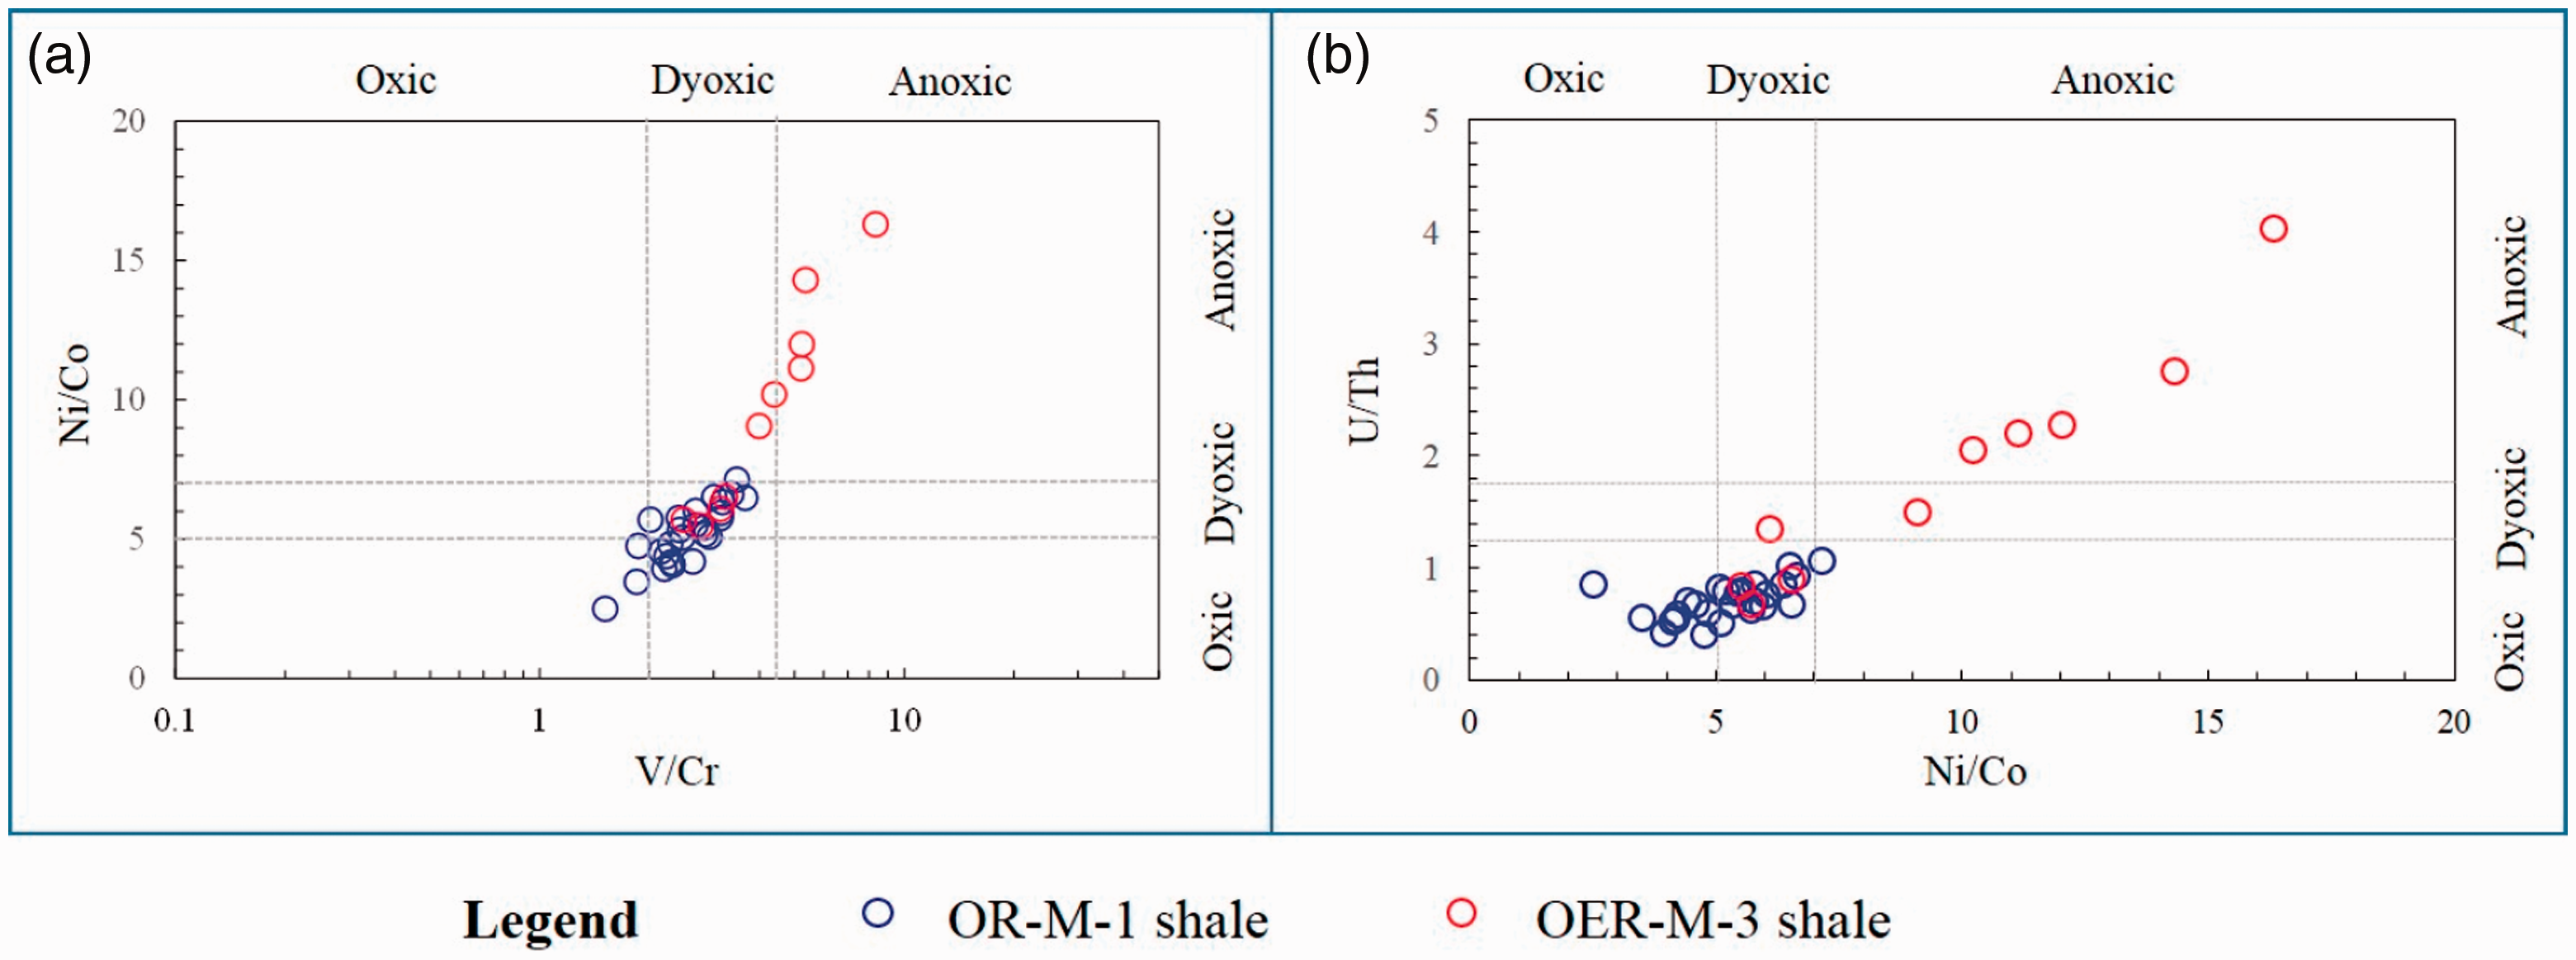
Cross plots of redox proxies in L1: (a) V/Cr versus Ni/Co; (b) Ni/Co versus U/Th, based on empirical values of redox proxies researched by Jones and Manning (1994), Wignall and Twitchett (1996), and Rimmer (2004).
Ba/Al ratio can be used to express paleo-productivity, considering that Ba is characterized by a long residence time in seawater and a high preservation rate (Dymond et al., 1992; Goldberg and Arrhenius, 1958; Pfeifer et al., 2001), and Al in the ratio is used to eliminate the interference of terrigenous input (Zhang et al., 2019a). P/Ti can also be used to express paleo-productivity because P is one of the most extensively applicable and reliable productivity indicators (Brumsack, 2006) and Ti is used to eliminate the interference of terrigenous input as well. Meanwhile, a tight correlation between the sum of Cu, Zn, and Ni and paleo-productivity was found by previous scholars (Zhang et al., 2019a), i.e. as the former increases, the latter increases obviously. In this study, the differences between P/Ti, Ba/Al, and the sum of Cu, Zn, and Ni of OER-M-3 and those of OR-M-1 were not noticeable (Figure 4), indicating that paleo-productivities in the waterbody depositing OER-M-3 were close to those in the waterbody depositing OR-M-1. The values of P/Ti, Ba/Al, and the sum of Cu, Zn, and Ni of both OER-M-3 and OR-M-1, were close to those of the transgressive systems tract shale characterized with high paleo-productivity, as reported by Zhang et al. (2019a); thus, paleo-productivities of the depositing environment of OER-M-3 and OR-M-1 were high.
Previous studies reported that Al and Ti can be applied to indicate terrigenous detrital influx (Zhang et al., 2019a). It is remarkable that the concentrations of both Al and Ti decrease downward, and those of OR-M-1 were obviously greater than those of OER-M-3 (Figure 4). These phenomena suggested that the terrigenous detrital influx intensity during the depositing periods of OR-M-1 was stronger than that of OER-M-3.
The depositing stage corresponding to L11, namely the Early Silurian, is characterized by rapid rising of sea-level owing to the warming of paleoclimate and speedy melting of glacier (Zhang et al., 2019a). The water depth can reach 200 m in this stage (Boucot and Chen, 2009), indicating a deep-water shelf environment (Figure 6(a)). The increased waterbody depth resulted in an anoxic environment on the sea shelf (Figure 6(a)), which benefited for the preservation of OM. As a result, TOC values of OER-M-3, mainly locating in L11, were greater than those of OR-M-1 primarily distributing in L12 (Figure 2). Waterbody depth decreased obviously in the deposition stage of L12 (Figure 6(b)), judged by the successively declined values of redox indicators from L11 to L12. As a result, a gradual increase in oxygen concentration of waterbody and a semi-deep-water shelf environment during L12 depositing period occurred (Figure 6(b)). The redox conditions gradually evolved from anaerobism to hypoxia rich oxygen, which was detrimental to the accumulation of OM (Zhang et al., 2019a). Meanwhile, decreased water depth benefited for deposition of terrigenous clastics, as revealed by high concentrations of Al and Ti in L12 (Figure 4). Therefore, the clay mineral contents of OR-M-1 were relatively greater than those of OER-M-3. In a brief summary, the integration of anoxic conditions and deposition of terrigenous clastics, controlled by the depth of seawater, determined the forming of OR-M-1 and OER-M-3 in research area (Figure 6).
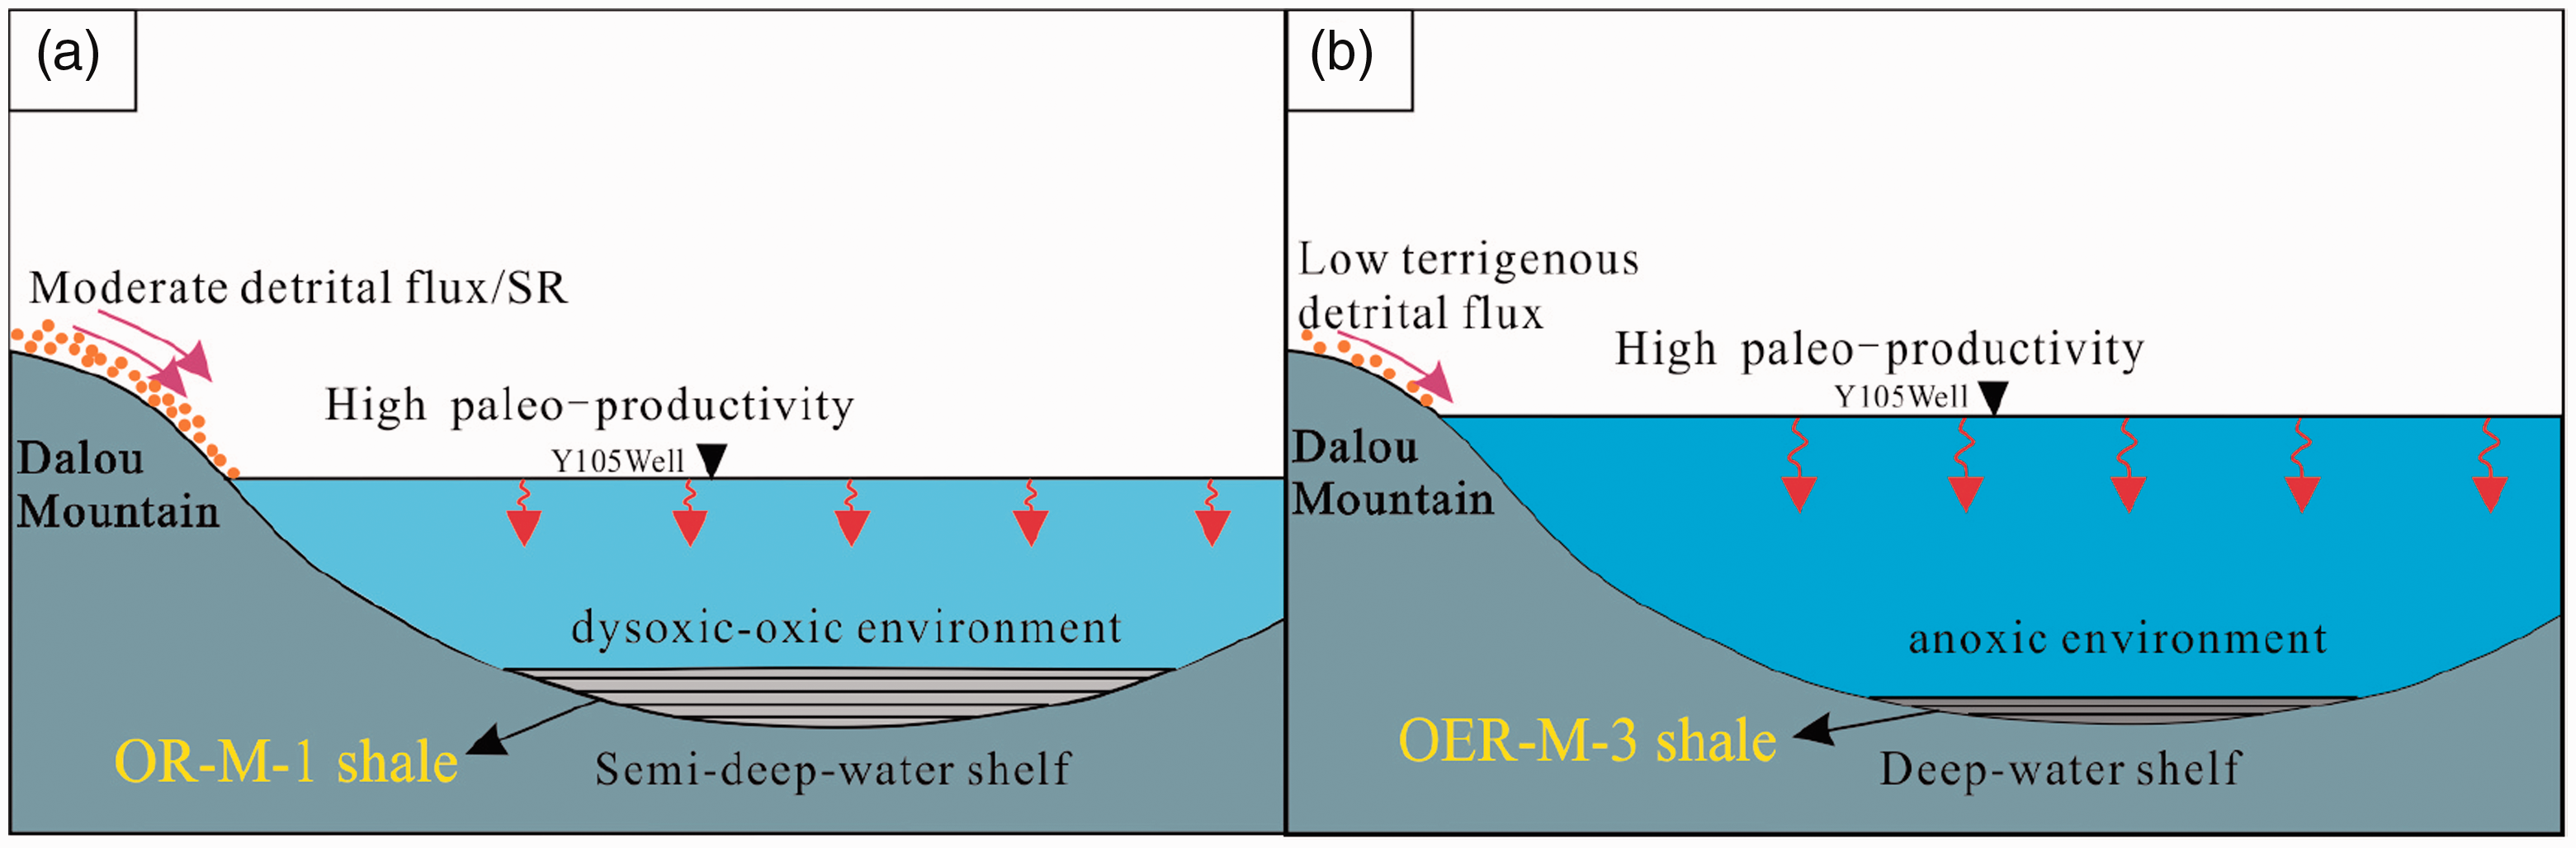
Sketch map of the sedimentary environment of (a) OR-M-1 and (b) OER-M-3.
Pore types of different MLS through FE-SEM
InterP
In our study, it could be found that the diameter of the InterP was ranged between 10 nm and several microns, as displayed in Figure 7, suggesting that most InterP were meso-pores or macro-pores. The InterP of OR-M-1 were formed between clay and quartz (Figure 7(a) and (b)), or pyrite and illite (Figure 7(c)), or pyrite and chlorite (Figure 7(d)). However, those of OER-M-3 were located between OM particle and calcite (Figure 7(e)), or between quartz and clay minerals (Figure 7(f)). These phenomena indicated the differences of InterP between OR-M-1 and OER-M-3 existed, i.e. InterP of OR-M-1 were associated with the occurrence of clay and other minerals, while those of OER-M-3 were associated with the occurrence of carbonate minerals and other minerals. Meanwhile, a considerable volume of InterP was filled by OM (Figure 7(a), (c), and (g)).
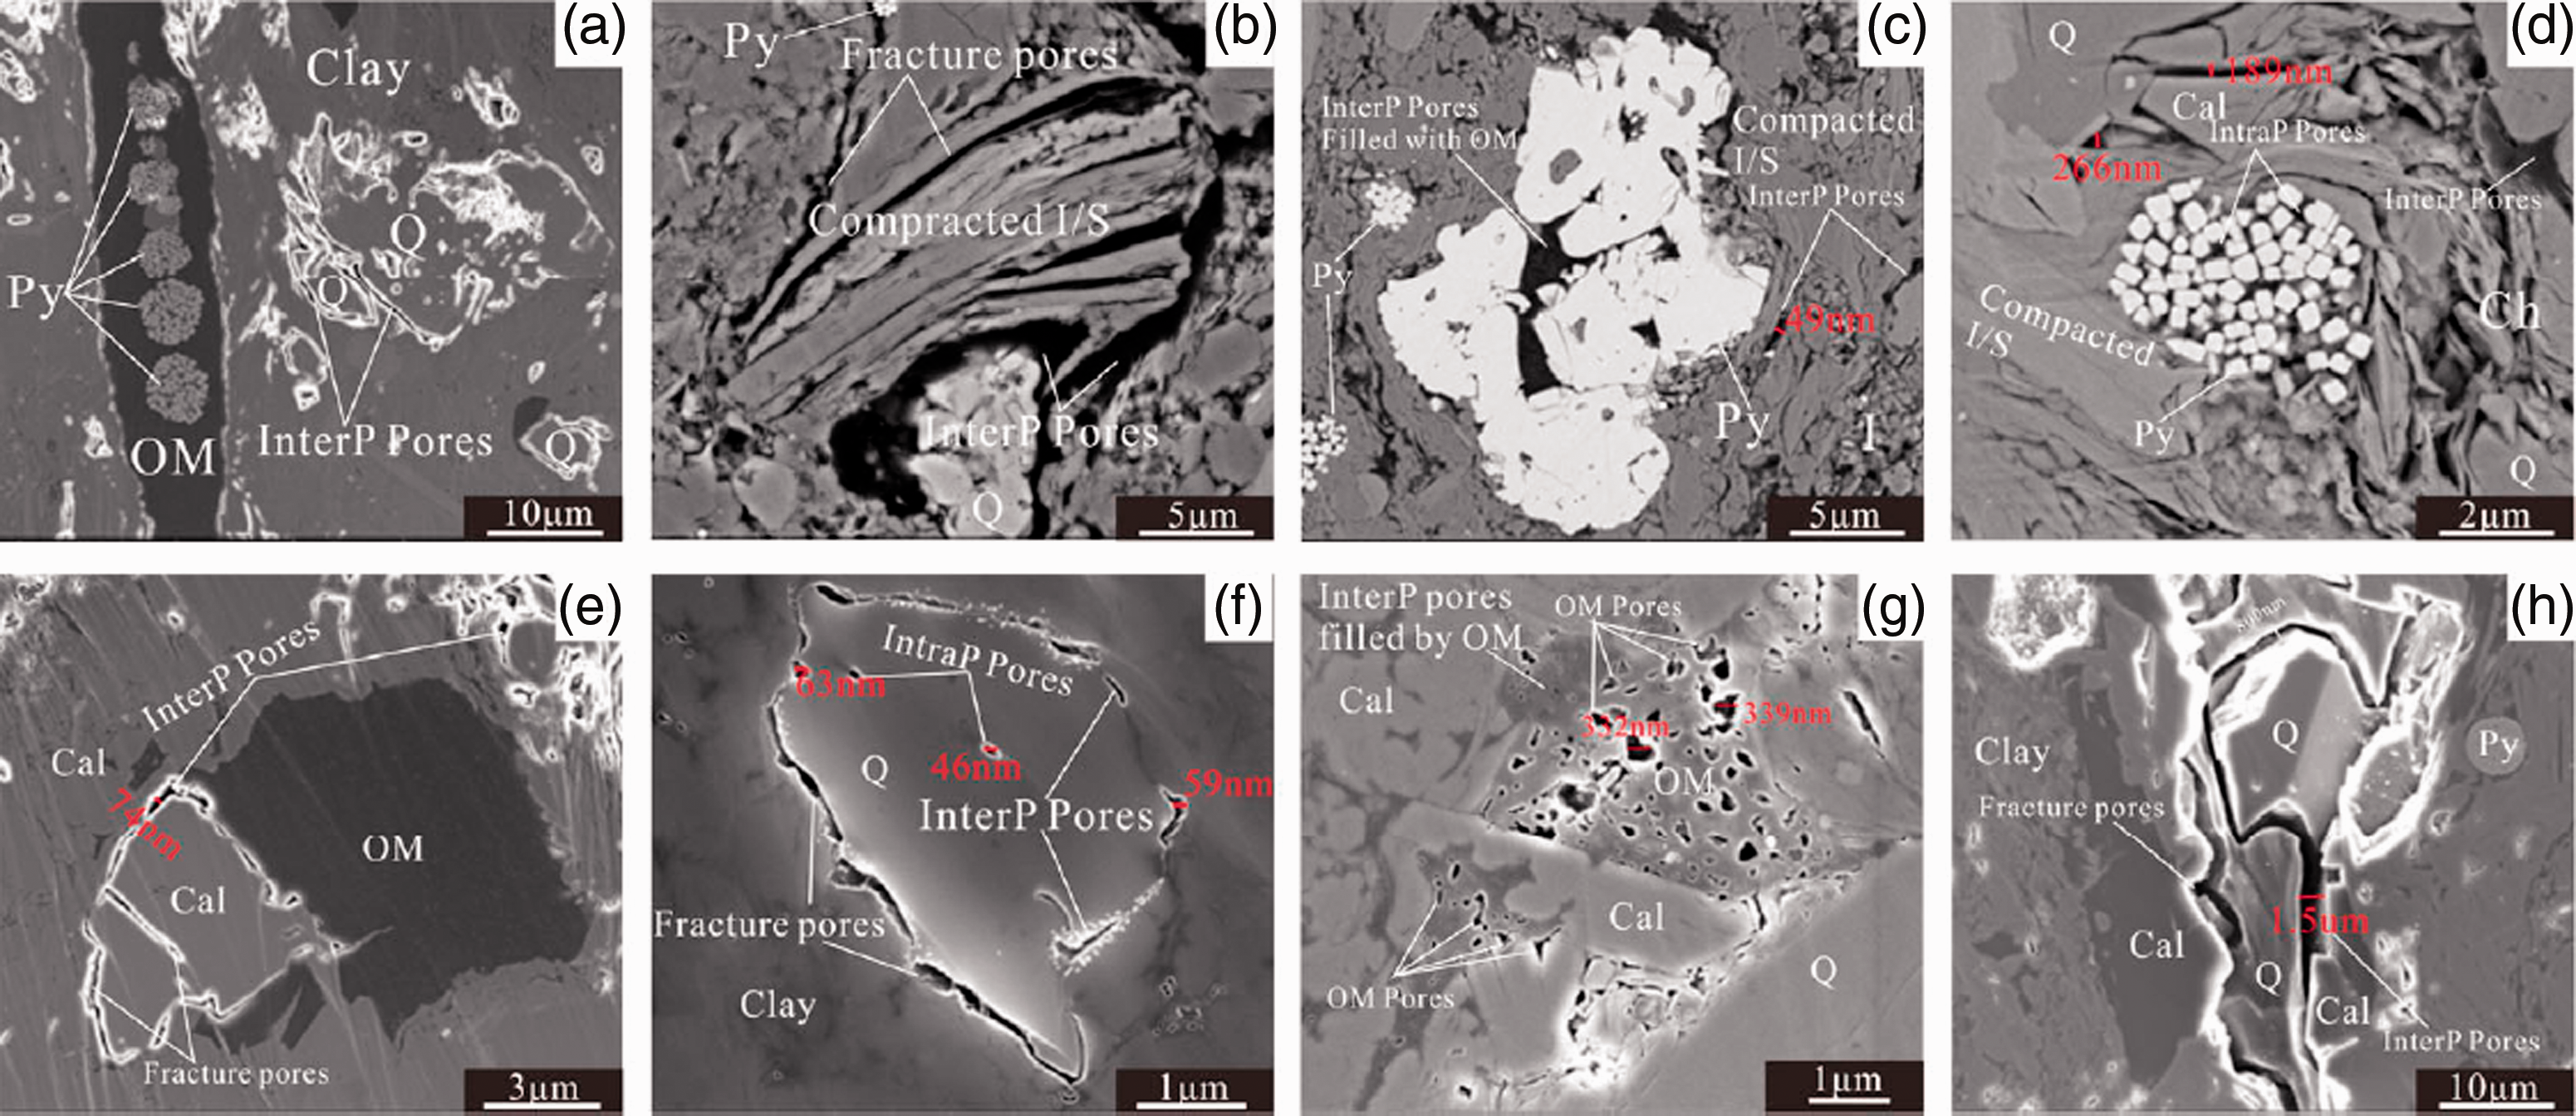
InterP in different typed lithofacies: (a to d) OR-M-1; (e to h) OER-M-3.
IntraP
The diameter of IntraP was ranged between 10 nm and several hundred nanometers (Figure 8). Some IntraP between pyrite granules, i.e. intergranular pore of pyrite, were filled by OM, which can be observed in both OR-M-1 (Figure 8(a)) and OER-M-3 (Figure 8(e)). Meanwhile, mold pores originated from pyrite dissolution could be found in OR-M-1 (Figure 8(b)) and OER-M-3 (Figure 8(e)) as well. Compared with OER-M-3, clay content of OR-M-1 was relatively greater. Therefore, the IntraP associated with I/S (Figure 8(c)) and intraplatelet pores associated with clay aggregates were more common in OR-M-1 (Figure 8(d)). Carbonate minerals were relatively more developed in OER-M-3, compared with those of OR-M-1, thus more carbonate dissolved pores (Figure 8(f), (g), and (h)) can be observed in OER-M-3.

IntraP in different typed lithofacies: (a to d) OR-M-1; (e to h) OER-M-3.
OM pores
The above contents in the “Pore types of different MLS through FE-SEM” section have demonstrated that InterP and IntraP were filled with OM. Figure 9 demonstrates the detailed morphologies of OM and OM pores. The diameter of OM pores were ranged from several nanometers to several hundred nanometers. It could be observed that OM pores were more developed in OER-M-3 (Figure 9).
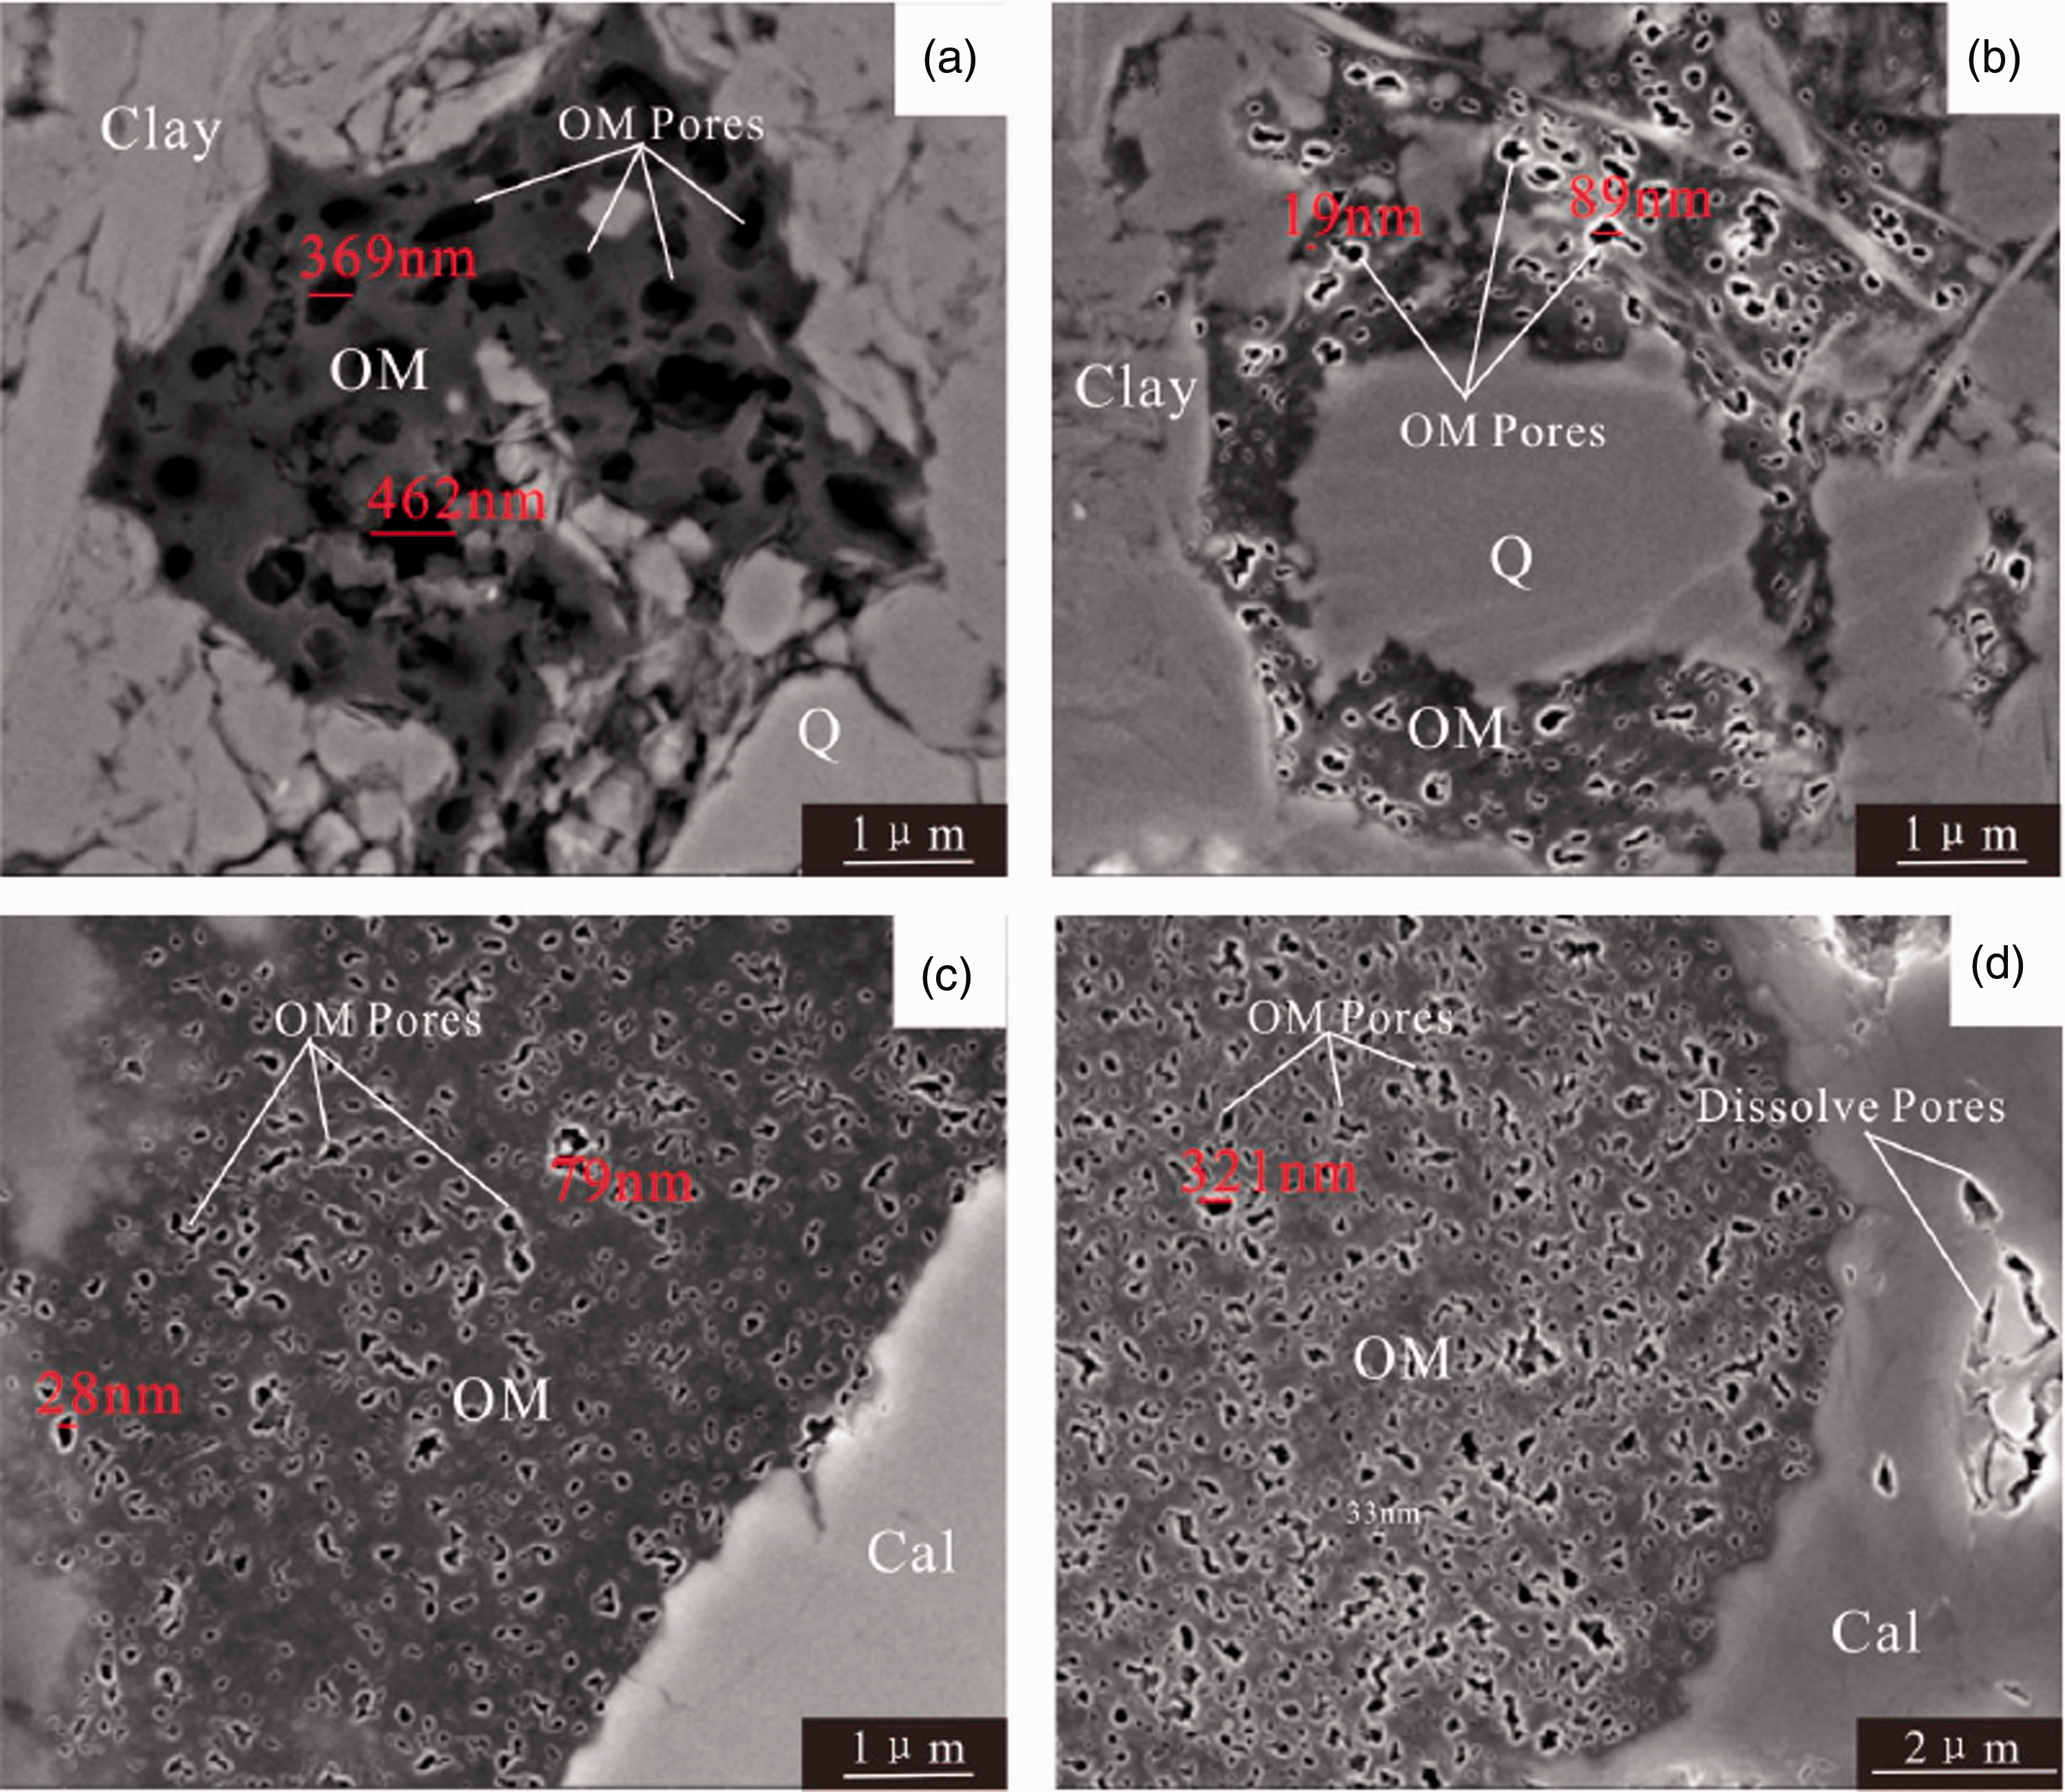
OM pores in different typed lithofacies: (a, b) OR-M-1; (c, d) OER-M-3.
OM pore proportion
Averaged values of ρshale of OR-M-1and OER-M-3 in this research area were 2.71 and 2.67 g/cm3, respectively. Averaged values of ωOM of OR-M-1 and OER-M-3 were 2.33% and 3.58%, respectively. According to the study of Hu (2013), empirical value ρOM is 1.29 g/cm3. Averaged φshale values of OR-M-1 and OER-M-3 were 5.51% and 3.73%, based on which prOM values could be calculated (Table 3). The results showed that porosity proportions of OER-M-3 OM pores, ranging between 17.43% and 67.36% (avg. 34.96%), were greater than those of OR-M-1 OM pores, which were in the range from 3.23% to 28.87% (avg. 10.73%). This phenomenon can be attributed to the following reasons: (1) TOC content of OER-M-3 was greater than that of OR-M-1, as discussed in the “Depositional environment of different MLS” section; (2) the vitrinite reflectance values of OER-M-3 were slightly greater than those of OR-M-1 (Figure 10), thus more OM pores were generated during the thermal evolution in OER-M-3.
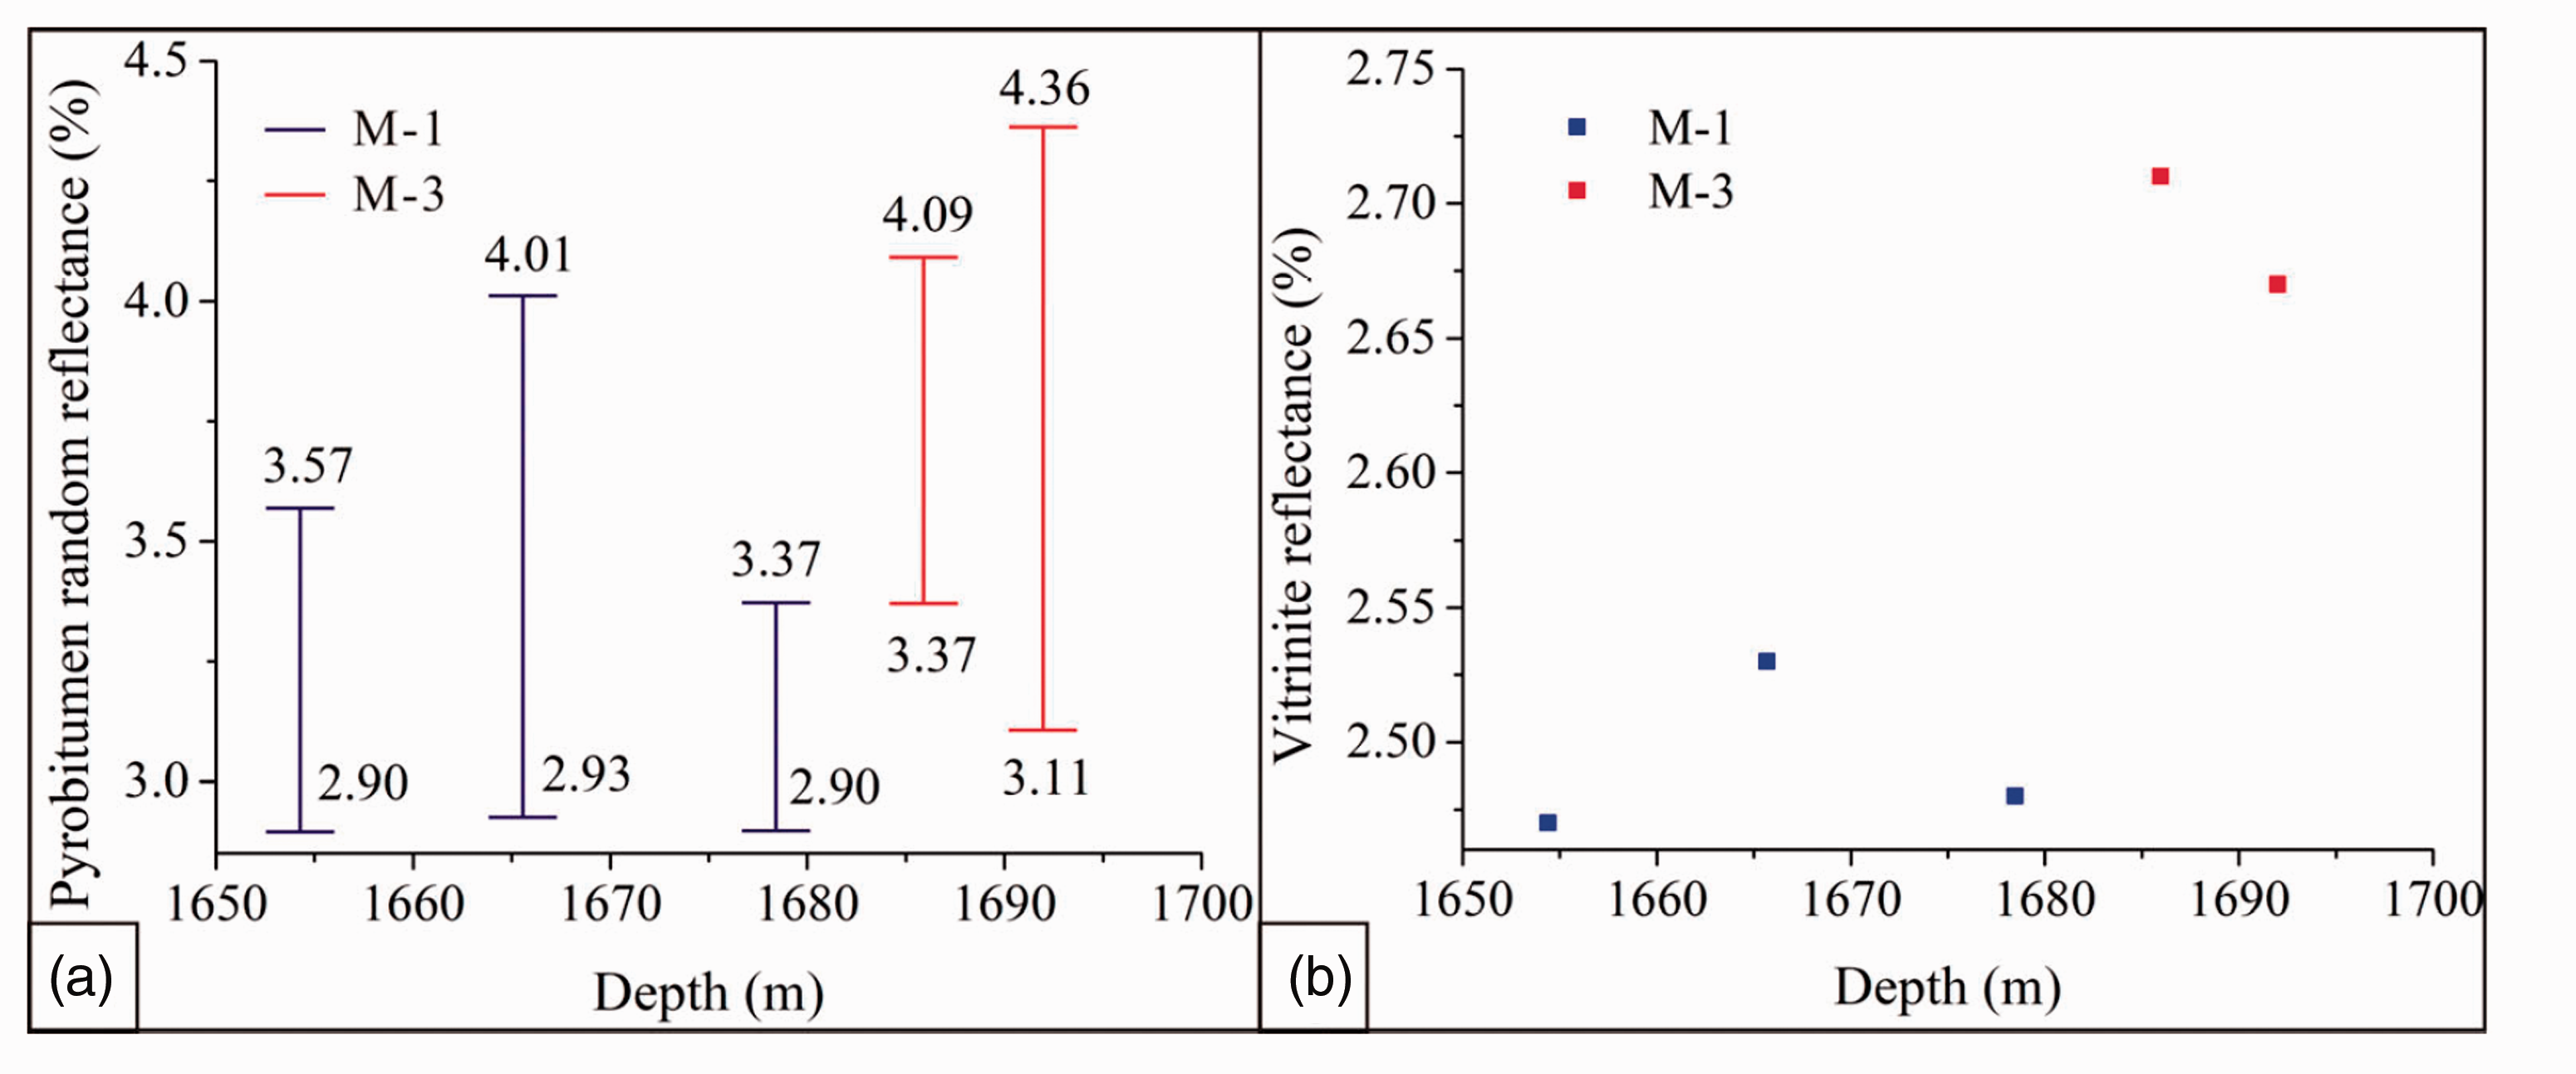
Pyrobitumen random reflectance (a) and vitrinite reflectance (b) variations as burial depth increases.
Proportion of OM pores occupying the total pores.
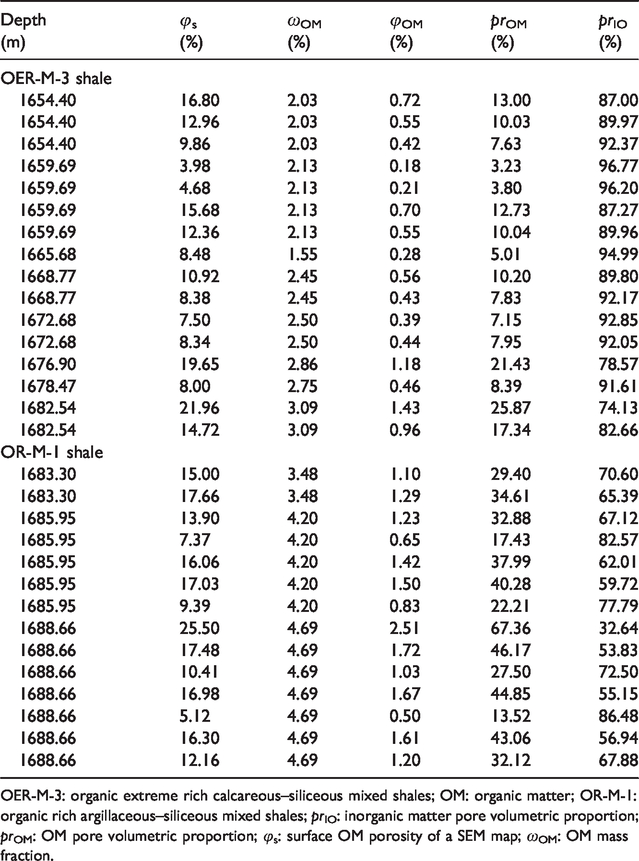
OER-M-3: organic extreme rich calcareous–siliceous mixed shales; OM: organic matter; OR-M-1: organic rich argillaceous–siliceous mixed shales; prIO: inorganic matter pore volumetric proportion; prOM: OM pore volumetric proportion; φs: surface OM porosity of a SEM map; ωOM: OM mass fraction.
PSD of different MLS
PSD derived from LF-NMR
Zhou et al. (2016) found that the left portion of NMR T2 spectrum (T2 were ranged between 0.1 and 7 ms) corresponds to PSD derived from CO2 adsorption, namely micro-pores size distribution, and the right portion of NMR T2 distribution (T2 were ranged between 7 and 50 ms) corresponds to PSD derived from N2 adsorption. In this study, we used the first left portion of T2 spectrum to demonstrate micro-pore size distribution. It can be observed from Figure 11 that (1) the peak amplitudes of the left T2 spectrum (T2<10 ms) of OER-M-3 were greater than those of OR-M-1 (Figure 11(a-1) to (d-1)), indicating that micro-pore volume of OER-M-3 was greater than that of OR-M-1; (2) the T2 value corresponding to the peak amplitude, namely T2peak as displayed in Figure 11, increased as depth increased (Figure 11(a-1) to (d-1)). The T2peak values of OER-M-3 were greater than those of OR-M-1; (3) the left T2 spectrum seemed to move to the right as burial depth increased (Figure 11(a-1) to (d-1)); (4) as can be seen from the shaded region between the water saturated T2 curve and centrifuged T2 curve (Figure 11(a-1) to (d-1)), more water was driven into smaller micro-pores of OER-M-3 during centrifugation process, compared with that of OR-M-1. More smaller micro-pores of OER-M-3 were not saturated with water during the water saturating process, compared with those of OR-M-1; (5) the T2 cutoff value (T2c) of OER-M-3 was greater than that of OR-M-1 (Figure 11(a-2) to (a-2)); (6) the differences of moveable fluid saturation and capillary bound water saturation between different MLS were not significant (Figure 11(a-2) to (d-2)).
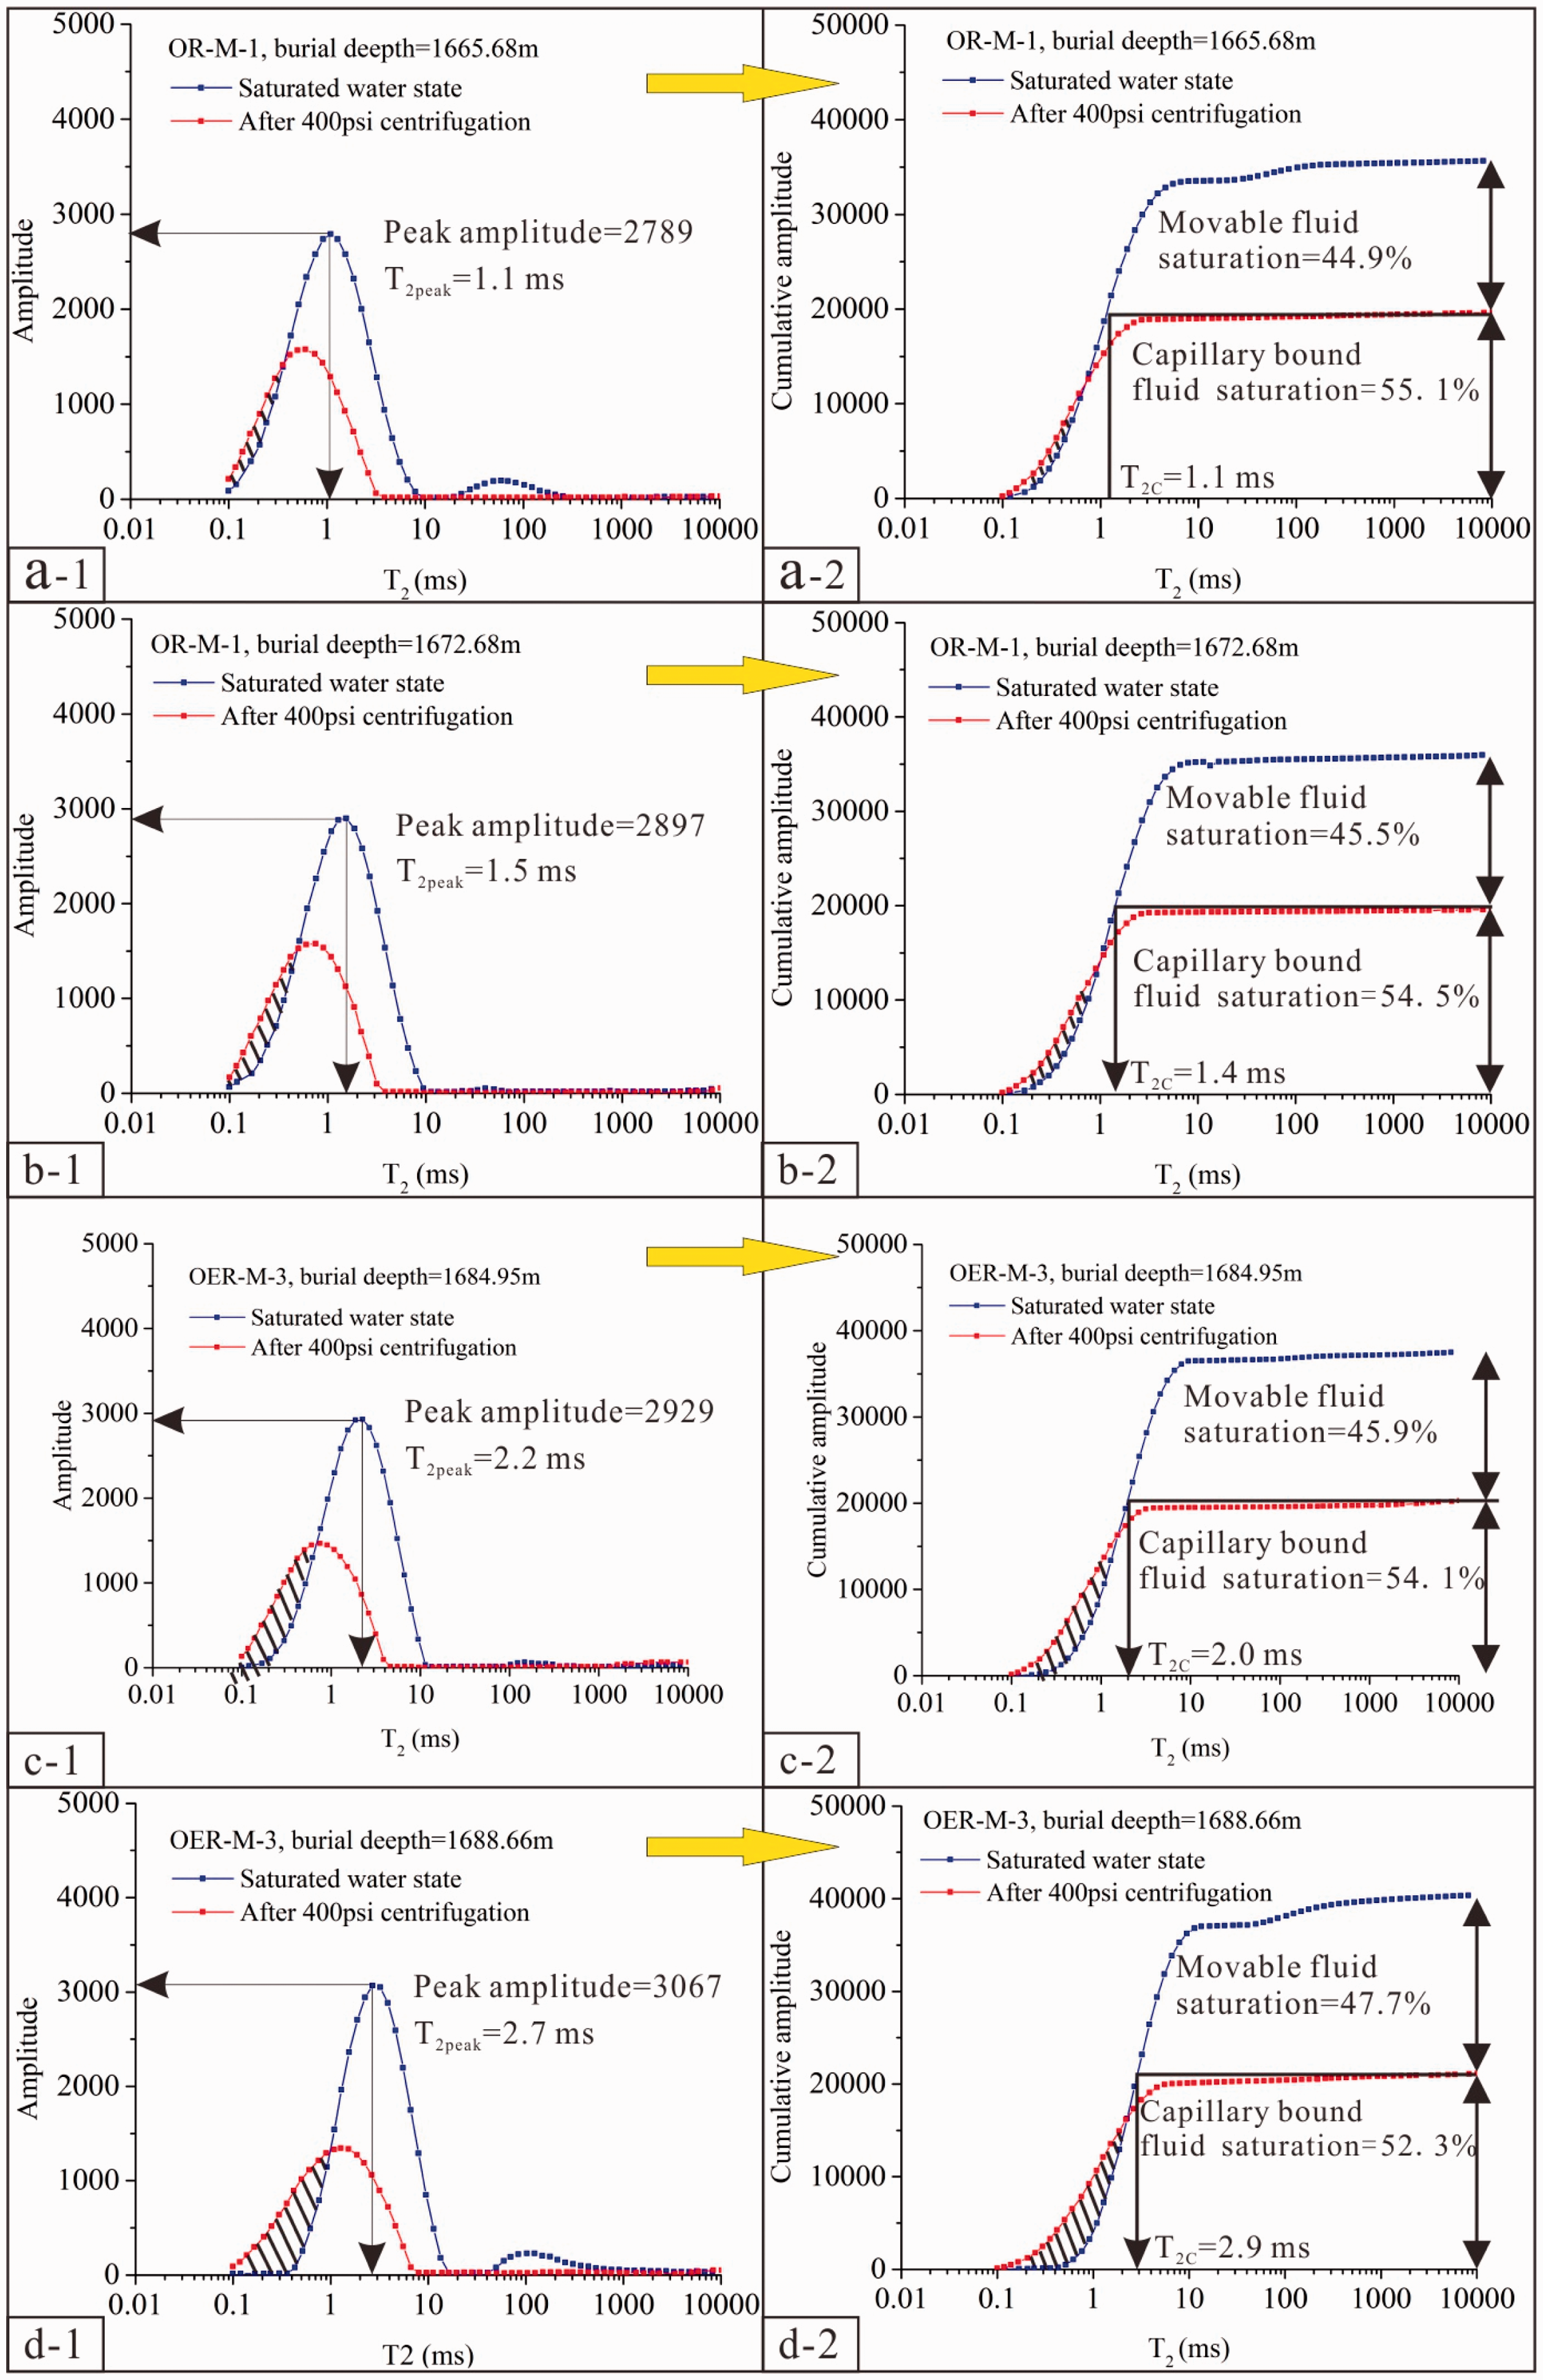
LF-NMR T2 distribution map (a-1, b-1, c-1, and d-1) and cumulative signal map (a-2, b-2, c-2, and d-2). (a, b) OR-M-1, sampled at the depths of 1665.68 and 1672.68 m in L12 of Y105 well, respectively; (c, d) OER-M-3, sampled at the depths of 1684.95 and 1688.66 m in L11 of Y105 well, respectively.
PSD derived from LTN2A
LTN2A can be used to measure PSD ranging between 2 to 100 nm, as introduced by Li et al. (2019). Therefore, PSDs of meso-pores and macro-pores with diameter ranging from 50 to 100 nm can be derived from LTN2A data. It can be observed from Figure 12 that (1) the increment volume and surface area of meso-pore of OER-M-3 (marked by the solid line frame in Figure 12(a) and (b)) were slightly greater than those of OR-M-1; (2) the increment volume and area of macro-pore of OER-M-3 (marked by the dashed rectangle in Figure 12(a) and (b)), with diameter ranging between 50 and 100 nm, were slightly lower than those of OR-M-1.
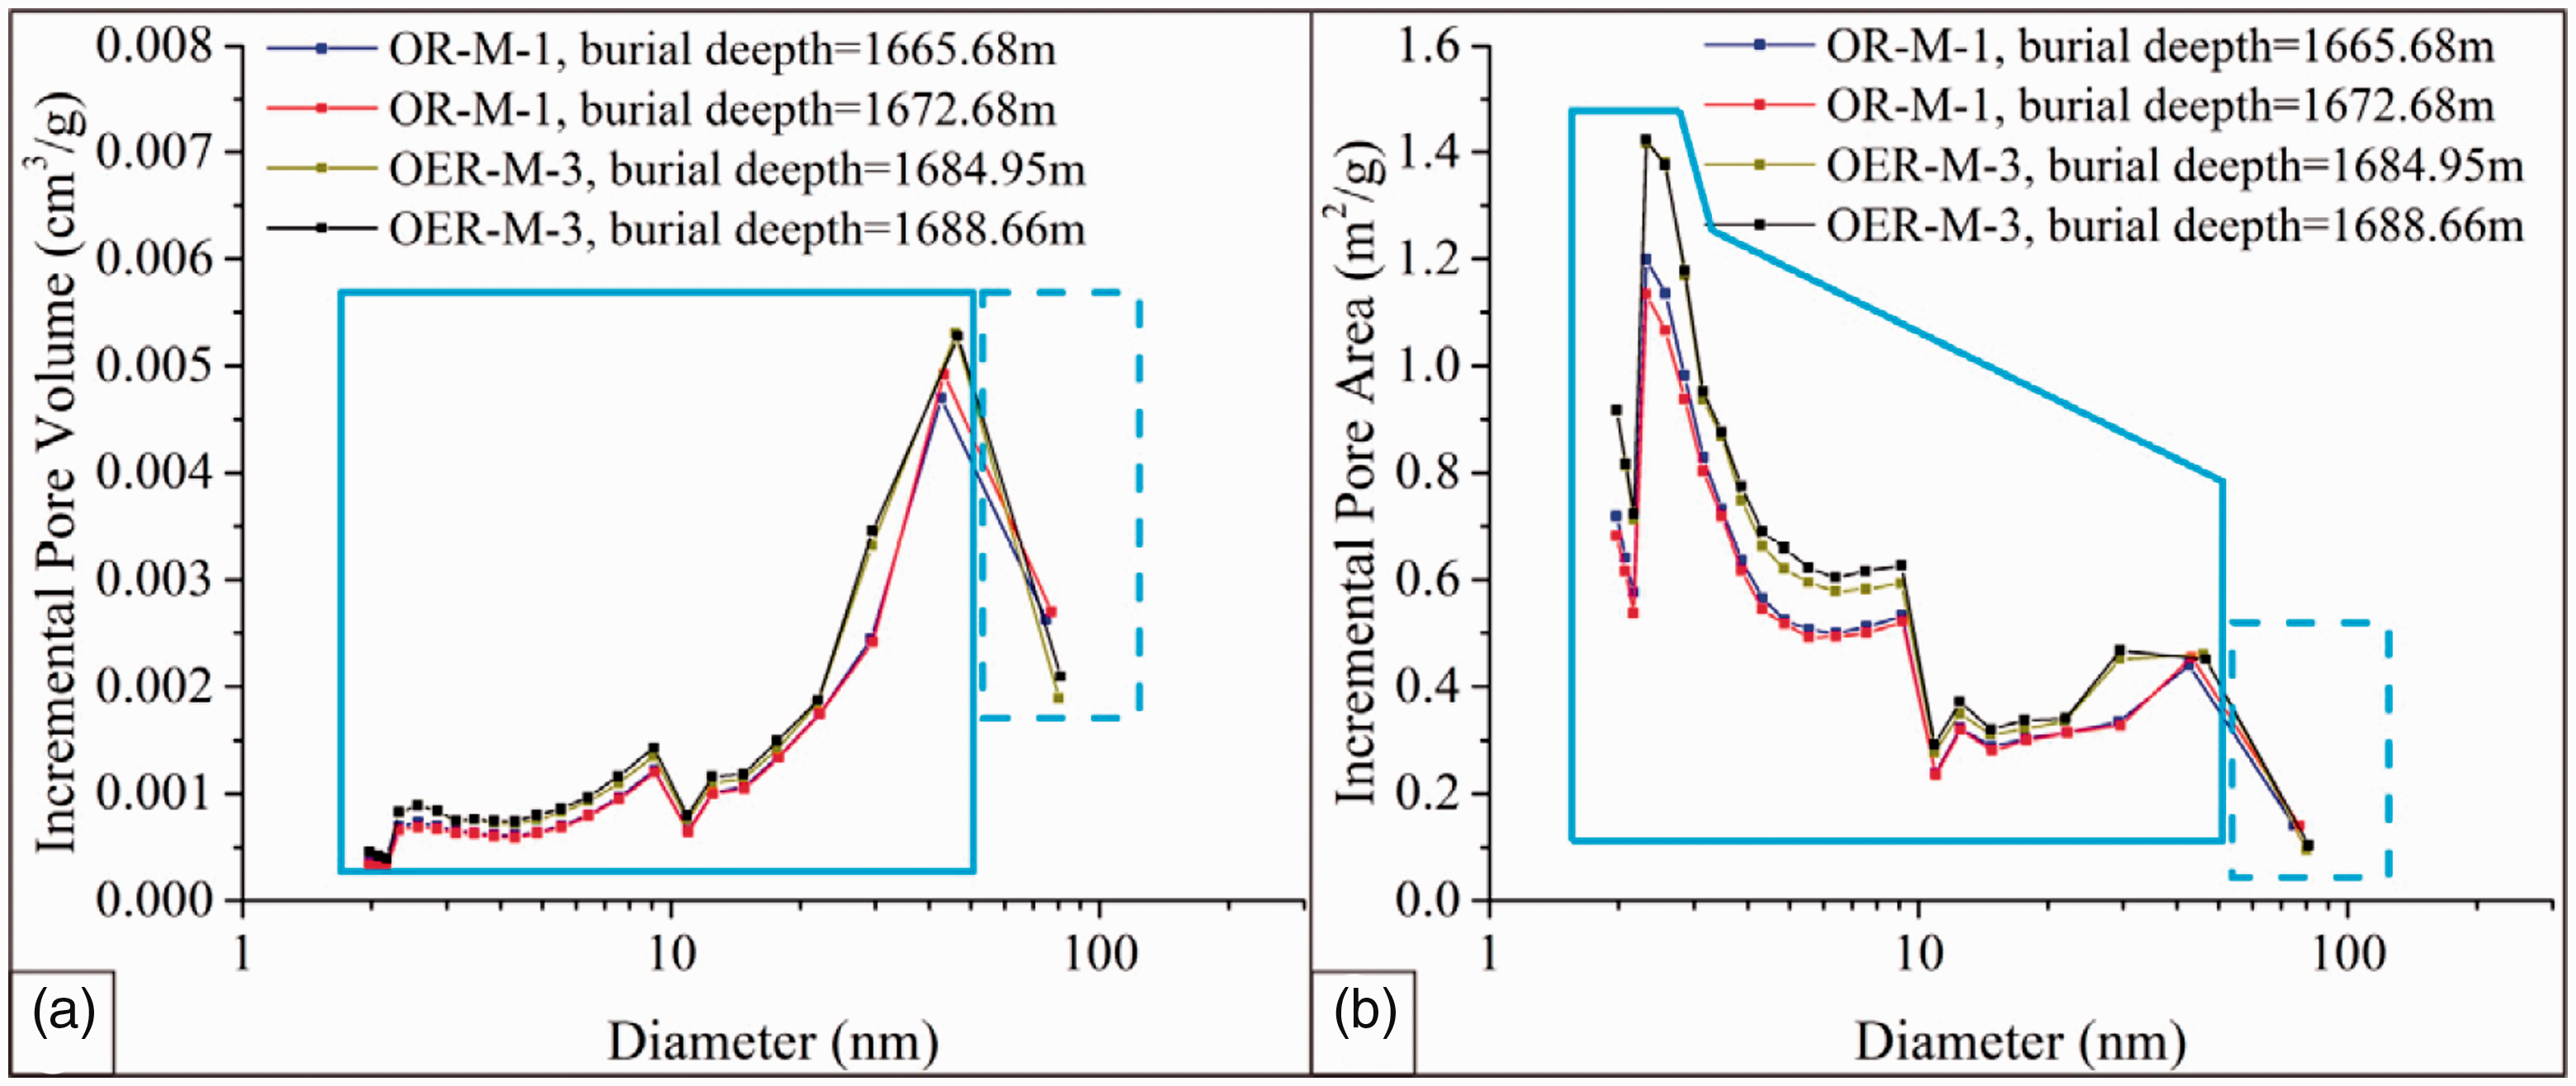
Incremental pore volume (a) and incremental pore area (b) of different MLS buried in different burial depths.
Comparative analysis of PSD between different MLS
Micro-pore volume (area) and meso-pore volume (area) of OER-M-3, respectively, were greater than those of OR-M-1 (Figures 11 and 12). These phenomena could be attributed to that the OM pore proportion of the former was greater than that of the latter, as discussed in the “OM pores” section, considering that OM may play a dominant role in the whole pore development of shale (Ji et al., 2017). The macro-pore (50 − 100 nm in diameter) volumes (areas) of OER-M-3 were lower than those of OR-M-1 (Figure 12(a) and (b)). This was because the clay content of OER-M-3 was lower than that of OR-M-1, considering that clay minerals primarily provided spaces manifested as macro-pores (Ji et al., 2017), suggesting that IntraP and InterP macro-pores of OR-M-1 associated with clay aggregates were more developed than those of OER-M-3 associated with OM as well as carbonate minerals.
Shale is regarded as a kind of unconventional natural gas reservoir with mixed typed wettability, according to Hu et al. (2018) and Yang et al. (2019). Previous researches reported that mineralogical variations, complex pore structures, and the OM occurrence can complicate the wettability of shale (Yang et al., 2019). Quartz of Longmaxi Fm in this research is oil wet, considering its biogenic origin (Yang et al., 2019). Clay minerals are generally characterized by strong water wettability (Makhanov et al., 2014; Singh, 2016). The strong oil-wetting behavior of shale is attributed to the occurrence of OM in shale matrixes (Yang et al., 2019). Therefore, the greater the TOC, the stronger the oil-wetting behavior, and the more complex and discontinuous is the wetting behavior in shale.
Compared with those of OR-M-1, TOC of OER-M-3 were relatively greater while clay contents were relatively lower. Hence, stronger oil-wetting behavior and weaker water wetting behavior occurred in OER-M-3, leading to that water was difficult to be saturated in OM micro-pores under water imbibition capillary. Hence T2peak values of OER-M-3 were greater than those of OR-M-1, and the left T2 spectrum seemed to move to the right as burial depth increased (Figure 11). In spite of this, the signal amplitudes of the centrifuged left T2 spectrum of OER-M-3 were greater than those of OR-M-1, indicating that the differences of micro-pore volume between OER-M-3 and OR-M-1 were greater than what we have observed in Figure 11. More water was driven into smaller micro-pores of OER-M-3 during the centrifugation process, compared with those of OR-M-1 (Figure 11(a-1) to (d-1)). This was because centrifugation force can overcome the water invasion resistance originated from oil-wetting OM micro-pore surface. Hence water was more difficult to be discharged out of the OER-M-3, compared with that of OR-M-1, and T2c of OER-M-3 was greater than that of OR-M-1.
Pore structural complexities of different MLS
Fractal characters derived from LF-NMR
The fractal dimensions calculation using LF-NMR data can be performed using the following equation (Zhou and Kang, 2016; Zhou et al., 2016)

The relationship between lg(T2) and lg(V) is demonstrated in Figure 13. The two distinct linear segments are presented around T2c, representing adsorption fractal dimension (DNMRA) and seepage fractal dimension (DNMRS), respectively. The fractal dimension of these two segments can be calculated by (3−A), where A is the slope of each segment. In general, the fractal dimension D varies from 2 for a perfectly regular smooth pore system to 3 for a highly complex pore system (Li et al., 2016). The greater D, the more complex is the pore structure. We also calculated the adsorption fractal dimension based on the centrifugation T2 curve (DNMRA-C), considering that some water was driven into smaller micro-pores under centrifugation force. Thus, DNMRA-C can represent the relative smaller micro-pores’ structural complexity, compared with DNMRA. It can be found from Figures 13 and 14 that DNMRA of OER-M-3 were lower than those of OR-M-1, while DNMRA-C of OER-M-3 were greater than those of OR-M-1.
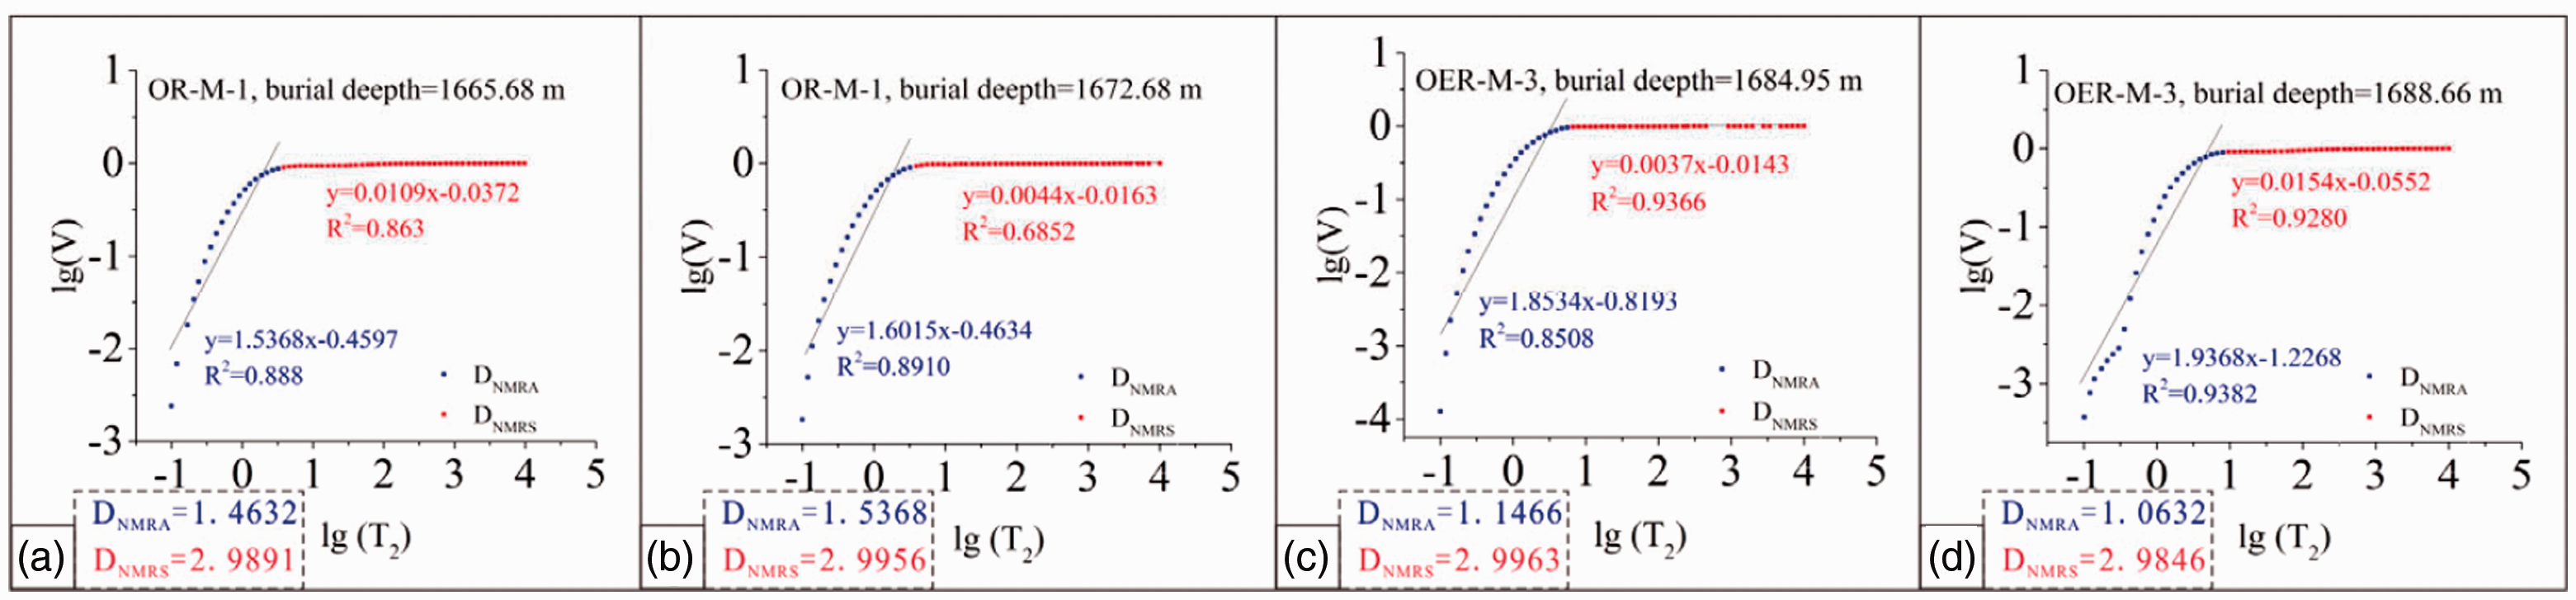
Fractal calculation results from lg(T2) versus lg(V) of LF-NMR data after water saturation for OR-M-1 (a, b) and OER-M-3 (c, d).
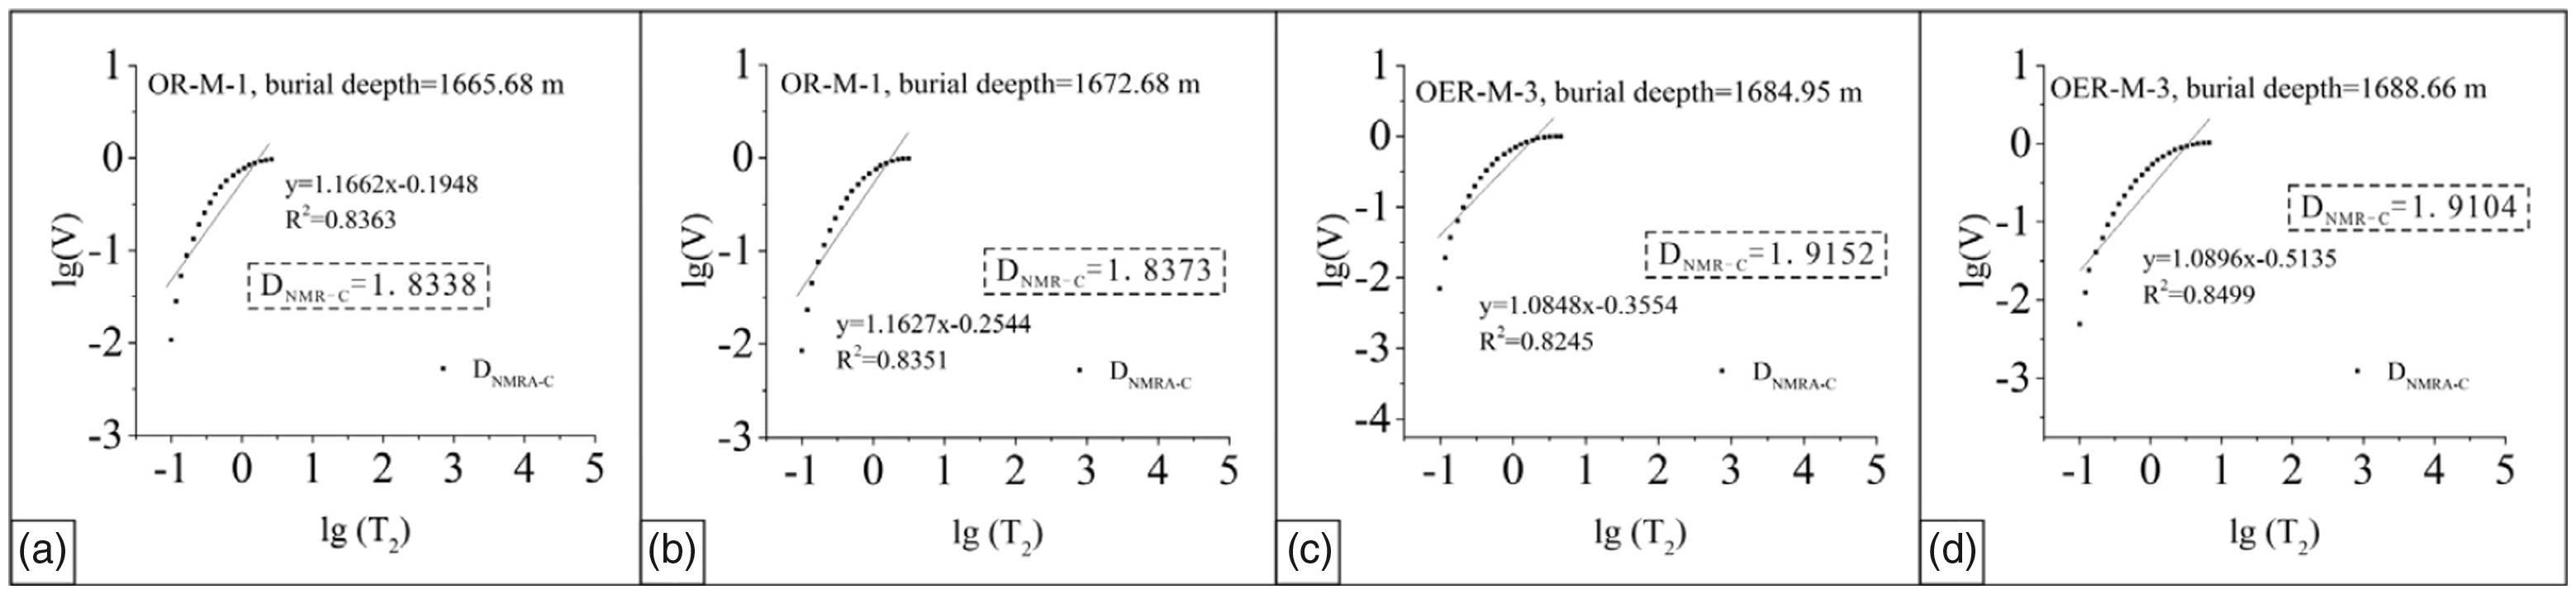
Fractal calculation results from lg(T2) versus lg(V) of LF-NMR data after centrifugation for OR-M-1 (a, b) and OER-M-3 (c, d).
Fractal characters derived from LTN2A
The fractal dimensions calculation using LTN2A data can be performed using the Frenkel-Halsey-Hill (FHH) model, which focuses on the capillary condensation region of the fractal surface and has been proven to be the most effective method (Liu et al., 2017; Yao et al., 2008). Namely


The nitrogen adsorption isotherm curve can be separated into two segments (Figure 15). D1 can reflect the fractal behavior of relatively bigger pores where capillary condensation of gas clumps occurs (0.45<P/P0<1), while D2 represents the fractal behavior of relatively smaller pores where mono–multilayer adsorption happens (0<P/P0<0.45) (Liu et al., 2017). D1 and D2 can be calculated by equations (5) and (6), respectively.
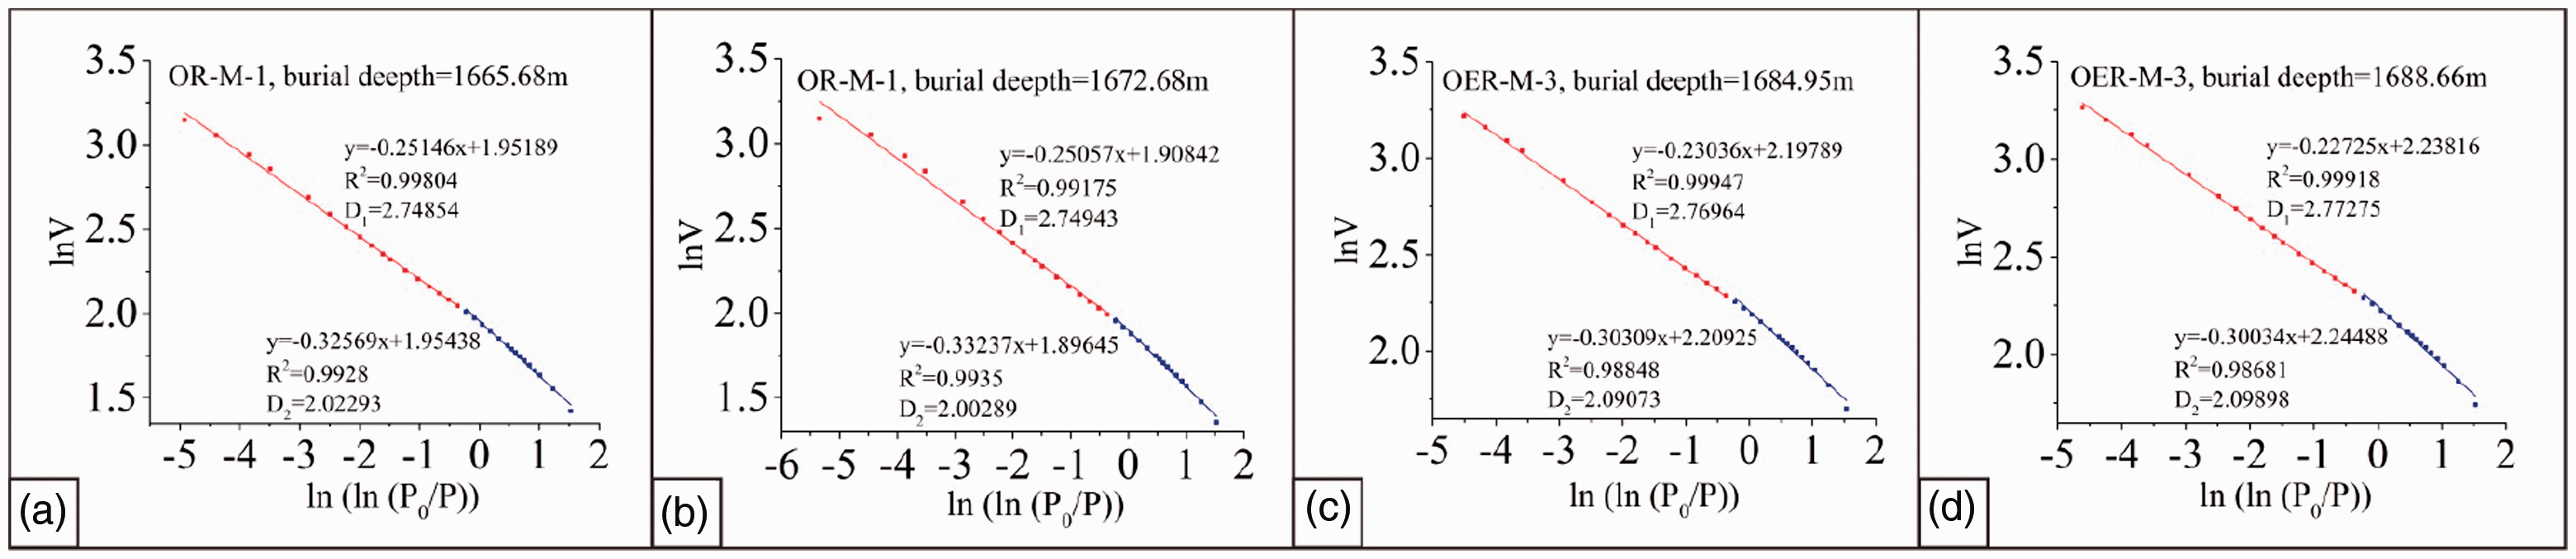
(a, b) Fractal analysis of OR-M-1 samples with different burial depth; (c, d) fractal analysis of OER-M-3 samples with different burial depth.
In our study we found that D1 values of both OR-M-1 and OER-M-3 were greater than those of D2, which is consistent with previous studies (Liu et al., 2017; Shao et al., 2017), indicating that the complexities of the meso-pore structures of MLS were greater than those of the meso-pore surfaces. Meanwhile, D1 and D2 of OER-M-3, respectively, were slightly greater than those of OR-M-1 (Figure 15), suggesting that the pore surficial and structural complexities of OER-M-3 were greater than those of OR-M-1.
Pore open degree of different MLS
The N2 adsorption–desorption isotherms of both OR-M-1 and OER-M-3 belonged to the IV isotherm, based on International Union of Pure and Applied Chemistry (IUPAC) classification (Gregg and Sing, 1982). When P/P0<0.45, the amount of adsorbed gas was low and increased slowly, while when P/P0>0.9, the adsorbed amount increased steeply (Figure 16). This phenomenon indicated that both OR-M-1 and OER-M-3 were dominated by micro-pores and meso-pores, with few macro-pores. It can also be observed that the desorption hysteresis loops of OER-M-3 were greater than those of OR-M-1 (Figure 16), suggesting that the open degree of the former was better than the latter, due to that OR-M-1 shales with more clay may be easier to be compressed during the diagenesis process. The decreased degree of desorption inflexions of OER-M-3 were steeper than those of OR-M-1, reflecting that the former developed more ink-bottle pores with a relatively greater pore throat ratio, compared with the latter. This phenomenon could be illustrated by that the diameter differences between IntraP and OM pores of OER-M-3 (Figure 7(g) and (h)) were greater than those between InterP and IntraP of OR-M-1(Figure 7(d)).
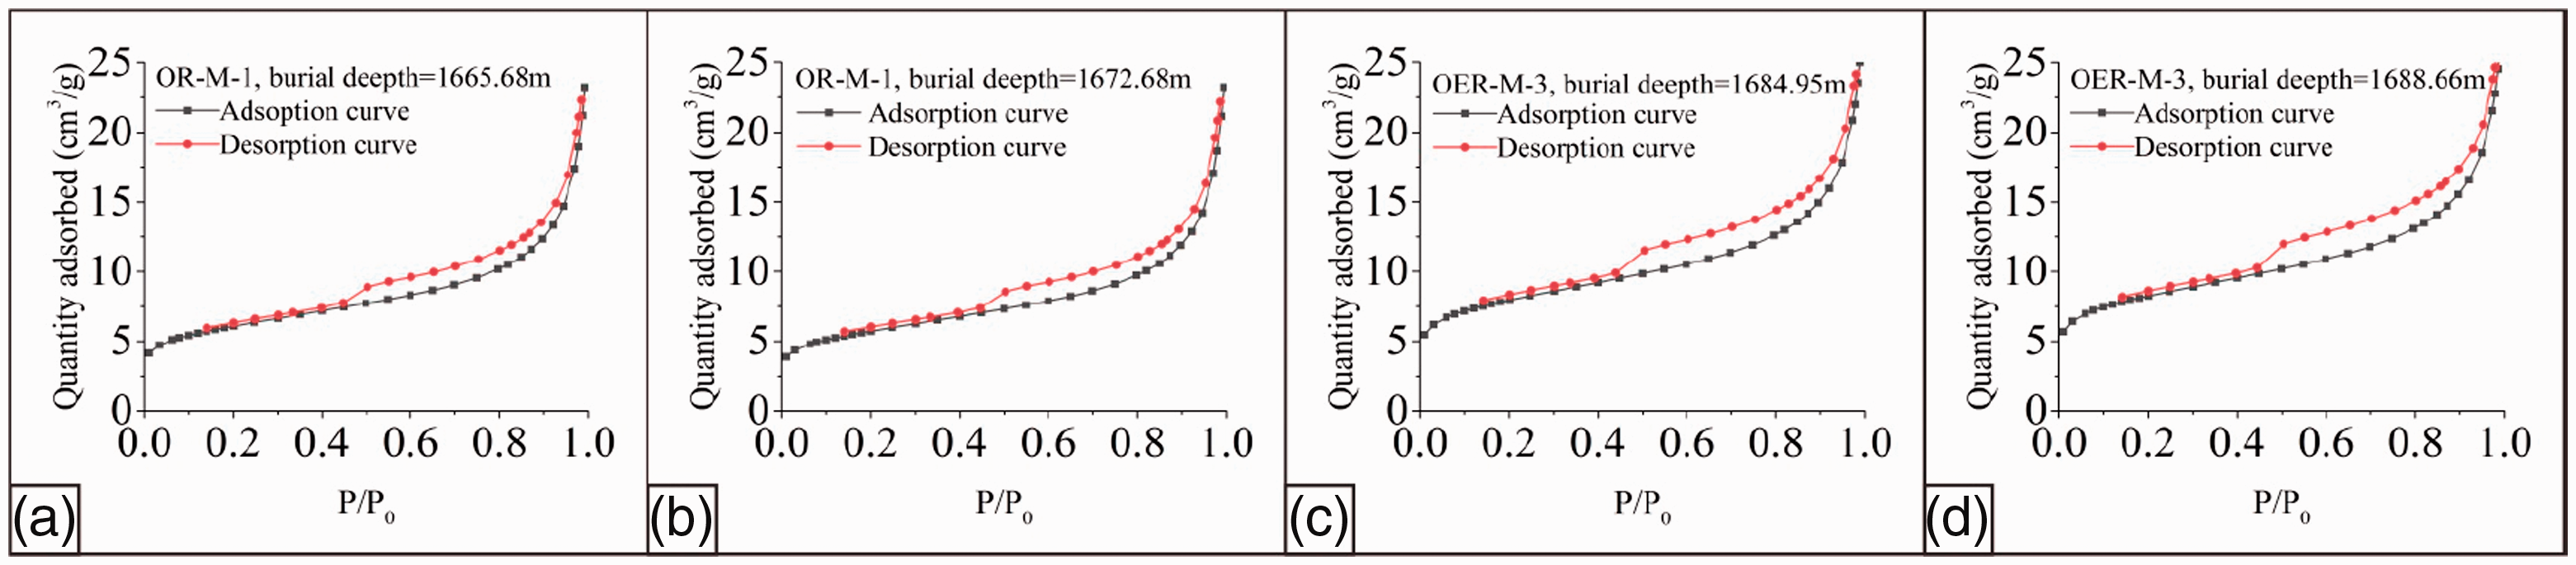
N2 adsorption–desorption isotherms of OR-M-1 (a, b) and OER-M-3 (c, d).
Conclusions
In this study, a new lithofacies classification method combining mineral and TOC was proposed, based on which the MLS of Longmaxi Fm (L1) in the DM Block, located in the Southern Sichuan Basin of China, were studied. Brief conclusions were summarized:
Shales in L11 were classified as OR-M-1, and those in L12 are classified as OER-M-3. The occurrence state of OM pores, InterP, and IntraP between OR-M-1 and OER-M-3 was different because of the components differences between these two. OR-M-1 were formed in a dysoxic–oxic seawater, while OER-M-3 were primarily formed in an anoxic waterbody. OER-M-3 and OR-M-1 were characterized with high paleo-productivity. Terrigenous detrital influx intensity during the depositing periods of OR-M-1 was stronger than that of OER-M-3. Micro-pore and meso-pore volumes of OER-M-3 were greater than those of OR-M-1; macro-pore volume of OER-M-3 was lower than that of OR-M-1; micro-pore of OER-M-3 was more complicated in wettability, compared with that of OR-M-1. Meso-pore surficial and structural complexities of OER-M-3 were greater than those of OR-M-1. The open degree of OER-M-3 is better than OR-M-1. OER-M-3 developed more ink-bottle pores with a relatively greater pore throat ratio, compared with OR-M-1. The inherent relationships between lithofacies type and sedimentary environment, TOC, as well as pore characters, respectively, were quite close.
Footnotes
Acknowledgements
The authors are grateful to the reviewers for their careful reviews and detailed comments.
Declaration of conflicting interests
The author(s) declared no potential conflicts of interest with respect to the research, authorship, and/or publication of this article.
Funding
The author(s) disclosed receipt of the following financial support for the research, authorship, and/or publication of this article: The authors sincerely thank the fund provided by National Science and Technology Major Project of the Ministry of Science and Technology of China (2017ZX05063-002–008) and National Natural Science Foundation of China (4166020100).