
Abstract
This article expands the scope of comparative social stratification research in education to rapidly developing, largely low-income sub-Saharan Africa. First, we investigate trends in the association between parental socioeconomic status (SES) and children’s chances to attend and complete primary education, exploring whether and where educational expansion of the early twenty-first century led to equalization of educational opportunities. Drawing on data from 153 Demographic and Health Surveys and Multiple Indicator Cluster Surveys (1990–2017) from 40 countries, findings indicate that inequality in attendance declined, but inequality in completing six grades largely persisted. Cross-country analyses reveal a large variation in inequality levels and trends. We explore the role of national contextual factors and find that underweight prevalence, fertility rates, school fees, public spending on education, and the ratio of pupils to teaching staff systematically explain variation in SES gaps across countries and cohorts. Findings underline the importance of absolute material deprivation and school teaching resources in the stratification of educational opportunities in this region.
Keywords
Trends and country differences in intergenerational educational inequality (IEI) and their national contextual explanations have been studied extensively, albeit with limited geographic scope and focusing mainly on cohorts born in the second half of the twentieth century in industrialized and transition economies (Barone and Ruggera 2018; Breen et al. 2009; Torche 2010). Fostered by vigorous policy debate and large national and international investments, a remarkable educational expansion has recently occurred in low-income countries, including those in Africa (UNESCO 2015). Little is known, however, about the consequences of this expansion for inequality determined by social background and the role of national contextual characteristics in explaining cross-country and over-time differences. In this article, we aim to fill these gaps by analyzing trends and variation in inequality in children’s chances to attend and complete basic education according to parental socioeconomic status (SES) for cohorts born over the past four decades in sub-Saharan Africa.
A dominant theory for explaining trends in IEI in the 1990s was that inequality tends to persist due to enduring relative differences in cognitive development, family resources, and motivation to avoid downward mobility (Becker 2003; Blossfeld and Shavit 1993; Breen and Goldthorpe 1997). In recent years, this paradigm has shifted, acknowledging that inequality can change under certain conditions. A large body of literature has investigated whether and which variations in social environments explain differences in social stratification of children’s educational opportunities. The most widely discussed national contextual factors include living conditions that affect children’s physical and mental development and educational institutions that determine costs of schooling and student sorting by school type and quality (Ballarino et al. 2009; Breen et al. 2009; Gruijters and Behrman 2020).
Previous research on trends and contextual explanations of IEI has generated mixed findings and is far from conclusive, indicating the direction of change (if any) is context- and cohort-specific. In highly advanced Western economies, the influence of parental SES on children’s educational opportunities declined for cohorts born in the post-World War II period, especially at lower levels of education (Ballarino et al. 2009; Barone and Ruggera 2018; Breen et al. 2009). During this period, most Western societies experienced economic and political stability, welfare state expansion, and unprecedented improvements in living conditions, limiting generalizability of the proposed explanations mainly to highly advanced economies. Some of the research in middle-income and transition economies where public safety nets are weaker suggests educational inequality has increased, especially at higher levels of education (Torche 2010). In low- and lower-middle-income countries where welfare states are underdeveloped and school enrollments are considerably lower, comparative sociological research on IEI is scarce. Some notable exceptions include Gruijters and Behrman (2020), who study individual- and school-level factors driving inequality in scholastic achievement in Francophone Africa, and Chmielewski (2019), who studies trends and contextual drivers globally, albeit with a small coverage of low-income countries. In studying intergenerational educational mobility in African countries, economists have found a persisting correlation in parent-child educational attainment, implying no change in absolute mobility since the 1960s (Alesina et al. 2019; Azomahou and Yitbarek 2016). These studies capture cohorts born before the educational expansion of the early twenty-first century. Consequently, we know very little about recent trends and contextual drivers of educational inequality in less developed regions in the world, where educational expansion is a recent phenomenon and societies have their own unique contextual specificities.
In this article, we make several contributions to inequality research in Africa and to social stratification research more broadly. First, we expand the geographic and contextual scope of sociological social stratification research to rapidly developing but still largely low-income, sub-Saharan Africa (SSA). This case selection allows us to study trends and country differences in IEI by social background in societies of historically low educational attainment and diverging macroeconomic and societal development. Second, we study cohorts born between 1974 and 2003, providing key insights to policy debates on the effectiveness of recent mass educational expansion in Africa to reduce socioeconomic inequalities. As we describe in more detail, net primary school enrollment rates in SSA stagnated at around 54 percent, on average, in the 1980s and 1990s but increased thereafter, reaching almost 80 percent by 2015, varying by country (United Nations 2015). Third, we explore the role of the national context in explaining variation in IEI between countries and cohorts. To our knowledge, no comparative sociological research on trends in IEI and its determinants has been carried out in low-income countries undergoing recent educational expansion.
The analyses draw on individual-level household data from 153 Demographic and Health Surveys (DHSs) and Multiple Indicator Cluster Surveys (MICSs) in 40 countries between 1990 and 2017 in combination with national-level data retrieved from various international sources. We focus on IEI by parental SES in attendance and completion of primary education because, in the context of Africa, primary school attainment is far from universal and is socially stratified. SSA has the lowest primary school completion rates in the world, with a weighted average of 65 percent in 2018 and only about 30 percent among the poorest quintile (UNESCO 2023). Our findings reveal that inequality by SES in attending primary school declined, but inequality in completing six or more grades largely persisted. We find that variation in IEI across countries and cohorts is systematically explained by national characteristics related to material deprivation, fertility, school fees, public investments in education, and teaching staff.
Educational Expansion In Sub-Saharan Africa
Sub-Saharan Africa’s path to educational expansion has been slow, and until the past decade, it lagged behind other regions in the world. In the 1960s and 1970s, many of the countries that had recently gained independence from colonial dominance committed to improving access to education, but the educational sector was underfunded, and international organizations and high-income countries failed to provide any substantial financial support (Mundy and Manion 2015). Until the mid-1980s, net primary school enrollment in the region was low and increased only marginally, reaching 58 percent in 1984 (World Bank 2020; see Figure 1). Gross primary completion rates followed the same pattern. Between 1985 and 1990, enrollment and completion rates declined, and they continued to stagnate throughout the 1990s. These disappointing trends have been attributed to prolonged economic recession and structural adjustment programs (Reimers 1994).
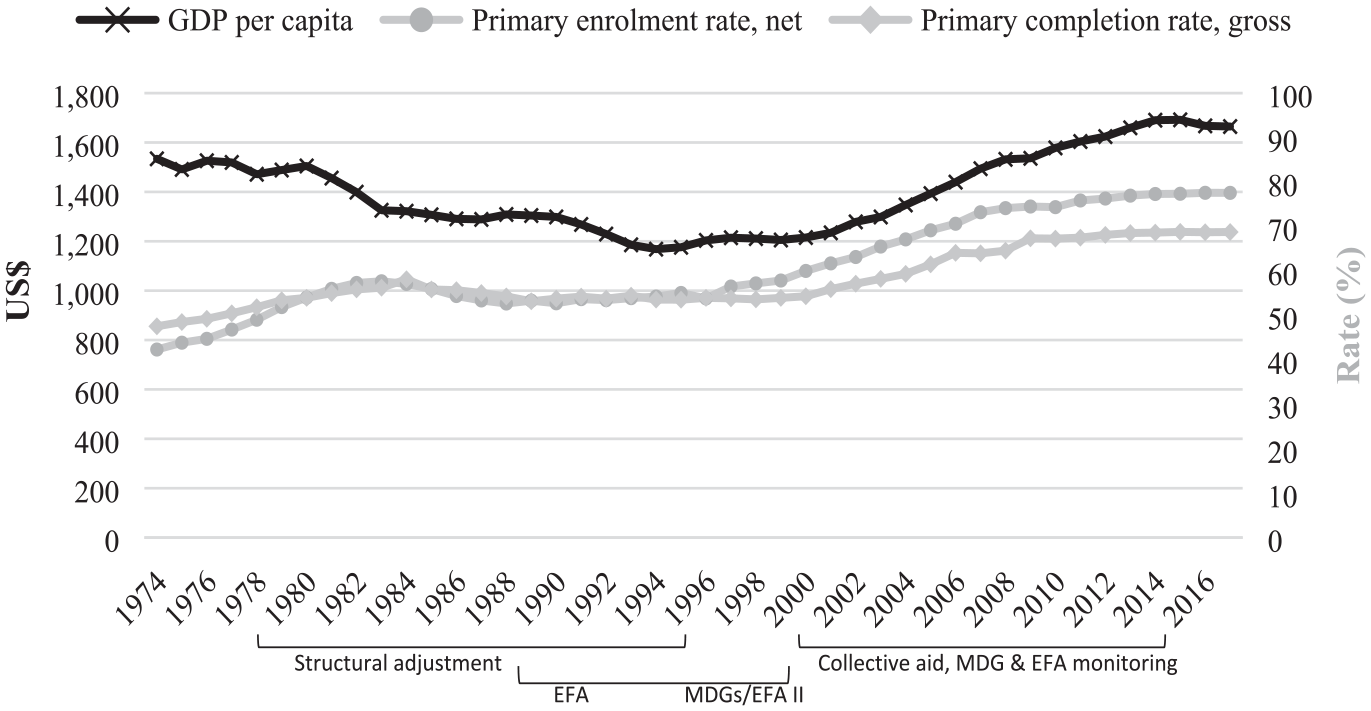
Economic development and educational expansion in sub-Saharan Africa, 1974 to 2017.
The turn of the millennium marked significant changes in Africa’s education sector. Between 2000 and 2015, most SSA countries experienced sustained economic growth, with yearly gross domestic product (GDP) growth rates exceeding 5 percent. This period coincided with an intensified push from the international community to universalize primary school enrollments, as indicated by the Millennium Development Goal agenda and the Education for All (EFA) initiative (Mundy and Manion 2015; United Nations 2015). About one third of all SSA countries abolished primary school fees to increase enrollments (UNESCO 2015). Average public spending on education increased, although in many cases, this increase was outpaced by educational expansion, leading to classroom overcrowding and a lack of trained teachers (UNESCO UIS 2011). During this period, many African countries made remarkable progress as net primary school enrollments increased from 54 percent to 77 percent, on average, between 1996 and 2015 (United Nations 2015).
The overall positive trends mask large cross-country variations. For instance, Ghana, Ethiopia, and Lesotho abolished school fees and mobilized to attract local funding and external aid to invest in rapid enrollment growth (UNESCO UIS 2011). In Ghana, net primary enrollment rates increased from 59 percent to 84 percent between 1999 and 2018; in Ethiopia, enrollment rates increased from around 30 percent to 78 percent between the late 1980s and 2012; and in Lesotho, enrollments reached an almost universal level by 2018 (World Bank 2020). Other countries were not as successful: In the Central African Republic, Congo, and Nigeria, enrollment rates stagnated throughout the 1990s and 2000s. Primary school completion rates also vary considerably (UNESCO 2023). Whether educational expansion led to an equalization of children’s educational opportunities and how different contextual factors might have shaped this process remain empirical questions. Due to high heterogeneity in the speed of educational expansion and contextual circumstances among SSA countries, cross-country variation in levels and trends of IEI is to be expected.
Theoretical and Conceptual Framework
Until the early 2000s, persistent inequality was the dominant theoretical framework in sociology concerning inequality of educational opportunity (Blossfeld and Shavit 1993). According to this paradigm, educational inequality persists due to differences in perceived costs and benefits of education and differences in the probability of success for socioeconomically advantaged versus disadvantaged groups (Becker 2003; Breen and Goldthorpe 1997; Erikson and Jonsson 1996).
This framework has its roots in Boudon’s (1974) theory of primary and secondary effects of social origin. Primary effects refer to the effects of social origins on children’s school performance that, in turn, affects their educational attainment. Secondary effects are differences in the educational choices families make after accounting for scholastic performance. The core assumption of Boudon’s (1974) model is that educational choices are driven by the ambition to avoid downward social mobility. The argument is that higher SES students have a stronger motivation to achieve a higher level of education compared to low-SES students’ motivation to avoid the risk of downward mobility. Based on this argument, the maximally maintained inequality (MMI) hypothesis posits that inequality in attainment of a given educational level declines only when attainment among children from the more advantaged social groups is close to being saturated (Raftery and Hout 1993).
In more recent years, emphasis has shifted to the contextual and institutional factors that can alter the general tendency toward inequality persistence and that can explain cross-country differences in educational inequality (Ballarino et al. 2009; Breen et al. 2009; Chmielewski 2019; Gruijters and Behrman 2020). This research points to a number of contextual factors that determine the strength of the relationship between family SES and educational attainment, affecting the primary and secondary effects of social origin. Redistributive welfare state policies, parental employment security, and demographic developments can alter disparities in disposable household resources and living conditions between social groups and thus alter differences in children’s school performance (primary effects) and perceived educational costs and benefits (secondary effects) between higher and lower SES families (Ballarino et al. 2009; Barone and Ruggera 2018; Breen et al. 2009; Erikson and Jonsson 1996). Changes in school selectivity and other school characteristics, such as physical resources, school fees, teaching practices, and school governance, can affect how pupils are stratified within educational systems by school type and learning quality and thus affect differences in school performance and parental decision-making regarding educational choices (Bhalotra, Harttgen, and Klasen 2015; Breen et al. 2009; Chmielewski 2019; Erikson and Jonsson 1996; Foster 1980; Gruijters and Behrman 2020).
Based on this theoretical framework and given the context of Africa, we develop and test a conceptual framework that examines the role of four national contextual factors predicted to explain variation in IEI across countries and cohorts: (1) material deprivation, (2) demographic developments, (3) school fees, and (4) public investments in school and teaching resources. In line with the theoretical framework, these factors are expected to shape IEI through the primary effects of social origin, affecting children’s physical and cognitive development and thus their school performance and grade progression, and through secondary effects, determining families’ disposable resources and perceived educational costs and benefits and thus their decisions to complete a given educational level or to drop out. These contextual factors are expected to play an important role in social stratification in primary education in SSA. Overall, despite substantial cross-country and over-time variation, the region is characterized by high levels of extreme poverty and deprivation among children (de Milliano and Plavgo 2018; Gordon et al. 2003), fertility rates considerably above replacement level (World Bank 2020), persisting school tuition fees (Harding and Stasavage 2013; Tomasevski 2006), and poor school resources and shortage of teachers (Tomasevski 2006; UNESCO UIS 2011).
Material Deprivation
Unequal living conditions are commonly regarded as an important mechanism behind educational stratification because such conditions shape differences in children’s development and lead to differentials in cognitive ability (Cunha and Heckman 2007). The effect of family SES on educational attainment via health and physical and mental well-being is theorized to be particularly relevant for low-income contexts due to widespread absolute poverty, malnutrition, and illness (Gruijters and Behrman 2020:261). In such contexts, living conditions are commonly considered in absolute terms because extreme poverty and deprivation of basic goods and services to sustain life, such as nutrition, water, and health care, are widespread and overlap (de Milliano and Plavgo 2018; Gordon et al. 2003). Improvements in living conditions and related health and nutritional outcomes are theorized to reduce socioeconomic disparities in educational attainment by closing the gap in school performance (Breen et al. 2009:1479; Erikson and Jonsson 1996).
Recent developments in SSA point to moderate improvements in living conditions. Examples include a decline of underweight prevalence from 30 percent to 18 percent and a decline of under-five mortality from 181 to 76 deaths per 1,000 live births between 1990 and 2015 (United Nations 2015). Nevertheless, absolute poverty is still common, with children overrepresented in the poorer segments of society and experiencing multiple deprivations simultaneously (de Milliano and Plavgo 2018; Gordon et al. 2003). We also know that material deprivation affects children’s health outcomes and their educational attainment and that risk of experiencing material deprivation is higher in lower educated households (Fink and Rockers 2014; KNBS and UNICEF 2017). We can thus expect that variation in the incidence of material deprivation explains variation in educational inequality across countries:
Hypothesis 1: The lower the prevalence of material deprivation in a country, the lower the IEI by parental SES will be.
Demographic Developments
Fertility rates affect the amount of family resources available for consumption of goods and services, such as housing and schooling. Empirical research in Africa shows that lower fertility rates and better family planning are associated with higher school enrollments (Lloyd, Kaufman, and Hewett 2000; Longwe and Smits 2012). Because poorer families spend a higher share of disposable household resources on consumption of basic goods and services, changes in birth rates may be particularly consequential for the demand for education among poorer families, thus altering inequality of educational opportunity by social background (Breen et al. 2009:1479; Erikson and Jonsson 1996).
Sub-Saharan African countries are characterized by high national fertility levels. However, there is some evidence of declining fertility in several countries, starting from the late 1980s (Caldwell, Orubuloye, and Caldwell 1992). Between 1990 and 2016, fertility rates in SSA decreased from 6.4 to 4.8 births per woman, on average (World Bank 2020). Fertility transition remains slow due to persistently high levels of desired ideal family size and the unmet need for contraception (Bongaarts and Casterline 2013). In countries where fertility rates declined, we can expect the pressure on household disposable resources declined, opening space for more demand for education, especially for lower SES families:
Hypothesis 2: The lower the national fertility rate, the lower the IEI will be.
School Fees
Schooling costs are among the most widely identified factors affecting social background differences in children’s educational opportunities. Lowering school fees can have an equalizing effect on socioeconomic disparities in education (Bhalotra et al. 2015; Breen et al. 2009:1479).
In Africa, primary school tuition fees and other school-related costs pose a financial barrier to accessing and remaining in education (Tomasevski 2006; World Bank and UNICEF 2009). About one third of sub-Saharan African countries officially abolished primary school fees in the late 1990s and 2000s (UNESCO 2015). Lifting this financial barrier likely somewhat equalized children’s chances to access and complete basic education for cohorts in countries where school fees were removed:
Hypothesis 3: School fee abolition leads to a decline in IEI.
Public Investments in Education and Teaching Resources
School quality is theorized to be especially important for inequality of educational opportunities in low-income countries (Heyneman and Loxley 1983). Recent research studying scholastic achievement inequality in 10 francophone African countries finds that access to quality school resources is socially stratified and that most of the family background effect on learning outcomes is explained by differences in school quality (Gruijters and Behrman 2020). In many sub-Saharan African countries, recent educational expansion was not accompanied with a proportional increase of spending on education, leading to a lack of school materials and a shortage of trained teachers (UNESCO UIS 2011; World Bank and UNICEF 2009). Lack of school resources and classroom overcrowding can have negative effects on teaching and learning outcomes and diminish parental demand for primary education (Bennell 2002). Conversely, public investments in education and teaching resources should improve learning outcomes and thus reduce SES inequalities in children’s educational performance (primary effect of social origin) and parents’/households’ perceived costs and benefits of schooling (secondary effect):
Hypothesis 4: In countries and cohorts where public investment in schools and teachers is higher, IEI is lower.
Methodology
Data
The empirical analyses draw on DHS and MICS data, selecting all available nationally representative cross-sectional household surveys collected between 1990 and 2017. 1 The surveys, designed to ensure cross-national comparability and implemented by national bureaus of statistics in collaboration with international partners, are carried out every three to five years and cover most SSA countries. We merged 153 surveys from 40 countries (1 to 7 surveys per country). The selected analytic sample consists of individuals ages 14 to 16, allowing observation of trends in IEI for children born between 1974 and 2003. After excluding observations missing relevant information (5 percent of the sample), 2 the final analytic sample size is 541,856 individuals.
The selection of children ages 14 to 16 as the unit of analysis is both data-driven and conceptually grounded. First, DHS and MICS surveys link children with their parents only up to age 17. To account for selection on cohabitation, recent work on intergenerational educational mobility has also restricted samples to children under age 17 (Alesina et al. 2019). Second, the definition of school completion closely follows UNESCO’s definition used for household survey data. In Africa, most children start formal education late and repeat grades, so UNESCO takes a cohort three, four, and five years above the intended age for the last grade of primary education to calculate this completion share. For countries where primary school duration is six grades, the intended age for the last grade is 11 years, and the reference age group to calculate the completion rate is 14 to 16 (UNESCO 2020).
Aggregate data for the socioeconomic, demographic, and institutional context of the analyzed countries come from World Bank (2020). Data on school fees are primarily from Harding and Stasavage (2013). All time-varying indicators are measured with a lag, expressed as an average of eight years before survey data were collected to reflect the time when children were school age. As an example, for children ages 14 to 16 surveyed in 2009, we derived time-varying macro-level indicators calculating the average between 2001 and 2008.
Individual-Level Variables
Educational attainment at primary school is operationalized using three binary indicators: primary school attendance equal to 1 if a child ever attended school and 0 otherwise, completion of lower level basic education equal to 1 if a child completed six or more grades and 0 otherwise, and completion conditional on attendance, excluding children who have never attended school. Completion of at least six years of primary school is selected for cross-country comparative purposes given that this is the official duration of primary education for the vast majority of SSA countries (UNESCO UIS 2011:22). 3
Socioeconomic background (SES) is measured by parental educational attainment, a commonly used SES measure in intergenerational educational mobility research in SSA (Alesina et al. 2019; Azomahou and Yitbarek 2016) and in social stratification research in education generally (Feinstein, Duckworth, and Sabates 2004). It is expressed as a binary variable equal to 1 if at least one of the child’s parents completed six or more years of schooling, following a dominance principle. 4 When parents’ educational attainment is unavailable, household head’s education is considered if the household head is the child’s relative. In the final sample, 40 percent of all parents or caretakers completed six or more grades. In a robustness check for the analysis of IEI trends, we used a more detailed classification of parental educational attainment with four categories. Results of this different specification confirm the findings based on a dichotomous distinction.
Birth cohorts are divided into four groups representing distinct historic periods when cohorts reached primary school age: 1974 to 1983 (economic downturn and educational contraction), 1984 to 1990 (economic stagnation and the first attempts to advance EFA), 1991 to 1997 (the initial phase of economic recovery and mobilization of the international community to reach EFA), and 1998 to 2003 (sustained economic growth and educational expansion when cohorts reached school age). The section on educational expansion provides a brief description of these periods (for more detail, see Plavgo 2021). In a sensitivity analysis, we grouped birth cohorts into half-decades: 1974 to 1979, 1980 to 1984, 1985 to 1989, 1990 to 1994, 1995 to 1999, and 2000 to 2003. The results on trends in IEI using this more detailed cohort grouping confirm those based on the four cohort groups and are presented in Appendix Figure A1. Individual-level controls include child’s gender and age.
Macro-level Variables
Material deprivation is measured using an indicator of underweight prevalence, a composite measure capturing chronic and acute malnutrition, expressed as the percentage of children under age 5 whose weight for age is more than 2 SD below the median for the international reference population (WHO 2010). In the sample, mean underweight prevalence is 22 percent.
Demographic developments are captured by fertility rates expressed as the number of children born to women of childbearing age. In the sample, the average fertility rate for school-age cohorts was 6.4 births per woman, ranging from 4.1 in Zimbabwe to 8.4 in Rwanda.
School fee abolition refers to cases where there is clear evidence that governments implemented laws or ministerial decrees abolishing tuition or parent-teacher association fees. The variable takes the value of 1 for cohorts for whom fees were abolished prior to or during primary school age and 0 otherwise. 5 Among the 40 countries analyzed, 17 abolished fees between 1994 and 2008; for the other 23 countries, school fees were still in place during the observed period (see Table 1 for sources).
Descriptive Statistics of Individual- and Macro-level Variables before Transformation.
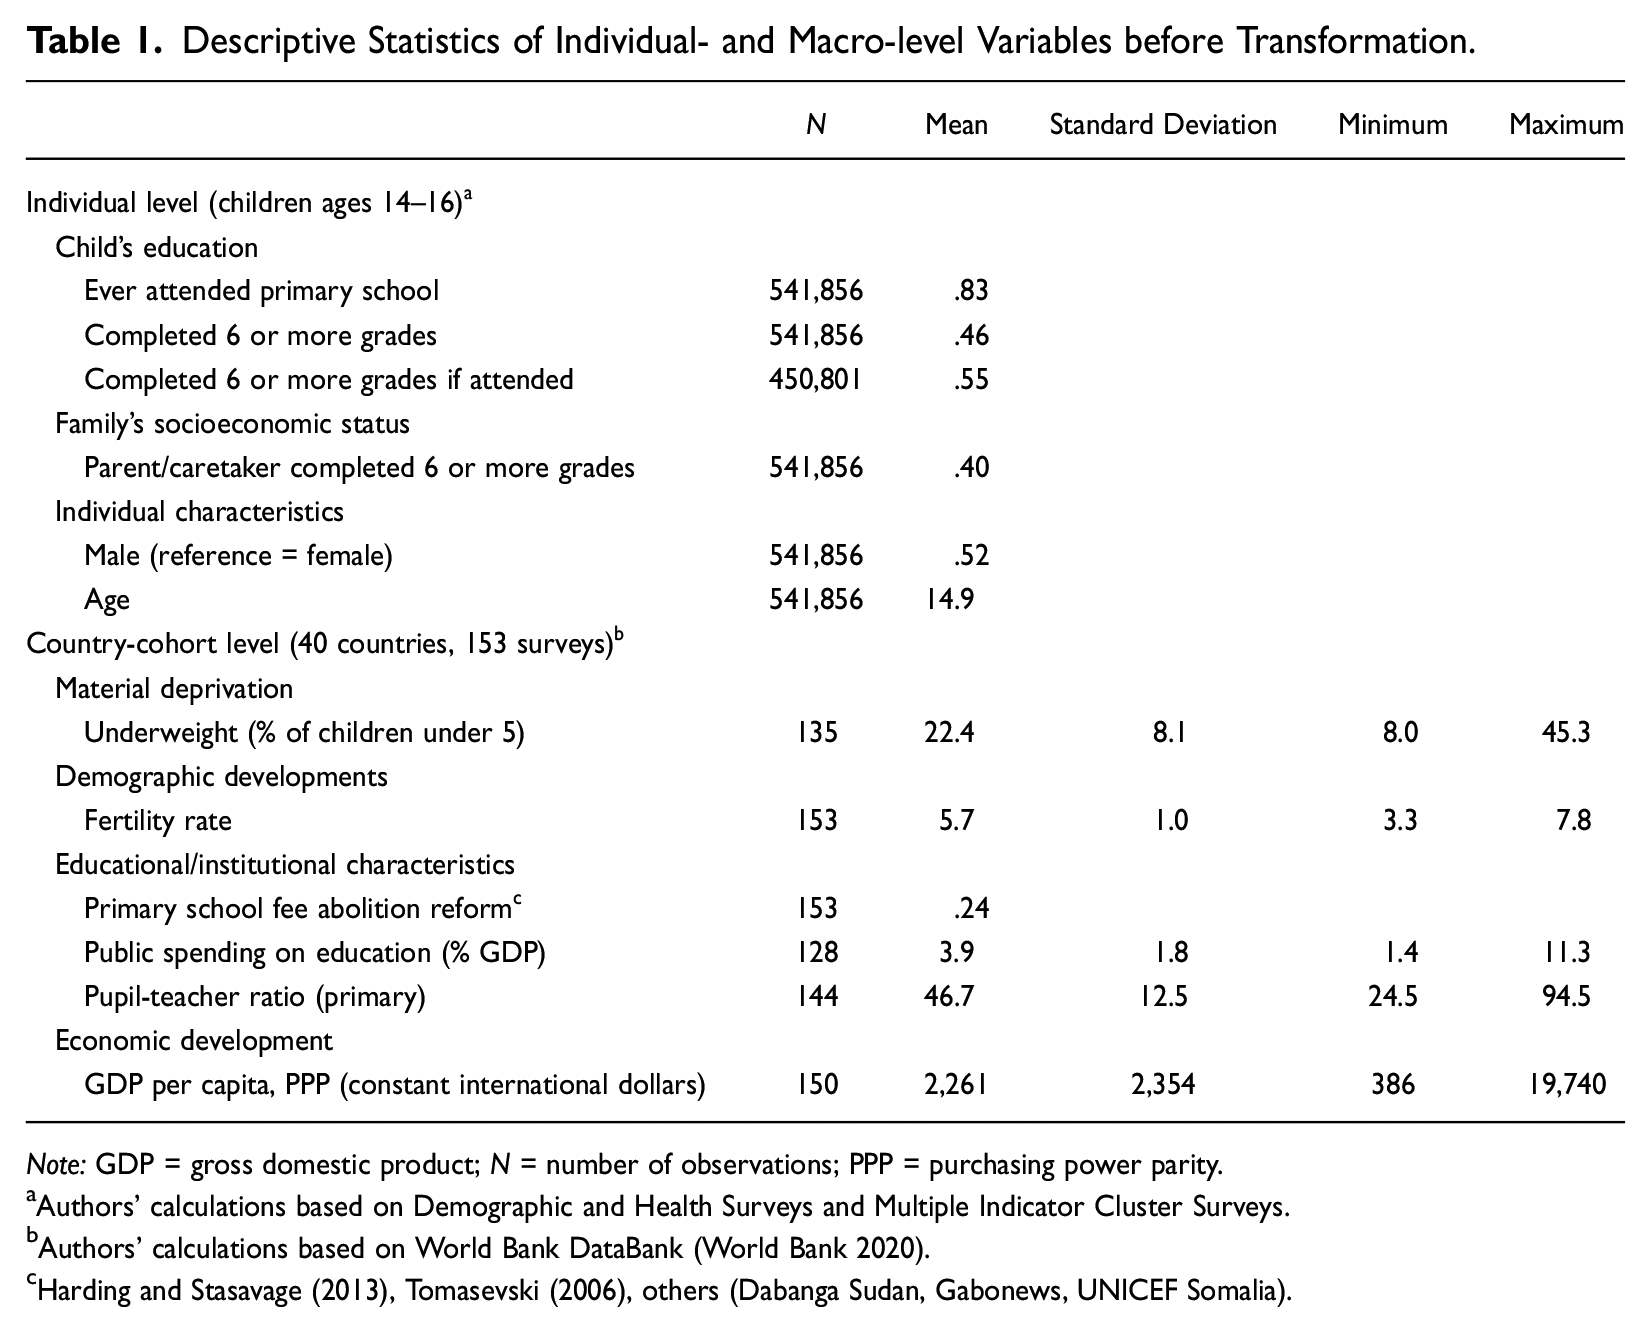
Note: GDP = gross domestic product; N = number of observations; PPP = purchasing power parity.
Authors’ calculations based on Demographic and Health Surveys and Multiple Indicator Cluster Surveys.
Authors’ calculations based on World Bank DataBank (World Bank 2020).
Harding and Stasavage (2013), Tomasevski (2006), others (Dabanga Sudan, Gabonews, UNICEF Somalia).
Public investments in school resources are assessed by indicators of public spending on education and pupil-teacher ratio in primary schools. Public spending on education is measured by the total general government expenditure on education as a percentage of GDP. In the sample, average public spending on education over eight years prior to the survey year was 3.9 percent of GDP, ranging between 1.4 percent in Zambia and 11.3 percent in Lesotho. Pupil-teacher ratio accounts for teaching resources when children were school age, expressed as the average number of pupils per teacher in primary schools. In the sample, pupil-teacher ratio was lowest in Gabon, Ghana, and Liberia (25–30 pupils per teacher) and highest in Central African Republic, Malawi, and Mali (70–100 pupils per teacher, on average).
Economic development is used as a control, measured by national GDP per capita based on purchasing power parity, expressed in constant international dollars. For regression models, GDP is transformed into its natural logarithm. In supplementary analyses, following previous literature on social mobility in Africa (e.g., Alesina et al. 2019), we used urbanization and employment in services and manufacturing as alternative indicators to capture the level of economic development. These analyses yielded similar findings and are not reported here but are available on request.
Table 1 shows descriptive statistics for all the variables at the aggregate level. Table S1 in the online Supplement provides detailed information by country and survey year on data sources, sample size, and estimated educational indicators.
Research Strategy
Educational inequality at the aggregate level: analysis of levels and trends
We study the overall levels and trends of IEI by fitting linear probability models (LPMs) using a pooled data set from 153 DHSs and MICSs from 40 countries in SSA. Given the binary nature of our dependent variables, we use an LPM because the estimation of average marginal effect is more straightforward compared to logit models (Breen, Karlson, and Holm 2018). The estimated coefficients of LPM are almost identical to the average marginal effects of a logit model, particularly when the dependent variables, as in our case, do not have extremely low or high values (Mood 2010). The LPMs are estimated using ordinary least squares (OLS) regressions with country fixed effects and cluster-robust standard errors. The model takes the following form:
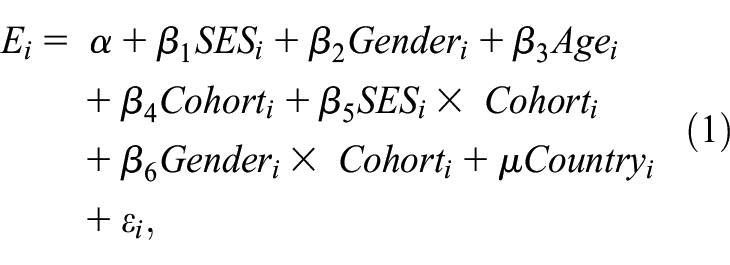
where
We performed several supplemental analyses to explore the sensitivity and robustness of the baseline estimates to weighting decisions, model specification, operationalization decisions, and sample selection. First, we performed analyses without assigning equal weights to each country-year. Second, we reestimated models as logit models extracting average marginal effects. Third, because large proportions of primary school pupils in SSA are over age for their grade (Lewin and Sabates 2012), we excluded children ages 14 to 15 to allow for delay in completion. Fourth, we restricted the sample to countries with available data for three consecutive decades; this reduces the sample to 21 countries. Fifth, to see if the estimated trends are sensitive to certain country-groups or outliers, we excluded certain country groups, such as the largest countries and country-groups located in different regions, due to potential differences in institutional forms of education.
Educational inequality at a country-year level: analysis of the role of the national context
In the second part of the empirical analyses, we study the relationship between macro-level characteristics and IEI. We use a two-stage regression approach that has been used in other social stratification research (Bernardi and Ballarino 2014; Hertel and Groh-Samberg 2019). In the first stage, we calculated inequality coefficients using individual-level data sets for each country-year cohort ck (each of the 153 surveys) with children ages 14 to 16 using an LPM:
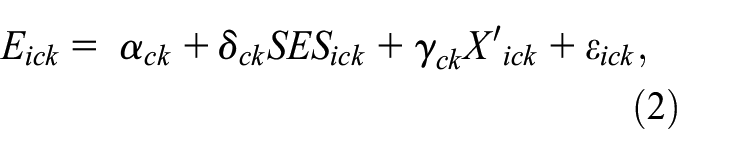
where
In the second stage, we fit pooled cross-sectional OLS regression models at the country-cohort level, regressing the estimated inequality coefficients extracted from the first stage on the different macro-level indicators:
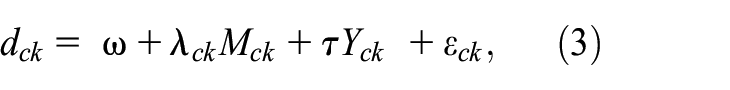
where
Correlations between inequality coefficients and each of the macro-level variables are reported in Table S2 in the online Supplement. Of 153 country-year cohorts ck, the final sample with data on all six macro-level indicators is 111 ck from 34 countries. 6
The two-stage approach generates a panel data set with inequality coefficients at the country-year level, allowing for replicability and investigation of other contextual factors beyond the analyses presented here. The full data set, including the first-stage inequality coefficients and macro indicators, is available for download in the EUI Research Data repository (Plavgo 2023). Appendix Table A1 offers an excerpt of two countries to illustrate the type of information available in the data set. The syntax of the second-stage analysis is provided in the online Supplement.
As a robustness check, we estimated multilevel models combining individual-level data from all available surveys together with macro-level data as an alternative strategy to the two-stage regression approach. Estimates of the multilevel models are highly consistent with those of the two-stage regressions and are available in Tables S3, S4, and S5 in the online Supplement.
Levels and Trends In Intergenerational Educational Inequality
This section presents estimates of levels and trends in IEI in attendance and completion of six grades of primary education by social background in SSA using pooled data from 40 countries, followed by estimates by country.
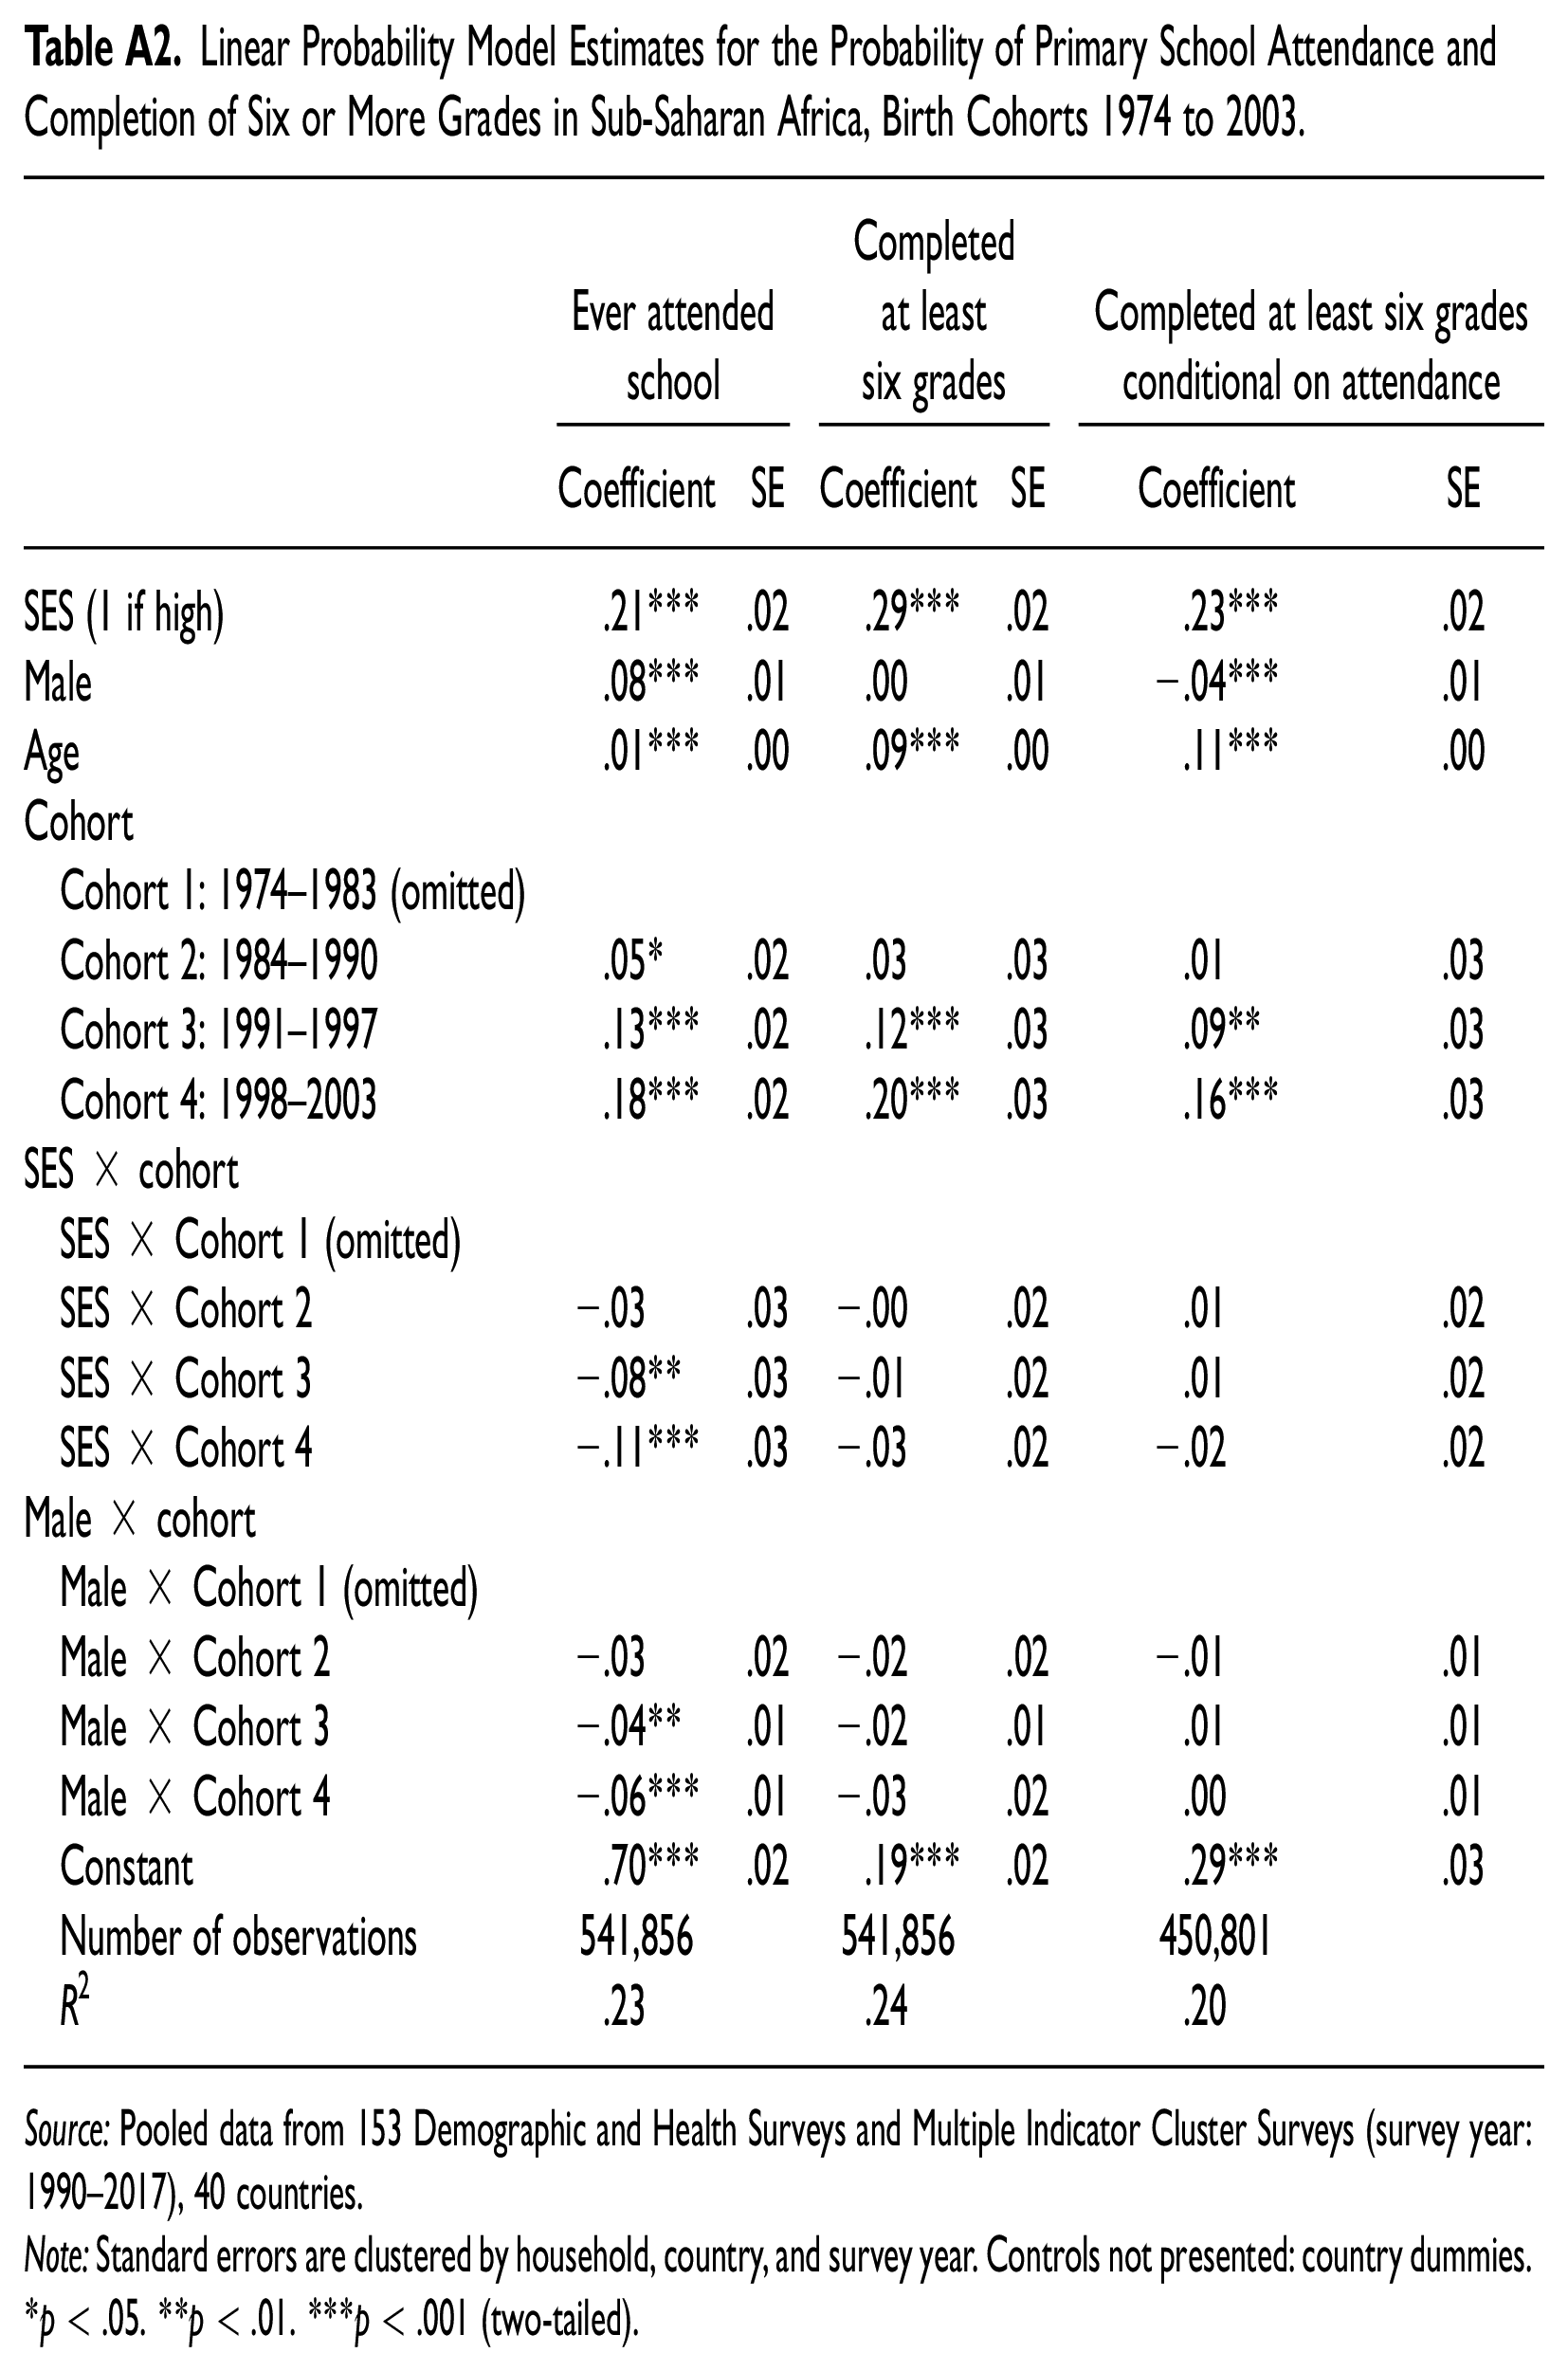
Figure 2 plots predicted probabilities in attendance and completion of primary education for children from lower and higher SES families across cohorts at the aggregate level, net of gender, age, and country effects. Appendix Table A2 shows model estimates. Over the past decades, children’s chances to attend primary education in SSA have become less dependent on families’ social background (see left panel of Figure 2). The SES gap in attendance decreased by 10 percentage points (pp), dropping from 20 pp for children born in 1974 to 1983 to 10 pp for those born in 1998 to 2003. This decline was driven by increasing chances of attendance for lower SES families because most higher SES children already had access to primary school. This positive trend coincided with a decline in gender differences in attendance (see Appendix Table A2).
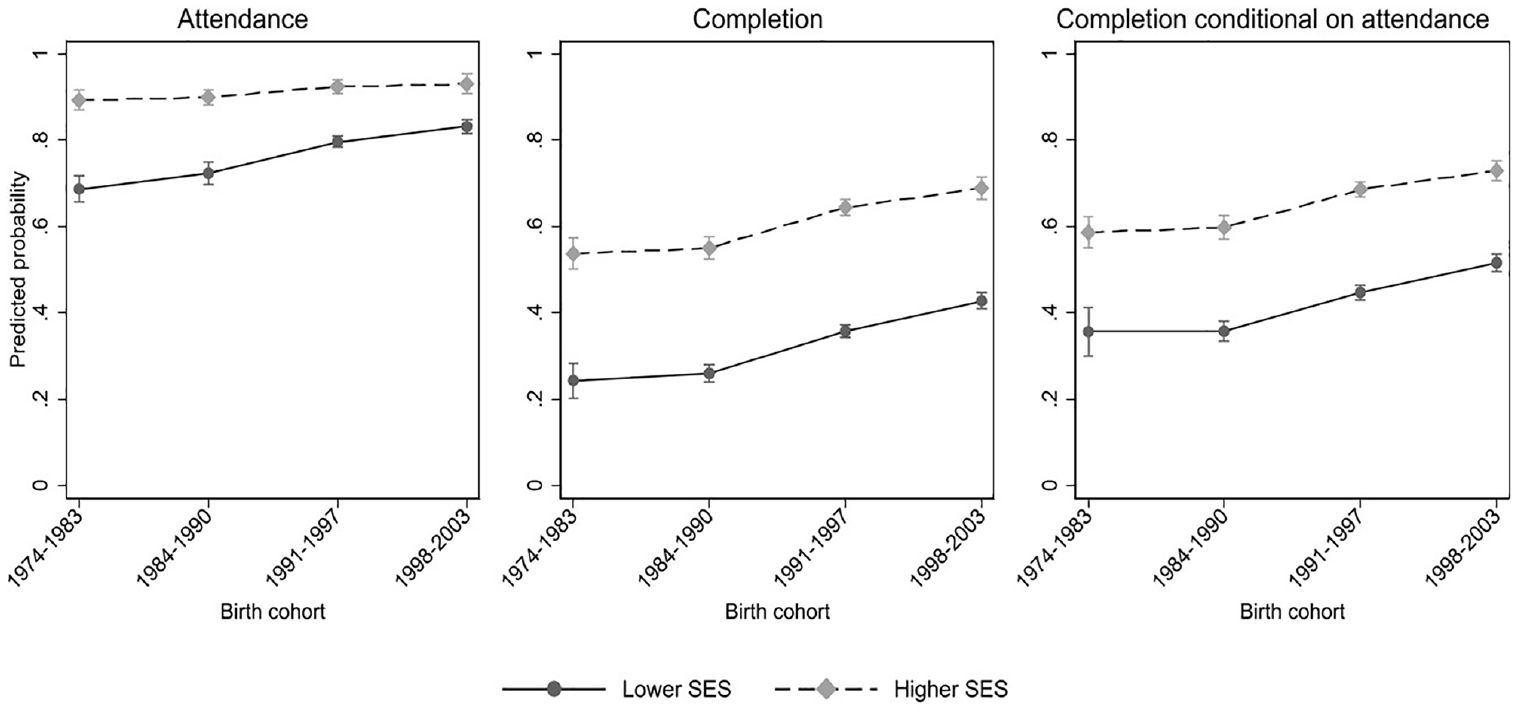
Trends by SES in predicted probabilities to attend primary education and complete six grades for birth cohorts 1974 to 2003 in sub-Saharan Africa.
By contrast, inequality in unconditional completion (middle panel of Figure 2) remained high at around 29 pp despite educational expansion and partial equalization in attendance. The SES gap marginally declined in the 2000s, but the estimated decline was small at 3 pp and not statistically significant (see Appendix Table A2). Likewise, inequality in completion conditional on attendance (right panel of Figure 2) remained stable and sizeable over the years. For cohorts born between 1974 and 1990 and attending school, the SES gap was approximately 23 pp. The completion probability for children from lower and higher SES families net of gender and age differences remained low, at around 37 percent and 60 percent, respectively. This was to be expected because these cohorts experienced a prolonged economic downturn and contraction in educational budgets. A more detailed cohort breakdown shows that conditional completion probability for birth cohorts 1980 to 1984 decreased compared to earlier cohorts for all SES groups (see Appendix Figure A1). Starting from the 1990s, chances to complete lower level primary education conditional on attendance increased equally steeply for children from lower and higher SES families, reaching around 51 percent and 73 percent, respectively, for cohorts born in 1998 to 2003, but the gap between the two groups remained at around 22 pp.
A more detailed categorization of SES by parental educational attainment shows that the decline in inequality in attendance was driven by first-generation learners (i.e., children whose parents had not attended school), and SES gaps in completion probability persisted across all parental education-attainment levels (see Appendix Figure A2). Additional sensitivity analyses show that estimated trends are not altered by weighting decisions, model specification, operationalization, or sample selection. Trends follow the same pattern, whether excluding survey size weights, using logit models, excluding younger age groups, restricting the sample to 21 countries with time-series data, or excluding several country groups (see Figures S1–S7 in the online Supplement).
Aggregate findings inevitably mask country differences, so we now turn to country estimates. Maps in Figure 3 report inequality estimates using the latest available surveys for all 40 countries to demonstrate cross-country variation in inequality in the most recent observation period. Figures 4 and 5 present levels and trends of SES gaps in attendance and unconditional completion for 33 countries with available data for older and younger birth cohorts: cohorts who reached school age during economic recession (1974–1990) and those who were school age during a period of educational expansion (1991–2003). 7 Countries are ranked in descending order by level of IEI (Figures 4a and 5a) and absolute change in IEI (Figures 4b and 5b). Appendix Figures A3 and A4 report the same for IEI in conditional completion. Note that these are period averages. In some cases, inequality fluctuated within periods, resulting in high confidence intervals in period averages reported here. The online data set and Table S1 in the online Supplement report inequality coefficients for all analyzed country-years.
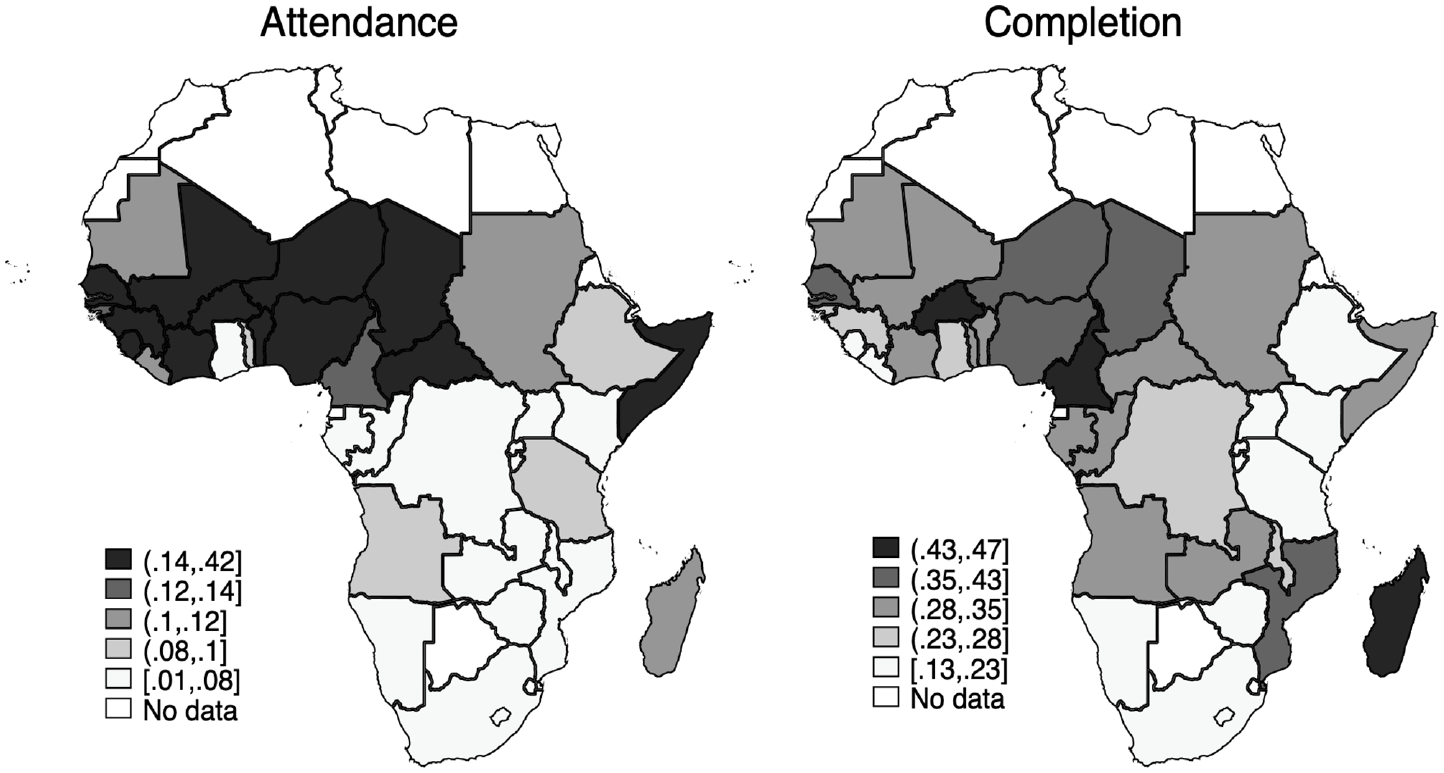
Cross-country variation in intergenerational educational inequality in sub-Saharan Africa.
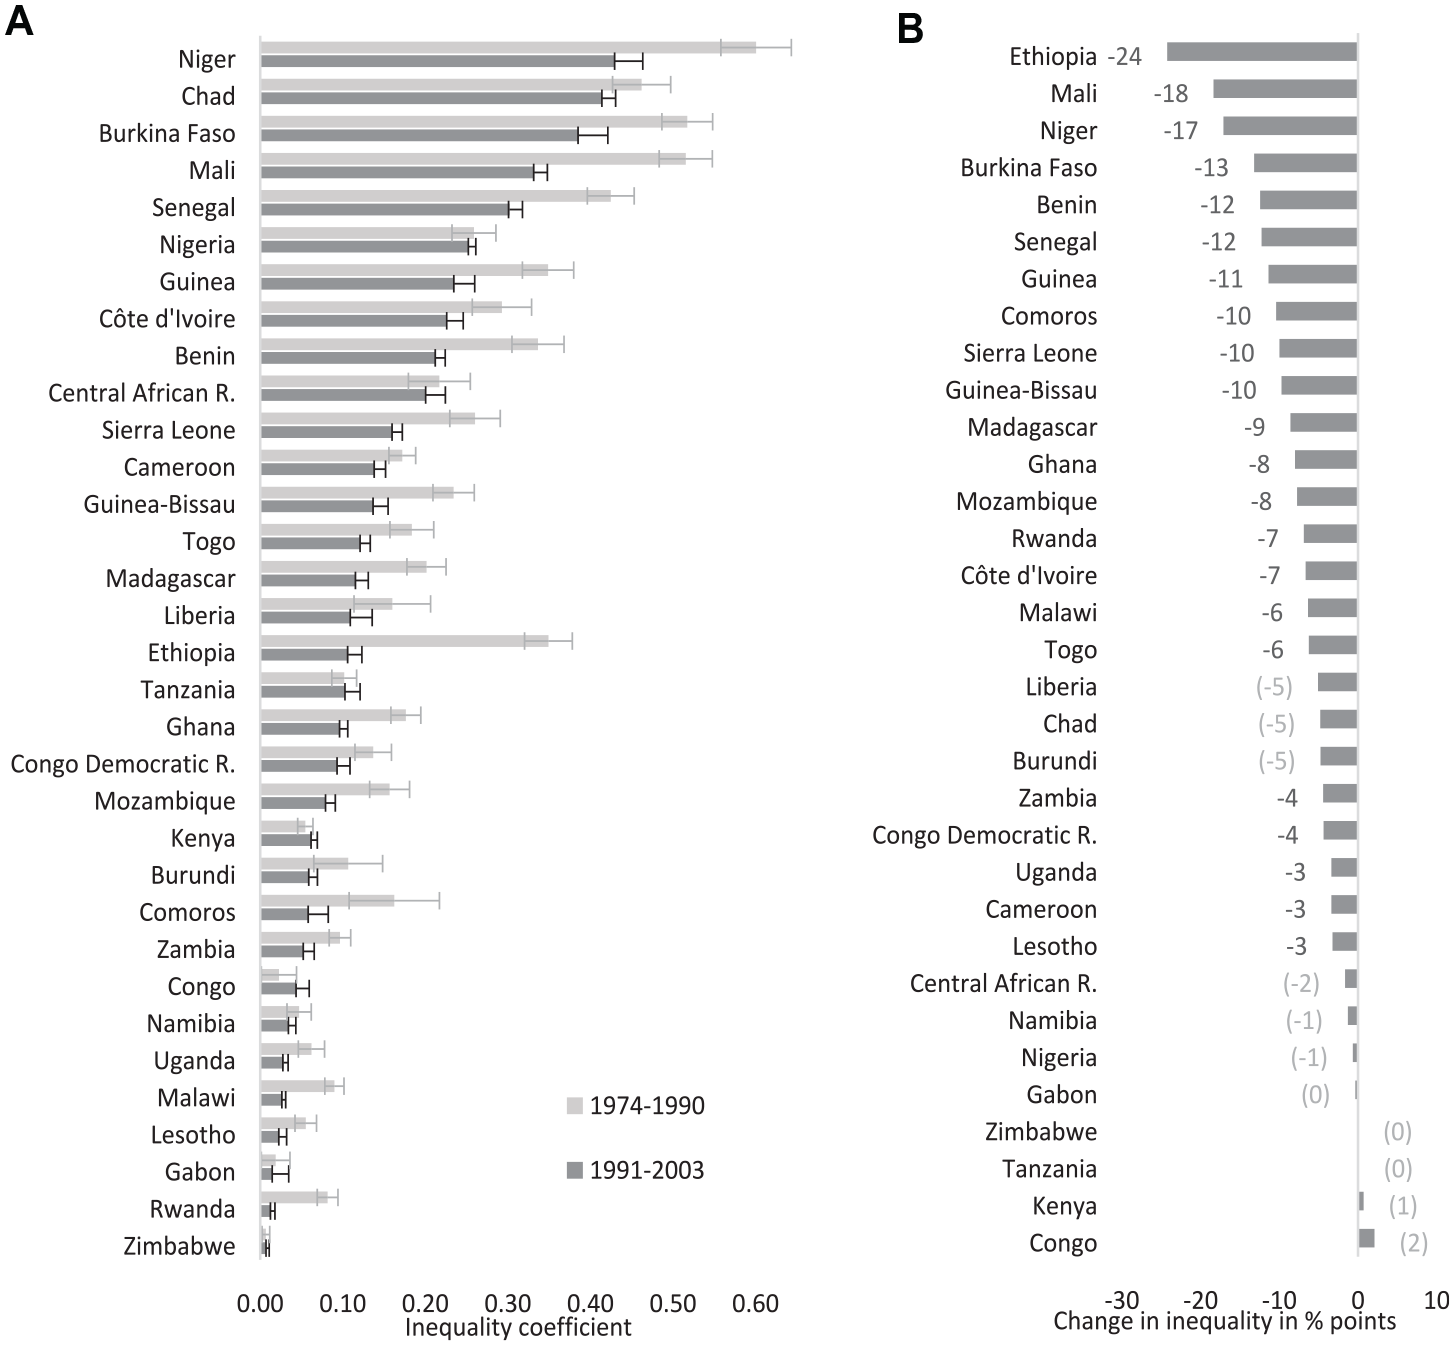
Inequality in attendance by country for birth cohorts 1974 to 1990 and 1991 to 2003: (a) socioeconomic status gaps and (b) change.
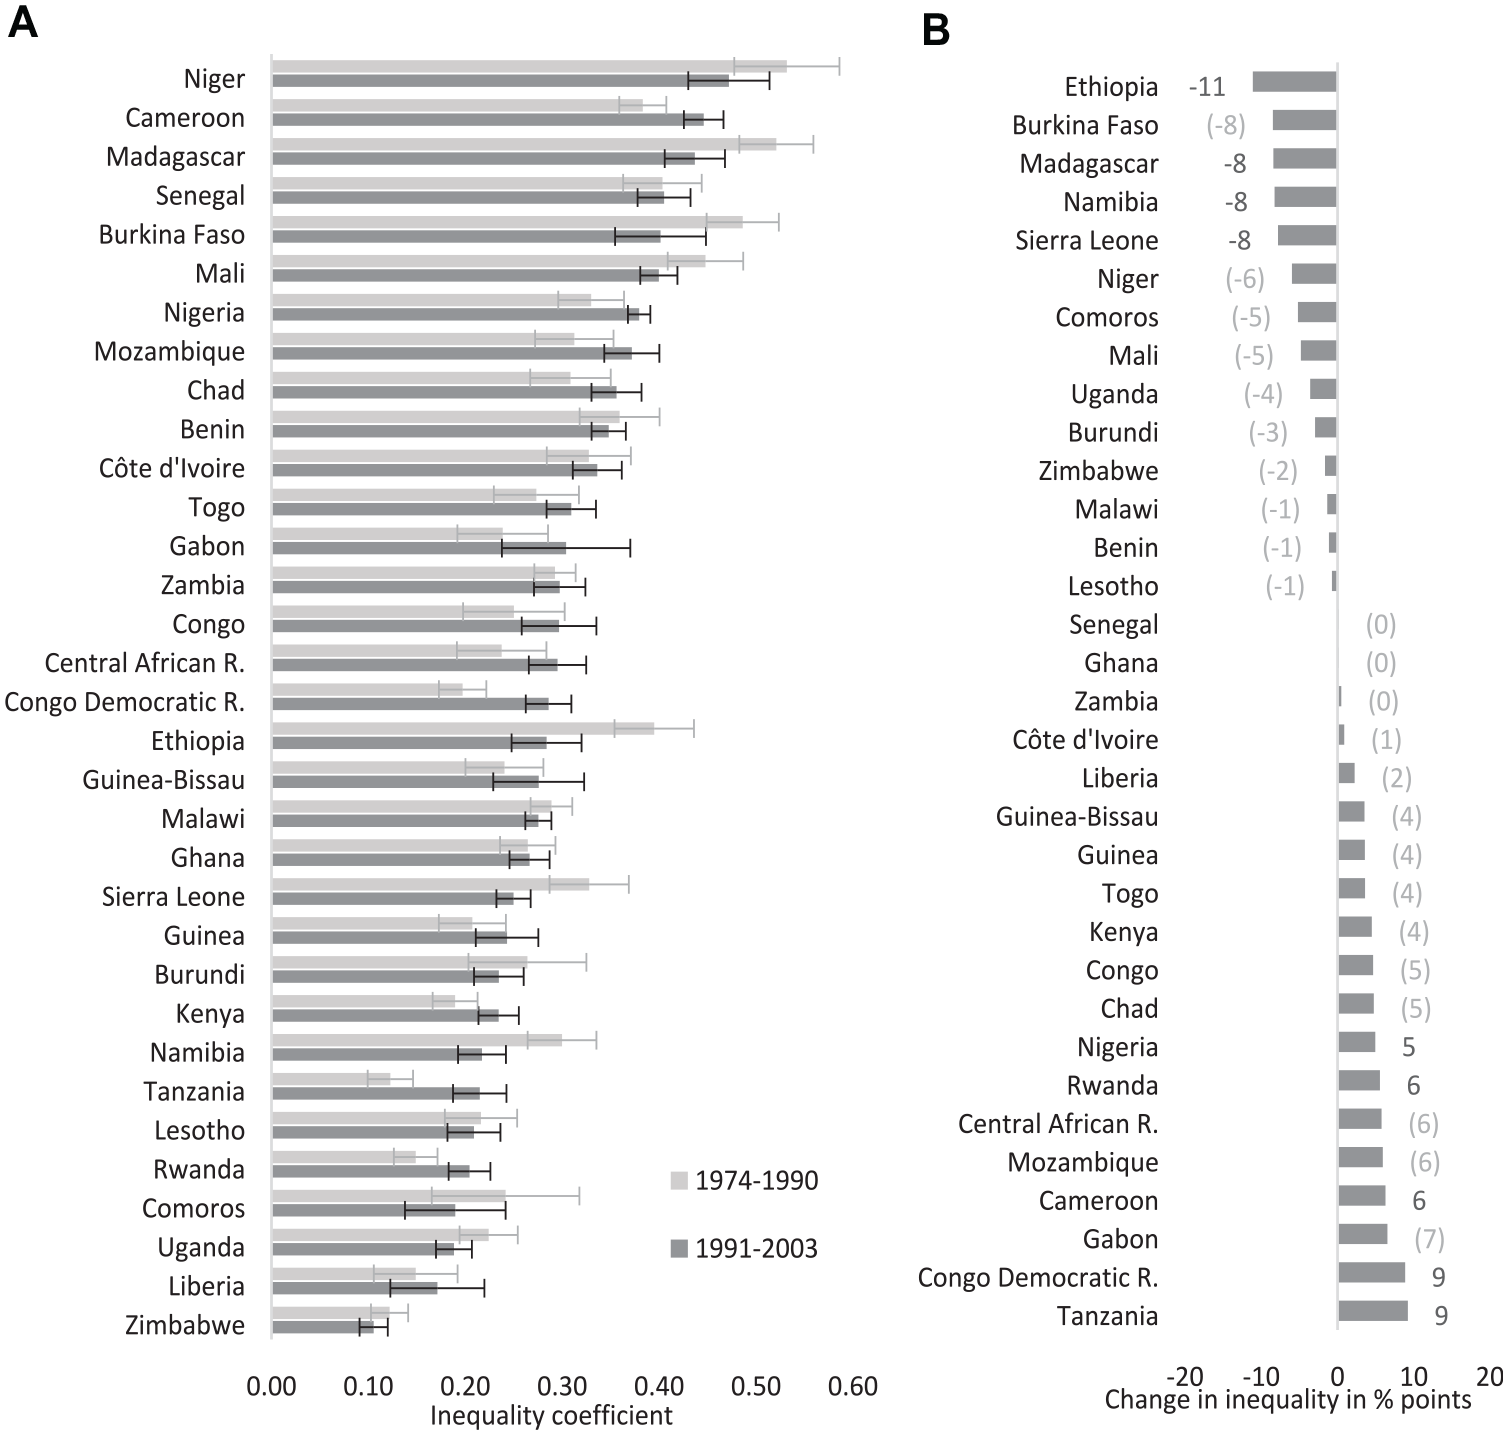
Inequality in completion by country for birth cohorts 1974 to 1990 and 1991 to 2003: (a) socioeconomic status gaps and (b) change.
In primary school attendance, the countries with the highest SES gaps are in West and Central Africa; the lowest SES gaps are in southern Africa (Figure 3). The highest inequality coefficients are in Chad, Burkina Faso, Mali, Niger, and Senegal, with gaps between 30 and 43 pp for the younger cohorts (Figure 4a). The lowest SES gaps are in Lesotho, Malawi, Namibia, Zambia, and Zimbabwe in southern Africa; in Congo and Gabon in Central Africa; and in Rwanda and Uganda in east Africa, with estimated gaps between 0 and 5 pp.
Echoing the overall trends, inequality by social background in school attendance declined in most countries, especially in Ethiopia, Niger, Mali, Burkina Faso, Benin, and Senegal, with an estimated decline of 12 pp to 24 pp. (Figure 4b). In about one third of the countries, the estimated change was close to zero: These include countries that had low initial inequality in attendance (Congo, Gabon, Kenya, Namibia, and Zimbabwe) and some of the West and Central African countries with persistently high inequality (Cameroon, Central African Republic, Chad, and Nigeria). We note that children’s chances to attend school have not yet equalized. SES gaps remained substantial (above 10 pp) in about half of the countries analyzed.
Inequality in completing six grades has a less clear geographic concentration. The highest SES gaps are in West and Central Africa—Benin, Burkina Faso, Cameroon, Chad, Mali, Nigeria, Niger, and Senegal—and Madagascar and Mozambique, with gaps between 35 pp and 47 pp for the younger cohorts. The lowest SES gaps are in Comoros, Lesotho, Liberia, Namibia, Rwanda, Tanzania, Uganda, and Zimbabwe, between 11 pp and 22 pp (Figure 3, right panel; Figure 5a).
In about half of the 33 countries analyzed, inequality in completing six grades remained stable, corresponding with overall trends. The remaining half are equally divided into countries where inequality declined and those where it increased. The SES gap declined between 8 pp and 11 pp in Ethiopia, Madagascar, Namibia, and Sierra Leone; it increased between 5 pp and 9 pp in Cameroon, Democratic Republic of Congo, Nigeria, Rwanda, and Tanzania (Figure 5b). We estimate a decreasing trend in completion inequality (by 5–8 pp) in Burkina Faso, Comoros, Mali, and Niger and an increasing trend (by 5–7 pp) in Central African Republic, Chad, Congo, Gabon, and Mozambique, but these estimates have a high level of uncertainty (see the online Supplement for trends by country-year).
Overall, recent educational expansion was accompanied by a reduction in inequality in attendance in almost all cases, yet trends in inequality in completion went in different directions depending on the country. We found similar trends for completion conditional on attendance (see Appendix Figure A4). Importantly, there is large variation in IEI levels in both attendance and completion across countries and cohorts. In the next section, we establish whether this variation is systematic and which contextual factors explain it.
The Role Of National Context In Explaining Variation In Intergenerational Educational Inequality
We now turn to whether and which national contextual factors explain variation in IEI across countries and cohorts. Tables 2, 3, and 4 report estimates from second-stage regressions in which we assess the association between cohort-by-country measures of IEI and different macro indicators. The dependent variables are the estimated inequality coefficients—SES gaps in attendance (Table 2), completion (Table 3), and completion conditional on attendance (Table 4)—extracted from the first-stage regression at the individual level for each country-year cohort. All continuous macro-level variables are scaled to have a mean of 0 and a standard deviation of 1. Models 1 to 6 analyze each of the macro indicators separately; Model 7 includes all of them simultaneously.
Association between National Characteristics and Inequality in Attending Primary Education.
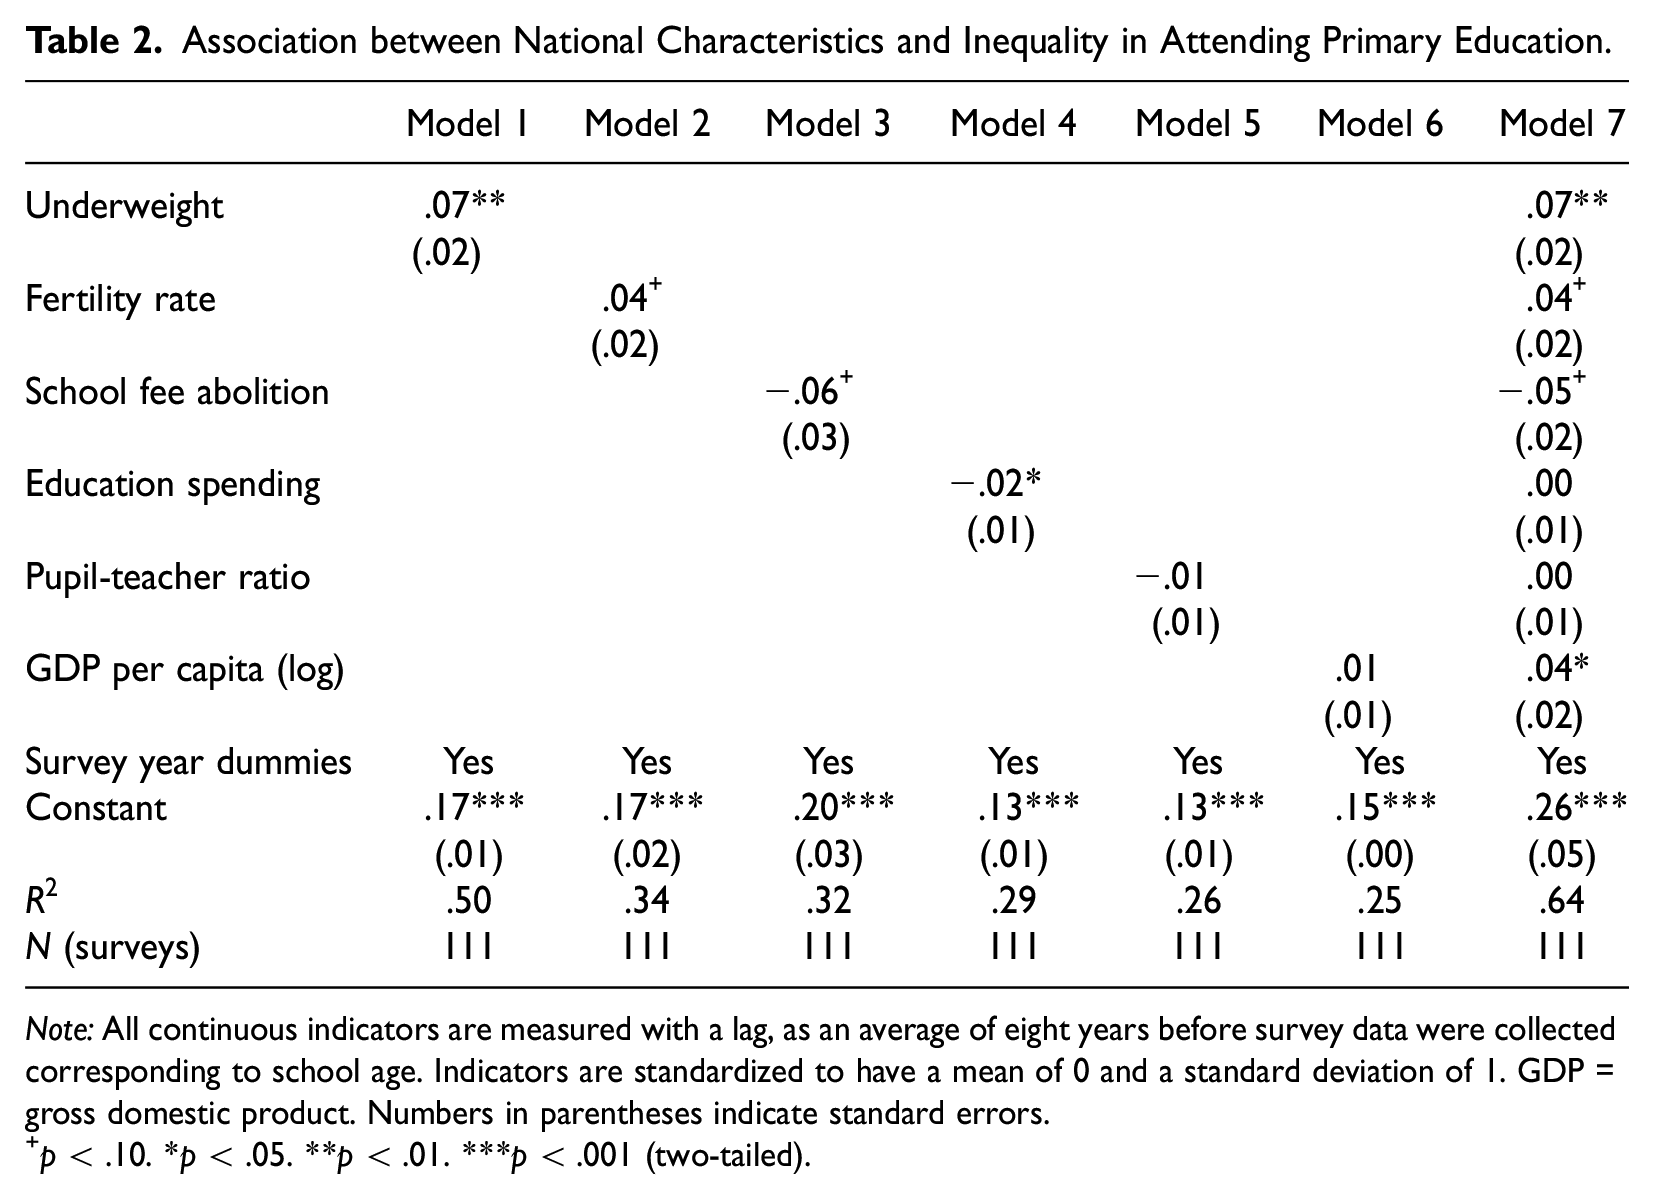
Note: All continuous indicators are measured with a lag, as an average of eight years before survey data were collected corresponding to school age. Indicators are standardized to have a mean of 0 and a standard deviation of 1. GDP = gross domestic product. Numbers in parentheses indicate standard errors.
p < .10. *p < .05. **p < .01. ***p < .001 (two-tailed).
Association between National Characteristics and Inequality in Completing Six Grades of Primary Education, Unconditional on Attendance.
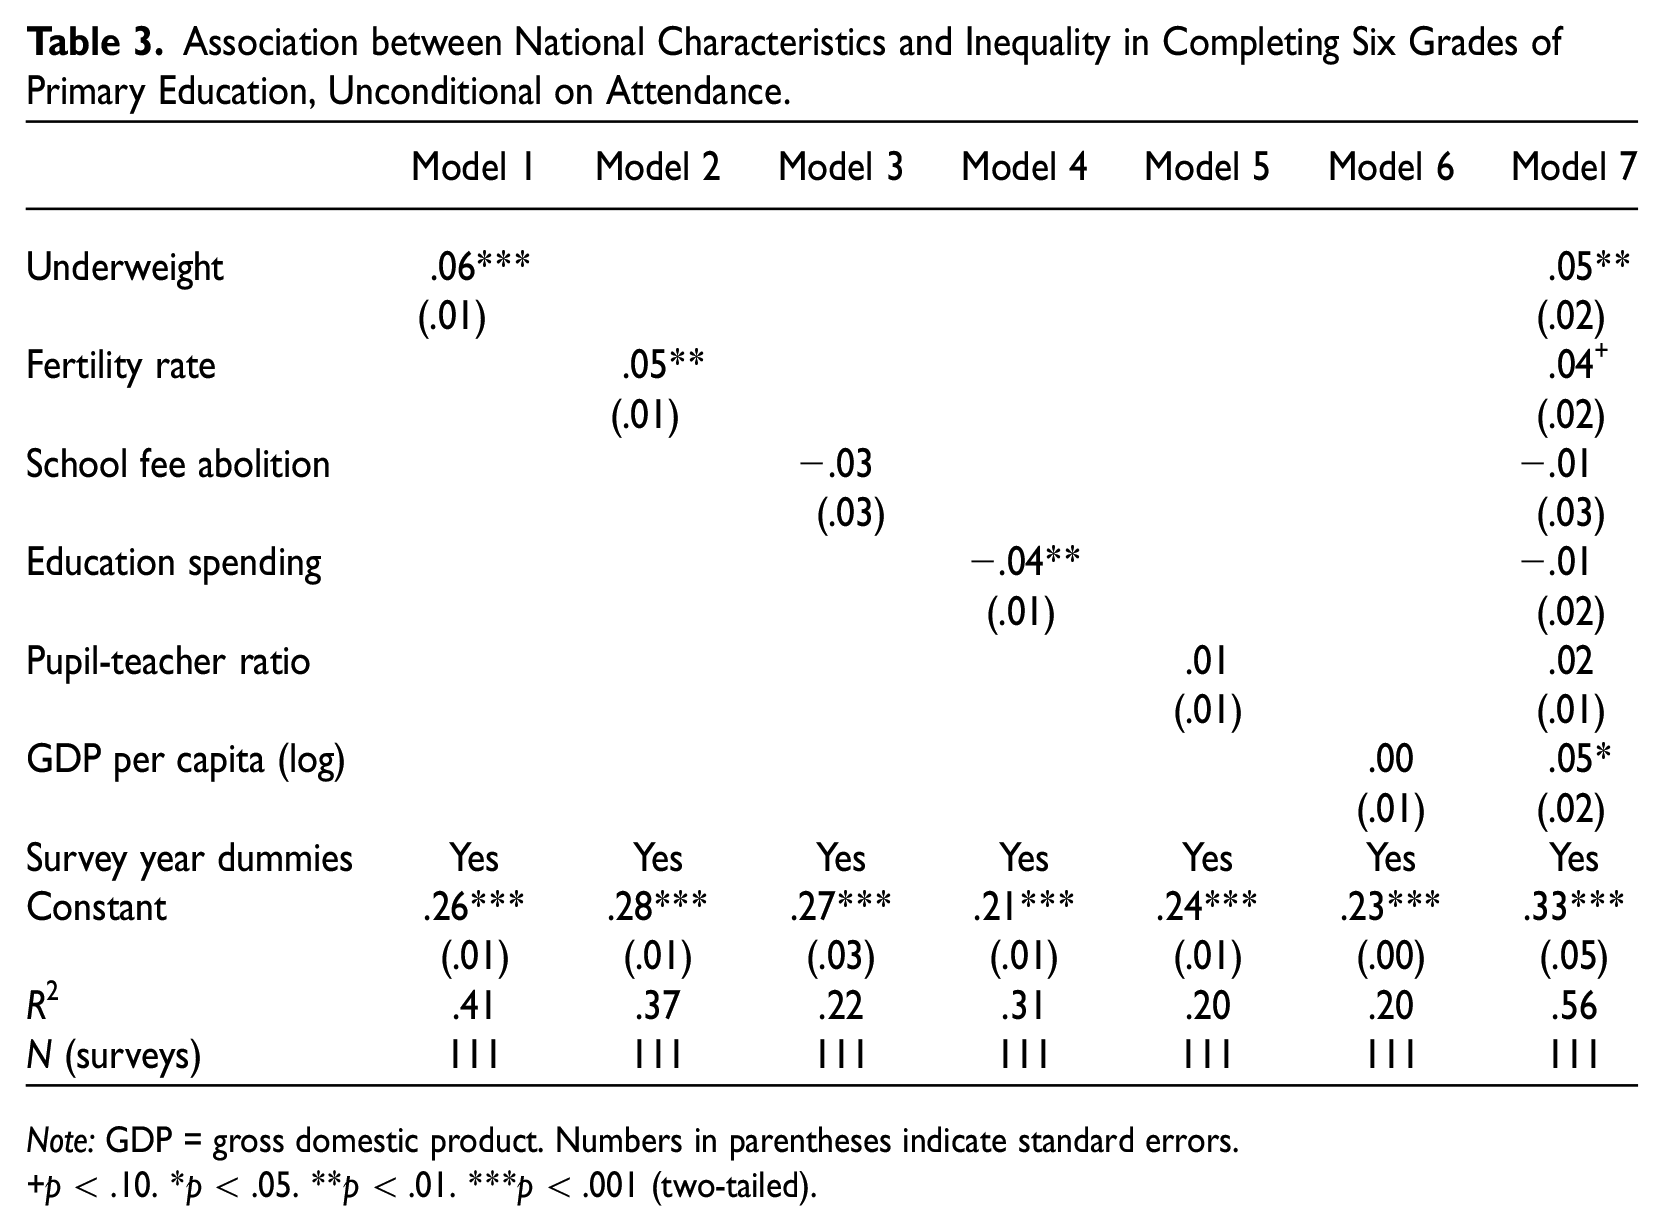
Note: GDP = gross domestic product. Numbers in parentheses indicate standard errors.
p < .10. *p < .05. **p < .01. ***p < .001 (two-tailed).
Association between National Characteristics and Inequality in Completing Six Grades of Primary Education, Conditional on Attendance.
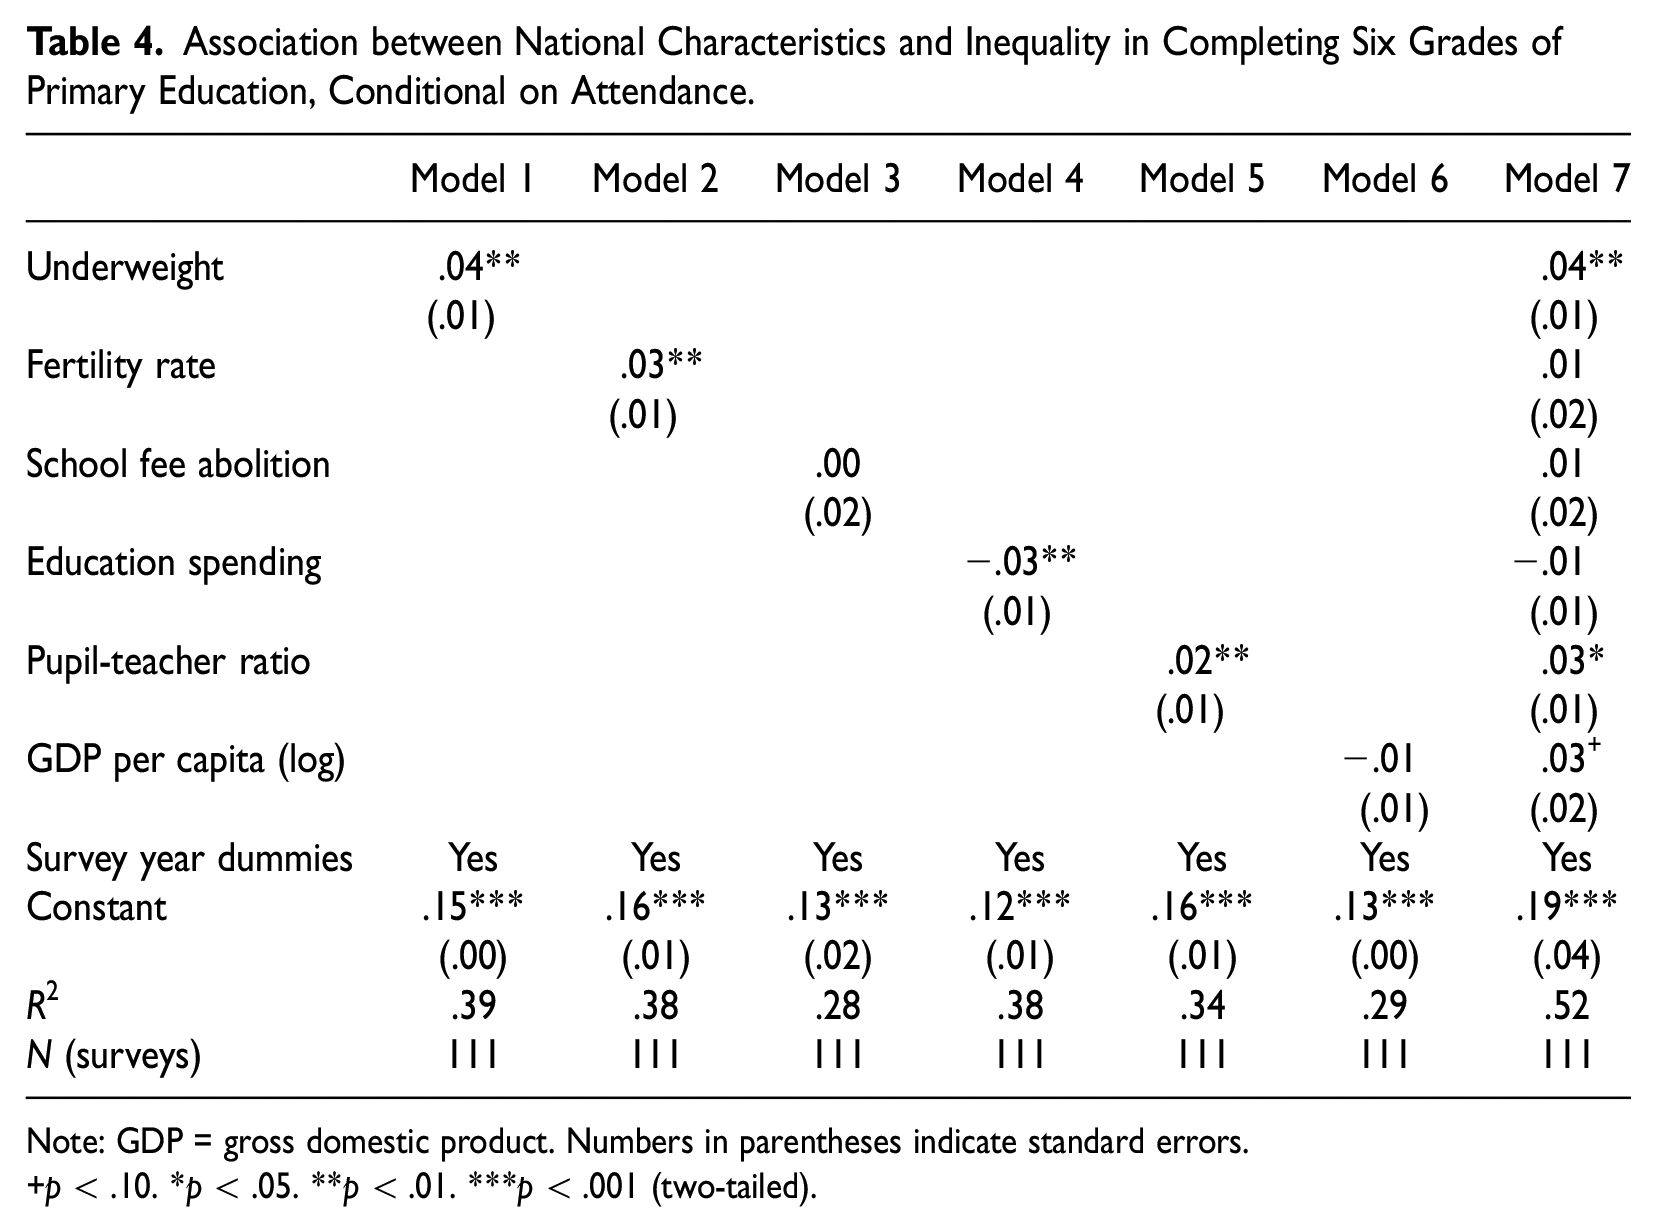
Note: GDP = gross domestic product. Numbers in parentheses indicate standard errors.
p < .10. *p < .05. **p < .01. ***p < .001 (two-tailed).
Model 1 estimates show that, as expected, differences in living conditions are relevant for IEI. Underweight prevalence explains a substantial share of country-cohort variation in IEI in attending and completing six years of schooling (R2s = .39–.50). This share is higher than for all other analyzed contextual factors. Underweight prevalence higher by 1 SD (equal to around 8 pp) is associated with a higher SES gap by 7 pp in attendance, 6 pp in completion, and 4 pp in completion conditional on attendance. The effect remains when accounting for all other covariates (Model 7). These estimates confirm Hypothesis 1, which predicted material deprivation to be associated with IEI beyond other factors such as economic development.
Model 2 captures the effect of demographic differences. Higher fertility rates when children were school age are associated with higher IEI (Hypothesis 2 confirmed), especially for attendance and unconditional completion. A fertility rate higher by 1 SD (equal to one child) is associated with higher IEI coefficients by 4 pp in attendance, 5 pp in unconditional completion, and 3 pp in completion conditional on attendance. For attendance and unconditional completion, the association remains substantial (4 pp) and statistically significant (p < .10) when controlling for other potential pathways that may link fertility with IEI, such as underweight, pupil-teacher ratio, and GDP per capita (Model 7). This corresponds with the theoretical predictions that higher fertility rates dilute family resources and affect demand for education differently for lower and higher SES families. Regarding IEI in completion conditional on attendance, the effect declines and loses statistical certainty in the full model. Auxiliary analyses show the effect is absorbed by the underweight measure. This is not surprising given that the conditional analysis captures only children who attended primary education and fertility rates and underweight prevalence are highly correlated (correlation = .65; see Table S2 in the online Supplement).
We now turn to the characteristics of educational systems and their effect on social stratification in education. Estimates from Model 3 show that school fee abolition reforms are associated with lower IEI in attendance but not in completion (Hypothesis 3 partially confirmed). Cohorts in countries where primary school fees were abolished before or during primary school age are estimated to have a 6-pp lower SES gap in school attendance (p < .10). The effect remains when controlling for all other covariates, such as GDP per capita and public spending on education (coefficient = −.05, p < .10). By contrast, school fee abolition is weakly associated with IEI in completion. This was to be expected given that the removal of fees addresses direct financial barriers to access school but does not reduce other disparities between social groups that affect school performance and progression.
In line with Hypothesis 4, higher public spending on education is associated with lower IEI in all three measures (Model 4), with a larger negative effect on IEI in completion. The estimated association holds when controlling for most other macro-level covariates but is absorbed when controlling for fertility rates. Country cohorts with higher fertility rates also tend to spend a smaller percentage of GDP on education (correlation = −.57; see Table S2 in the online Supplement). This underlines the importance of countries’ demographic developments in explaining variation in educational inequality.
Model 5 reveals that the pupil-teacher ratio—a proxy for teaching resources—has no sizeable effect on IEI in attendance and unconditional completion. By contrast, higher pupil-teacher ratio is substantially and statistically significantly associated with higher IEI in completion conditional on attendance. Net of all other covariates, 1 SD higher pupil-teacher ratio (equal to 13 pupils) is associated with a 3-pp higher SES gap in completion among children attending school (p < .05). This is in line with Hypothesis 4, implying that teaching resources affect school progression in particular. Although we do not directly measure learning outcomes, this corresponds with previous research that finds school quality plays an important role in social stratification of pupils’ scholastic achievement in low-income countries (Gruijters and Behrman 2020; Heyneman and Loxley 1983). Our analysis shows that teaching resources are an important factor for social stratification of school completion.
We also test the relationship between economic development and IEI and how it affects other model estimates. Analyses show no relationship between the level of economic development and IEI, whether it is measured by GDP per capita (Model 6) or by share of urbanization or employment in manufacturing and services (not reported here, available on request). This result is consistent with previous comparative research identifying a weaker relationship between economic development and SES gaps in educational achievement in lower income countries (Baker, Goesling, and LeTendre 2002; Chmielewski 2019). In the full model (Model 7), GDP has a positive effect on IEI. This suggests that in contexts with equal levels of material deprivation, educational investments, and other controlled factors, a higher GDP benefits the educational attainment of high-SES children more and enlarges the SES gap in primary school outcomes. Importantly, controlling for GDP per capita (Model 7) does not absorb the estimated associations between IEI and underweight, fertility rates, school fee abolition, government expenditure on education, and teaching resources, implying that these national characteristics explain variation in IEI independently from economic development.
Conclusions
The aim of this article was to analyze change and country-cohort differences in inequality of educational opportunities by SES during the recent educational expansion in sub-Saharan Africa and to assess the role of national context in explaining variation in IEI across countries and cohorts.
First, we provided estimates of trends in IEI in primary education in the region for cohorts born between 1974 and 2003, based on 40 countries. Findings revealed that inequality in school attendance declined and that inequality in school completion, both unconditional and conditional on attendance, persisted, on average. In the case of attendance, higher SES children in the older cohorts had already reached a level close to saturation. Increased attendance by lower SES children led to a decline in inequality in subsequent cohorts. In the case of completion, saturation is still far from being achieved among children from all SES groups. Educational expansion occurred with no overall change in inequality in completing six or more grades of primary education, pointing to the tendency for inequality in completion to persist.
Second, we analyzed country differences in levels and trends of IEI and found remarkable variation in both. Regarding changes in inequality across cohorts, the identified aggregate-level persistence in inequality in attaining six years of schooling did not hold for several country cases. We found some notable exceptions, where IEI in completion either declined (e.g., in Ethiopia, Namibia, and Sierra Leone) or increased over time (e.g., in Cameroon, the Democratic Republic of Congo, and Tanzania).
Third, we investigated whether the observed variation across countries and cohorts in levels of IEI reflect national contextual differences. Underweight prevalence, fertility rates, school fee abolition reforms, public spending on education, and teaching resources explain a considerable share of the country-cohort differences in IEI. Findings imply that it is not so much the level of economic development but, rather, absolute living conditions, demographic developments, school costs, and in the case of IEI in conditional completion, teaching resources that matter for educational opportunities by parental SES in this region.
We began this article by arguing that most sociological theory on the relationship between educational expansion and educational inequalities has focused on high-income countries and that very few studies have examined SSA, especially the most recent cohorts exposed to educational expansion. How do our findings stand in relation to the social stratification theories conceived to explain trends and patterns in educational inequality in developed countries?
Our finding that an equalization in attendance was driven by an increase in school participation of low-SES students, when almost all high-SES students were already attending, is in line with the MMI thesis’s prediction that equalization at a given level of education can be achieved when high-SES students are close to a saturation level in attainment (Raftery and Hout 1993).
In studies of trends in educational inequalities in developed countries, a consensus has emerged on the relevance of contextual and institutional factors to explain the reduction of IEI at lower levels of educational attainment and cross-country differences in patterns of educational inequality (Barone and Ruggera 2018; Breen et al. 2009). Our results for SSA confirm that contextual and institutional factors matter for levels of IEI. Our findings also point to environmental conditions specific to SSA, such as malnutrition, high fertility levels, and classroom overcrowding, that if not taken into consideration, undermine any understanding of IEI in this region. Contextual factors associated with lower levels of IEI vary somewhat depending on whether we consider inequality in attendance or completion. In our study, a large share of variation in IEI in school attendance is explained by material deprivation, fertility rates, and school tuition fees. At the same time, national teaching resources (and material deprivation) seem to be particularly relevant for explaining variation in IEI in completion among children who attend school.
Over the analyzed period in SSA, financial barriers to access primary education were partially removed, and fertility rates somewhat declined, leading to moderate improvements in disposable household resources. Health and nutritional outcomes improved, on average. Yet the identified trends suggest that although inequality in attending primary education declined, the demographic and institutional changes in most country cases were not sufficient to produce a sizeable declining trend in inequality in completing six grades of primary school.
Some exceptions include Namibia and Sierra Leone, where primary school enrollments increased and inequality in completion declined. In both cases, according to our macro-data, material deprivation and fertility rates decreased, and the pupil-teacher ratio remained relatively low, at 30 to 32 pupils per teacher, on average. In other country cases, such as Cameroon and the Democratic Republic of Congo, IEI in completion increased. In these cases, although school enrollments increased, the pupil-teacher ratio was high, public expenditure on education remained low (below 3 percent of GDP), and material deprivation was high. Overall, child poverty, classroom overcrowding, and other school-quality issues are worrisome in most of the SSA countries analyzed and are likely to negatively affect learning outcomes.
An important policy implication from our analyses is that reduction of material deprivation and higher public investments in school and teaching resources are key for reducing inequality in primary school completion in this region. The idea that equalization in school attendance has led to an educational bottleneck for completion suggests future work should focus on inequality in learning. Following arguments by Baker et al. (2002), expanding school access to an increasingly diverse student population may increase scholastic achievement inequality. Based on our findings, this should vary depending on the national context and, indeed, can be expected, particularly at higher levels of material deprivation and lower levels of adequate teaching resources.
Studying trends in learning outcomes was beyond the scope of this research, partly because the data we analyzed do not have information on pupils’ cognitive outcomes. If poor learning disproportionately affected children from low-SES families, one would expect that an increase of inequality in learning outcomes did indeed occur, creating a learning bottleneck at further educational transitions. An important next step in unpacking inequality of educational opportunities in SSA is to study trends in inequality in learning outcomes and in accessing post-primary educational levels because learning bottlenecks in primary education might affect children’s chances to transition to secondary school and other life outcomes.
Supplemental Material
sj-do-2-soe-10.1177_00380407231210279 – Supplemental material for Trends and Determinants of Intergenerational Educational Inequality in Sub-Saharan Africa for Birth Cohorts 1974 to 2003
Supplemental material, sj-do-2-soe-10.1177_00380407231210279 for Trends and Determinants of Intergenerational Educational Inequality in Sub-Saharan Africa for Birth Cohorts 1974 to 2003 by Ilze Plavgo and Fabrizio Bernardi in Sociology of Education
Supplemental Material
sj-docx-1-soe-10.1177_00380407231210279 – Supplemental material for Trends and Determinants of Intergenerational Educational Inequality in Sub-Saharan Africa for Birth Cohorts 1974 to 2003
Supplemental material, sj-docx-1-soe-10.1177_00380407231210279 for Trends and Determinants of Intergenerational Educational Inequality in Sub-Saharan Africa for Birth Cohorts 1974 to 2003 by Ilze Plavgo and Fabrizio Bernardi in Sociology of Education
Footnotes
Appendix
Linear Probability Model Estimates for the Probability of Primary School Attendance and Completion of Six or More Grades in Sub-Saharan Africa, Birth Cohorts 1974 to 2003.
| Ever attended school | Completed at least six grades | Completed at least six grades conditional on attendance | ||||
|---|---|---|---|---|---|---|
| Coefficient | SE | Coefficient | SE | Coefficient | SE | |
| SES (1 if high) | .21*** | .02 | .29*** | .02 | .23*** | .02 |
| Male | .08*** | .01 | .00 | .01 | −.04*** | .01 |
| Age | .01*** | .00 | .09*** | .00 | .11*** | .00 |
| Cohort | ||||||
| Cohort 1: 1974–1983 (omitted) | ||||||
| Cohort 2: 1984–1990 | .05* | .02 | .03 | .03 | .01 | .03 |
| Cohort 3: 1991–1997 | .13*** | .02 | .12*** | .03 | .09** | .03 |
| Cohort 4: 1998–2003 | .18*** | .02 | .20*** | .03 | .16*** | .03 |
| SES × cohort | ||||||
| SES × Cohort 1 (omitted) | ||||||
| SES × Cohort 2 | −.03 | .03 | −.00 | .02 | .01 | .02 |
| SES × Cohort 3 | −.08** | .03 | −.01 | .02 | .01 | .02 |
| SES × Cohort 4 | −.11*** | .03 | −.03 | .02 | −.02 | .02 |
| Male × cohort | ||||||
| Male × Cohort 1 (omitted) | ||||||
| Male × Cohort 2 | −.03 | .02 | −.02 | .02 | −.01 | .01 |
| Male × Cohort 3 | −.04** | .01 | −.02 | .01 | .01 | .01 |
| Male × Cohort 4 | −.06*** | .01 | −.03 | .02 | .00 | .01 |
| Constant | .70*** | .02 | .19*** | .02 | .29*** | .03 |
| Number of observations | 541,856 | 541,856 | 450,801 | |||
| R2 | .23 | .24 | .20 | |||
Source: Pooled data from 153 Demographic and Health Surveys and Multiple Indicator Cluster Surveys (survey year: 1990–2017), 40 countries.
Note: Standard errors are clustered by household, country, and survey year. Controls not presented: country dummies.
p < .05. **p < .01. ***p < .001 (two-tailed).
Acknowledgements
We are grateful for all the insightful comments received during the 2018 Thematic Workshop of the European Consortium for Sociological Research in Luxembourg, the 2019 Spring Meeting of Research Committee 28 of the International Sociological Association in Frankfurt, the 2019 UNDP Human Development Report Consultation Meeting in Doha, and the 2019 Annual Conference of the European Consortium for Sociological Research in Lausanne. We also thank members of the Inequality Working Group at the European University Institute for their feedback. This work is largely based on the PhD thesis of the corresponding author. We thank the PhD thesis jury members, Julia A. Behrman, Ricardo Sabates, and Juho Härkönen, for insightful comments during the thesis review process. The corresponding author also sincerely thanks Ricardo Sabates, Pauline Rose, Rob Gruijters, and Dawit Tibebu Tiruneh at the Research for Equitable Access and Learning Centre, University of Cambridge, for guidance and valuable discussions.
Research Ethics
The research did not constitute human subjects research. The data used in the study consisted of de-identified data sets. Permission for data usage was granted by the DHS Program (https://dhsprogram.com/) and UNICEF MICS (![]() ).
).
Supplemental Material
Supplemental material for this article is available online.
Notes
Author Biographies
References
Supplementary Material
Please find the following supplemental material available below.
For Open Access articles published under a Creative Commons License, all supplemental material carries the same license as the article it is associated with.
For non-Open Access articles published, all supplemental material carries a non-exclusive license, and permission requests for re-use of supplemental material or any part of supplemental material shall be sent directly to the copyright owner as specified in the copyright notice associated with the article.