
Abstract
Influential reports about the “learning crisis” in the global South generally pay insufficient attention to social inequalities in learning. In this study, we explore the association between family socioeconomic status and learning outcomes in 10 francophone African countries using data from the Programme for the Analysis of Education Systems, a standardized assessment of pupils’ mathematics and reading competence at the end of primary school. We start by showing that learning outcomes among grade 6 pupils are both poor and highly stratified. We then develop and test a conceptual framework that highlights three mechanisms through which family socioeconomic status might contribute to learning: (1) educational resources at home, (2) health and well-being, and (3) differences in school quality. We find that most of the effect of family background on learning outcomes operates through school quality, which results from a combination of the unequal distribution of resources (such as teachers and textbooks) across schools and high socioeconomic segregation between schools. On the basis of these results, we suggest that most countries in the region could improve equity as well as overall performance by “raising the floor” in school quality.
African countries have made impressive progress in expanding access to education over the past few decades. Partially driven by the Millennium Development Goals and the Education for All initiative, many countries in the region have abolished fees for basic education, and enrollment rates have increased substantially, particularly at the primary level (Lewin 2009). The main value of education, however, lies not in the number of years spent at school but in the skills and knowledge acquired during this time (Pritchett 2013).
Available evidence suggests that learning outcomes in sub-Saharan Africa are often disturbingly poor, leading many observers to speak of a “learning crisis” (International Commission on Financing Global Education Opportunity 2017; Kremer, Brannen, and Glennerster 2013; World Bank 2018). In a widely reported study, the Education for All initiative estimated that there are currently 130 million children enrolled in primary school who do not learn even the most basic literacy and numeracy skills, 52 million of whom are located in sub-Saharan Africa (United Nations Educational, Scientific and Cultural Organization [UNESCO] 2014:191). World Bank president Jim Yong Kim called the lack of learning in the global South a “moral and economic crisis that must be addressed immediately” (World Bank 2018:xi).
Poor learning outcomes are not universal, however, and tend to be concentrated among the most disadvantaged segments of society (Crouch and Gustafsson 2018). Most of the global discourse around the learning crisis focuses on raising overall levels of learning rather than addressing inequalities in learning and creating equal learning opportunities for all children. It is imperative to study inequality in learning outcomes because of the well-known associations between learning and a range of important life outcomes, including health (Glewwe 1999), child mortality (Smith-Greenaway 2013), and earnings (Hanushek et al. 2015). Inequality in learning thus lays the foundation for future social stratification (Duncan and Murnane 2011; Heckman 2006). Moreover, there are indications that equality in learning outcomes is associated with higher overall levels of achievement on the national level (R. Freeman, Machin, and Viarengo 2011; Organisation for Economic Co-operation and Development [OECD] 2013). Finally, learning outcomes are an important indicator of the quality of education provided. By studying the quality of education obtained by different social groups, we can assess the role of schools and education policies in (re)producing social inequality (Downey and Condron 2016).
In this study, we focus on a classic measure of educational inequality: the relationship between family socioeconomic status (SES) and learning outcomes (Chmielewski 2019; Hill 2017; Van de Werfhorst and Mijs 2010). We use the Programme for the Analysis of Education Systems (Programme d’Analyse des Systèmes Educatifs de la CONFEMEN [PASEC]) 2014 data set, which is based on a highly detailed survey of pupils and schools in 10 francophone African countries. The surveyed countries have relatively similar curricula and share a language of instruction (with one exception), which facilitates the standardized assessment of educational performance. Our first objective is to assess the overall level of socioeconomic inequality in learning. We find that learning outcomes at the end of primary school are not only poor but also highly unequally distributed. Second, we develop a conceptual framework that highlights three pathways through which family SES might contribute to learning in sub-Saharan Africa: (1) educational resources at home, (2) health and cognitive development, and (3) school quality. We use a mediation model to assess the relative importance of each of these three pathways and find that most socioeconomic inequality operates through sorting into schools of different quality. Third, we analyze which school resources are particularly important for learning and how access to these resources differs between pupils of different social backgrounds.
Background: Schooling and Learning in Francophone Africa
Our study covers 10 predominantly francophone countries, located in West and Central Africa. Although they are all located at the lower end of the global income ranking, they display some variation in economic development, ranging from extremely poor countries, such as Burundi and Niger, with per capita incomes of $782 and $851, respectively, to lower-middle-income countries, such as Congo (Brazzaville) and Cameroon (see Table 1). Furthermore, their national incomes tend to be highly unequally distributed, as indicated by the Gini coefficients. The skewed income distribution reflects a class structure that is broadly characterized by a small, very wealthy elite; an emerging (urban) middle class; and a large, mainly rural population living around or just above the poverty line. Absolute poverty and deprivation remain widespread in each of the sampled countries, which are all ranked as “very low” on the United Nations Development Program’s (2018) Human Development Index. As a result, levels of malnutrition and disease prevalence are generally high, particularly among children.
Country Background Indicators.
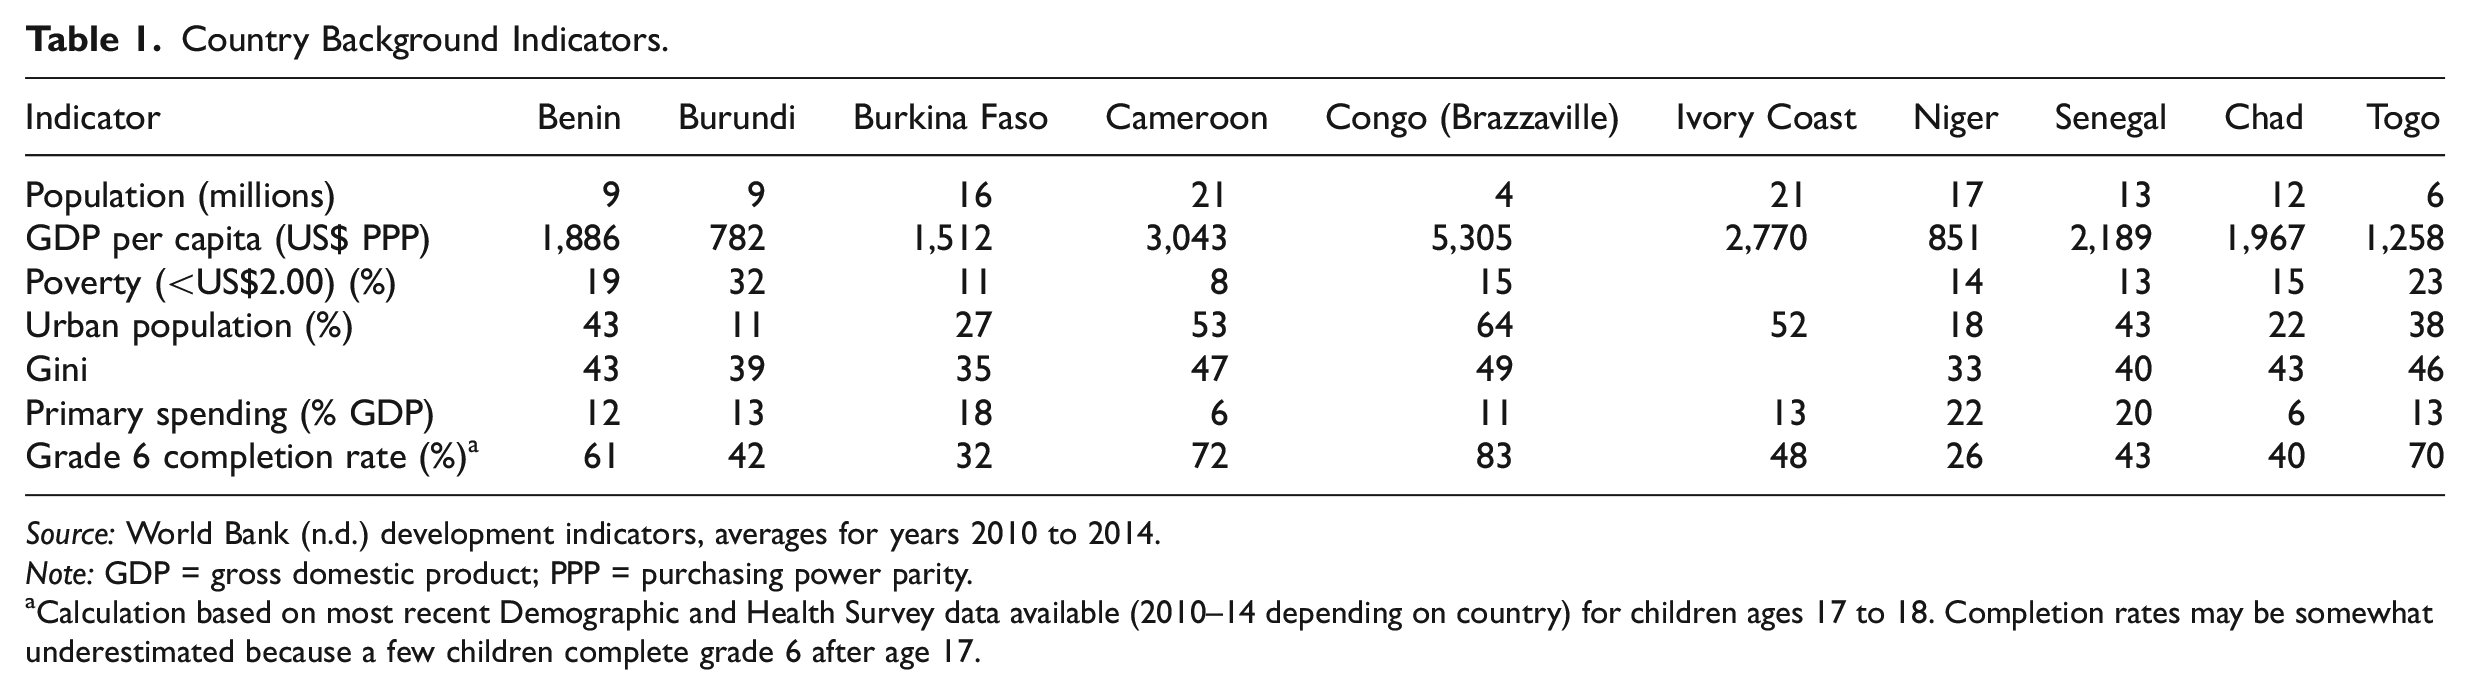
Source: World Bank (n.d.) development indicators, averages for years 2010 to 2014.
Note: GDP = gross domestic product; PPP = purchasing power parity.
Calculation based on most recent Demographic and Health Survey data available (2010–14 depending on country) for children ages 17 to 18. Completion rates may be somewhat underestimated because a few children complete grade 6 after age 17.
Despite these socioeconomic challenges, each of the countries in our study has made substantial gains in primary school enrollment in recent years. For example, between 2000 and 2010, net primary enrollment increased from 27 percent to 64 percent in Niger and from 40 percent to 94 percent in Burundi (UNESCO 2015). Most of these enrollment gains are concentrated in the lower grades, however, and primary school completion rates remain relatively low in many of the countries we study (Table 1). Some of the countries in the study—including Benin, Burundi, Cameroon, Senegal, and Togo—have also eliminated primary school fees, which has been linked to increased enrollment in other parts of Africa (Lucas and Mbiti 2012; World Bank 2009). Educational expansion has closed or substantially reduced gender gaps, rural–urban gaps, and wealth gaps in primary school enrollment (Lewin 2009; Lewin and Sabates 2012; World Bank 2009).
However, there is increasing recognition that the impressive gains in (primary) school enrollment in Africa mask major deficiencies in learning (Kremer et al. 2013; UNESCO 2014; World Bank 2018). Comparative studies show that average learning outcomes in sub-Saharan Africa are poor, even compared with outcomes in other low-income regions (Kremer et al. 2013; Pritchett 2013). Regional assessments, such as PASEC (2015), have shown that more than half of sampled children did not meet the minimum threshold for mathematics and reading proficiency, in spite of spending several years in school. As an illustration, a recent report found that only 1 in 12 Nigerian girls who had completed fifth grade were able to read a single sentence (Sandefur 2016).
Previous research has highlighted several explanations for the learning crisis in sub-Saharan Africa. First, the rapid expansion of primary enrollments has caused a shortage of teachers in many African countries, resulting in the hiring of underqualified and poorly trained teachers who often lack understanding of their subject matter (Verspoor 2008). For example, in an assessment of primary school instruction in seven African countries, Bold et al. (2017) found that 32 percent of teachers failed a grade 4 mathematics test. The same study found that less than 11 percent of teachers had a minimum knowledge of pedagogy and that most teachers were unable to critically assess student learning; instead, many teachers relied upon outdated rote learning methods. Furthermore, teachers and schools are rarely held accountable for learning outcomes and have limited incentives to improve performance (Michaelowa 2001; Yu and Thomas 2008). These factors often manifest themselves in high rates of teacher absenteeism; for example, in the aforementioned study of seven African countries, Bold et al. (2017:188) found that teachers were absent from class 44 percent of the time, so students were taught for less than three hours a day on average. Poor learning outcomes in sub-Saharan Africa have also been attributed to a lack of basic resources (such as textbooks and latrines or even classrooms) and very high student-to-teacher ratios (Michaelowa 2001; Piper et al. 2018; World Bank 2018; Yu and Thomas 2008).
The relative importance of the aforementioned factors is the subject of ongoing debate. Some scholars argue that the fundamental issue is lack of school resources (see Bennell 2002) and classroom overcrowding as evidenced by high student-to-teacher ratios, while others maintain that increases in school resources (such as textbooks and teachers) will have limited impact without institutional reforms, including improvements in teachers’ education, incentives, and accountability (Hanushek and Luque 2003; Kremer et al. 2013). In recent years, low-cost private schools have emerged as competitors for underperforming public schools in many African countries. There is some debate about whether these schools indeed deliver better-quality education and about the implications for inequality (Grant 2017; Nishimura and Yamano 2013).
Although the aforementioned studies provide insightful evidence regarding the causes of low levels of performance, they tend to ignore the distribution of learning outcomes among different socioeconomic groups. Indeed, it is often believed that family background is of limited importance to learning outcomes in the global South, either because there is little variation in SES or because the effect of families is dwarfed by that of schools. This idea can be traced back to two influential studies by Heyneman and Loxley (1982, 1983), who showed that school characteristics were far more important than family background in explaining learning outcomes throughout Latin America, Africa, and Asia. This runs counter to what is typically observed in high-income countries—including by the influential Coleman Report—where family background is generally found to be the main determinant of educational performance (Coleman et al. 1966; Downey and Condron 2016). Moreover, Heyneman and Loxley found that the effect of families on learning increases with gross domestic product, while the effect of school and teacher quality decreases, a finding that later became known as the “Heyneman-Loxley effect.” Their explanation for these findings, which were confirmed in more recent research (Chiu 2010), is that in a context of scarce resources—where even basic learning materials, such as textbooks, may be absent—the marginal effect of an additional unit of school quality is higher. Moreover, variation in school quality, for example, between the capital and remote rural areas, tends to be much larger than what is typically observed in the West. Heyneman and Loxley (1983:1183) also suggest that in low-income countries, “the desire for a place in school and the pressure on students to do well on examinations does not appear to vary as markedly on the basis of parental socioeconomic status.” Although more recent studies on low-income countries have reemphasized the role of socioeconomic disadvantage in the learning process (e.g., Alcott and Rose 2017; Baker, Goesling, and LeTendre 2002; S. Jones and Schipper 2015; Smith 2011), they fall short of elucidating the mechanisms behind socioeconomic inequality in learning. Our study addresses these research gaps, first, by documenting the overall degree of socioeconomic inequality in learning in a region that has received scant attention in the literature and, second, by developing and testing a conceptual framework to explore the relative importance of different pathways through which family background may affect learning outcomes in Africa and other low-income contexts.
Learning Inequality in Low-Income Countries: A Conceptual Framework
Existing theories on inequality in educational performance are generally based on the experience of rich industrialized nations and thus are of less relevance to the low-income countries in our sample. As described in the previous section, education in sub-Saharan Africa is faced with numerous challenges, including inadequate physical infrastructure, a lack of educational materials and resources, teachers who are underqualified and poorly trained, and high levels of poverty and malnutrition among pupils. In this section, we develop a conceptual framework that takes these challenges into account and considers the unique realities of the educational landscape in Africa and other low-income contexts.
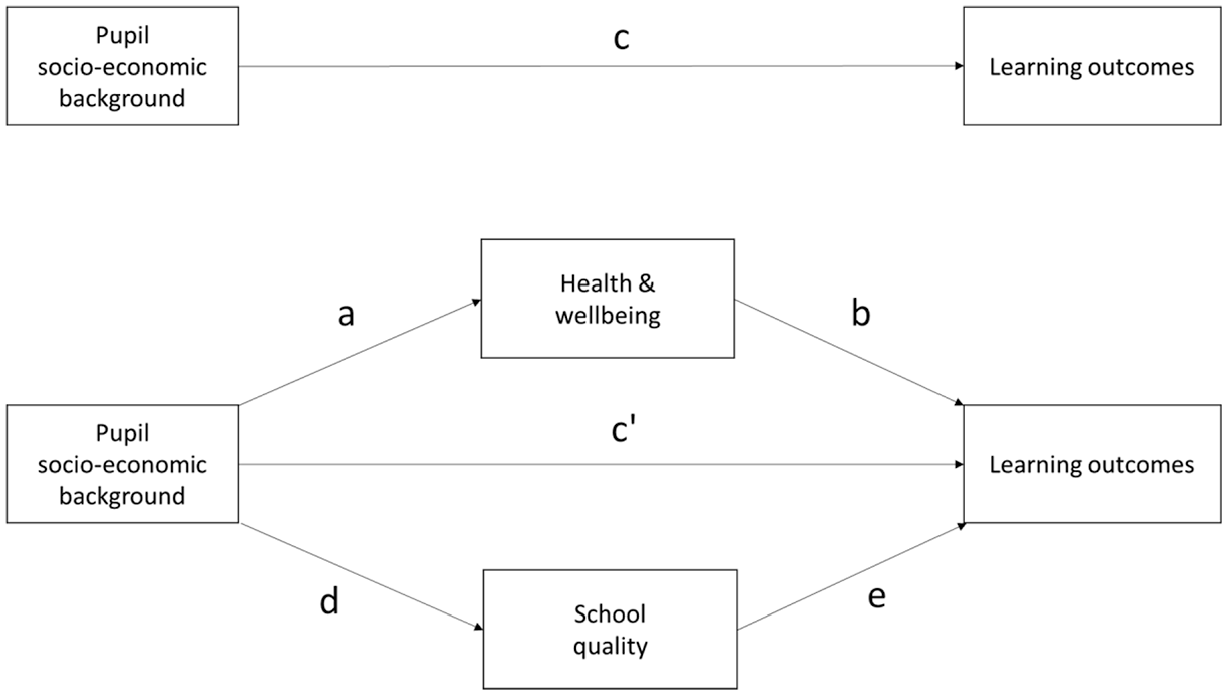
Throughout the framework (depicted in Figure 1), we define learning inequality as the extent to which learning outcomes depend on a pupil’s socioeconomic background. The association between family SES and school achievement is a common measure of inequality of opportunity (OECD 2013; Van de Werfhorst and Mijs 2010).
Conceptual framework.
We start by estimating the overall degree of socioeconomic inequality in learning, proxied by the bivariate association between SES and learning (line c in Figure 1). We hypothesize that the effect of family SES on learning outcomes operates through three distinct pathways.
First, there is likely to be a direct effect of family SES (line ć in Figure 1). This unmediated effect is generally assumed to reflect unobserved “educational resources” available in a household, which relate to a supportive home learning environment as well as parents’ ability to help their children progress through school, for example, by assisting with homework (Bukodi and Goldthorpe 2013). The direct effect also includes any other unmeasured effects of SES, however, such as differences in the frequency of school attendance or effects of family background on motivation and self-confidence.
Second, particularly in this low-income context, family SES may affect learning outcomes through its effect on health and physical and mental well-being. Extreme poverty and malnutrition are still widespread in the countries we study, contributing to a high disease burden among children. For example, in Chad and Niger, over 40 percent of children under five are stunted, compared with less than 2 percent in the United States (World Bank 2015). The health problems associated with widespread malnutrition are compounded by the fact that child labor—which is widespread in the countries we study—exposes children to physical strain and psychosocial stress, which further contributes to poor health (Fassa et al. 2000; Roggero et al. 2007). Prolonged exposure to poverty, stress, strenuous physical labor, and poor nutrition can impair the development of important cognitive functions in children, thus leading to learning difficulties and impaired skill development (Black et al. 2013; Crookston et al. 2011; Dewey and Begum 2011; Grantham-McGregor et al. 2003). Food insecurity and hunger have also been shown to have negative repercussions for children’s cognitive processing, memory, and test scores (Mahoney et al. 2005; Winicki and Jemison 2003) Malnutrition, illness, food insecurity, physical impairments, and child labor are more common among pupils from low-SES backgrounds (path a) and can have a profound impact on children’s ability to learn (path b) (Emerson, Ponczek, and Souza 2017; Glewwe and Miguel 2008; Heady 2003; Walker et al. 2016).
Third, family SES is likely to affect children’s learning indirectly through its association with school quality. Although a substantial literature from high-income countries has looked at school quality as a determinant of social and ethnic achievement gaps (e.g., Fryer and Levitt 2004; Kalogrides and Loeb 2013), the topic has received limited attention in the global South. There is good reason to believe, however, that the association between family background and school quality will be particularly pronounced in low-income settings. Internal migration is high in sub-Saharan Africa, and comparatively wealthier families are more likely to live in or move to the (urban) areas that have the best schools (Glick and Sahn 2009). The rise of private education in Africa has provided better-off families with another option to provide their children with potentially higher-quality schooling (Grant 2017). Even in the public system, however, direct and indirect costs (such as textbooks and school uniforms) at more prestigious schools may create barriers to access for poor children. As a result, high-SES children tend to be enrolled in schools with better facilities and resources. In our conceptual framework, the school quality pathway can be interpreted as the combined effect of the association between family background and school quality (d) and the effect of school quality on learning outcomes (e). The literature on school effectiveness in low-income countries has identified several school characteristics that are associated with positive learning outcomes, including physical resources as well as teaching practices and school governance. Much less is known, however, about how measures of school quality are associated with family background and the ways in which schools might inadvertently reinforce preexisting inequalities.
Method
Data
We use data from the PASEC survey, which was commissioned by the Francophone Ministerial Conference for Education. Data were collected in 2014 and made publicly available in July 2017.
The PASEC 2014 survey collected data on pupils and primary schools in 10 francophone countries in West and Central Africa: Benin, Burkina Faso, Burundi, Cameroon, Chad, Congo, the Ivory Coast, Niger, Senegal, and Togo. All schools included in PASEC are drawn from an official database of all registered public, private, and community schools that was updated within the last two years by officials in the respective countries. 1 In each country, between 160 and 266 schools were sampled, and in each school, one sixth-grade class was randomly selected, from which 20 pupils were randomly drawn. In total, this provides us with a sample of 30,807 sixth graders in 1,808 schools from across the 10 countries (for more information on sampling and data collection, see PASEC 2015).
The sampled pupils were asked to complete a standardized reading and math assessment and provided basic information about themselves and their families. Moreover, detailed questionnaires on various aspects of teaching and school resources were completed by the teacher and the school’s headmaster. A key advantage of the PASEC methodology is that it can distinguish differences in learning even at the lower end of the distribution. PASEC also provides learning thresholds, which reflect the minimum level of mathematics and reading skills pupils should possess based on the curriculum and the grade they are in.
A limited number of missing values on independent variables were imputed using standard multiple imputation methods. Results based on imputed data were similar to complete case analyses. All descriptive analyses apply the pupil-level weights provided by PASEC, which ensures findings represent all grade 6 pupils in the respective countries.
One limitation of our analysis is that primary school attendance is far from universal in the countries we study, and PASEC covers only children who are currently in school. This might be particularly a concern for countries such as Burkina Faso, Niger, and Chad, where less than half of all children complete primary school (see Table 1 for an estimate of grade 6 completion rates based on Demographic and Health Survey [DHS] data). Moreover, DHS data show that there is a clear wealth gradient to grade 6 completion, with children in the richest 20 percent completing at much higher rates than children in the bottom quintiles (see also Lilenstein 2018). Because poor students have higher dropout rates and we focus on pupils who are still enrolled in schools, our estimates of the association between SES and learning are probably conservative (for a more detailed discussion, see Spaull and Taylor 2014).
Analytical Approach
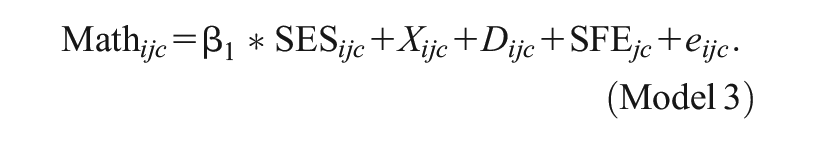
Following the conceptual framework outlined in Figure 1, we assume the following mediation model for socioeconomic inequality in learning outcomes among children in school:

where c is the total association between SES and learning outcomes, a is the association between SES and our measures for health and well-being, b is the association between health and learning outcomes, d is the association between SES and school quality, and e is the effect of school quality on learning outcomes. Because we are looking at primary school pupils, we assume that our results are not affected by selection on ability (tracking). The total indirect effect of SES through health and well-being and differential access to quality schooling is a*b+d*e, while ć constitutes the direct or residual effect of family SES, which we interpret as the effect of educational resources in the household.
We started with a pooled model that looks at the total impact of family SES on mathematics test scores. Results for reading performance, which turned out to be substantively similar, are presented in Appendix C, available in the online version of this article. Our baseline model controls only for basic child-level demographic control variables and cross-national differences in learning:
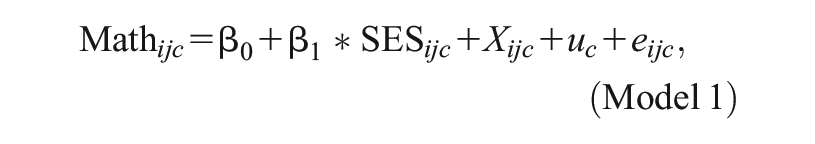
where Xijc refers to the sex and age of pupil i in school j in country c and uc is a set of dummy variables for the 10 countries participating in the survey. 2 Standard errors were adjusted to account for clustering of pupils in schools. The coefficient β1 in this model can be interpreted as the overall degree of socioeconomic inequality in learning outcomes in the region, which includes any effects that operate through health and well-being, school quality, and educational resources at home.
Next, we added a number of proxies for health and well-being (Di), such as being hungry in school or engaging in child labor:
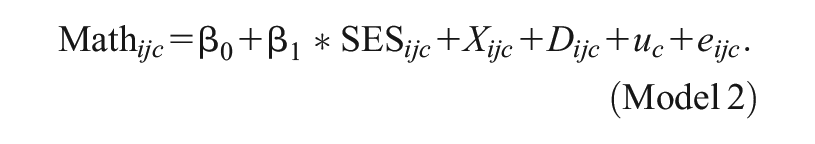
The change in the SES coefficient relative to Model 1 can be interpreted as the indirect effect of SES through health and well-being (the a*b path in Figure 1). It is important to note that we are primarily interested not in the effect of these covariates themselves but, rather, in the extent to which they explain the relationship between SES and learning. A covariate contributes to learning inequality when it is positively correlated with SES and has a substantial positive effect on test scores or, in the case of the well-being variables, such as hunger, is negatively correlated with SES and negatively correlated with test scores.
In a second specification, we introduce a set of school fixed effects (SFE j ). In this model, the country fixed effects do not appear because they are absorbed by the school fixed effects:
The extent to which the introduction of school fixed effect explains the SES–learning gradient reflects the extent to which learning inequality is due to differences in school quality: the d*e pathway in Figure 1 (R. Freeman and Viarengo 2014). The school fixed effects incorporate any school characteristics that may contribute to learning. This is important because previous research shows that many important aspects of school quality, especially intangible assets, such as teacher motivation and academic climate, generally remain unobserved in school surveys (McEwan and Trowbridge 2007). The school fixed effects also incorporate the influence of the broader school environment, including peer effects, characteristics of the school’s location, or unobserved characteristics of pupils and parents. They can thus be interpreted as “Type A” school effects: “the difference between a child’s actual performance and the performance that would have been expected had the child attended a ‘typical school’” (Raudenbush and Willms 1995:209). Learning inequality emerges when high-SES parents are able to send their children to schools with the largest Type A effects, “regardless of whether that school’s effectiveness derives from the superb practice of its staff, from its favorable student composition, or from the beneficial influence of the social and economic context of the community in which the school is located” (Raudenbush and Willms 1995:310).
From a policy perspective, however, it is relevant to know how the allocation of resources to schools might affect learning inequality. In further analyses, we therefore look at the association between family background and specific school resources using random effects rather than school fixed effects. The random-effects approach allows us to assess how individual school characteristics (e.g., student-to-teacher ratios, school infrastructure) are associated with students’ learning outcomes while accounting for the dependence of students within the same school. Moreover, we analyze cross-national differences by replicating the models described earlier for each individual country; findings are discussed in the Results section.
Measures
Learning outcomes
Our main measure of learning outcomes is the mathematics test score. PASEC standardized the test scores to have a mean of 500 and a standard deviation of 100 across all pupils in the 10 countries. As a supplement, we replicate our analyses using the reading test scores (see online Appendix C). Because the results of both sets of analyses are substantively similar, we focus on interpreting the math results in the main text of the article and briefly discuss the findings from the reading analysis at the end of the Results section.
Family SES
Our main independent variable is family SES. Following standard practice in educational research (Martinez, Naudeau, and Pereira 2017), we define SES as a composite indicator of a family’s social, economic, and cultural resources. Each of these may have distinct and independent effects on children’s educational outcomes, although they tend to be strongly correlated. The components of SES that are considered here are an index of household assets, such as a television and a fridge, which is provided by PASEC; father’s and mother’s literacy; and the number of books at home. Each of these variables was reported by the pupils; their distribution can be observed in online Appendix Table 1. For analytical purposes, we obtained a composite indicator of SES for each pupil using principal component analysis. We then divided the composite family SES into country-specific quintiles to account for potential nonlinearity in the SES–learning gradient. There is substantial variation in SES both between and within countries. Congo (Brazzaville) and Cameroon scored highest on the SES index (see Table 2), which is in line with their level of gross domestic product per capita.
Descriptive Statistics for Pupil-Level Variables, by Country (Weighted).
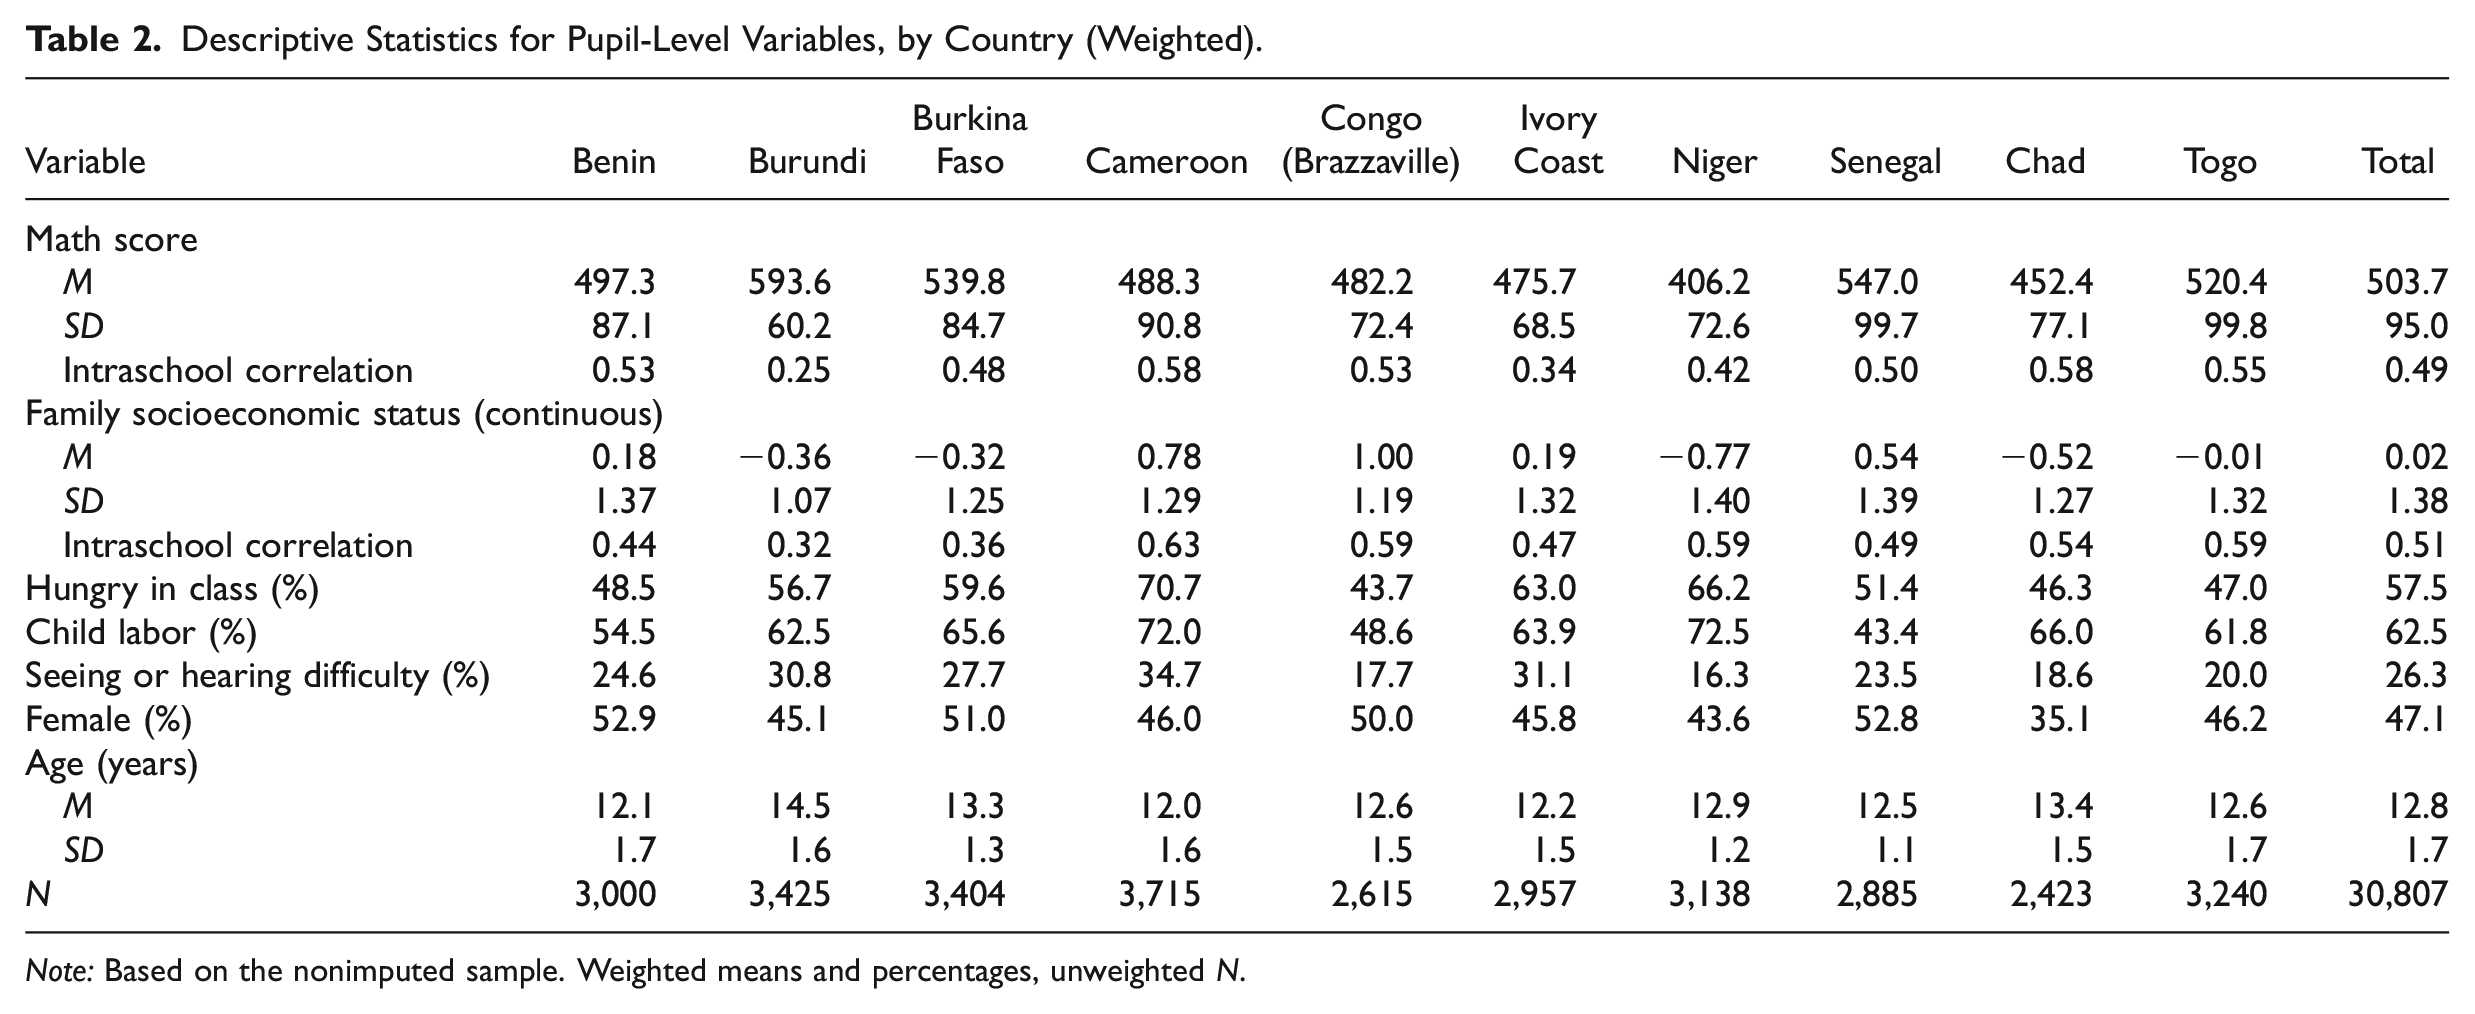
Note: Based on the nonimputed sample. Weighted means and percentages, unweighted N.
Health and well-being
Unfortunately, PASEC does not provide direct measures of child health. Instead, we use three different proxies for child health and well-being, each of which is reported by the pupils themselves. The first indicator, “seeing/hearing difficulty,” equals 1 when the child has a hearing difficulty or has a visual difficulty that is not corrected by eyeglasses. The second indicator, “hungry,” equals 1 when the child is often hungry in school. The third indicator, “child labor,” equals 1 when the child frequently engages in nondomestic work outside school (farming, commerce, or physical labor). Across the sample, 57.5 percent of children were often hungry in school, 62.5 percent often engaged in some form of work, and 26.3 percent reported a seeing or hearing difficulty (see Table 2). 3 As discussed in the conceptual framework, untreated seeing/hearing difficulties, food insecurity, and child labor are expected to be negatively correlated with SES and to have a negative impact on learning.
School quality
In our main models, we include school fixed effects to control for all observed and unobserved school-level characteristics (for example, the skills of teachers). In supplementary models, we also look at the role of specific school resources related to quality, including teacher’s education level, gender, experience, and degree of absenteeism; the pupil–teacher ratio; and composite indices for classroom resources (such as textbooks) and school facilities (such as latrines) (see online Appendix Table 2 for summary statistics). We also include two binary variables indicating whether the sampled classroom was composed of multiple grades and/or was taught in shifts. Finally, we include an indicator for private schools. There is considerable variation in the share of private school attendance, ranging from 2.7 percent in Niger to 36.2 percent in Congo (Brazzaville) (see online Appendix Table 2). In interpreting the findings on private schooling, it is important to keep in mind that the PASEC sample is drawn from the official school register and thus excludes unregistered private schools, which are likely to attract more low-SES students.
Child demographic characteristics
All models control for pupil’s gender and age. Overage enrollment and grade repetition are highly common in sub-Saharan Africa, so that the sampled grade 6 pupils encompass a wide age range.
Results
Descriptive Findings
Descriptive statistics for key pupil-level variables are provided in Table 2. There was substantial variation in learning between as well as within countries in our sample of grade 6 pupils, as evidenced by the means and standard deviations for mathematics performance. Niger had the lowest average math score (406 points, almost one standard deviation below the mean), while Burundi had the highest (593 points). The table also highlights the magnitude of the learning crisis in the region: In 7 out of the 10 countries, the average performance lies below PASEC’s grade 6 minimum proficiency threshold of 521, suggesting that most pupils do not master even the most basic elements of the curriculum. In interpreting country differences, it is important to remember that exclusion rates differ substantially between countries (Table 1). It is possible that some countries appear to have lower learning outcomes because of their recent efforts to provide universal access to primary schooling (Taylor and Spaull 2015).
In addition to means and standard deviations, we calculated the intraschool correlation of mathematics performance, which can be interpreted as the degree of between-school inequality in learning. This correlation averaged 0.55 across the 10 countries, which is very high. To provide context, the average in the Trends in International Mathematics and Science Study data—which cover a wide range of middle- and high-income countries—is 0.26 (Bashir et al. 2018:82). There may be various reasons for the clustering of students of similar skill levels in the same schools, which we will discuss in more detail in the upcoming sections.
We also calculated the intraschool correlation of SES, which is a common measure of school segregation. Table 2 shows that school segregation was very high in the countries we study. For example, the correlation in SES between two pupils who attended the same school was around 0.6 in Cameroon, Chad, and Togo, and the average was 0.49 across all countries. Again, this is much higher than what is typically observed in the OECD (OECD 2013:107). When children from disadvantaged backgrounds are clustered in the same schools, this is likely to reinforce social background effects on learning, especially when school resources are unequally distributed.
Figure 2 plots the average mathematics score of pupils in each socioeconomic quintile. In each of the 10 countries, a positive SES–learning gradient can be observed for the pupils in our sample, although its magnitude differs considerably. The difference in mathematics performance between the bottom and the top quintiles varied from 119 points (1.2 standard deviations) in Cameroon to 21 points in Burundi. The association between SES and learning appears to be nonlinear in several countries, with larger gaps between the top and the middle quintiles than between the bottom and the middle quintiles. In Niger, Chad, and the Ivory Coast, even the top SES quintile performed below the minimum threshold. In Burundi, on the other hand, performance was high regardless of socioeconomic origin: Even the bottom SES quintile in Burundi scored higher than the top quintile in any of the other countries.
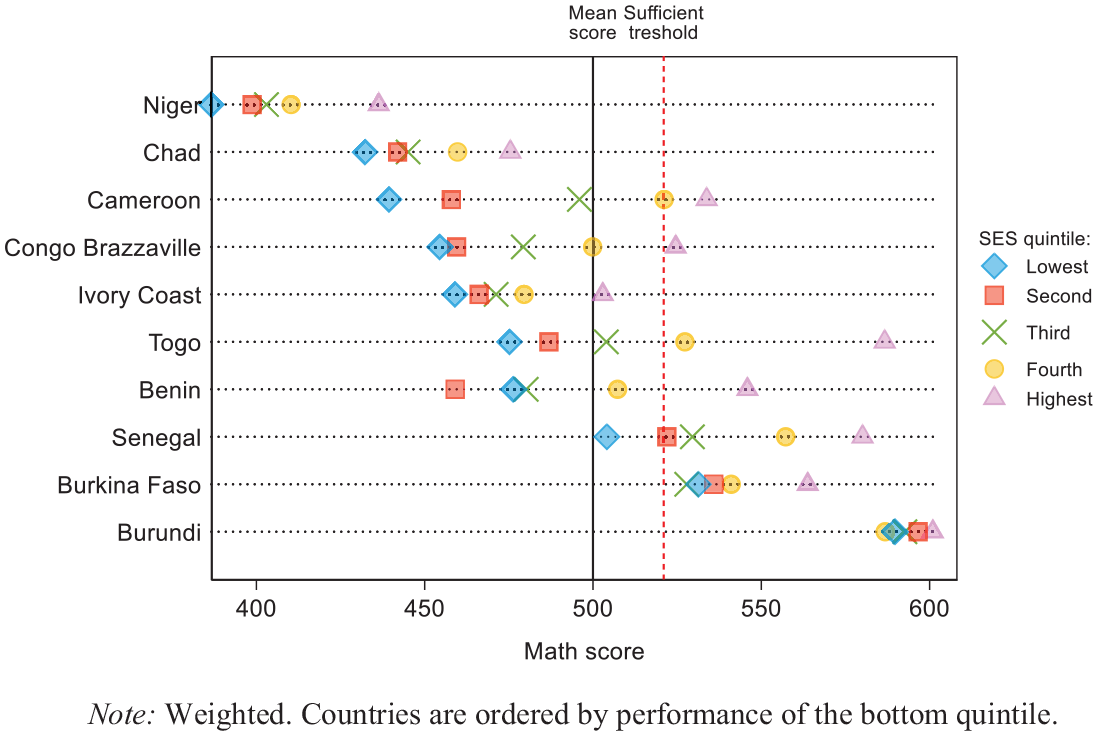
Mean mathematics performance, by country and socioeconomic status (SES) quintile.
Socioeconomic inequality in mathematics performance
We assessed the overall degree of learning inequality among school-going children in the region (line c in Figure 1) by regressing mathematics performance on SES quintiles in a pooled model, controlling for the gender and age of the pupil as well as country fixed effects (Model 1 in Table 3). In line with Figure 2, we observed the strongest effect for the top quintile. On average, pupils in the highest SES quintile scored 61 points (0.6 standard deviations) above those at the bottom (p < .001), while those in the middle quintile scored 18 points higher (p < .001). Thus, in our sample of school-attending children, it is not the poorest pupils “falling behind” but, rather, the relatively better-off pupils outperforming the others, including those in the middle of the SES distribution. Moreover, girls performed slightly worse than boys on average (−4.6, p < .001), and performance decreased with age. The latter observation is common in studies of this kind, since overage enrollment is generally a sign of low ability and/or irregular attendance (Lewin 2009).
Pooled Models for Mathematics Performance.
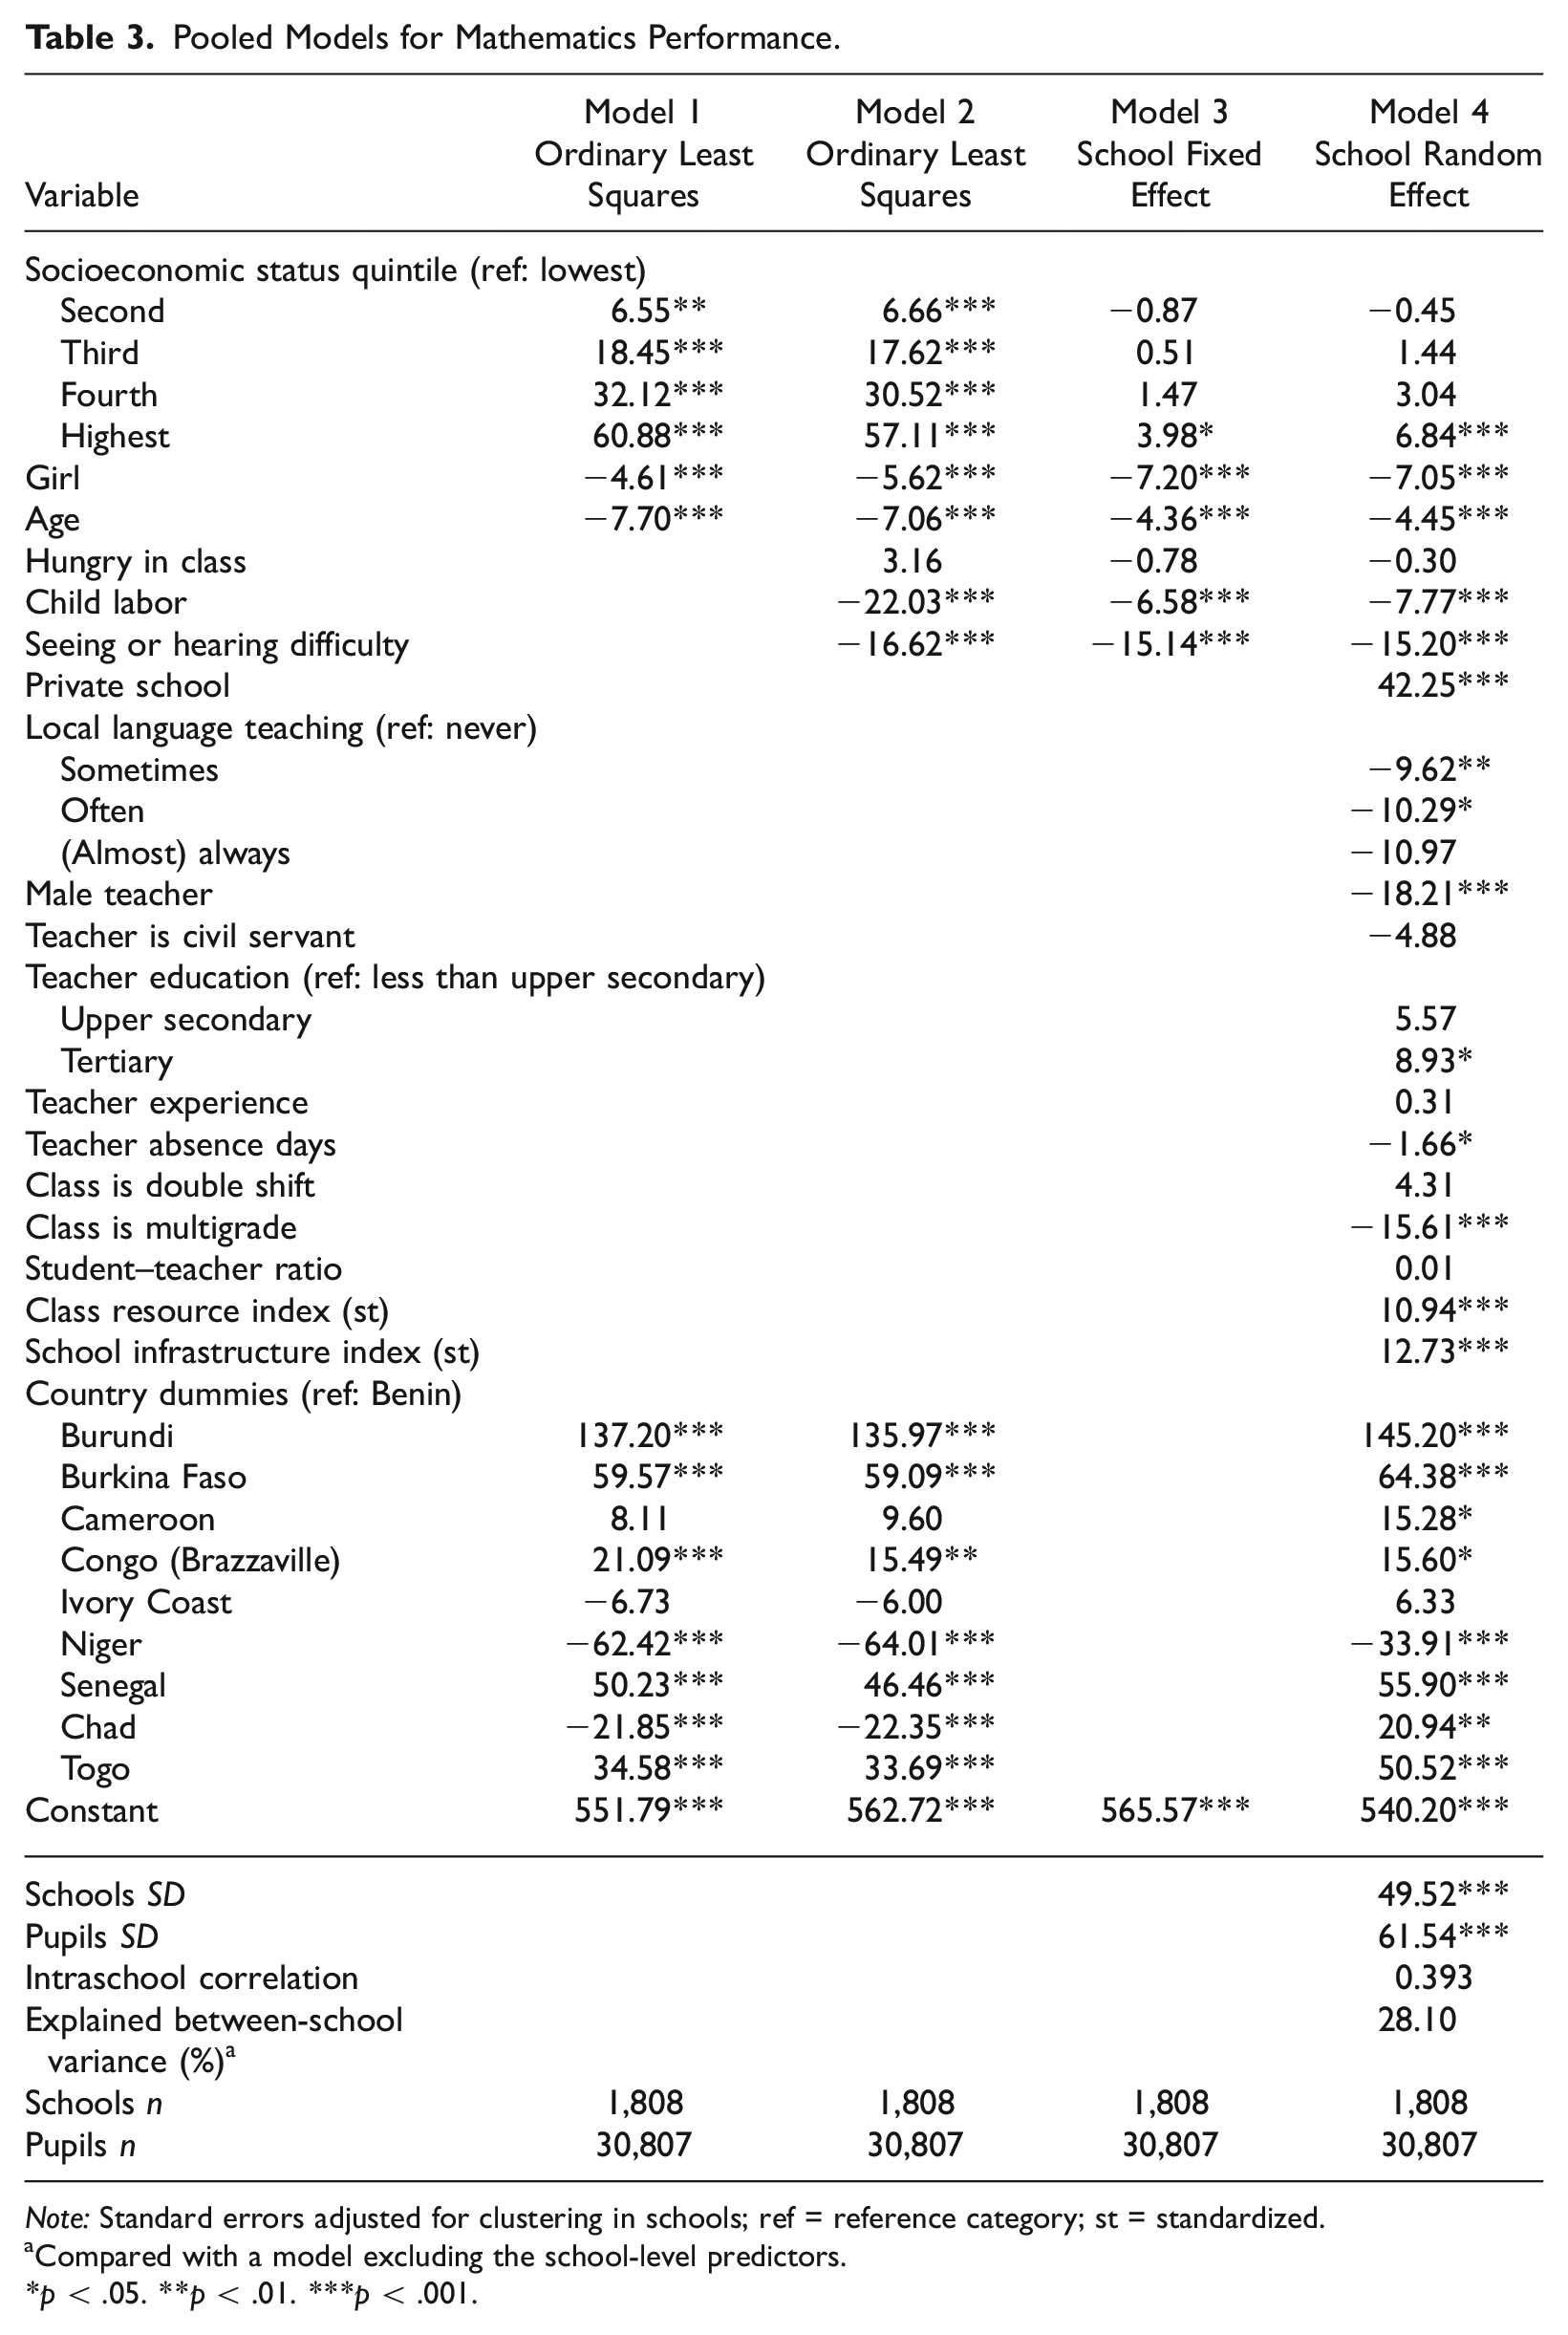
Note: Standard errors adjusted for clustering in schools; ref = reference category; st = standardized.
Compared with a model excluding the school-level predictors.
p < .05. **p < .01. ***p < .001.
Health and Well-Being
In a second step, we added the proxies for health and well-being (Model 2). Because of the well-established associations between poverty, health, and cognitive development in early childhood, we expect these indicators to partially mediate the association between SES and learning (the a*b path in Figure 1). Our indicators for child labor and untreated visual or hearing difficulty had a substantial negative effect on learning, which is in line with previous research. The effect of being hungry in class (controlling for other background variables) was small and not significant, which may result from the misinterpretation of this question by the child respondents, “hunger” being a rather subjective concept. Contrary to our expectations, however, including these indicators explained very little of the association between SES and learning: The difference between the bottom and the top quintiles decreased by only 3.8 points and between the bottom and the fourth quintiles by 0.8 points. Further analysis shows that the association between family SES and child health and well-being (path a in Figure 1) was rather weak in most countries (results not shown). 4
School Quality
In a further specification, we include the school fixed effects (SFE j ), which incorporate all observed as well as unobserved school-level factors that may explain learning differences between schools (Model 3). As discussed in the previous section, this may also include the influence of the peer group or the community in which the school is based. Assuming that pupils’ initial allocation to schools was not based on ability, the difference between the SES coefficients in Model 2 and Model 3 reflects the extent to which learning inequality is due to its association with school quality (the d*e path in Figure 1). Table 3 clearly shows that school quality, broadly defined, explains most of the association between SES and mathematics performance. The differences between the first, second, third, and fourth SES quintiles become insubstantial when controlling for school effects, while the difference between the top and the bottom quintiles is reduced from 57 to 4 points, a 93 percent decrease. This is a striking result, which demonstrates that differences in the quality of schools attended by “poor” and “rich” children explain most of the gap in their learning outcomes. Our findings thus suggest that schools are the major driver of learning inequality in this low-income context. We discuss this observation in more detail in the following sections.
The direct effect of SES (ć in Figure 1) has a particular interpretation in the school fixed effect model: It is the average difference between two pupils of different backgrounds who attend the same school. Table 3 shows that this difference is small or negligible in our sample. Again, these results stand in stark contrast to findings from the OECD, where substantial learning gaps can generally be observed between low- and high-SES pupils even when they attend the same school (Marks, Cresswell, and Ainley 2006). In interpreting these findings, it is important to keep in mind that within-school variation in SES is comparatively smaller in francophone Africa than in the OECD—in other words, rich and poor children are less likely to attend the same schools. In the next section, we examine whether the effects observed thus far differ between countries.
Cross-National Differences
The previous sections looked at overall trends across the 10 countries, which may mask cross-national variation in the direct and indirect effects of SES on learning. We therefore ran the models that test our key hypotheses separately for each country. Figure 3 provides a concise summary of the findings by plotting the difference in mathematics performance between the bottom and the top SES quintiles under different model specifications: Model 1 includes only controls for age and gender, Model 2 additionally includes the health and well-being indicators, and Model 3 additionally includes the school fixed effects. The full results from these models are presented in online Appendix Table 3.
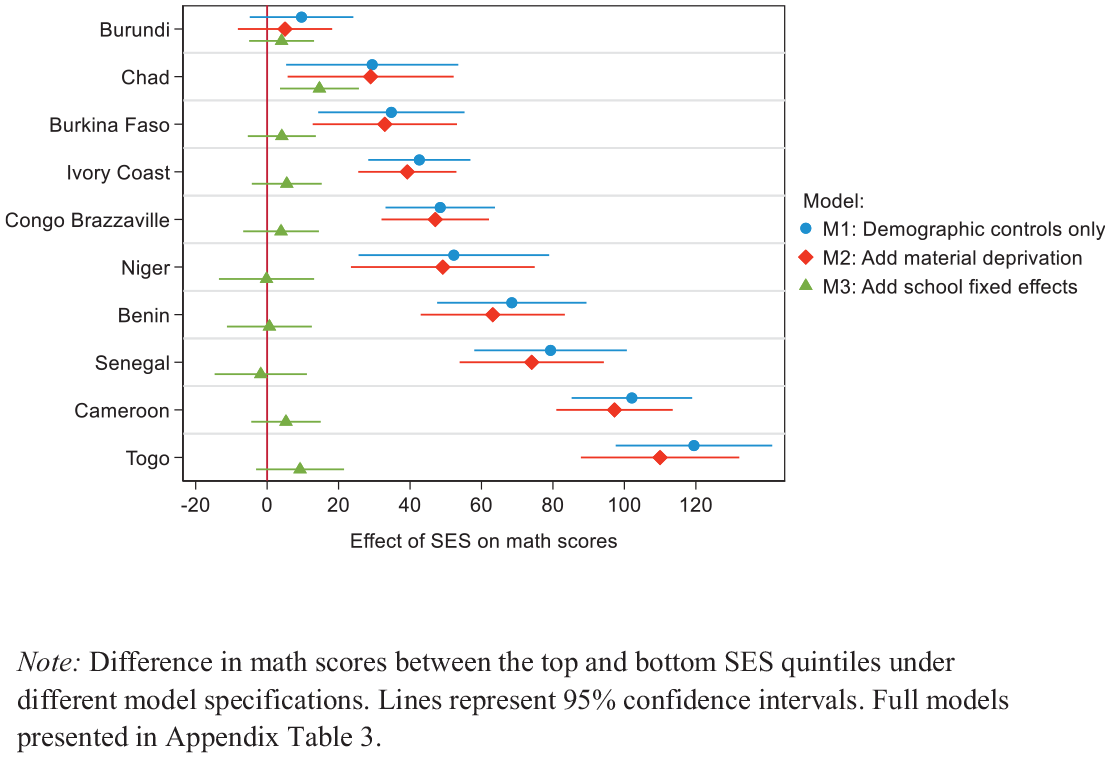
Effect of socioeconomic status (SES) on mathematics performance, by country.
Our findings show that the key conclusion from the previous section—that school fixed effects explain almost the entire association between SES and learning—holds in each of the 10 countries, although there is substantial variation between countries in the overall level of learning inequality. Figure 3 shows that SES is a positive and significant predictor of mathematics performance among grade 6 pupils in each of the countries under study. The total effect of SES is largest in Togo and Cameroon, where the difference in learning between the top and the bottom SES quintiles is equivalent to a standard deviation, and smallest in Burundi, followed by Chad, Burkina Faso, and the Ivory Coast. As in the pooled model, our health and well-being indicators explain very little of the association between family SES and learning. In each country, however, the SES–learning gradient largely disappears when comparing pupils in the same school. Only in Chad can we observe a significant effect of family background after controlling for school fixed effects, but it amounts to a fraction of the total value.
Our findings thus suggest that differences in the quality of schools attended by poor and wealthier children drive cross-national variation in learning inequality among grade 6 pupils. Inequality is high when poor children are clustered in low-quality schools. This point is further illustrated in Figure 4, which plots the average school fixed effect of pupils in the bottom and the top SES quintiles. The school fixed effects are extracted after controlling for pupil family background and child health and well-being. Schools with a positive fixed effect thus perform better than what would be expected based on the composition of their student body, while those with a negative fixed effect perform worse. In the absence of prior selection on ability, school fixed effects can therefore be interpreted as an omnibus measure of school quality (R. Freeman and Viarengo 2014). In all countries, pupils with low-SES parents attend lower-quality schools than their high-SES peers. The difference is particularly large in countries such as Togo and Cameroon, which have a highly segregated school system and high levels of learning inequality. School quality is more equally distributed in Burundi, Chad, and Burkina Faso, where learning inequalities are consequently lower. Not surprisingly, Burundi and Burkina Faso also have the lowest levels of school segregation, as measured by the intraschool correlation of family SES (see Table 2).
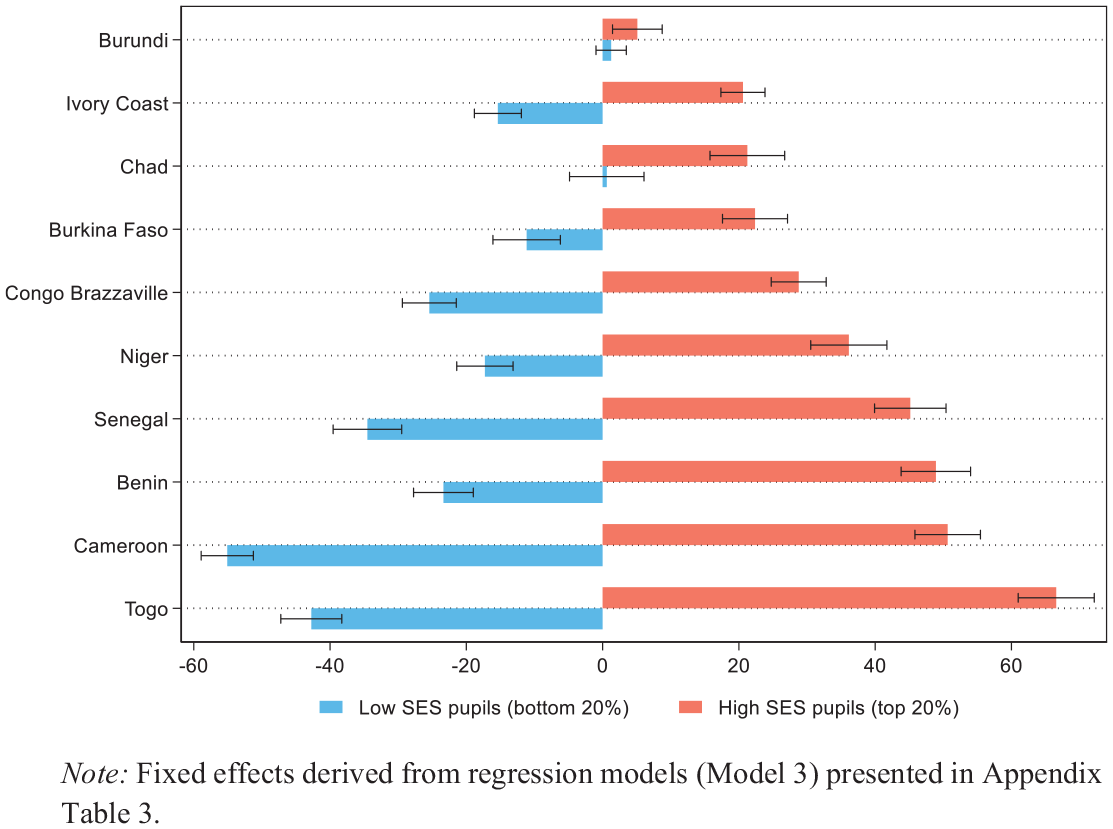
Average school fixed effect, by socioeconomic status (SES) quintile.
It is also noteworthy that gender differences vary considerably between countries. In Benin and Burundi, girls outperform boys in math, but the opposite is true in countries such as Chad, Congo, and Niger. In the next section, we explore the role of schools in more detail by examining differences in school resources between pupils from different social backgrounds.
The Role of Schools in Learning Inequality
In the previous sections, we have shown that school effects explain most of the association between SES and learning outcomes among grade 6 pupils in each of the countries under study. However, we still do not know what makes the schools that high-SES children attend more effective. We therefore turn our attention to the specific school characteristics that may contribute to socioeconomic inequality in learning, using the school-level variables collected by PASEC. Returning to the pooled model presented in Table 3, we replace the school fixed effects in Model 3 with random effects, which we then predict using a set of variables related to teacher characteristics (education level, absenteeism, experience, gender, contract type, and use of local language in class), school resources and practices (double-shift teaching, multigrade classes, pupil–teacher ratio, index of classroom resources, index of school assets), and school type (public or private). In combination, these variables explain about 28 percent of the between-school variation in learning.
Table 3 shows that (registered) private schools outperform public schools by almost half a standard deviation, even when controlling for pupil background and school resources. School resources also play an important role: Standard deviation increases in the classroom resource index and the school infrastructure index are associated with higher math scores by 11 and 13 points, respectively. Consistent with expectations, performance is better when the teacher is more educated and worse when classes combine pupils from multiple grades. Other school characteristics, such as double-shift teaching, the pupil–teacher ratio, and teacher experience, appear to play a comparatively less important role in predicting learning outcomes.
Now that we have established which school-level factors are important for learning in our sample, we can assess their distribution across poor and rich pupils (defined here as the bottom and the top SES quintiles). In Figure 5, we plot socioeconomic inequality in three selected school quality indicators: attending a private school, having access to math textbooks, and attending a school without latrines. The latter two have been selected because they exemplify the classroom resources and school infrastructure indices described earlier, and their effect on school performance has been well established (Adukia 2017; Frölich and Michaelowa 2011).
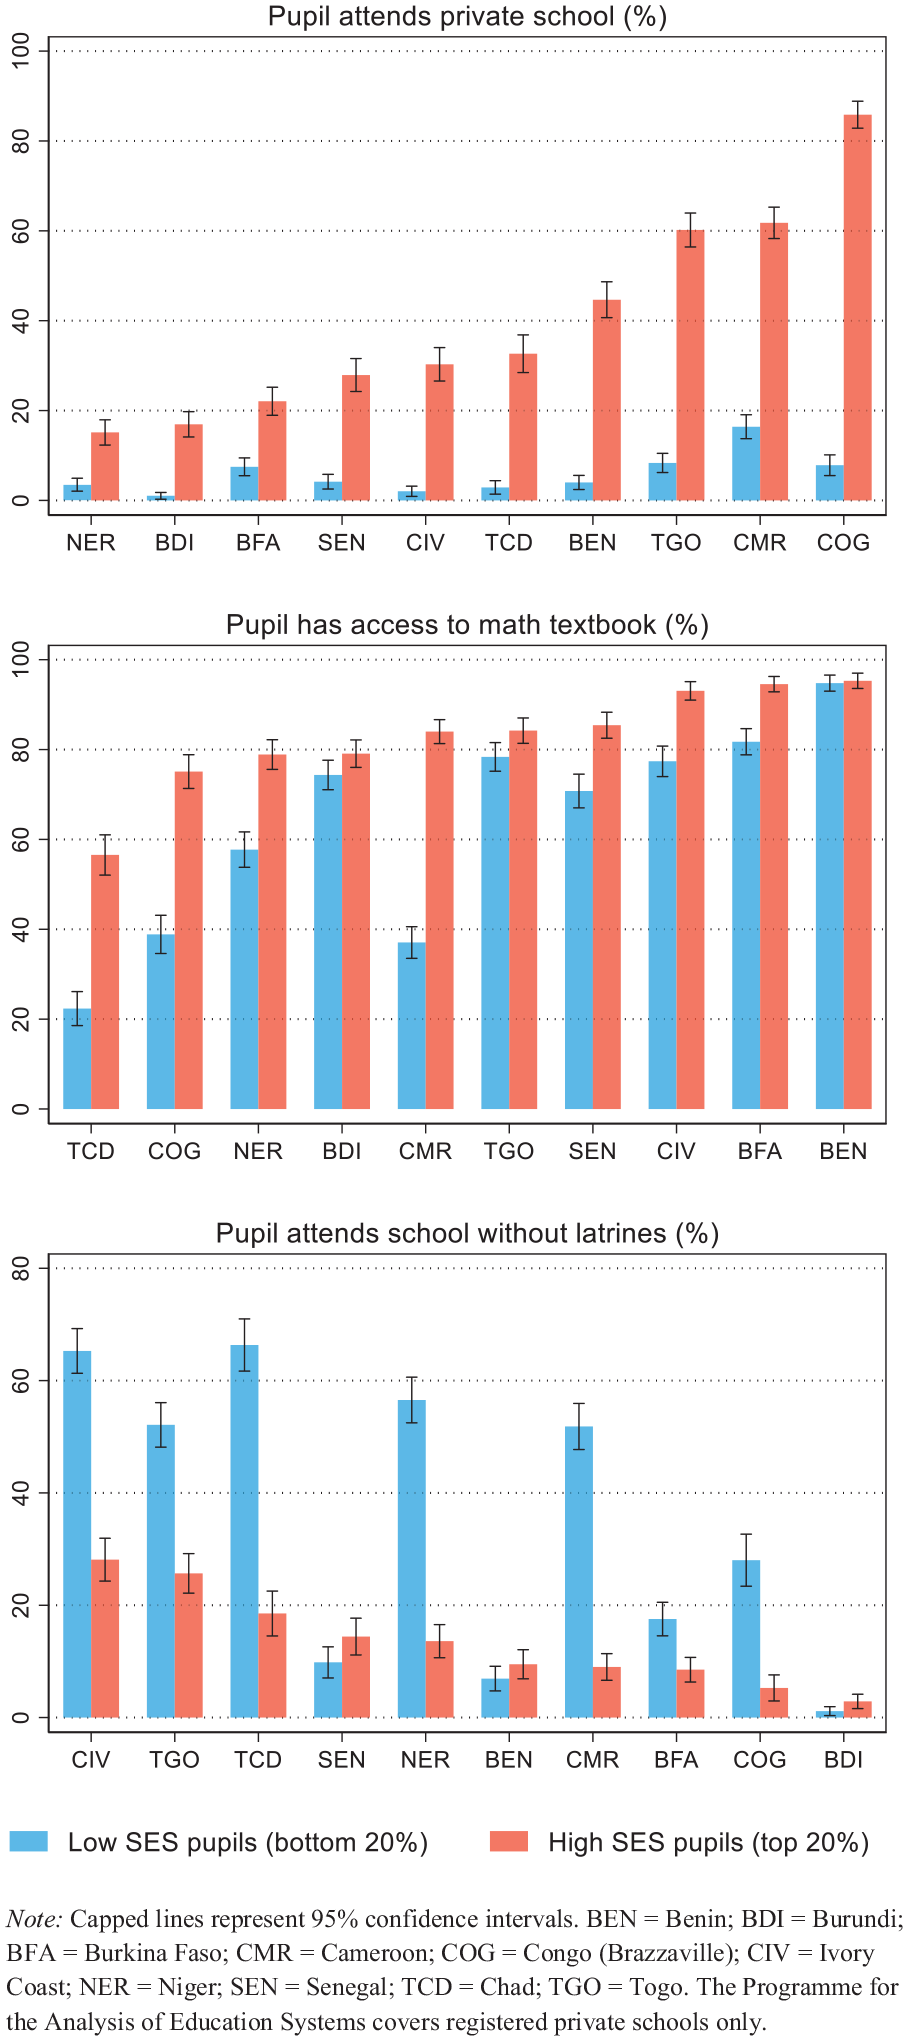
Distribution of educational resources, by socioeconomic status (SES) quintile.
Inequality in access to private schooling is particularly striking. In Benin, for example, 45 percent of the top-SES pupils attend a private school, compared with 4 percent of the bottom-SES pupils. The corresponding figures for Congo (Brazzaville) are 86 percent and 8 percent. It is important to note, though, that these figures might be different if informally operated private schools had been represented in our data. Access to textbooks is slightly less stratified, although noticeable gaps between poorer and richer students can be observed, particularly in countries where many pupils do not have textbooks. Finally, it can be observed that most high-SES pupils attend schools with latrines, but this is often not the case for their poorer counterparts.
As a supplement (online Appendix C), we replicated our main analyses with reading performance as the outcome variable and find a substantially similar set of results. In particular, we find a substantial gap in reading skills between low- and high-SES children, most of which is mediated by the school fixed effects.
Discussion
Creating equal learning opportunities for all children is a core objective of education policy. The academic discourse around the “learning crisis” in the global South has largely overlooked socioeconomic inequalities in learning, however. In part, the focus on school characteristics—rather than family background—can be retraced to classic work by Heyneman and Loxley (1982, 1983), who argued that social origin is comparatively less important for learning outcomes in low-income countries. We argue, however, that there are important reasons to believe that family SES will affect school performance, not only directly but also indirectly through child health and well-being and differential access to quality schooling.
We used a unique data set on educational performance, family background, and school characteristics in 10 francophone African countries—including some of the poorest countries in the world—to study socioeconomic inequality in learning. We found that grade 6 mathematics and reading performance was not only low but also highly unequally distributed between children from poor and wealthier backgrounds. A mediation analysis showed that most of the effect of family background on learning outcomes could be explained by differences in school quality. Schools in sub-Saharan Africa reinforce inequality because they are highly socially segregated and resource differences between schools are large (for similar observations in South Africa, see Smith 2011). In contrast, indicators of child health and well-being explain relatively little of the SES–learning association among grade 6 pupils, even though they are important determinants of learning outcomes in their own right.
Our findings also suggest that the direct effect of SES is limited among pupils in our sample: We found little or no difference between children from different social origins who attended the same school. The fact that rich and poor children who attend the same school have similar test scores strengthens our argument that learning inequality results from the unequal distribution of school quality rather than from differences in ability that originate in the family domain. In further analyses, we assessed which school characteristics are particularly important for learning inequality and showed that access to better-resourced schools and private schools is highly socially stratified.
Our findings confirm Heyneman and Loxley’s (1982, 1983) observations on the importance of school quality as a determinant of learning outcomes in low-income contexts. However, we qualify this perspective in an important way: Although the effect of family background is limited once the effect of schools has been accounted for, family background largely determines which school a child attends. Ignoring the association between family background and school quality omits an essential pathway through which socioeconomic (dis)advantage affects children’s learning—and therewith their life chances.
These findings have clear implications for education policy. Improvements in school enrollment are worth little when pupils do not learn, and our findings show that it is often the most disadvantaged students who learn the least. It is encouraging, however, that SES-based learning gaps are generally negligible when comparing pupils who attend the same school, because it suggests that these gaps are neither biologically nor socially determined and may be amenable to policy intervention. An obvious way to improve equality would be to ensure a more equitable distribution of resources across schools. Moreover, national initiatives to “raise the floor” in learning can be a particularly effective way to improve overall learning outcomes and reduce inequality (Wagner 2018).
The experience of Burundi could serve as an example in this regard: Even though it is the poorest country in our data set, it has the highest overall mathematics score and the lowest degree of socioeconomic inequality (Figure 3). 5 Not surprisingly, school segregation and quality disparities between schools are much less pronounced in Burundi than in the other countries in the study. Moreover, Burundi has comparatively high levels of educational spending, and pupils are taught in the local language—as opposed to French—in the first four years of primary school, which has been associated with improved learning outcomes in other contexts (PASEC 2016).
An important limitation of the analyses presented here lies in the cross-sectional nature of the PASEC survey. Learning results from the gradual accumulation of skills over the early life course and starts well before the age of school entry (Heckman 2006; Merry 2013). Moreover, our measures of child health and well-being did not always have the expected association with SES and learning, which may be due to errors in self-reports by children. More objective measures of health, such as markers for stunting or anemia, might have a stronger association with SES and learning outcomes. This type of data is generally not collected in large-scale educational assessments, and a useful area of further research would be to integrate biomarkers into research on education and learning outcomes in low-income settings. A final limitation of our school-based sample is that we lack information about school-aged students who are not in school, because they either dropped out before grade 6 or never attended school. This means that our estimates of socioeconomic inequalities in learning are likely to be conservative, given that low-SES students are more likely to be out of school (G. Jones and Ramchand 2016; Lilenstein 2018; Spaull and Taylor 2014). Poor children are thus doubly disadvantaged: They are less likely to attend school, and when attending, they are less likely to learn. Future research could assess the relative contributions of differential exclusion and differences in school quality to overall inequalities in learning.
These limitations notwithstanding, our findings contribute to a growing literature on the learning crisis in the global South (Bold et al. 2017; Glewwe and Muralidharan 2016; Kremer et al. 2013) by showing how family background and school quality interact to produce unequal learning outcomes. Future research on educational performance in Africa and other low-income contexts could further develop this perspective by analyzing how learning inequality develops over the primary school career and beyond. The conceptual framework developed in this article should be applicable to other low-income regions, as well, and it would be fruitful to explore whether the role of families and schools in shaping learning inequality is different in other parts of the world.
Supplemental Material
GruijtersBehrman_AppA.ed_RG-1 – Supplemental material for Learning Inequality in Francophone Africa: School Quality and the Educational Achievement of Rich and Poor Children
Supplemental material, GruijtersBehrman_AppA.ed_RG-1 for Learning Inequality in Francophone Africa: School Quality and the Educational Achievement of Rich and Poor Children by Rob J. Gruijters and Julia A. Behrman in Sociology of Education
Supplemental Material
GruijtersBehrman_AppB.ed_RG – Supplemental material for Learning Inequality in Francophone Africa: School Quality and the Educational Achievement of Rich and Poor Children
Supplemental material, GruijtersBehrman_AppB.ed_RG for Learning Inequality in Francophone Africa: School Quality and the Educational Achievement of Rich and Poor Children by Rob J. Gruijters and Julia A. Behrman in Sociology of Education
Supplemental Material
GruijtersBehrman_AppC.ed_RG – Supplemental material for Learning Inequality in Francophone Africa: School Quality and the Educational Achievement of Rich and Poor Children
Supplemental material, GruijtersBehrman_AppC.ed_RG for Learning Inequality in Francophone Africa: School Quality and the Educational Achievement of Rich and Poor Children by Rob J. Gruijters and Julia A. Behrman in Sociology of Education
Footnotes
Acknowledgements
We would like to thank Abigail Weitzman, Antoine Marivin, Jere Behrman, Luca Pesando, Mónica Caudillo, Per Engzell, and Ricardo Sabates for their valuable comments and suggestions.
Research Ethics
Supplemental Material
Supplemental material is available in the online version of this journal.
Notes
Author Biographies
References
Supplementary Material
Please find the following supplemental material available below.
For Open Access articles published under a Creative Commons License, all supplemental material carries the same license as the article it is associated with.
For non-Open Access articles published, all supplemental material carries a non-exclusive license, and permission requests for re-use of supplemental material or any part of supplemental material shall be sent directly to the copyright owner as specified in the copyright notice associated with the article.