
Abstract
Cycling is an environmentally sustainable social practice that contributes to liveable cities and provides affordable and healthy transport. People with lower education could particularly benefit from cycling, as they tend to fare worse regarding finances and health. However, in bivariate analyses, those with lower education cycle less. This article discusses the social meaning of cycling and investigates whether the education–cycling association holds after accounting for (1) confounders and (2) factors that determine decision leeway between different transport modes. I analyse approximately 80,000 short-distance trips (0.5–7.5 km) reported by 28,000 working-age individuals from cities in Germany using multilevel linear probability regression models. Results support that higher education systematically and substantially increases the propensity to cycle. This education gap implies major untapped potential for environmental sustainability, that current pro-cycling policies in cities disproportionally favour the highly educated and that cycling patterns contribute to inequalities in finances and health.
Keywords
Introduction
Cycling has several individual and societal advantages. At the macro-level, cycling contributes to environmental sustainability because it neither emits CO2 nor contributes to noise pollution, and because it is space-efficient (Gössling et al., 2016; Heinen et al., 2010). Further, cycling can contribute to liveable and attractive cities (Gehl, 2013; Larsen, 2017). For individuals, particularly in urban settings, going by bike is often just as fast or even faster than taking the car (Tranter, 2012). Cycling improves physical and mental health, and the World Health Organization promotes cycling as a way to get daily physical activity (Götschi et al., 2016; Martin et al., 2014; World Health Organization, 2019). People with lower education might particularly benefit from this means of transport, as they have, on average, lower incomes and poorer health (Hendi, 2017; Mäki et al., 2013; Zajacova et al., 2021). However, bivariate analyses conducted in Germany show that people with lower education use bicycles considerably less than people with higher education, and that this gap is growing (Hudde, 2021; Nobis, 2019).
This article hypothesises that, under given opportunities and constraints, higher education increases people’s propensity to choose cycling. This hypothesis is derived from a discussion of the social meaning of cycling: it is part of a habitus, is subject to social norms and may signal a certain social status and morality. I analyse data from the large-scale, nationally representative study Mobility in Germany 2017, which contains information on individuals and the trips they made on a specific reference day. The subpopulation analysed is restricted to short-distance trips (0.5–7.5 km) taken by working-age people (25–65 years) who live in German cities with at least 50,000 inhabitants. The analytical sample consists of approximately 80,000 trips reported by approximately 28,000 individuals. After thorough descriptive analyses, I first run multilevel linear probability models that account for confounding variables. Second, to test the role of education under given opportunities and constraints, I hold constant factors such as trip or city characteristics that might be influenced by education and then determine people’s decision leeway between different modes of transport.
Previous knowledge regarding the relationship between education and cycling is limited. Some studies find a positive association between education and active travel (Brondeel et al., 2016; Buehler et al., 2020; Carse et al., 2013; Rachele et al., 2015; Scheepers et al., 2013). However, these studies have limitations. Some are only of regional scope (Brondeel et al., 2016; Carse et al., 2013; Rachele et al., 2015); others focus on all forms of active travel and do not distinguish between cycling and walking (Brondeel et al., 2016; Scheepers et al., 2013) or they study various influences of mobility behaviour simultaneously and consequently give only limited attention to each of these (Brondeel et al., 2016; Buehler et al., 2020; Kreyenfeld and Konietzka, 2017; Rachele et al., 2015). Other studies in the field either focus on income or treat income and education as measures of the same underlying construct (e.g. socio-economic status or similar) and produce mixed results (Heesch et al., 2014; Heinen et al., 2010; Ryley, 2006). This is problematic because education and income are not interchangeable; they are different constructs and have different, partly opposite effects on behaviour, including health behaviour (Pampel et al., 2010; Spellerberg, 1996). Some studies focus on other main explanatory variables and include education as a control variable (e.g. Haustein et al., 2019). However, regression models should be designed to isolate the (causal) effect of one specific predictor variable. Interpreting the coefficients of control variables can lead to false conclusions (Keele et al., 2020). In sum and to the best of my knowledge, no thorough investigation of the education–cycling association based on large-scale, representative data is available.
The prevalence of cycling varies largely by country and city. In many countries (e.g. most Anglo-American countries), the national average indicates that only around one in 50 trips is taken by bicycle; however, in Denmark, it is almost one in five trips and in the Netherlands, more than one in four trips (Pucher and Buehler, 2008). In Germany, around one in nine trips is taken by bicycle (Nobis, 2019). Cycling shares also vary substantially between cities, even in the same region (Nobis, 2019). On balance, Germany scores high on cycling from a global perspective, but the example of its neighbour, the Netherlands, shows that there is major potential for growth.
This article makes a valuable contribution by demonstrating the large and consistent educational gap in cycling among German city residents. This educational disparity is relevant for at least three reasons. First, educational differences in cycling contribute to social inequalities in health and finances. Second, cities worldwide are making massive investments in cycling infrastructure and are, in many cases, redistributing public space in favour of cyclists and at the expense of motorists. If people with a high level of education benefit disproportionately from such changes, then cities’ pro-cycling moves amplify pre-existing social inequalities. Third, cycling can only fully contribute to overall sustainability goals (e.g. reducing CO2 emissions) if the cycling potential of all major social groups is used. In practical terms, understanding how education relates to bicycle usage may serve as a basis for interventions to boost cycling rates among those with lower education and thereby reduce health inequalities and create equitable and liveable cities while protecting the environment.
Background
Educational Differences and the Social Meaning of Cycling
A specific mode of transport is not just a means to get from A to B; there is a deeper social meaning underlying it (Green et al., 2012; Guell et al., 2012). The use of a specific transport mode and device is a social practice that is part of a habitus, is subject to social norms and signals a certain social status (Bourdieu, 1984; Frater and Kingham, 2020; Horton et al., 2016; Steinbach et al., 2011). The desire for social status is a fundamental human motive that drives people’s behaviour (Anderson et al., 2015). In fact, mobility is one of the major fields for the display of status: expensive cars are a key product of conspicuous consumption (i.e. the practice of consuming to attain and signal social status; Archer et al., 2007; Bagwell and Bernheim, 1996; Friehe and Mechtel, 2014; Veblen, 1899). Of course, to signal status, it is not enough to own the car; one must also use it so that others can see it. The symbolic meaning and attributed status of transport devices can vary greatly across temporal and spatial contexts and can differ between social groups. This is particularly true for cycling (Anderson et al., 2015; Frater and Kingham, 2020; Goodman et al., 2012; Horton et al., 2016; Steinbach et al., 2011).
In some social contexts, bicycles are considered a negative signal; they are associated with low status, particularly in contrast with cars. For instance, a qualitative study from London, where cycling rates are low but quickly growing, shows that some view cycling as low-status transport: ‘When you’ve made it, you buy a car, not a bicycle’ (Steinbach et al., 2011: 1126). In this context, people see bicycles as useful only for the ‘very poor’ or for children to play with (Steinbach et al., 2011). In the low-cycling context of New Zealand, adolescents experience peer pressure not to cycle, and they describe it as a ‘low-status’ or even ‘embarrassing’ activity (Frater and Kingham, 2020). It should particularly decrease cyclists’ social status if people interpret cycling as forced behaviour (e.g. because one cannot afford other means of transport). In such social contexts, if one wants to send a signal of high status and success that is easily understood by a large audience, a bicycle is not the device of choice.
In contrast, there are some social contexts in which bicycles serve as a positive signal, considered ethical and fashionable (Green et al., 2012; Horton et al., 2016; Steinbach et al., 2011). For example, young, educated people in India, many of them with high salaries in the IT sector, use bicycles for distinction. They aim to signal their environmental awareness, but they will only cycle if they can be confident that this behaviour is interpreted as a voluntary choice, if the bicycle ‘is expensive and if people around them know that they can buy a car if they want to’ (Anantharaman, 2017: 872). Cycling is an environmentally friendly or ‘green’ behaviour, and people may advertise green behaviour to present themselves as moral or ethical, and thereby achieve social status (Anantharaman, 2017; Green et al., 2012; Griskevicius et al., 2010; Kennedy and Horne, 2019; Paddock, 2016).
Based on these arguments, there are two related reasons why motives of meaning, signalling and social status might drive educational differences in cycling. Educationally distinct groups might differ concerning (1) the social meaning attached to cycling and (2) their levels of status anxiety, the worry that one is ‘in danger of failing to conform to the ideals of success’ (de Botton, 2004: 8). (1) refers to the question of which behaviour improves one’s status in a certain social context; (2) refers to the question of how much one feels the need to engage in status-increasing behaviour.
(1) Cycling likely has more positive connotations among the highly educated (Horton et al., 2016; Steinbach et al., 2011). According to the qualitative study from London, people with a more established social standing tend to see cycling as an active and healthy lifestyle choice and possibly as a means of bourgeois distinction. In contrast, people with a less established social standing tend to see cycling as low-status transport (Steinbach et al., 2011). Because eco-friendliness is a more important value among the highly educated, people with higher education might be more likely to gain status among their peers by exhibiting pro-environmental behaviour (Brick et al., 2017; Elliott, 2013; Griskevicius et al., 2010; Kennedy and Horne, 2019).
(2) People who score high on education – one of the major arenas of social stratification – are less likely to suffer from status anxiety. One behavioural response to status anxiety is conspicuous consumption. In line with this, previous research has shown that, at the same level of income, people with lower education spend more money on conspicuous consumption (Friehe and Mechtel, 2014). Thus, people with lower education and higher status anxiety might be less likely to ride a bicycle because it might signify that they have not ‘made it’ (or at least riding a bicycle may be seen as a missed opportunity to drive an expensive car, which symbolises success).
In sum, this social status perspective suggests that people with higher education might experience both higher gains and lower threats by cycling than people with lower education. This gives people with higher education a greater incentive to cycle.
Educational Differences, Potential Confounders and Differences in Constraints and Opportunities
It is possible, however, that any empirically observed difference in the cycling behaviour between education groups might not stem from the above-hypothesised differences in decision making. Instead, the educational differences could be attributed to (1) confounding variables that influence both education and cycling, or (2) overarching factors that are influenced by education and that determine which transport modes people can realistically choose from.
To assess the total effect of education on cycling, we need to hold potentially confounding factors constant. Potential confounding variables include gender and age. In many contemporary societies, including Germany, women tend to achieve higher educational levels than men. Gender differences in cycling depend on societal context: in most countries, men are substantially more likely to cycle than women; but in the relatively high-cycling countries, Denmark and Germany, this difference is small, and in the Netherlands, women are slightly more likely to cycle than men (De Haas and Hamersma, 2020; Heinen et al., 2010). In Germany, younger people have higher levels of formal education, and it seems plausible that age matters for cycling, even though reports on that association are ambiguous (Heinen et al., 2010).
To assess the effect of education on mobility decisions and get closer to the hypothesised mechanism, we further need to hold constant those factors that might be affected by education and determine the degree to which people can choose between different transport modes. Such factors exist at the level of the trip, individual and household, neighbourhood and city.
Trip Level
Education might affect how cyclable people’s trips are on average. I consider three characteristics that determine cyclability: distance, purpose and timing. Even within the sample distances of 0.5 to 7.5 kilometres, cycling is more appealing for shorter trips, and it is possible that people with lower education levels have, on average, longer trips (e.g. because they live farther away from the city centre). Cycling may be more tenable for trips for certain purposes (e.g. going to work during rush hour) than for others (e.g. grocery shopping or taking a child to a sports class). Regarding trip time, non-daytime hours might be less cycling-friendly, and it might be that people with lower education undertake more night trips if, for example, they are working in shifts.
Individual and Household Level
Education determines people’s income, which in turn affects mobility constraints and opportunities in various ways. For example, people with higher incomes can more easily afford cars and tend to live in wealthier cities and neighbourhoods that might also be more cycling-friendly. Empirically, findings on income and cycling are mixed (Heesch et al., 2014; Heinen et al., 2010; Ryley, 2006). Furthermore, education predicts people’s household and family constellation, which in turn impacts travel behaviour. For example, parents – particularly mothers – tend to decrease cycling after the birth of a child, and women with higher education tend to become mothers at older ages and have fewer children (Scheiner, 2014). Finally, activity status affects mobility demands, and those with higher education are more likely to be employed instead of being homemakers or in early retirement.
Neighbourhood Level
The neighbourhood we live in determines how far we need to travel to reach the city centre, supermarkets or leisure establishments and determines available travel alternatives. If all facilities for daily needs are within easy cycling distance, a cycling-based mobility pattern is possible (Schwanen et al., 2004). Neighbourhoods with good local supply may be popular, and people with higher education might be more likely to live there. Good local public transport might, on the one hand, enable a car-free life, which may, in turn, encourage cycling; however, it also might encourage the use of public transport instead of cycling. Topography also matters: hilliness is a major impediment for cycling (Heinen et al., 2010).
City Level
Cities differ in numerous characteristics, including size, topography, climate, mobility culture and cycling infrastructure (Goetzke and Rave, 2011; Klinger et al., 2013; Kuhnimhof and Wulfhorst, 2013). These characteristics determine the available transport options, and it might be that people with higher education are more likely to live in cycling-friendly cities.
Therefore, to get closer to the hypothesised mechanism and assess the effect of education on mobility decisions, one needs to hold constant the factors described above, which may determine the degree to which people can choose between different transport modes.
Data and Methods
Data
I analyse data from the large-scale, nationally representative study Mobility in Germany 2017 (Nobis and Kuhnimhof, 2018). This dataset is unique for its large sample size and detailed information on all respondents’ trips on a specific reference day. On average, each person reported approximately 3.0 trips, resulting in 733,167 reported trips by 189,940 individuals (43,375 additional individuals reported zero trips on their reference day, i.e. they stayed at home on that day). The dataset oversampled certain cities and areas; therefore, I apply survey weights at the individual level throughout all analyses.
Definition of the Subpopulation
The population from which the full sample is drawn is all trips made by persons living in Germany. The subpopulation to be analysed and generalised to in this work is limited to relatively short journeys of working-age persons living in cities. This increases the homogeneity of the subpopulation and therefore allows for simpler modelling strategies and improves the interpretability of the descriptive results.
Cycling patterns strongly differ between rural and urban areas, and it is mainly cities that have seen relevant increases in cycling recently (Hudde, 2021). I therefore focus on individuals living in cities with at least 50,000 inhabitants. At the individual level, I select the subpopulation of people who are of typical working age (25 to 64 years) to rule out the possibility that associations are mainly driven by either high cycling rates among those still in the educational system or by low cycling rates among people who are seniors. I do not consider job-related trips during working hours because in such cases people usually cannot choose the mode of transport themselves. Finally, I focus on trip distances between 0.5 and 7.5 kilometres, the range most suitable for cycling (Malone, 2016), which covers more than half of all trips (59.8%) in the sample. In this sample, educationally distinct groups do not differ in the share of trips that fall into this distance bracket.
Sample Selection
After the total of 189,940 mobile individuals with 733,167 reported trips is restricted to the subpopulation based on residence (nindividuals = 78,034; ntrips = 300,318), age (nindividuals = 46,004; ntrips = 190,438), non-work-related trips (nindividuals = 44,311; ntrips = 160,914) and trip distance, 44,311 individuals with 160,914 trips remain. I exclude 2.2% of observations due to a lack of information on personal or trip characteristics; 11.6% are excluded because detailed information on place of residence, and thereby the variables at the neighbourhood level, are missing (remaining: nindividuals = 28,835; ntrips = 82,645; a robustness check tests whether this restriction might lead to sample selectivity). For computational reasons concerning the last model with city-level fixed effects, I exclude observations from all cities with fewer than 30 observed individuals (3.3%). This leaves a total analytical sample of 27,933 individuals with 79,959 reported trips from 111 different large and medium-sized cities.
Method
To account for the hierarchical structure of the data and the oversampling of certain cities, all analyses are based on weighted multilevel linear probability models (LPMs). LPMs are generally more robust than logistic regressions, and the coefficients are easier to interpret. Thus, for binary outcomes, LPMs are often preferred to logit models (Battey et al., 2019; Hellevik, 2009). In these models, trips are nested within individuals, and random effects at the individual level are applied. All models are run within Stata’s survey framework, using the subpopulation option. For the multivariable analyses, three models are presented: the first (M1) is ‘empty’, that is, it includes no other predictor variables than education. The second model (M2) includes potential confounders, gender and age, and therefore aims to estimate the total effect of education on cycling. The third and final model (M3) controls for the factors that may be influenced by education and could affect how people can choose between different transport modes. This model thus differentiates the hypothesised effect of education on transport choices from the alternative explanation that observed behavioural differences might be due to education’s influence on overarching factors that determine people’s decision leeway between different modes of transport. This last regression model accounts for a third hierarchical level – individuals are nested in cities – and applies city-level fixed effects, which test whether the effect of education on cycling holds within cities.
All ordinal and categorical covariates are introduced with a dummy variable for each level. Continuous variables are broken down into smaller classes, each included as a dummy variable (see Table 1). This approach allows the most flexible modelling, and given the large sample, does not lead to overfitting.
Weighted multilevel linear probability models predicting whether a certain trip was taken by bicycle (= 1) or not (= 0). Trips are nested in individuals (M1 and M2), and additionally nested in cities (M3). Model M3 includes city-level fixed effects.
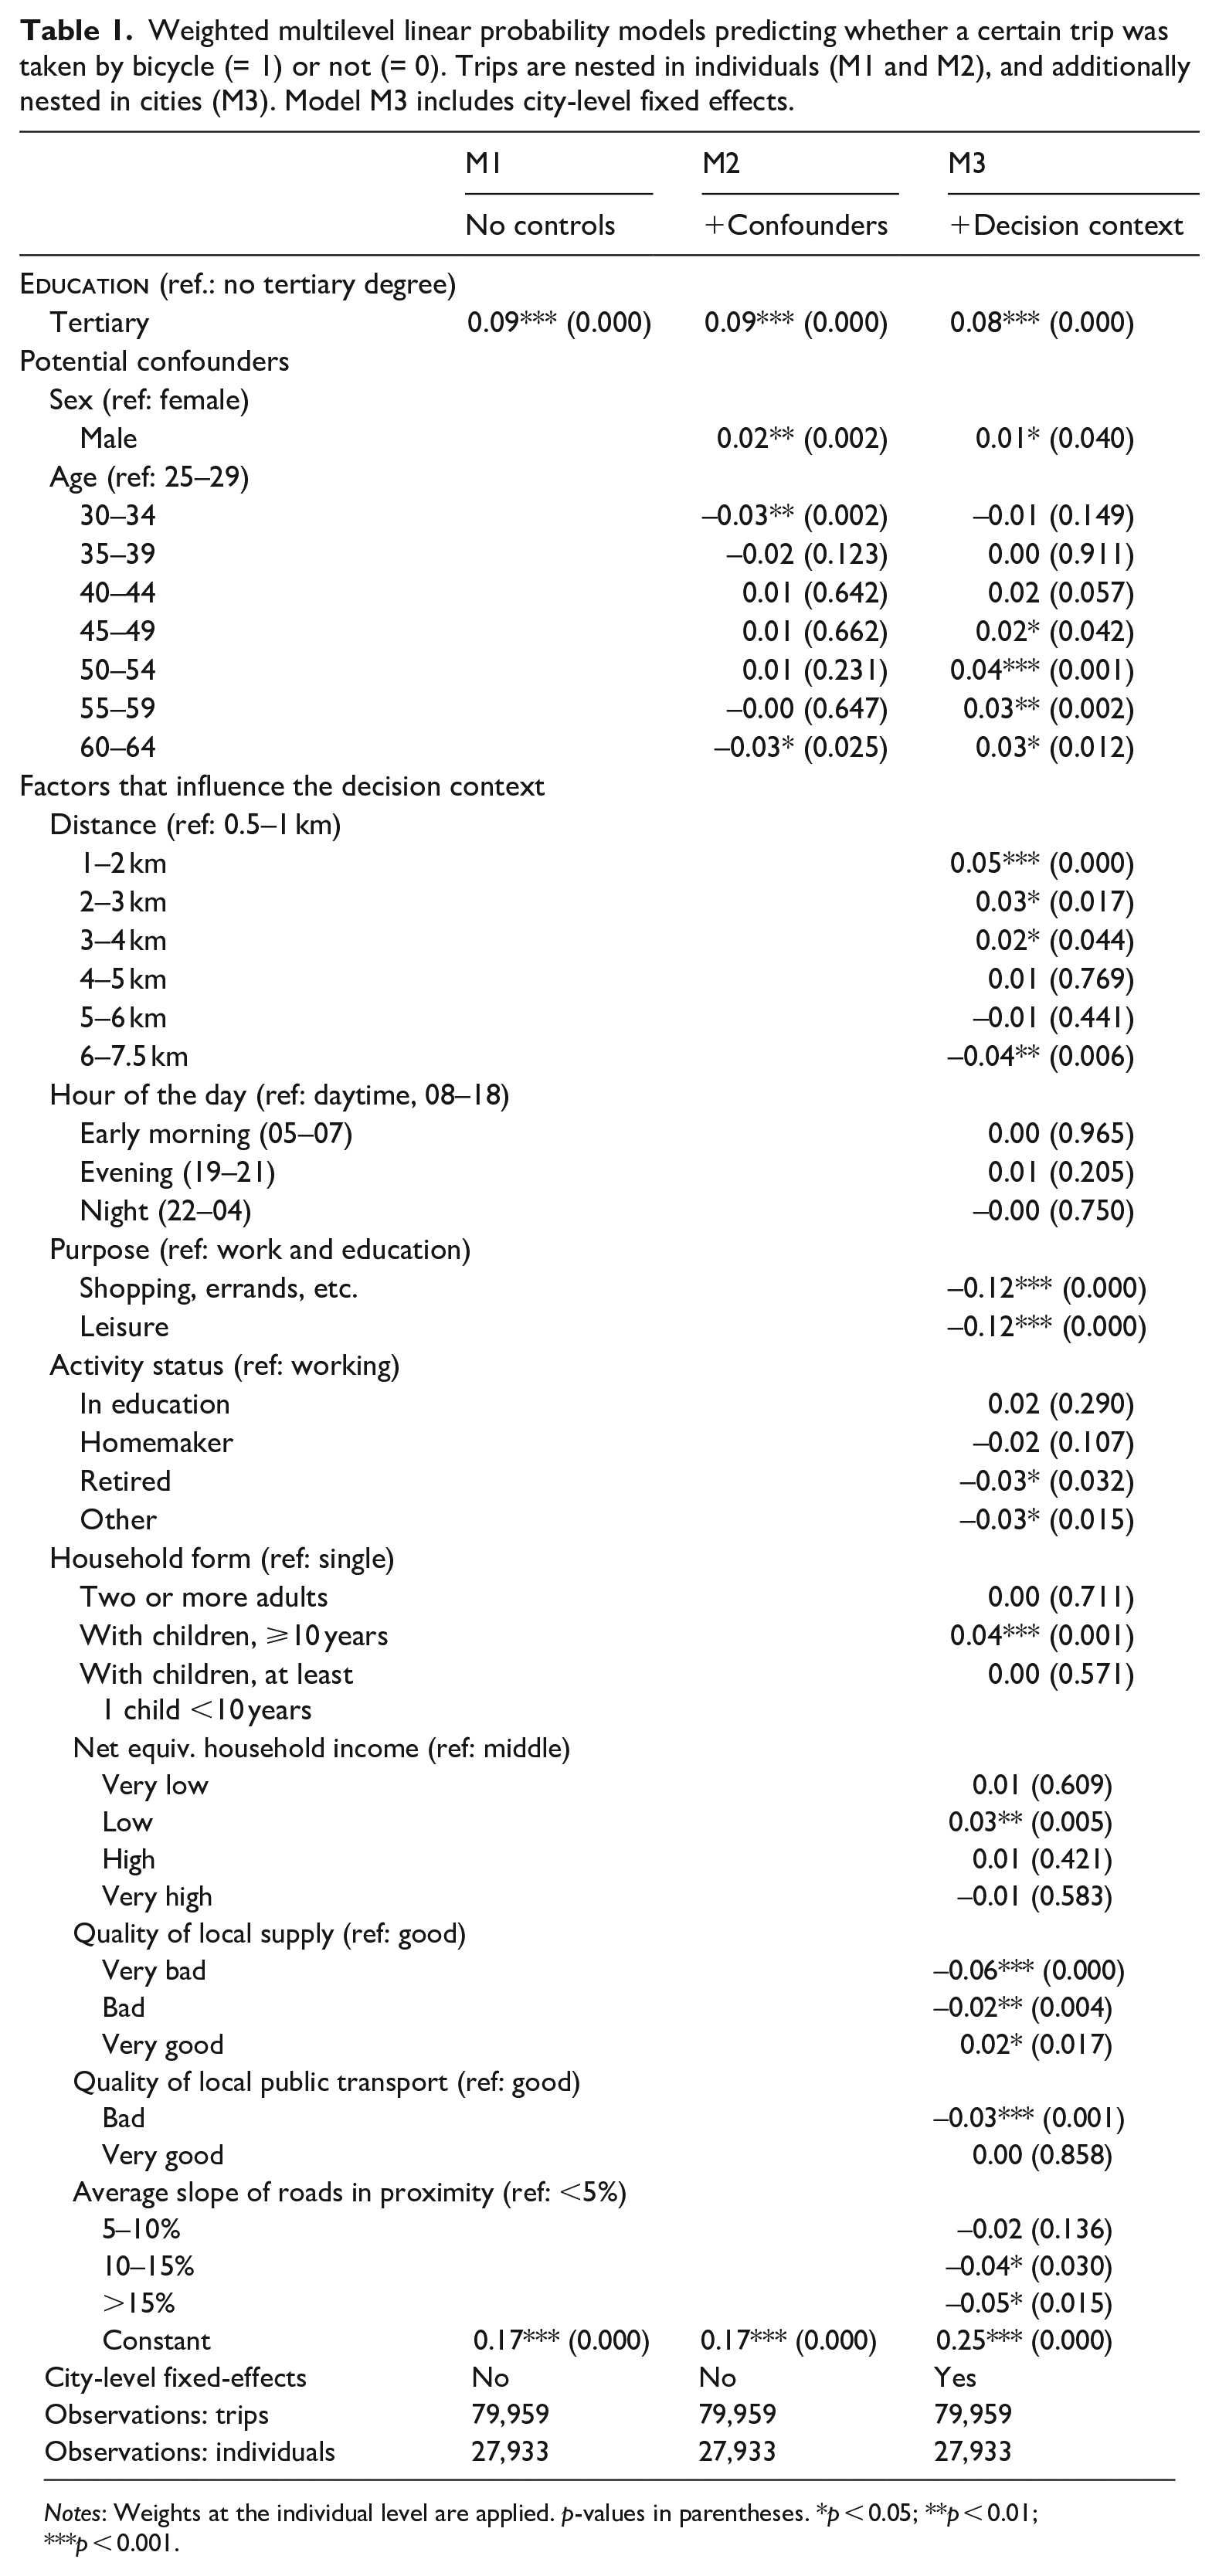
Notes: Weights at the individual level are applied. p-values in parentheses. *p < 0.05; **p < 0.01; ***p < 0.001.
Measures
Dependent Variable
The outcome variable of interest is whether the primary means of transport for a certain trip was a bicycle (= 1) or another means of travel (= 0).
Main Predictor: Tertiary Education
The main predictor variable indicates whether an individual has a tertiary degree (‘higher education’) or not (‘lower education’). Such a binary measure allows for a clear and intuitive display and interpretation of results. This simple measure is also chosen because data on the educational level of respondents are limited. For example, there is no information on vocational training, which would be needed to rank individuals unambiguously in more detail (e.g. on the International Standard Classification of Education [ISCED] or some similar scale). Tertiary education includes degrees from universities and universities of applied sciences. In the analytical sample, 43.3% of respondents have a tertiary degree. Note that the restriction to residents from medium-sized and large cities results in an analytical sample with a higher level of education than the general German population.
Covariates at the Trip Level: Distance, Purpose and Timing
To allow for a flexible function of the distance–cycling association, I use categories for each kilometre (except for the lowest and highest categories, which are 0.5–1 km and 6–7.5 km). The trip purpose is divided into three groups: (1) work and education; (2) shopping, errands, etc., including accompanying trips; and (3) leisure. The trip time corresponds to the starting time and is divided into four broad categories: early morning (5.00 to 7.59), daytime (8.00 to 18.59), evening (19.00 to 21.59) and night-time (22.00 to 4.59).
Covariates at the Individual and Household Level: Gender, Age, Activity Status, Household Income and Household Composition
Age is coded with a category for each five-year interval. Activity status is coded with five categories: working, student/in education, homemaker, retired and ‘other’, which includes unemployment. Household income is captured by a pre-defined five-category variable for household equivalence income (modified Organisation for Economic Co-operation and Development [OECD] scale). As a robustness check, I further run a model that includes a linear term for income. A variable with four levels captures the household context (living alone; living with one or more other adults; living with younger children; living with older children).
Covariates at the Neighbourhood Level: Local Supply, Transport and Hilliness
These three variables serve as proxies for accessibility and cyclability. The first variable is an index for the quality of local supply, based on the distance from the respondent’s address to various facilities such as supermarkets, doctors or restaurants (a pre-defined variable provided within the dataset). It ranges from ‘very bad’ (1) to ‘very good’ (4). The second variable is an index for the quantity and quality of available transport within a 1 kilometre diameter around the respondent’s address (also pre-defined and provided within the dataset). The variable also has four categories, but only 0.3% are in the ‘very bad’ category in this sub-sample of cities, so they are merged with ‘bad’. The third variable is an index for the hilliness of the surrounding area, a four-category measure for the average slope of roads in the direct proximity to respondent’s address.
Results
Descriptive Findings: Transport Mode Choice by Educational Group
To develop an understanding of general educational differences in transport mode choice, Figure 1 shows the modal split – what share of trips are taken via which transport mode – by education. Interestingly, the educational groups hardly differ in regard to walking and public transport. However, they differ substantially in cycling and driving a car: people without a tertiary degree use the bicycle for 16.7% of trips and the car for 43.1% of trips. These figures are 28.1% and 32.3%, respectively, for people with a tertiary degree. The theoretical reasoning regarding educational differences in cycling mainly contrasted cycling with driving, and this first observation supports the idea that educational differences are primarily evident for these two modes of transport.
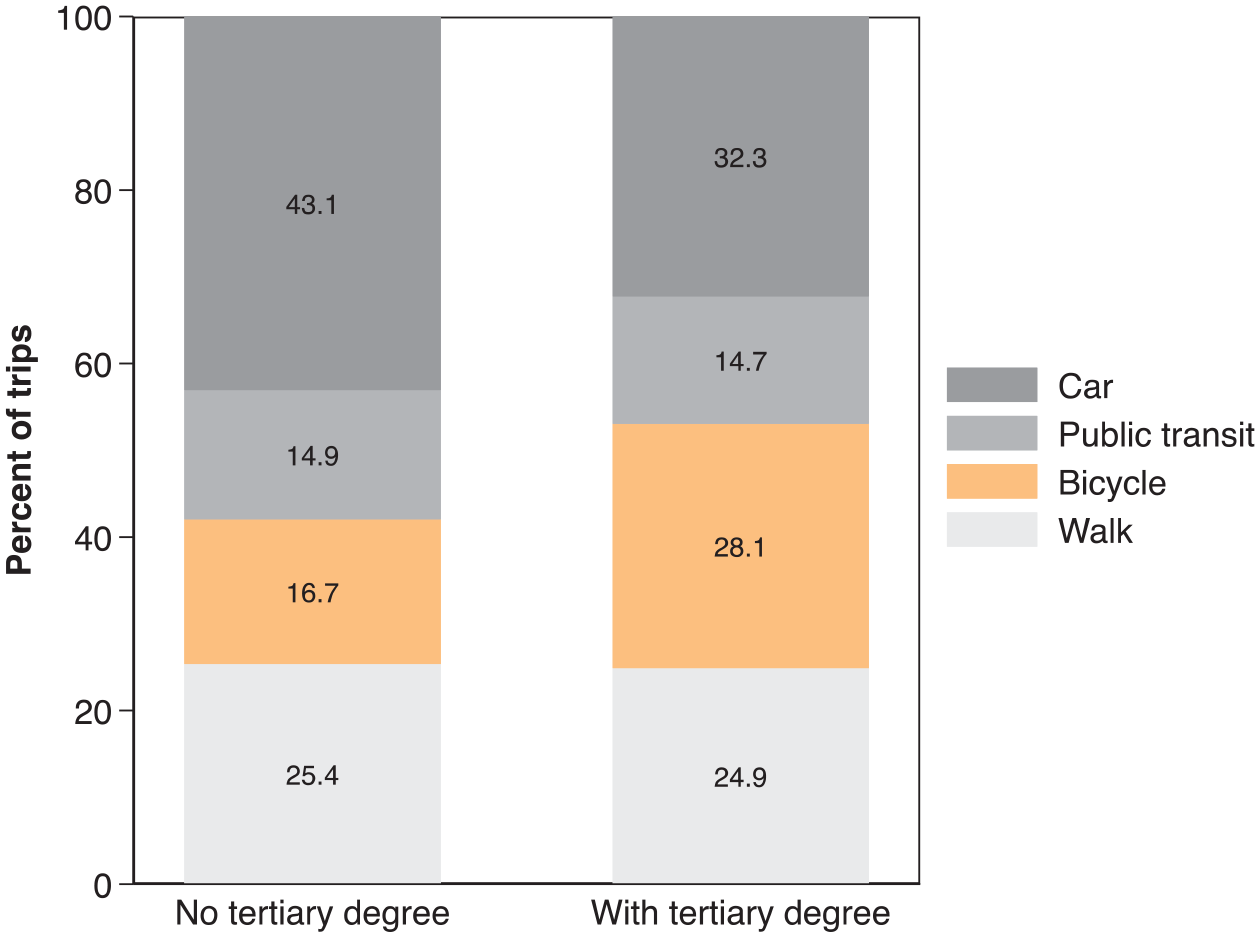
Modal split by education (nindividuals = 27,933; ntrips = 79,959).
Descriptive Findings: Cycling by Levels of Single Covariates
Trip Level (Figure 2)
Figure 2 shows educational differences in cycling by trip-level characteristics: distance, purpose and starting time. In each case, the bottom part of the panel shows a histogram of the variable to enable a broad understanding of its distribution and see whether the distribution differs between people without (grey/darker) and with tertiary education (blue/lighter). As expected, the bicycle is most popular for relatively short trips of between 1 and 4 kilometres. Trip lengths do not differ between people with lower and higher education, and across all distance categories, those with higher education are more likely to take trips by bicycle. By broad categories, (grocery) shopping and errands etc. are the most common trip reason, followed by leisure and work. People with higher education make slightly fewer trips for shopping, errands, etc. and slightly more leisure trips than those with lower education. The bicycle is most often used for trips to work and education, and the educational difference is consistent across all trip-purpose groups.
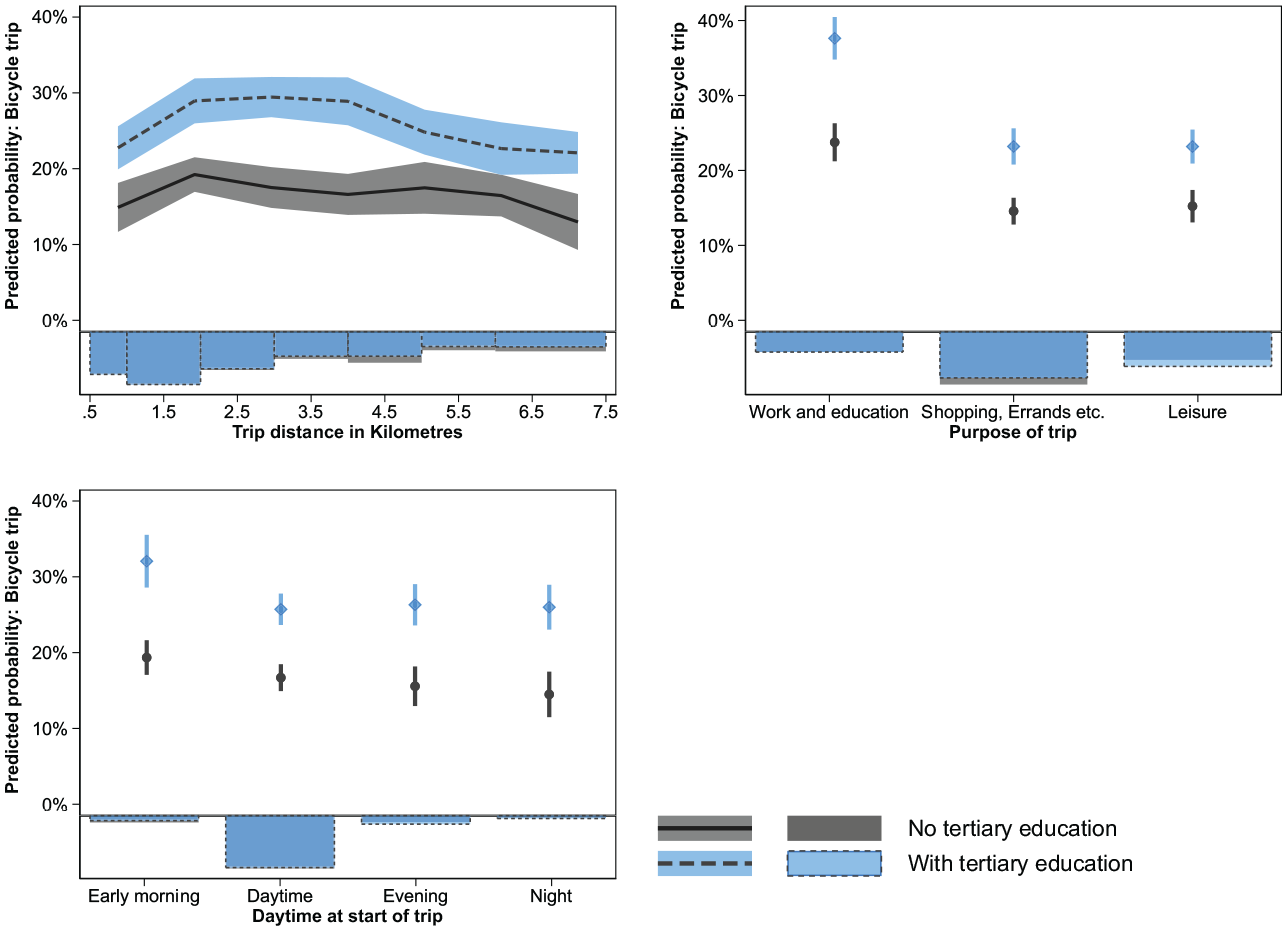
Cycling and education by covariates at the trip level (nindividuals = 27,933; ntrips = 79,959). Survey weights are applied and 95% confidence intervals are shown. Lower part of the subfigures: frequency distribution of covariate.
The third panel in Figure 2 shows that most trips are taken during the day, and cycling is most popular for early morning trips, which are typically trips to work. Again, the educational difference is consistent across all groups. Overall, there is no reason to assume that educational differences in these trip characteristics are the main mediator of the education–cycling association.
Individual and Household Level (Figure 3)
As shown in the first subgraph of Figure 3, the educational gap in cycling is equally apparent among women and men. The highly educated group tends to be much younger, but age differences in cycling are relatively minor, and, at all ages, those with higher education are more likely to cycle.
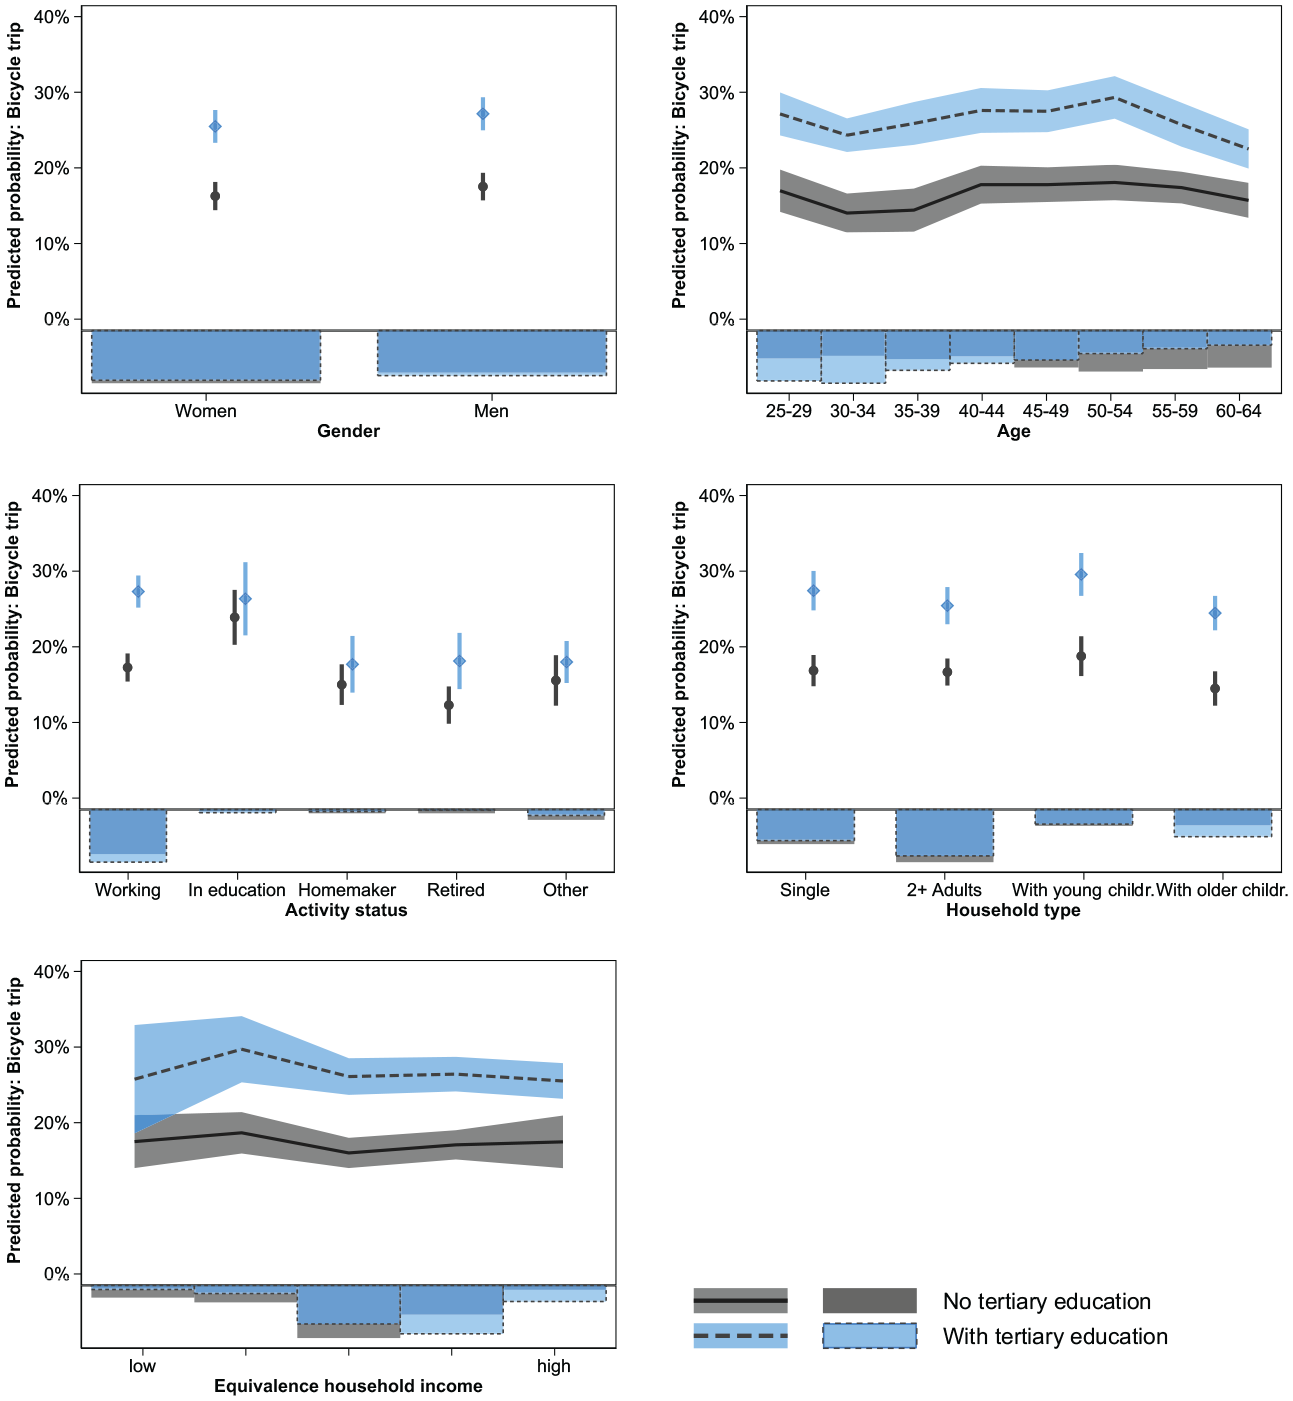
Cycling and education by covariates at the individual and household level (nindividuals = 27,933; ntrips = 79,959). Survey weights are applied and 95% confidence intervals are shown. Lower part of the subfigures: frequency distribution of covariate.
The third panel of Figure 3 displays results by activity status and clearly shows that the educational differences are driven by the largest group in the sample: those who are working. Those with tertiary education are overrepresented within this group and among students and they are underrepresented in the other groups. There is no clear educational difference in cycling among those still in education, but the comparison might be misleading. It could, for example, compare late bachelor students (who have no tertiary degree yet) with master’s students (who already have the bachelor’s degree); thus, it would be no surprise that these groups are quite similar. It is notable that there are scarcely any educational differences in cycling within the group of homemakers (94.4% of whom are women). There are only moderate differences among the retired, but those who have higher education and are already retired before age 65 might be a selective group with health problems. Among the ‘other’ category, which includes the unemployed, there are also no apparent educational differences concerning cycling.
When distinguishing between household types, the main pattern is evident in all groups: those with higher education are more likely to cycle.
Education determines income, and does income determine transport choice mode? The bicycle is, after walking, by far the cheapest mode of transport. If we look at both educational groups combined (not shown here), those with higher household incomes are significantly more likely to travel by bicycle; however, this correlation completely disappears once we look within educational groups, where there are no relevant differences in cycling by income level. Overall, it shows that the educational difference in cycling is not mediated by differences in income. It also confirms that income and education are not different proxies for the same latent construct: researchers studying transport choice mode and other behaviours need to distinguish between the two.
Neighbourhood Level (Figure 4)
As expected, cycling is most common among residents of neighbourhoods with good local supply (supermarkets, restaurants, healthcare, etc.), and those with higher education are more likely to live in such neighbourhoods. However, the educational differences are evident across all local-supply groups. People with higher education are also more likely to live in areas with good public transport, and cycling is slightly higher in these neighbourhoods. However, educational differences show in all neighbourhood groups. Cycling is lower in hilly areas, but people with lower and higher education are similarly likely to live in such areas. In sum, people with higher education are more likely to live in cycling-friendly neighbourhoods, but educational differences in cycling are evident across all values of all variables displayed. This suggests that the effect of education on cycling might be partially mediated through selection into cycling-friendly neighbourhoods.
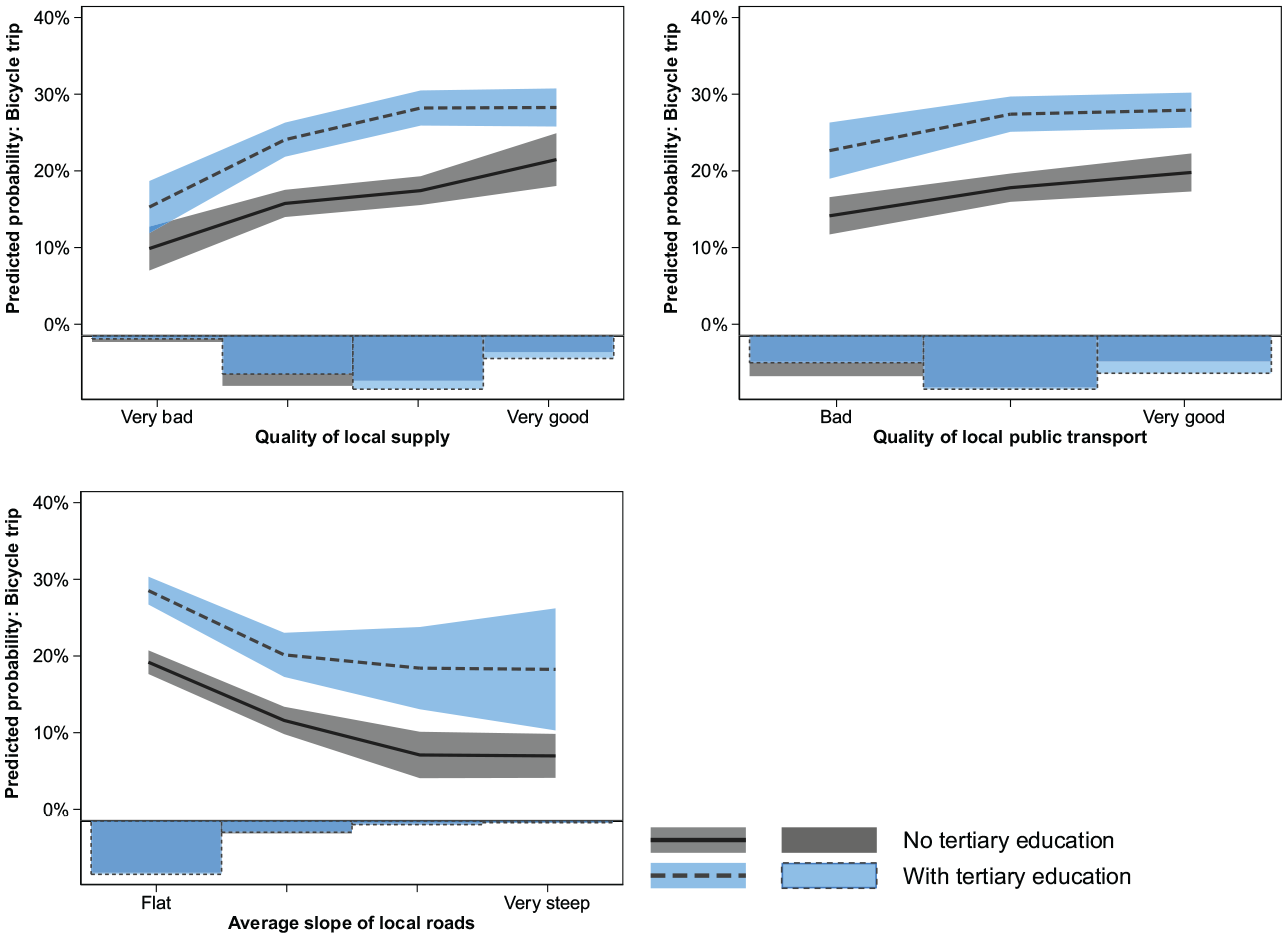
Cycling and education by covariates at the neighbourhood level (nindividuals = 27,933; ntrips = 79,959). Survey weights are applied and 95% confidence intervals are shown. Lower part of the subfigures: frequency distribution of covariate.
Cycling by Levels of Context Variables: Multivariable Analyses
To account for covariates and to test whether education affects cycling behaviour and decisions, I run different specifications of multilevel linear probability models. Figure 5 plots the coefficient of tertiary education from these models.
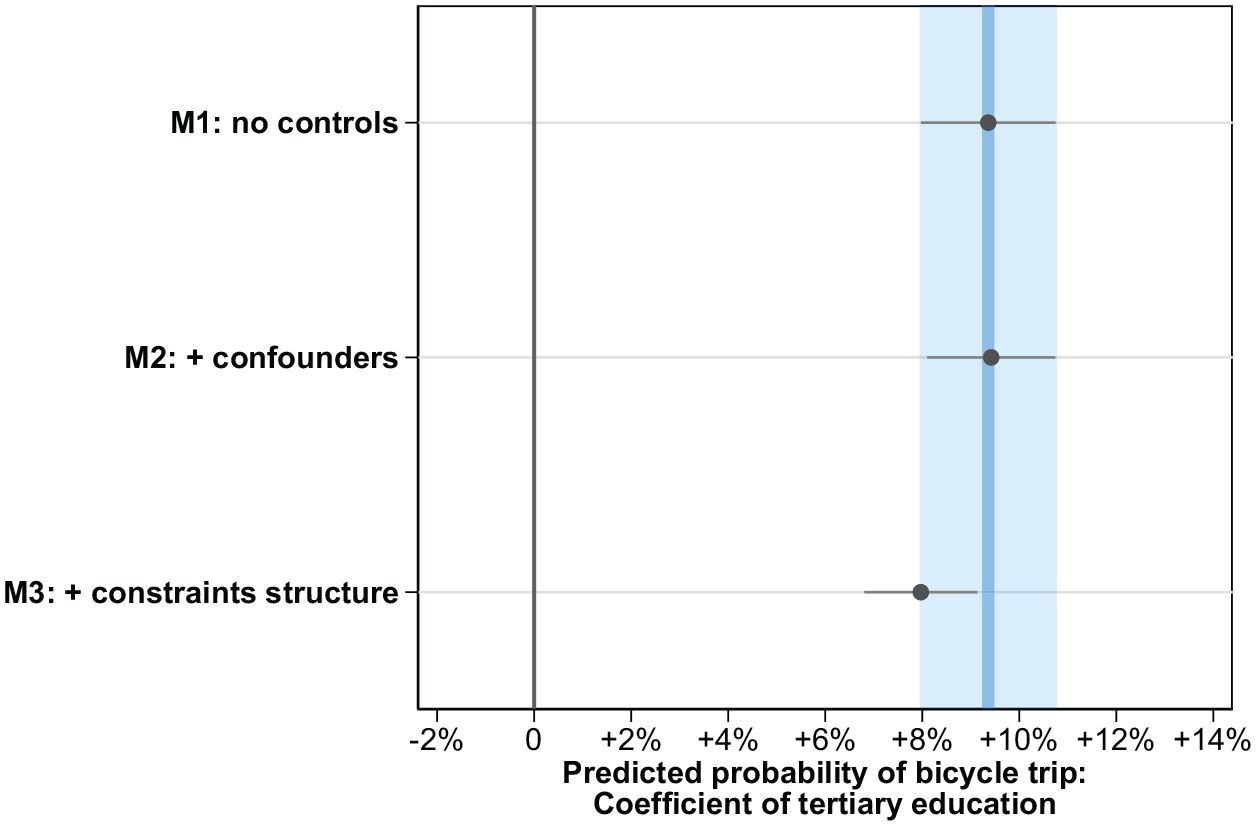
Multivariable results: coefficient of tertiary education in different multilevel linear probability regression models is shown. Survey weights are applied and 95% confidence intervals are shown (nindividuals = 27,933; ntrips = 79,959).
In the empty model M1, the one that includes no covariates, the predicted probability that the bicycle is used for a certain trip is 9.4 percentage points higher for those with tertiary education.
Model M2, which aims to estimate the total effect of education on cycling and includes the potential confounders gender and age, also predicts a probability of cycling that is higher by 9.4 percentage points for those with tertiary education. This suggests that the education–cycling association is not spurious but substantial.
This article hypothesises that, under the same conditions, people with higher education have a higher propensity to choose cycling. Therefore, the third and final Model M3 includes variables that shape people’s constraints and opportunities, the degree to which they can realistically choose between the different transport modes. As described above, such factors include trip distance, income or factors at the city level, such as climate or cycling infrastructure. In this model, tertiary education increases the predicted probability of bicycle usage by 8.0 percentage points. 1 This shows that the effect of education is largely not mediated through factors that determine decision leeway. Instead, results suggest that education affects decision making, and people with and without tertiary education choose differently under similar circumstances. The effect is large: based on model M3, tertiary education increases the predicted probability of cycling by 49.6% (from 16.1% to 24.0%).
Further Analyses and Robustness Checks
To test whether these results are robust, I run further analyses (see the online appendix for details).
In selecting the analytical sample, I excluded 11.6% of individuals because of missing information regarding neighbourhood characteristics. In the first robustness check, I show that this sample restriction likely does not bias the analyses.
Second, I explore education level in more detail. Figure 6 plots the predicted probabilities of cycling based on a regression model that contains the same covariates as M3. Those with tertiary education have a higher predicted probability than the three lower-educated groups. However, the education–cycling association might be non-linear at the lower end: those in the lowest educational group (7.5% of the sample) are equally likely to cycle as those in the second-lowest. However, because information on vocational training is missing, the educational ranking is not unambiguous.
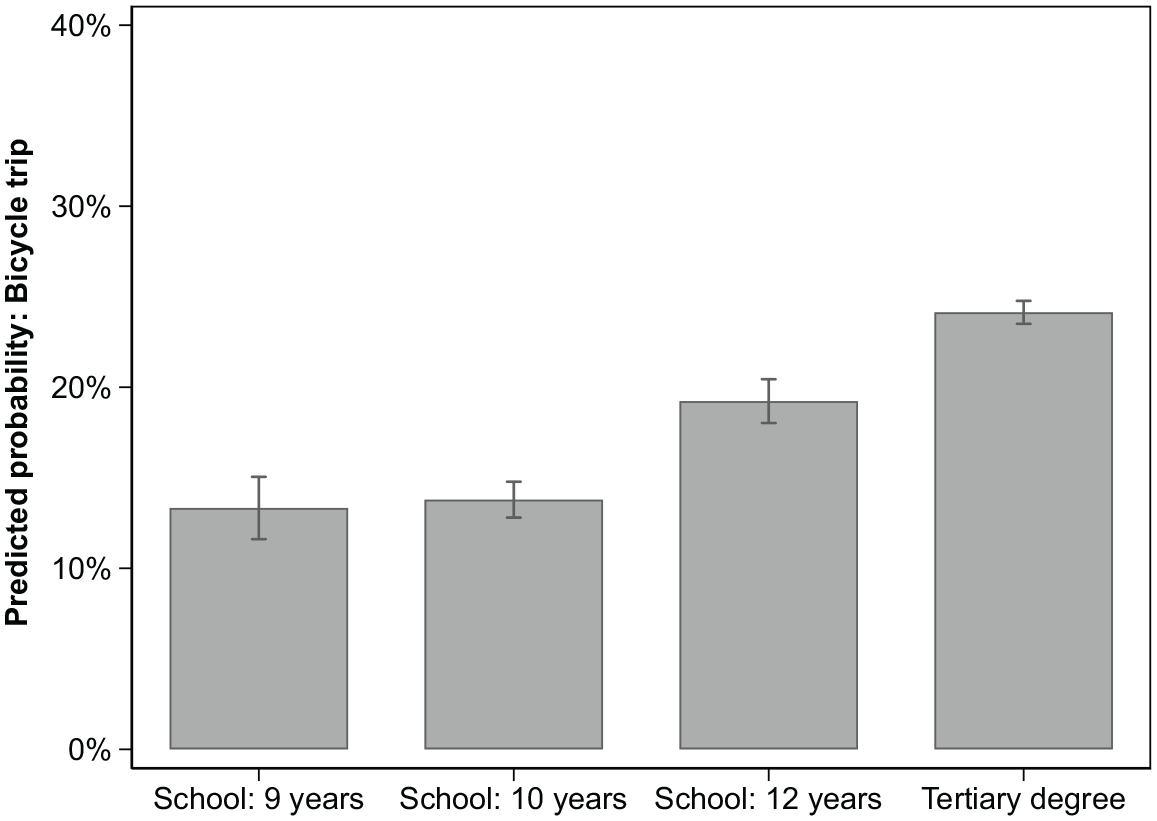
Cycling and education by more detailed levels of education (nindividuals = 27,933; ntrips = 79,959). Predicted probabilities based on the model that accounts for the constraints structure (analogous to M3). Survey weights are applied and 95% confidence intervals are shown.
Third, I run analyses with more detailed information on household income, where the coefficient of education remains robust.
Fourth, I run models for the sub-sample of individuals who cycle at least sometimes. The rationale of this article is about the idea that people with lower and higher education make different choices. However, individuals cannot choose to use a bicycle for a certain trip if they are generally unable to cycle (e.g. because they never learned how to cycle or because they have physical impairments). Results show that the education–cycling association does not depend on individuals who are generally unable to cycle.
Finally, the theoretical framework mainly contrasted cycling with driving, and the societal relevance of the effect of education on cycling depends on which other modes of transport it replaces. To gain insight into this, I ran model M3 for all the main modes of transport separately. The result in Figure 7 shows that education has no effect on the decision to use public transport, a small negative effect on walking and a large negative effect on driving. Therefore, the positive effect of education on cycling comes mainly at the expense of the car.
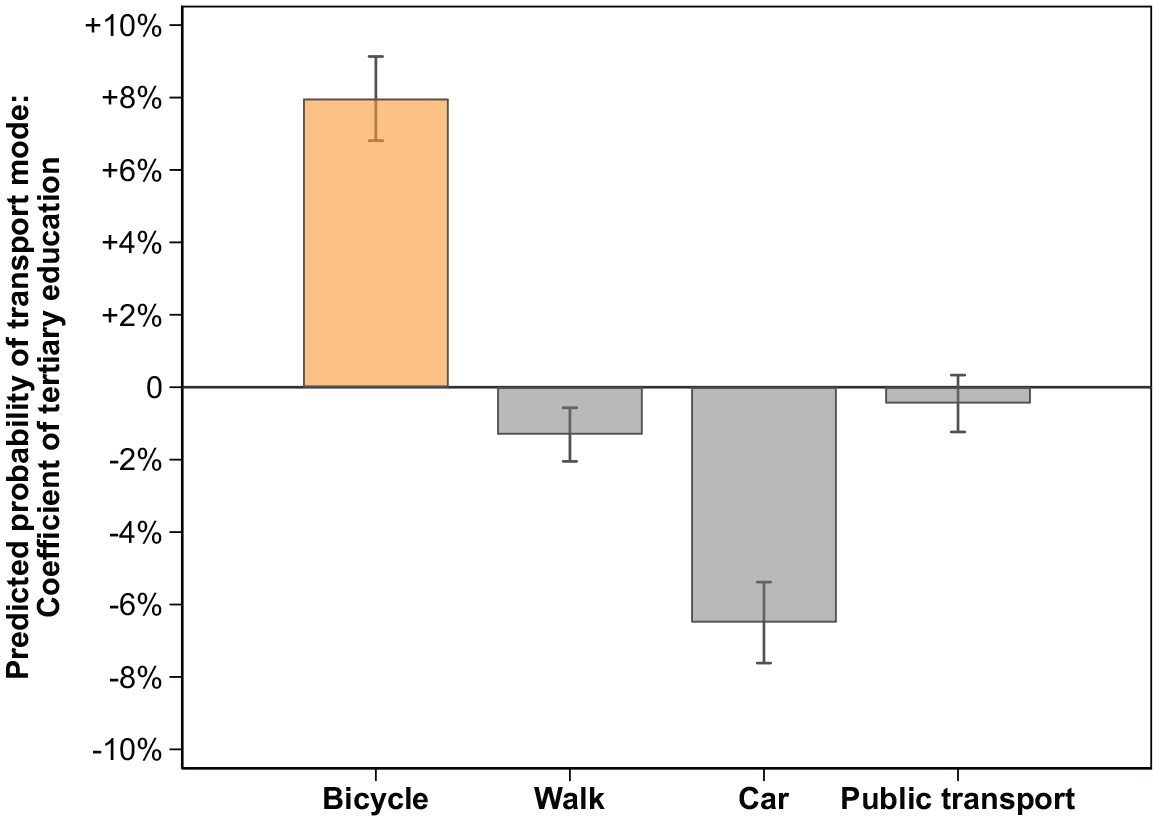
Distinguishing between all main transport modes (nindividuals = 27,933; ntrips = 79,959). Predicted probabilities based on the model that accounts for the constraints structure (analogous to M3). Survey weights are applied and 95% confidence intervals are shown.
Discussion
This study examines short-distance trips of working-age city residents in Germany and shows that those with higher education consistently and significantly more often choose to cycle than those with lower education. Even though the association is large – higher education increases the predicted probability of bicycle usage by 50% – it has not yet been scrutinised in the scientific literature. The association is not spurious but substantial: it holds against controlling for potential confounders. Furthermore, it shows that the observed behavioural differences are not a result of educational influence on overarching factors that determine people’s decision leeway between different modes of transport. Instead, these results suggest that education affects decision making: when faced with similar travel options, people with higher education are systematically more likely to choose to cycle than are people with lower education. This result holds against extensive robustness checks. An important finding is that the decisive factor is not income but education. Those with higher education are more likely to cycle at all levels of income, and there are no major differences in cycling between income groups within the same educational group.
The analyses presented in this article have limitations. First, there are limitations related to data availability. The data analysed, Mobility in Germany 2017, is an excellent resource because of its remarkably large sample size, its comprehensive collection of information at journey level and its detailed information on the small-scale local context. This contrasts with the somewhat suboptimal information at the individual level, such as the lack of information on vocational training. Second, this article cannot trace the underlying mechanisms of the observed education–cycling association in detail. The theoretical section discussed how motives of meaning, signalling and social status might be the driver, but these mechanisms could only be tested indirectly. Consequently, further investigation is needed. Future research may, for example, trace at what stage in the life course educational differences emerge or whether the association is contingent on national or local contexts.
Cycling is a cheap and healthy mode of transport that could contribute to social equity, but currently does not. On average, people with lower education fare worse in health and finances, and cycling could help with both. However, in Germany today, the reverse is happening. Mobility patterns amplify financial and health inequalities because those with lower education cycle less and drive more. Current urban policies might further increase inequities: cities around the globe redistribute resources away from motorists and towards cyclists, and the on average more educated cyclists are the primary beneficiaries. Diverse policy agents, such as city, regional and national governments, as well as the European Union and the World Health Organization, consider cycling a valuable tool for better health, environmental protection and liveable cities. My analyses show that the large cycling potential among those with lower education remains unexploited. This finding might serve as a basis for tailored policy measures that meet the needs of those with lower education and thereby contribute to reducing health inequalities, creating equitable and liveable cities, while protecting the environment.
Supplemental Material
sj-docx-1-soc-10.1177_00380385211063366 – Supplemental material for Educational Differences in Cycling: Evidence from German Cities
Supplemental material, sj-docx-1-soc-10.1177_00380385211063366 for Educational Differences in Cycling: Evidence from German Cities by Ansgar Hudde in Sociology
Footnotes
Funding
The author received no financial support for the research, authorship and/or publication of this article.
Supplemental material
Supplemental material for this article is available online.
Notes
References
Supplementary Material
Please find the following supplemental material available below.
For Open Access articles published under a Creative Commons License, all supplemental material carries the same license as the article it is associated with.
For non-Open Access articles published, all supplemental material carries a non-exclusive license, and permission requests for re-use of supplemental material or any part of supplemental material shall be sent directly to the copyright owner as specified in the copyright notice associated with the article.