
Abstract
Relatively little research has explored socio-demographic inequalities in downward mobility from advantaged backgrounds, with such work focusing solely on class or income. This neglects the multi-dimensional nature of social position and particularly overlooks the importance of social status as a reward obtained via occupation. In this study, I use detailed data from a large, representative UK sample to examine inequalities in multidimensional destinations among workers from the most advantaged class and status backgrounds. I find evidence of significant socio-demographic inequalities both in the overall risk of downward mobility and in the pattern of class versus status mobility. Notably, women from privileged families have a higher risk of downward mobility than men, but this difference is driven exclusively by class, rather than status mobility. Black workers have a higher risk of downward mobility than White workers in both class and status terms, while those of Indian ethnicity are at lower risk, particularly of downward class mobility. The study’s findings have important implications for social mobility research and policy – with specific patterns of multidimensional mobility potentially requiring different explanations (and therefore policy interventions) than the patterns revealed by previous unidimensional analyses.
Keywords
Introduction
Upward social mobility is seen as a solution to economic inequalities between socio-demographic groups, such as ethnic disparities in occupational attainment (Runnymede, 2010). However, this view overlooks the crucial role of downward mobility in perpetuating such inequalities. As professional job growth has ceased (Goldthorpe, 2016), upward movement for disadvantaged groups requires downward movement for advantaged groups.
Low overall rates of downward mobility entrench existing inequalities, allowing already advantaged groups to maintain that advantage across generations (Platt and Zuccotti, 2021). This may be exacerbated by unequal rates of downward mobility – for example, if children from advantaged Black families face greater risks of downward mobility than their White counterparts (Platt, 2005a, 2005b). Unequal downward mobility rates may also generate inequalities, such as gender-based economic disparities (Bukodi et al., 2017).
Relatively little research has examined inequalities in downward mobility in the UK, or elsewhere. What research has been conducted is also limited by considering mobility solely along single dimensions of social hierarchy – such as income, education, or social class (Platt, 2005b). This approach does not account for the inherent multidimensionality of social position and therefore leaves us with a highly incomplete picture of both the extent and the kinds of downward mobility suffered by different socio-demographic groups.
The multi-dimensionality of social position
Empirical research on social mobility tends to focus on single dimensions of social position. Economic research examines intergenerational income elasticities, while sociological studies focus on movements between social classes (Goldthorpe, 2016). A central plank of the latter work in the UK is John Goldthorpe’s class mobility research, which has shown that rates of absolute downward mobility declined during the early 20th century due to the expansion of white-collar roles, before increasing again as this expansion ceased (Goldthorpe and Jackson, 2007).
While both class and income-based approaches provide valuable insights into the preservation of advantage, they do not account for the multidimensionality of social hierarchy and are therefore necessarily incomplete (Blossfeld, 2019). One may be downwardly mobile in class terms, for example, while being upwardly mobile in terms of income or social status. These different mobility profiles may reflect very different lived experiences, and the social patterning of these profiles may yield a very different picture of social fluidity than focusing on any single dimension alone.
Of particular importance is Weber’s distinction between class and status (Chan and Goldthorpe, 2007; Weber, 2010). Weber (2010) defines social class by one’s relationship to property and the labor market. This is reflected in contemporary class schemes, including the widely used Erikson-Goldthorpe (1992) scheme and its derivations. These assign class position on the basis of employment relations: employers are distinguished from employees; employees are distinguished by the extent to which they perform loosely regulated work for a salary versus tightly regulated work for wages (Bukodi et al., 2011). By contrast, social status is based on a subjective ‘social assessment of honour’ (Weber, 2010), reflecting societal respect and esteem.
The concept of social status is absent from the majority of empirical studies of social mobility (Blossfeld, 2019) and has been entirely ignored in the small literature on inequalities in downward mobility. This is an important omission because research has amply demonstrated the extent to which people prize and strive for social status as an outcome in itself (Anderson et al., 2015; Frank, 1985). As Bukodi et al. (2011) note ‘status can be seen as a major reward obtained via occupation’ (p.630) – one that may be a complement or an alternative to income or class-related rewards.
The incorporation of status as a dimension of stratification has critical implications for our understanding of downward mobility. This can be illustrated by contrasting the mobility experiences of two hypothetical individuals. Both A and B have parents in the most advantaged class position of higher professionals. After taking a business degree, A has become a chartered accountant; whereas B studied politics and is now the political editor of a national magazine. According to conventional class schemes, A is a ‘higher professional’, whereas B is a ‘lower professional’ (Rose et al., 2005). Judged on class alone, B has therefore been downwardly mobile. However, the prestige of B’s profession means that she is unlikely to have been downwardly mobile in status terms. This is particularly notable in light of Bukodi et al.’s (2021) argument that status loss may be more psychologically aversive than class loss.
Incorporating information on both class and status destinations is necessary to provide a more holistic picture of inequalities in downward mobility – to understand who is at most risk of what kinds of downward mobility, and why. For example, there may be some groups which are more often downwardly mobile in terms of class than status (and vice versa), and other groups which may be at high risk of falling along both dimensions. Distinctive mechanisms may underlie these differential risks of class versus status mobility – with previous research suggesting that class destinations are more strongly determined by parental material resources; whereas status destinations may be better predicted by cultural resources (Blossfeld, 2019; Thaning, 2021). To the extent that membership of particular demographic categories correlates with higher or lower levels of material versus cultural resources, this would predict differential risks of class versus status mobility.
We follow Blossfeld (2019) by capturing multidimensional occupational destinations using a categorical indicator of both class and status position, rather than estimating a single latent variable. As Blossfeld (2019) argues, this recognizes the conceptual distinction between the two dimensions (Chan and Goldthorpe, 2007) and allows for potentially differential effects of independent variables on class versus status.
Potential inequalities in downward mobility
As noted above, the existing literature provides relatively little evidence and theory directly concerning inequalities in downward mobility. A notable exception in the UK is the work of Platt (2005a, 2005b, 2007) and Li and Heath (2008) on the effect of ethnicity and nationality on social mobility. Their research shows that first-generation ethnic minority migrants often experience high rates of downward class mobility – potentially due to language issues and a failure of educational, cultural, and social resources to translate to the destination country (Li and Heath, 2008; Platt, 2005a).
In the second generation and beyond, this effect is often reversed, potentially because children of migrants do not face the same language and cultural barriers, and are able to recover the pre-migration class position of their parents (Platt, 2005a, 2007). This recovery is primarily mediated by strong educational attainment (Platt, 2005a, 2007). However, this pattern is not consistent across ethnic groups. In particular, those from Indian backgrounds are at particularly low risk of downward mobility relative to the White majority, while those from Black Caribbean, Pakistani, and Bangladeshi backgrounds – especially men – are at higher risk (Platt, 2005a, 2007; Macmillan and McKnight, 2022). For the Indian and Black Caribbean groups, these differences are mediated by educational ‘over’ and ‘under’ performance, respectively (Platt, 2005a). However, the increased risk suffered by those from Pakistani and Bangladeshi backgrounds is not explained by education (Platt, 2007).
Previous research has explained ethnic differences in educational attainment through a mix of ‘supply’ and ‘demand’ side factors. On the supply side, authors have noted cultural differences in the value placed on education (Strand, 2014), differences in aspirations (Berrington et al., 2016), and inequalities in material (e.g., to fund extra-curricular tuition) and social resources (such as familiarity with the intricacies of the education system) (Reay et al., 2005). On the demand side, there is evidence of both direct and structural discrimination affecting Black students in the UK (Phillips, 2011). Conversely, Indian students may benefit from relatively benign educational stereotypes (Wong, 2015).
Independent of education, differences in aspirations may again serve as a supply-side explanation for inequalities in the risk of downward mobility (Berrington et al., 2016; Platt, 2007). On the demand side, there remains strong evidence of direct discrimination by ethnicity in the UK labor market (Platt and Zuccotti, 2021; Zwysen et al., 2021) that could serve as a significant obstacle to the ability of some groups to retain parental advantage (Platt, 2007).
More recent work by the UK Social Mobility Commission (SMC, 2020) moves beyond a focus on ethnicity to examine a wider suite of determinants of downward mobility. Consistent with the findings described above, the SMC (2020) found that among those from advantaged class backgrounds, Black, Pakistani, and Bangladeshi men were at the greatest risk of downward mobility; as were Bangladeshi women, and first-generation migrants of both genders. Beyond ethnicity, female gender was a significant risk factor for downward mobility, as was its interaction with parenthood (SMC, 2020). Also at higher risk of downward mobility were those living outside London and the South East (a ‘London’ effect also observed by Friedman and Macmillan, 2017), and, among graduates, those studying arts, languages, and design.
The gender effect observed by the SMC is consistent with wider work on social mobility, which has consistently found that women are more likely to be downwardly class mobile than men (Bukodi et al., 2017; Goldthorpe et al., 2004), regardless of educational attainment. One proposed explanation for this pattern is the impact of childcare – with women returning to lower-class roles after childbirth (Goldthorpe et al., 2004). However, as Bukodi et al. (2017) have shown, downwardly mobile women tend to enter the labor market in lower-class positions, rather than dropping down the class ladder after childbearing. Bukodi et al. (2017) argue that this reflects a sub-set of ‘family-oriented’ women who are willing to pre-emptively accept downward mobility in order to have more family-friendly work. A potentially related supply-side explanation is a greater tendency for women to pursue creative and caring professions, which are often less well rewarded economically (de Vries and Rentfrow, 2016; Lupart et al., 2004; Petersen and Hyde, 2014). This tendency is reflected in degree subject choices, with women being strongly under-represented in science, technology, and engineering and over-represented in the humanities, social sciences, medicine, and teacher training (Barone and Assirelli, 2020).
The latter finding is often interpreted as women ‘choosing’ lower-paid (and lower occupational class) career paths. However, it can also be understood in terms of structural discrimination – with research demonstrating that jobs primarily done by women (and minoritized ethnic groups) attract systematically worse pay and conditions than equivalent jobs more common among White men (Levanon et al., 2009; Del Río and Alonso-Villar, 2015). This is exacerbated by career choices being exercised in the context of existing occupational segregation – with women and ethnic minorities potentially focusing their aspirations away from occupations where they are under-represented, and where they may fear discriminatory treatment (Moss, 2004; Scandone, 2018).
The present study
As noted above, the existing literature relating to inequalities in downward mobility has focused almost exclusively on class mobility. Existing research and theory do not yield strong expectations with respect to multidimensional downward mobility. For example, we do not know the extent to which some inequalities in class mobility may be exacerbated or mitigated by status loss or retention.
In this study, I use large-scale data from the UK Labour Force Survey (LFS) to examine the effects of demographic characteristics, including age, gender, ethnicity, immigration status, and parenthood on the risk and nature of multidimensional downward mobility. I also examine the role of educational characteristics, including educational attainment and (among graduates) university type, degree outcomes, and subject choices.
In this analysis, I particularly focus on downward mobility from the most advantaged backgrounds. Discussion and debate around social mobility has primarily focused on the inheritance of ‘top jobs’, due to the societal importance of these roles (Macmillan et al., 2015). However, previous research has defined advantaged backgrounds very broadly, incorporating both ‘higher’ and ‘lower’ professionals (Platt, 2005a, 2005b; SMC, 2020) – with the latter group covering many occupations not typically considered to indicate a privileged upbringing, such as nurses, sports coaches, and retail managers. Focusing specifically on those from the most advantaged backgrounds allows my results to speak more directly to debates around the inheritance of privilege and its role in perpetuating socio-demographic inequalities.
Methods
Data
The analyses use data from the UK LFS (ONS, 2023). The LFS is the UK’s largest employment survey and is based on a single-stage random probability sample of private households from the Postcode Address File (in Britain) and the POINTER register of domestic properties (in Northern Ireland). It can be considered substantively representative of the population of UK households.
The LFS is conducted using a quarterly panel design. A fifth of the panel is replaced each quarter. Panel members are therefore interviewed for five consecutive quarterly waves before being removed. All interviews are conducted face-to-face.
In 2014, the LFS added a question on the occupation of the respondent’s highest-earning parent when the respondent was 14, allowing for the analysis of intergenerational occupational mobility. This question is asked in the July–September (JS) quarter only. The analyses reported below are based on combined data from the JS surveys conducted from 2014 to 2019, excluding repeat respondents. 1 LFS Secure Access data were accessed through the UK Office for National Statistics (ONS) Secure Research Service (SRS).
The analysis sample was restricted to respondents from advantaged backgrounds (defined below) aged 30–59 whose main current activity was paid employment (including part-time and self-employment; N = 9661).
All analyses were weighted using the person weights provided by the LFS, and standard errors were adjusted to account for clustering within households.
Measures
Demographic and educational characteristics
The analyses included respondent demographic and educational characteristics captured in the following ways:
Age group (30–39; 40–49; 50–59)
Self-reported ethnic group (White; Indian; Pakistani, Bangladeshi, or other Asian background; Black; Mixed/Multiple ethnic groups; all other ethnic groups including Chinese and Arab)
A binary indicator of whether the respondent currently lived in London (including Greater London)
A binary indicator of whether the respondent was born outside the UK
Number of dependent children in the respondent’s family unit
A binary indicator of whether any dependent children are under the age of 5
A binary indicator of whether the respondent was a lone parent
The respondent’s highest educational qualification (undergraduate degree or higher; higher educational qualification below degree level; A-level or equivalent; GCSE grades A*-C or equivalent; all other qualifications; no formal qualifications)
Among university graduates, the following educational characteristics were captured:
University type (Oxbridge; Russell Group; 2 Other)
A binary indicator of whether the respondent had a postgraduate degree
Degree class (first; 2:1; 2:2 or below)
First degree subject (Medicine and dentistry; Medical-related (e.g., nursing); Science, Technology, and Engineering (STE); Social Science or Law (joint honors); Business Studies; Arts and Humanities; Education; Law (single honors)) 3
Social class
Social class was captured using the National Statistics Socio-Economic Classification (NS-SEC), which divides occupations into eight analytic classes based on typical employment relations (Rose et al., 2005). NS-SEC classes for origin and destination (main) occupation were derived from four-digit Standard Occupational Classification 2010 (SOC2010) codes using the simplified method (omitting employment status information) 4 (ONS, 2010). Classes 3–5, which are typically considered non-hierarchical (Bukodi et al., 2011), were collapsed into a single class, as were Classes 6 and 7.
Social status
Social status was measured using scores on the Cambridge Social Interaction Scale (CAMSIS; Lambert and Griffiths, 2018). CAMSIS is a ‘social distance’ measure derived from patterns of marriage or friendship. Occupations which often marry or befriend each other (i.e., are socially proximate) are assumed to occupy similar positions in the social hierarchy (Chan and Goldthorpe, 2007; Lambert and Griffiths, 2018).
The CAMSIS authors have argued the scale captures general social position, not specifically social status (Lambert and Griffiths, 2018). However, I follow Chan and Goldthorpe’s (2007) view that intimate social association is strongly dependent on parity of social status, and that there is therefore a strong case that social distance measures capture status (in the Weberian sense).
Origin and destination (main) occupation four-digit SOC2010 codes were matched to male scale CAMSIS scores provided by Lambert (2012) 5 using the method without employment status information. Scores were then assigned to four categories corresponding to the distribution (in the analysis sample) of the four NS-SEC categories described above. Scores were assigned among origin and destination occupations separately – allowing for the possibility of structural effects.
Following the same rationale, status group categories for men and women were assigned according to the common CAMSIS distribution across both genders – allowing for the observation of gender differences in status mobility resulting from differences in the male and female occupational structure.
Multidimensional class/status
Following Blossfeld (2019), combined class/status variables were created for origin and destination occupations through a simple combination of the categorical class and status measures described above. This yields 16 possible categories, 6 denoted by C[N]S[N]: for example, C1S2 denotes Class 1, Status Group 2. Example occupations in each multidimensional class/status category are given in Web Appendix A.
For the purposes of defining the analysis sample, advantaged backgrounds were defined by the highest wage-earning parent holding a C1S1 occupation.
Analyses and results
Descriptive statistics
Tables 1 and 2 provide descriptive statistics for the analysis sample and for the sub-sample of graduates. As expected for a sample of respondents from advantaged backgrounds, a large fraction are degree-educated and occupy highclass/status jobs.
Summary statistics for respondent characteristics (female N = 4823; male N = 4838).

Summary statistics for graduates (female N = 2190; male N = 2085).

Demographic and educational predictors of long- and short-range downward mobility
Table 3 shows the proportion of men and women from C1 S1 backgrounds who were (a) short-range downwardly mobile (to C1S2, C2S1, or C2S2) and (b) long-range downwardly mobile (to C3S3 or below). 7 There are two sets of figures for each gender: (a) the raw proportions and (b) the proportions (and difference) after adjusting for educational attainment. The latter figures are predicted margins derived from a multinomial logistic regression model predicting mobility (stability, short-range downward mobility, long-range downward mobility) from gender and educational attainment.
Gender differences in rates of short and long-range downward mobility (male N = 4823; female N = 4838).

*p<0.05, **p<0.01, ***p<0.001.
These figures show that women from advantaged backgrounds are somewhat more likely than men to be multidimensionally short- and long-range downwardly mobile. This difference is not explained by educational attainment – women from advantaged backgrounds are more likely than their male peers to have higher-level qualifications.
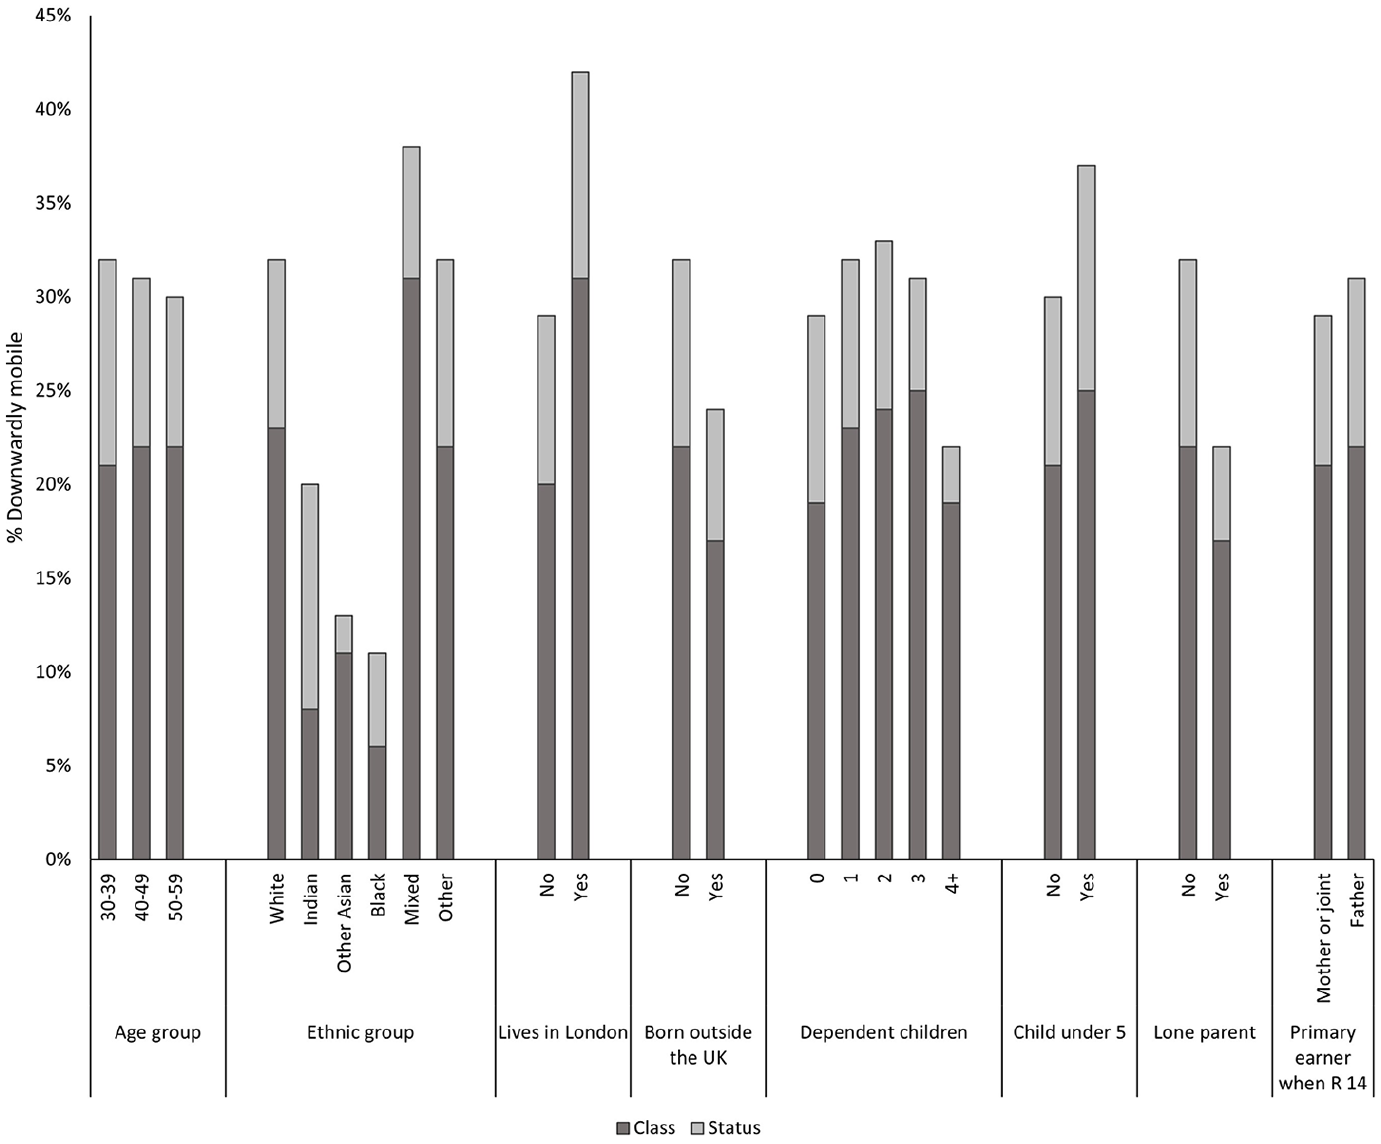
Figures 1 and 2 show the predicted percentage (from multinomial logistic regression models) of men and women who are long- and short-range downwardly mobile in each demographic group. Table 4 shows the relative risk of long- and short-range downward mobility for each group in two multinomial logistic regression models: first containing all demographic predictors, and second adding highest educational qualification. The results from the first model can be considered to estimate the ‘total effect’ of each demographic predictor, including the portion running through education. The second model provides the ‘direct effect’ of each predictor, independent of education.
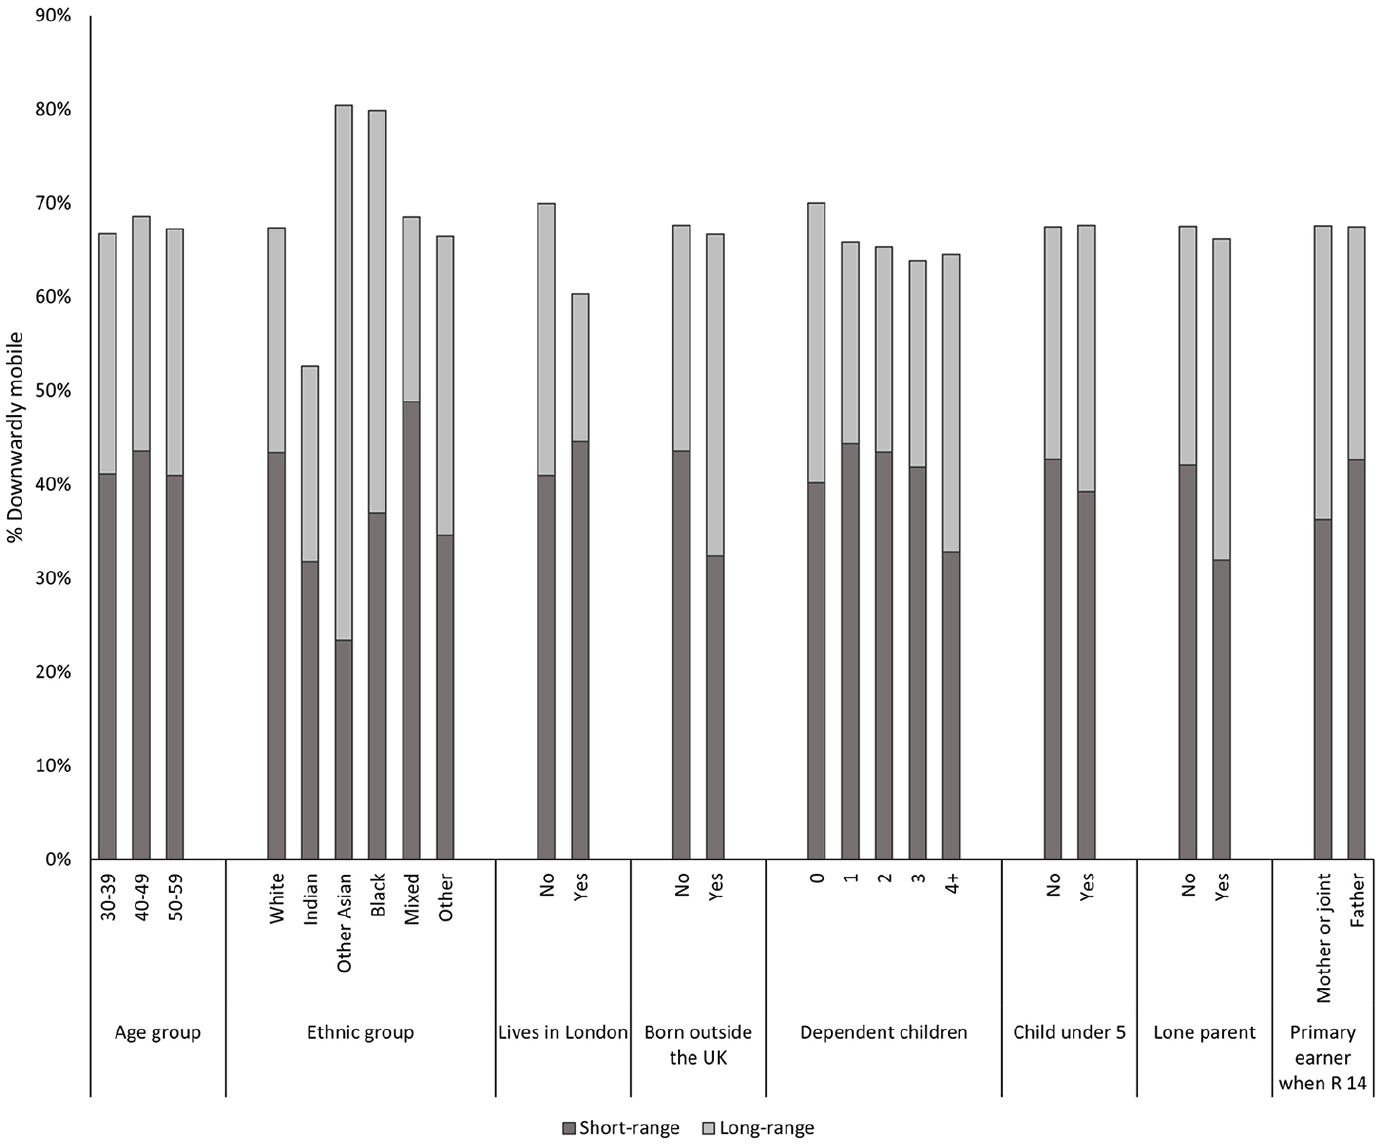
Downward mobility among men from advantaged backgrounds, by demographic group (predicted; N = 4162).
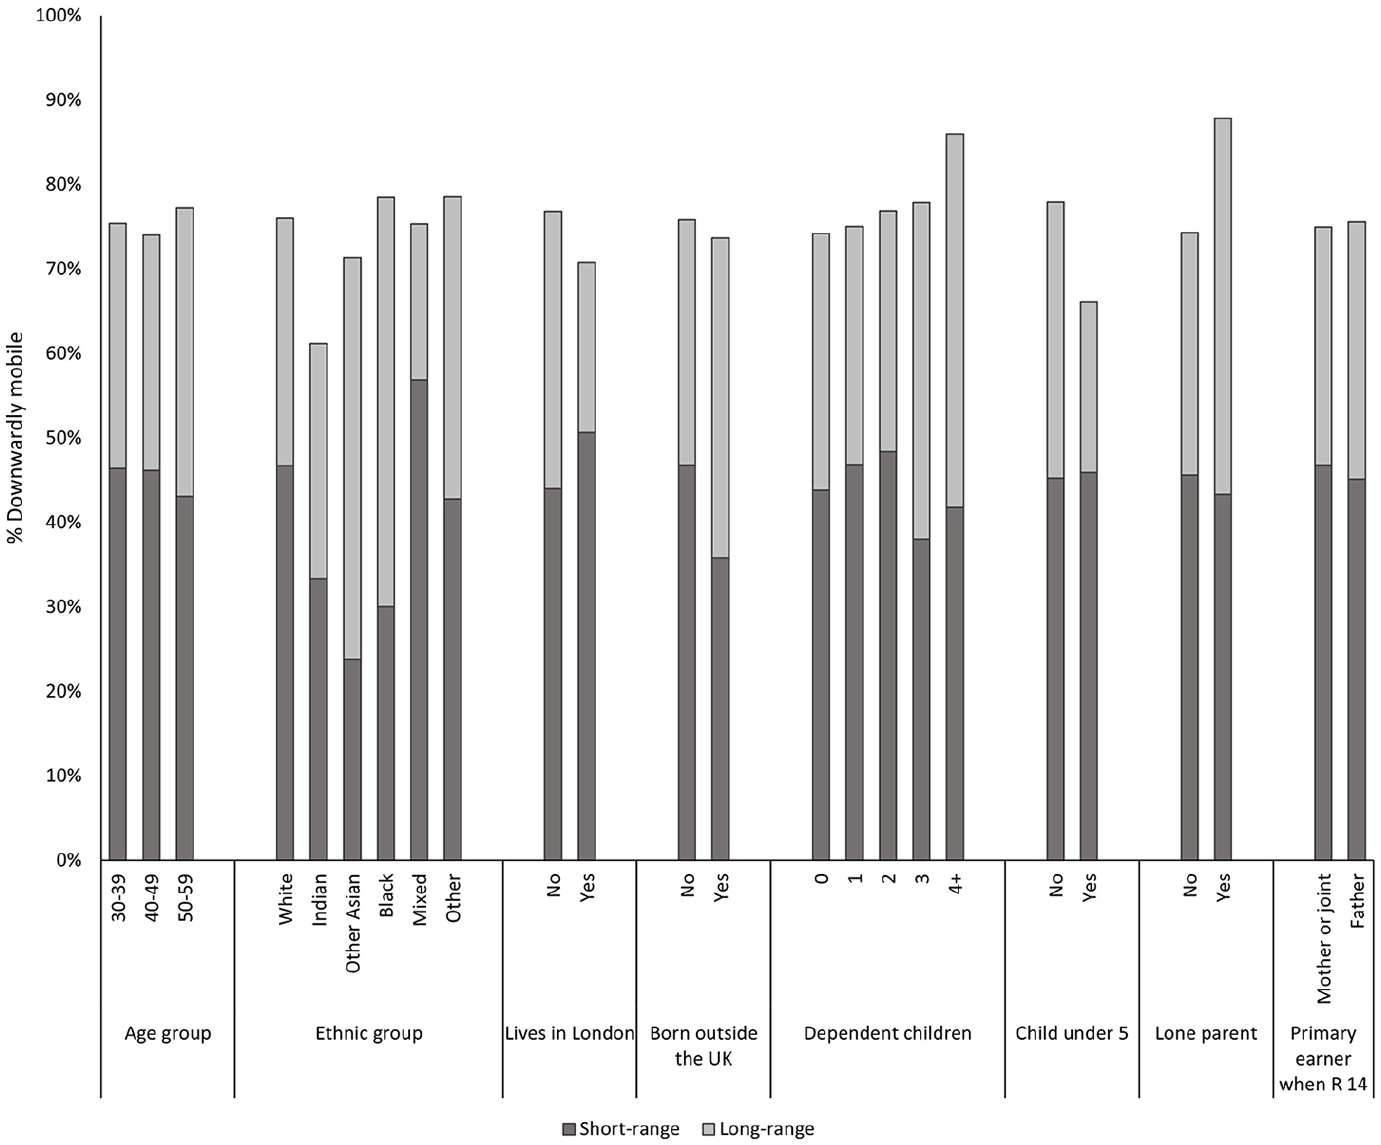
Downward mobility among women from advantaged backgrounds, by demographic group (predicted; N = 3830).
Predictors of short- and long-range downward mobility among men (N = 4162) and women (N = 3830) from advantaged backgrounds (relative risk ratios obtained from multinomial logistic regression).
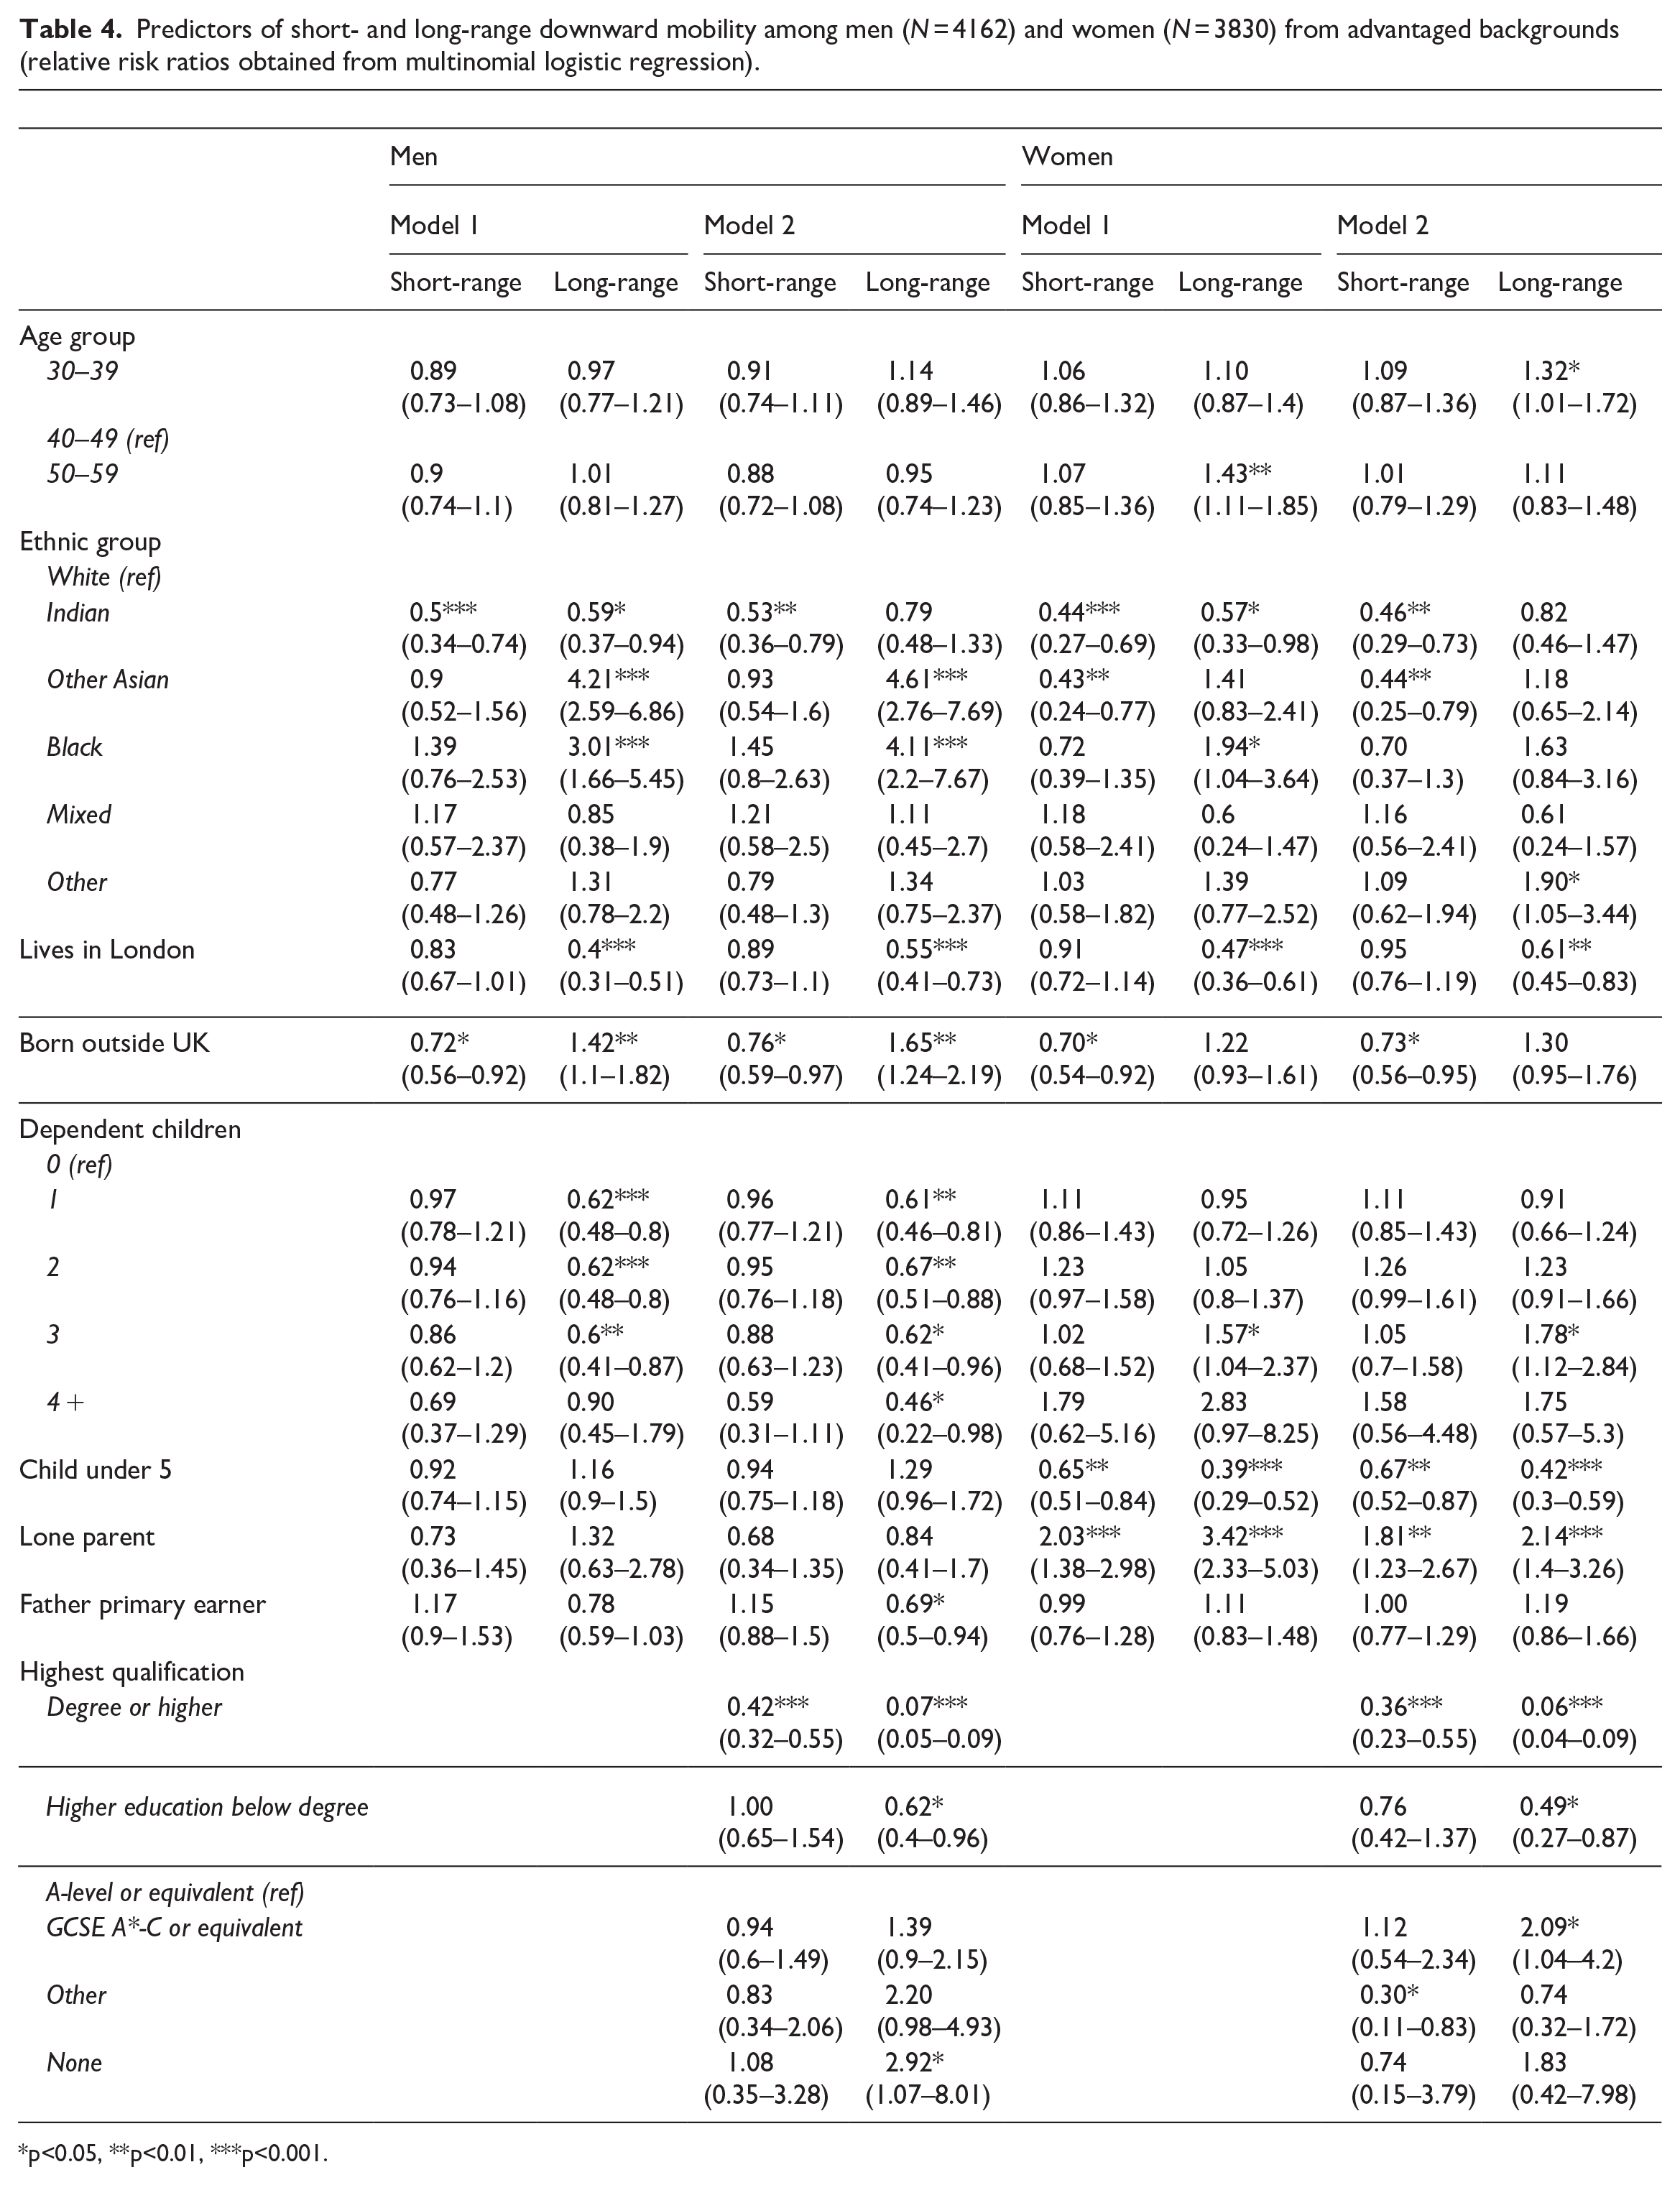
p<0.05, **p<0.01, ***p<0.001.
Ethnicity and immigration status
The results show that, for both men and women, rates of long- and short-range downward mobility are lower among those from Indian ethnic backgrounds than they are among Whites. The reduced risk of long-range mobility appears to be explained by higher average educational attainment. However, the reduced risk of short-range falls is preserved when adjusting for education.
By contrast, the risk of long (but not short)-range downward mobility is higher among Black than White respondents. Among Black women, this appears to be mediated by lower educational attainment. However, Black men are at increased risk even after accounting for education. The pattern among ‘Other Asian’ men is similar to that of Black men. However, ‘Other Asian’ women are at lower risk of short-range downward mobility than White women, and at no higher risk of long-range falls.
Independent of ethnicity, men born outside the UK are at higher risk of long-range downward mobility, but reduced risk of short-range mobility. Migrant women are also at lower risk of short-range downward mobility but do not share an increased risk of long-range falls.
Parenthood
Parenthood has a substantially different effect on the downward mobility risks of men and women. Having a large number of children (three or more) and (particularly) being a lone parent significantly increases the risk of both long- and short-range downward mobility for women, but not men.
Table 4 also reveals two apparently counter-intuitive patterns: (a) a reduced risk of downward mobility among men with children, relative to men without, and (b) a reduced risk among women with dependent children under 5. However, these are likely the result of confounding by life stage (in the former case), and later childbearing (in the latter).
A ‘London’ effect
Living in London consistently and robustly reduces the risk of downward mobility among both men and women. However, given the concentration of higher class and status occupations in London, this may be a selection effect (Friedman and Macmillan, 2017).
Education
Independent of demographic factors, educational attainment has the expected effect – with particularly degree-level qualifications substantially reducing the risk of downward mobility.
A separate analysis of graduates 8 shows that those who attended more prestigious institutions were less likely to be downwardly mobile. Oxbridge graduates were at the lowest risk – however, the difference between Oxbridge and Russell Group graduates was significant only for short-range falls.
Independent of institution and subject, the effect of degree performance was mixed. A first-class (versus a 2:1) degree predicted a reduced risk of short, but not long-range downward mobility, and only for men, whereas a 2:2 degree predicted an increased risk of long-range falls for men and an increase in short-range falls for women.
In terms of degree subject:
Male and female Arts and Humanities graduates had the highest risk of long- and short-range downward mobility. Medicine graduates had the lowest.
Studying Law (compared with Physical Sciences, Technology, and Engineering) reduced both long- and short-range falls for women, but only short-range falls for men.
Studying Social Science decreased the risk of long-range falls for men but increased them for women.
Studying a medical-related degree (such as nursing) increased the risk of short-range downward mobility, but only for women.
Demographic and educational predictors of class versus status mobility
Table 5 shows the proportion of men and women from C1S1 backgrounds who were (a) downwardly class but not status mobile (to C2S1 or C3S1) and (b) downwardly status, but not class mobile (to C1S2 or C1S3). Respondents who were stable in C1S1 were excluded from this analysis, therefore the denominator represents those who were downwardly mobile in both class and status terms.
Gender differences in rates of downward class versus status mobility (Male N = 3525; Female N = 3911).

p<0.05, **p<0.01, ***p<0.001.
Table 5 shows that, among those who were downwardly mobile, men were somewhat more likely to lose status than class. The reverse is true for women, and the difference is much more pronounced: downwardly mobile women were more than twice as likely to fall in terms of class than status.
Figures 3 and 4 show the predicted percentage (from multinomial logistic regression models) of downwardly mobile men and women in each demographic group who fell in terms of class versus status. Full multinomial logistic regression results are given in Web Appendix A.
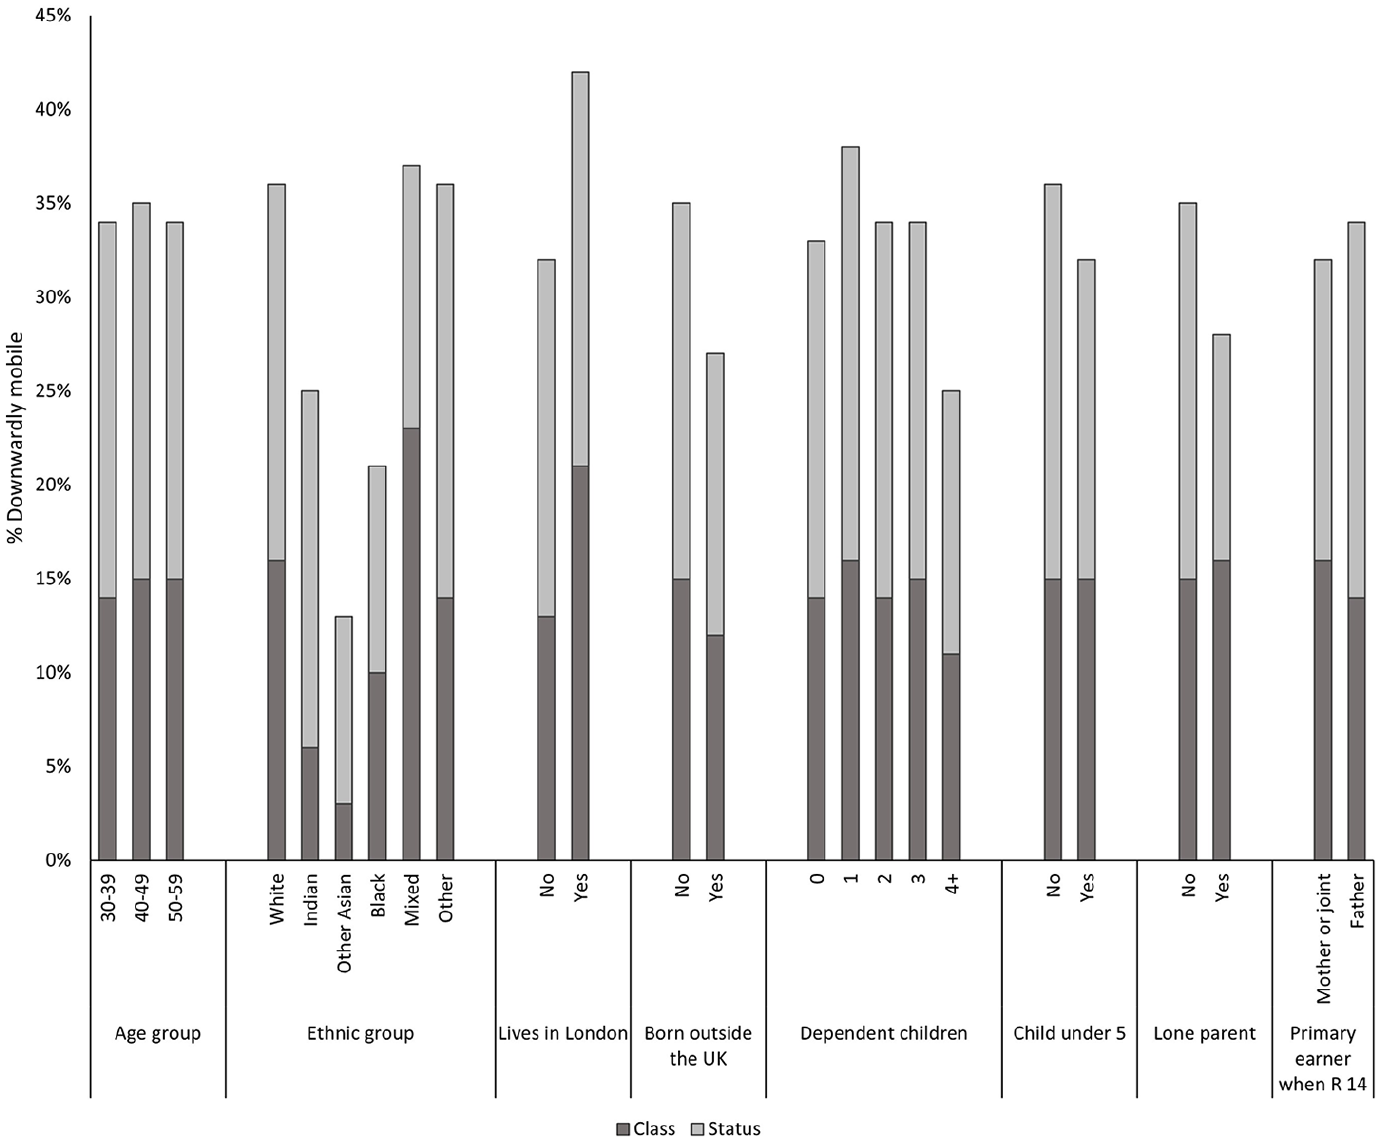
Downward mobility of class and status among men from advantaged backgrounds, by demographic group (predicted; N = 3474).
Downward mobility of class and status among women from advantaged backgrounds, by demographic group (predicted; N = 3795).
There were relatively few significant differences between demographic groups in the pattern of class versus status mobility. One notable exception is among those of Indian ethnicity. Indian men and women were substantially less likely than their White peers to be downwardly mobile in terms of class relative to status. For women, this represents a reversal of the pattern observed among other ethnic groups.
Education significantly predicted class versus status mobility. Graduates, especially, those in Social Sciences, Arts and Humanities, and Education, were more likely to experience downward mobility in terms of class than status. Among downwardly mobile graduates, those with Social Science degrees were over twice as likely as STE graduates to be downwardly mobile in class rather than status (male RRR = 2.61, p < 0.001; female RRR = 2.02, p < 0.001). This likelihood was over five times higher for Arts and Humanities graduates (male RRR = 8.70, p < 0.001; female RRR = 5.22, p < 0.001), and tens of times higher for Education graduates (male RRR = 48.30, p < 0.001; female RRR = 92.94, p < 0.001).
Discussion
The findings described above substantially extend the present understanding of socio-demographic inequalities in downward mobility. First, at the most general level, they show that such inequalities persist even among those whose parents hold occupations in the highest stratum of both class and status. This demonstrates that existing inequalities found in unidimensional research on class mobility do not arise from unobserved differences in parental status position. However, the central contribution of this research is to illuminate specific patterns of inequality when both class and status destinations are taken into account, thereby allowing future research to address more nuanced questions regarding determinants and mechanisms.
With respect to gender, existing research has shown that women from more advantaged backgrounds are more likely to be downwardly class mobile than their male peers (e.g., Bukodi et al., 2017; SMC, 2020). However, in this article, I show that this pattern is largely driven by a high likelihood that women from these backgrounds will move into highly respected, but ‘lower professional’ occupations. These include the creative professions, and, more commonly, teaching. Future research can therefore fruitfully focus on explaining this specific pattern, rather than focusing on why women from privileged backgrounds are ‘more likely to be downwardly mobile’ in general terms. To what extent is the specific pattern of mobility observed here driven by a ‘supply-side’ preference for more family-friendly roles, as Bukodi et al. (2017) argue with respect to class mobility? What is the role of direct gender discrimination in C1S1 career paths (Rivera and Tilcsik, 2016), and how might an awareness of such discrimination feed back into a preference for potentially more welcoming C2 S1 occupations (Moss, 2004)? At a structural level, to what extent is this pattern explained by a systematic tendency to reward female-dominated professions with respect, but under-value them in terms of economic rewards (Levanon et al., 2009)? Answering these questions will provide substantially greater insight into gender inequalities than a singular focus on class or income.
Ethnic inequalities in downward mobility show a substantially different pattern. Previous research has shown that Black workers from advantaged backgrounds are more likely than Whites to be downwardly class mobile (Platt, 2005b). My results replicate this finding but also show that, unlike gender inequalities, this effect is not mitigated by status retention. Black workers are at higher risk of both class and status loss and are at substantially higher risk of long-range falls in both. This effect is substantially mediated by educational attainment – entirely so for Black women, and significantly, though not completely, for Black men.
Again, uncovering this pattern allows us to ask the more specific question of why Black workers are at significantly higher risk of downward mobility in both class and status terms. The crucial mediating role of education suggests mechanisms operating earlier in the career pipeline than those driving gender differences. As already noted, ethnic inequalities in educational attainment have been extensively explored in previous research – with suggested explanations including cultural differences in attitudes to education (Strand, 2014), and stereotyping and discrimination against Black students (Phillips, 2011). However, perhaps particularly relevant to the pattern of downward mobility observed here are ethnic inequalities in material and cultural resources (Reay et al., 2005); such as access to private education, beneficial social networks, and insider knowledge of elite educational institutions and occupations (Macmillan et al., 2015; Rivera, 2016). It is plausible that these resources would be unequally distributed by ethnicity – even among high-status professional households. An alternative perspective on ‘cultural resources’ would also emphasize the unique experience of Black ‘middle-class’ (i.e., professional) families in the education system, with the work of Rollock et al. (2015) emphasizing the extent to which the experience of Black students from advantaged class backgrounds remains colored by racialized expectations among teachers, along with the challenges associated with navigating a Black identity in predominantly White middle-class spaces. Where the recognition and credentialization of White middle-class habitus and cultural capital are well recognized (Reay, 2010), the same may not be true for Black students from similar class – and status – backgrounds. These factors may help explain why ethnic inequalities in downward mobility risk appear to be set in train earlier and to affect both class and status destinations.
By contrast with the pattern observed for Black workers (but consistent with previous research), Indian men and women from the most advantaged backgrounds are significantly less likely than their White counterparts to be downwardly mobile. This research extends previous findings to show that Indian families are particularly resistant to downward class, rather than status, mobility. This appears to result from a high degree of clustering within specific professions. A fifth (19%) of Indian men and women from C1S1 backgrounds are medical professionals (primarily doctors), with a further 15% being IT professionals (17% of men and 10% of women). This may be partly explained by micro-class mobility, whereby relatively specific occupational groupings are inter-generationally inherited (Jonsson et al., 2009). For example, among those of Indian ethnicity from C1S1 backgrounds, almost a quarter (23%) had parents who were medical doctors.
Finally, in examining the effects of educational characteristics, a multidimensional lens shows that while Arts, Humanities, and Social Science graduates are more likely than STEM graduates to be downwardly mobile in terms of class, they commonly land in occupations that are nevertheless high status (and may have other rewards in terms of creativity and pro-sociality). This problematizes the current overwhelming focus on class and income in policy discussions of graduate outcomes. For example, official measures of graduate outcomes published in the UK are based entirely on salary and social class measures (Higher Education Statistics Authority, 2023). Hence an Arts program from which the majority of graduates held jobs in the creative sector that were prestigious, but lower paid, would be considered underperforming.
Conclusion
The findings described in this article demonstrate that a multidimensional perspective is vital to a full understanding of inequalities in downward mobility. A singular focus on class ignores important patterns of mobility that require explanation – such as the tendency for women from advantaged backgrounds to occupy high-status lower professional roles, the tendency of Indian men and women to be downwardly mobile in status rather than class, and the elevated risk of downward class and status mobility suffered by Black Britons. These specific patterns may implicate different mechanisms than the patterns revealed by unidimensional analyses – for example, the effect of status on occupational aspirations, and the role of status-related resources in the intergenerational inheritance of privilege (Blossfeld, 2019).
Different mechanisms may consequently have different implications for public policy and third-sector interventions. For example, an intervention which improved access to ‘professional’ roles among Black Britons – such as widening participation in science, technology, and engineering roles through advanced vocational programs – may address class mobility while failing to solve the causes of downward status mobility. Status position is of vital psychological importance to individuals, and high-status professions have an outsize social importance, independent of their position in social class schemes (Macmillan et al., 2015). Hence, any social mobility policy which continued to allow status to be hoarded by already advantaged socio-demographic groups would leave a crucial axis of inequality untouched.
Supplemental Material
sj-docx-1-sro-10.1177_13607804241281175 – Supplemental material for Inequalities in the Risk of Multidimensional Downward Mobility From the Most Advantaged Backgrounds
Supplemental material, sj-docx-1-sro-10.1177_13607804241281175 for Inequalities in the Risk of Multidimensional Downward Mobility From the Most Advantaged Backgrounds by Robert de Vries in Sociological Research Online
Footnotes
Funding
The author(s) disclosed receipt of the following financial support for the research, authorship, and/or publication of this article: This research was supported by a Leverhulme Research Fellowship, awarded by the Leverhulme Trust (RF-2022-236\7).
Supplemental material
Supplemental material for this article is available online.
Notes
Author biography
Robert de Vries is a Senior Lecturer in Quantitative Sociology at the University of Kent. His research focuses on inequality, social stratification, and the sociology of welfare.
References
Supplementary Material
Please find the following supplemental material available below.
For Open Access articles published under a Creative Commons License, all supplemental material carries the same license as the article it is associated with.
For non-Open Access articles published, all supplemental material carries a non-exclusive license, and permission requests for re-use of supplemental material or any part of supplemental material shall be sent directly to the copyright owner as specified in the copyright notice associated with the article.