
Abstract
It is theorized that income inequality is an indicator of status inequality and should therefore be associated with adverse health outcomes. In this article, we propose a novel way to capture status inequality more directly by measuring the distribution of self-perceived status in a society. We investigate whether status inequality in a society is associated with depression in the population. We show, first, that there is only a moderate association between subjective social status inequality and income inequality. Second, we provide evidence that depression is higher in countries with higher status inequality and that our novel measure of status inequality is more strongly associated with depression than the conventionally used income inequality measure. However, results are susceptible to influential country cases.
Introduction
There is a long-standing literature on the association between socio-economic status and health outcomes whereby outcomes are worse for individuals occupying positions lower in the social hierarchy and better for those higher up (Marmot, 2004). In addition, a more recent literature increasingly turns attention to the relationship between social context and population health (Beckfield et al., 2013). In the latter line of research, one of the key contextual explanatory variables is income inequality. Higher levels of income inequality are linked to lower life expectancy, worse mental health, and worse self-rated health (Kondo et al., 2009; Layte, 2011; Messias et al., 2011; Van Deurzen et al., 2015; Wilkinson and Pickett, 2006, 2010). In the last two decades, the notion that social and economic equality in a society might be associated with beneficial health outcomes for the population has been identified as the “big idea” in both population health and social science research (Beckfield, 2004; Lynch and Smith, 2002).
One prominent theory to explain the relationship between income inequality and health is the psychosocial mechanism which posits that income is not merely a means by which material needs are fulfilled but is also widely understood by individuals as recognition of social worth and social status (Layte and Whelan, 2014; Marmot, 2004; Ridgeway, 2014; Wilkinson and Pickett, 2010). The desire for this kind of status may well be a fundamental human quality (Anderson et al., 2015) and in evolutionary psychology is thought to be hard-wired even if maladaptive for modern society (Wood et al., 2012). Measures of insubordination have been convincingly linked to anxiety and depression (see Johnson et al. 2012 for a review). The psychosocial hypothesis assumes that income inequality in terms of the size of the gap between high and low earners is an indicator of the size of the gap between high and low status (Wilkinson and Pickett, 2010). High income inequality is thus taken as a proxy for high status inequality. People living in societies with high levels of income inequality, not just those at the bottom but at all levels of the income hierarchy, are assumed to experience higher levels of stress and status anxiety as a direct result of high levels of income inequality which create competitive environments in which status distinctions thrive (Wilkinson and Pickett, 2006, 2010).
Despite strong intuitive and theoretical appeal, the idea that income inequality is associated with health outcomes is also contested. Some experts in the field argue that the evidence on the relationship between income inequality and health is not robust (Beckfield, 2004; O’Donnell et al., 2015). A recent review concludes that there is large heterogeneity among studies looking at the relationship between income inequality and mental illness (Ribeiro et al., 2017). On the theoretical front, sociologists and epistemologists alike have criticized the literature for its strong reliance on income inequality as a measure of social, economic, or status inequality. From a sociological perspective, Goldthorpe (2010) argues that it is a mistake to measure social stratification by a single dimension, such as income inequality, and sociologists, in particular, need to consider other measures of contextual inequality. Similarly, Lynch and Smith (2002) argue that inequality is a multidimensional construct that cannot be limited to income differences. In the same vein of thought, Beckfield (2004) writes that “it is also possible that inequality harms health, but income inequality does not” (p. 241).
In this study, we build on this literature and draw attention to the idea that income inequality might not be the only or best way to capture status inequality. In classical sociology, status was conceptualized as a separate dimension of inequality alongside material resources and power (Weber, 1968 [1922]) Social status is unlikely to depend entirely on income (Goldthorpe, 2010), and characteristics such as class, ethnicity, gender, intelligence, and other factors are also used to make status distinctions (Anderson et al., 2015; Ridgeway, 2014). Japan is typically given as an example of a society that has a relatively low level of income inequality but a high level of status inequality largely based on occupational prestige. Different dimensions of socio-economic inequalities are thus not always aligned and it is conceivable that a society with low income inequality has high status inequality or the other way around.
We propose a novel way to capture status inequality more directly—measuring it via subjective social status (SSS) on a societal level. Our study thus makes a contribution to the comparative sociology literature by providing an alternative account of contextual inequality, namely, inequality in SSS. SSS is measured at the individual level reflecting a persons’ own perception of where they stand in the social hierarchy (Evans and Kelley, 2004). We use this indicator to construct a contextual measure of SSS inequality to characterize societies and to evaluate how dispersed is a population in how individuals feel about their social status. Our empirical application entails linking social status inequality with the prevalence of depressive symptoms across countries in Europe. We also address whether income inequality reflects status inequality in a society and whether it is status inequality or income inequality that is more strongly associated with depression.
To conduct the study, we use data from the 2012 wave of the European Social Survey (ESS). This wave of ESS is a unique source to estimate status inequality as it provides harmonized information on both SSS and depression across 29 European countries. Our results demonstrate that compared with income inequality, SSS inequality is more strongly linked with depression in the population. The latter suggests that both conceptually and empirically, subjective status inequality might be a better indicator to capture status inequality on a societal level. However, our findings are susceptible to influential country cases. Our recommendation to the scientific community is to add items measuring SSS in surveys on a more regular basis; this would allow us to investigate status inequality further and compare it with conventional measures of inequality. This would help bring the comparative sociological literature further and it would make a valuable contribution to the epidemiological literature too.
Theoretical background
Social status and social status inequality
Social status refers to an individual’s relative standing based on prestige, honor, and deference (Berger et al., 1972). An important feature of social status is that it is culturally constructed and based on widely shared evaluations of where different people should stand in the social hierarchy as well as who deserves to be more esteemed, respected, and recognized (Berger et al., 1972). From a Weberian (1968 [1922]) perspective, social status is a separate construct from resources and power. However, processes that produce SSS are often intertwined with the allocation of resources and power in society (Evans and Kelley, 2004; Ridgeway, 2014). Lindemann and Saar’s (2014) study showed that at the individual level, subjective status is associated with higher income, higher education, higher occupational class, but is low among the unemployed. Thus, it appears that the major dimensions of objective socio-economic status have separate and additive effects in the formation of subjective status. What makes social status a more complex construct—as compared with resources and power—is this element of social honor and social worth that it entails. People classify one another, and themselves, based on various characteristics and behave toward each other based on their ideas and stereotypes related to these characteristics (Park, 1928). Status is often afforded to those that are perceived to be more competent or having higher instrumental social value (e.g. intelligence, skills), but depending on cultural traditions or preferences a range of other aspects might matter too (e.g. gender, race or beauty) (Anderson et al., 2015). From this perspective, social status can be seen as an outcome of different achieved and ascribed characteristics and the extent to which these characteristics matter in a particular context.
Sociological research has not paid as much attention to status as to other socio-economic dimensions. This is surprising since people care about status—their sense of being valued by others—“as intensely as they care about money and power” (Ridgeway, 2014: 2) and by neglecting status we may limit our understanding of the nature and causes of inequality. Since status is something that is grounded in people’s perceptions and evaluations of others and themselves (Anderson et al., 2015: 4), it is sometimes considered an abstract construct. However, studies in experimental psychology show that people are remarkably accurate in perceiving the status of others and they are similarly accurate in perceptions of their own status (Anderson et al., 2006, 2015). These studies show that even after brief encounters in groups, people quickly recognize each other’s status and there is a high correlation between how people evaluate their own status and how others evaluate their status. Status appears to be equally well represented by self-reported status as by evaluations of status from peers (Anderson et al., 2006). This suggests that there are widely shared social norms and understandings regarding who is deserving of status and who is not (Paskov, 2015).
Consistency of status as a construct in prior studies supports the notion that ladder-based measures of SSS typically included in social surveys are a reasonable way to measure status. Ladder-based measures of subjective status commonly ask respondents to place themselves on a ten-step ladder ranging from bottom to the top of a society (Evans and Kelley, 2004). The expectation is that SSS will pick up all the dimensions that are relevant for status formation (Adler and Tan, 2017). On the one hand, self-reported status is likely to incorporate a wide range of objective circumstances, such as quality and prestige of education, income from various sources, wealth, occupational prestige, power at work, future economic prospects, housing situation, and so forth. However, it is not only objective factors that it will capture, but also the more subjective factors and ascribed characteristics that have personal and cultural relevance. We know from prior work that men perceive themselves to be higher in status than women, and the relationship with age is U-shaped, sinking in the middle years but rising in older age (Lindemann and Saar, 2014). Ethnicity and race are other salient dimensions of status inequality, with resources being unequally distributed between groups in most countries, along with accompanying cultural status beliefs and stereotypes (Ridgeway, 2014). SSS is thus expected to capture a range of relevant dimensions that feed into status construction and that single economic measures such as income are unable to capture.
Status inequality is a characteristic of a society and refers to differences between individuals and groups in terms of social status. In a status unequal context, there are larger differences in social status implying that people make a stronger distinction regarding where different people stand and how much esteem they deserve. Considering that status is likely to include a range of dimensions relevant for status formation, status inequality can be seen as a final product of various forms of inequalities that exist in a society based on achieved or ascribed characteristics of individuals and the relative importance of these characteristics for status formation.
The application of income inequality as a proxy for status inequality is highly common but problematic as it is heavily reliant on the assumption that it is income, in particular, that is the most important dimension of social status within a given society. However, income is unlikely to be the only or the most important factor in defining societal hierarchies (Goldthorpe, 2010). As described above, it is likely that inequalities in other dimensions feed into status inequalities. There could be multiple ways to attain status and depending on context different characteristics might matter; furthermore, one form of status might compensate for the lack of other and this might differ across social contexts. As an example, having a respectable occupation or fulfilling some other duty, such as caring for family, could compensate for a low income position. This perspective relates to the idea of a pluralistic society in which there could be multiple ways to attain social status (Fishkin, 2014). Status inequality could thus be seen as a global measure of various underlying social inequalities that are prevalent in a particular context and matter in the construction on individuals’ social status.
A related argument is that income differences might be more or less likely to translate into status differences depending on other contextual factors, including the level of economic development, social welfare system, or culture. This idea can be linked to the philosophical literature where a distinction is made between distributive equality, on the one hand, and relational or social equality, on the other (Miller, 1997). In contrast to distributive concerns, social equality “identifies a social ideal, the ideal of a society in which people regard and treat one another as equals, in other words a society that is not marked by status divisions” (p. 224). Further, Miller goes on, “where there is social equality, people feel that each member of the community enjoys an equal standing with all the rest that overrides their unequal ratings along particular dimensions” (p. 232). Relational egalitarians imagine a society in which socio-economic differences, by say earnings or occupation, are not accompanied by derogation, stigmatization, and deference in social exchanges. 1 From this perspective, we could imagine a status equal society where people would attribute (or not attribute) respect and social worth to others notwithstanding their achieved and ascribed attributes. For example, in a society that is sufficiently prosperous to allow everyone to have a decent standard of living, income inequality might not translate into as much status inequality as in a poorer society where income differences have more noticeable consequences for quality of life and potentially also status perceptions. The innovative feature of our study is to measure status inequality more directly instead of relying on income inequality as a proxy of status inequality.
Status inequality and depression
Since aspiring to social status is seen as a fundamental human motive (Anderson et al., 2015), if it is unfulfilled people should experience chronic ill effects such as enduring stress and psychological distress (Leary, 2005). These claims are more than theoretical and there is evidence from psychological and biological research that social status is positively associated with both psychological well-being and health (for reviews of the evidence, see Anderson et al., 2015; Johnson et al., 2012). More recently, there have been some sociological contributions using survey data and showing that, at the individual level, social status is associated with mental health outcomes, and the link operates over and above the effects of objective socio-economic characteristics (Demakakos et al., 2008; Präg, 2020; Präg et al., 2016; Singh-Manoux et al., 2003). Although we know less about the direction of causality. 2 Furthermore, the literature also suggests that threats to status and loss of status or downward mobility are associated with worse mental health outcomes (Gugushvili et al., 2019; Präg and Gugushvili, 2021; Simandan, 2018). While it is relatively straightforward to imagine that individual’s social status would be associated with mental health outcomes—why would living in a context where SSS is more unequally distributed be linked with depression? We discuss four different mechanisms that are commonly put forward in studies looking at the relationship between income inequality and adverse social and health outcomes.
First, there is the psychosocial mechanism, which proposes that status inequality might increase the salience of status and cause status anxiety (Delhey and Dragolov, 2013; Delhey et al., 2017; Layte and Whelan, 2014; Paskov et al., 2016; Schneider, 2019; Wilkinson and Pickett, 2010). Since status is a fundamental human motive, people are wired to pay close attention to status dynamics and are conscious of their position relative to others (Anderson et al., 2015). Larger status differences are thus likely to fuel the social perception of differences between people as they amplify the idea that some “types” of people are “better” and others are “worse.” Even high-status individuals might be affected by this increased salience leading people to be more concerned about their relative position in the status hierarchy as suggested by the keeping up with the Joneses hypothesis (Veblen, 1931). Increased status competition and anxiety about one’s position in the society can then be reflected in heightened depression rate.
A second mechanism, closely linked to the first one, is that status inequality might affect depression by increasing the fear of falling down in the social ladder. It is established that people experience affective reactions to status threats, both real and imagined (Dickerson and Kemeny, 2004; Gugushvili et al., 2019; Paskov et al., 2021; Cohen et al., 2019). Having large status differences in a society might present a potential for falling down the status hierarchy. Fear of social decline might directly lead to adverse psychological consequences even among those that are higher up in the social ladder due to fear of status loss.
Third, status inequality is likely to shape social relations and social interactions between individuals and groups (Delhey and Dragolov, 2013; Ridgeway, 2014). Heightened status differences can create conflicts if status challenges from those lower in the hierarchy are met with hostility and resistance by those higher up who are eager to defend their position (Bobo, 1999). At the same time, low-status individuals are more likely to behave in intimidating and aggressive ways since their need for status and social respect is not fulfilled (Anderson et al., 2015). Furthermore, daily social interactions that produce status inequalities require certain elements of interaction—communication of superiority and inferiority and putting others down. As a consequence, daily interactions between people with different levels of status are likely to be more stressful. By contrast, a society in which different types of people are valued and tolerated should have positive consequences for psychological well-being of individuals, who can attain respect and social worth in being the way they are. Societies that marginalize some groups and lower their self-worth and dignity can create an overall hostile environment. This can have a spill-over effect to those that are not directly marginalized themselves. Overall, via more hostile and uncomfortable daily interactions, people can experience more depressive symptoms in status unequal contexts.
Fourth, status inequality might lead to frustration because it reinforces socio-economic inequality and weakens equality of opportunity (Ridgeway, 2014). Since status inequality affects perceptions of who is better, more competent, and more deserving of jobs, money, and power—higher status differences imply that there is a lot to gain and to lose from status mobility. Status matters for who is taken seriously and who is listened to (Ridgeway and Nakagawa, 2014). Such beliefs about large differences in terms of social worth and competence have a feedback loop and influence the actual socio-economic inequalities. Borrowing an example from Ridgeway (2014), men having economic advantage over women contributes to a belief that men are “better.” This belief translates into advantage in acquiring further economic benefits—men will be evaluated as more capable and will be more likely to be promoted to positions associated with higher economic benefits. As a consequence, a status belief that men are better leads to a material inequality between men and women. Hence, status difference constitutes an independent dimension that reinforces material inequality and leads to unequal opportunities. Status is not only something that is nice to have for self-esteem, but it matters for determining access to valued life outcomes (income, jobs, power, and status). Lack of equality of opportunity in achieving success and social status is likely to lead to frustration and diminish psychological well-being. Referring to the work of Merton (1968), it is particularly problematic when an established norm or need to attain status is coupled with a social structure that restricts modes of reaching these goals for a considerable part of the population. People who fail to achieve status are likely to feel defeated; they might experience it as a manifestation of remaining far behind in the race for recognition (Gugushvili et al., 2019). When personal goals and means to achieve these goals do not correspond, people are likely to experience depressive symptoms.
The four mechanisms described above suggest that status inequality generates a range of conditions that in turn are likely to be associated with depressive symptoms among the population, including status anxiety and fear of status loss, hostile social interactions, and frustration stemming from inequality of opportunity. It is the chronic and sustained nature of these status-based stresses, experienced in everyday lives in status unequal societies, that is likely to be damaging to mental health (Cohen et al., 2019). Based on these mechanisms, we expect that depressive symptoms are heightened in contexts where there is more SSS inequality, while in status-equal contexts, the prevalence of depressive symptoms is lower. Moreover, we expect status inequality on a contextual level to contribute to depressive symptoms of individuals over and above the effects of individual objective and subjective standing. In other words, we expect that individuals living in a status unequal contexts are more depressed notwithstanding their own relative standing in the society. What is more, we expect that subjective status inequality is a more comprehensive measure of inequality and hence more strongly associated with depressive symptoms of the population than income inequality.
Methodology
Data
We use round 6 of the ESS, for which the fieldwork was conducted in 2012 and 2013. The ESS is among the highest quality comparative surveys in the world where harmonized measures make cross-country comparisons reliable and informative. The study employs random probability sampling of private households, and the data are collected in face-to-face interviews (European Social Survey, 2014). We pool data from the following 29 countries: Albania, Belgium, Bulgaria, Switzerland, Cyprus, Czech Republic, Germany, Denmark, Estonia, Spain, Finland, France, the United Kingdom, Hungary, Ireland, Israel, Iceland, Italy, Lithuania, the Netherlands, Norway, Poland, Portugal, Russia, Sweden, Slovenia, Slovakia, Ukraine, and Kosovo. With the exception of Kosovo, Albania, Russia, Ukraine, and Bulgaria which were ranked as “high,” these countries were rated as “very highly developed” by the Human Development Index in 2012. 3 After dropping cases with missing information on any of our key variables (3% of the sample), our effective sample size is 52,672 individuals, ranging from 675 cases in Iceland to 2923 cases in Germany. We apply design weights and population size weights in all our analyses.
Variables
Depression
To measure depressive symptoms we use the Center for Epidemiologic Depression Scale (CES-D), which is a survey instrument designed to identify populations at risk for developing depressive disorders (Radloff, 1977). The European Social Survey included the eight-item version of the scale which is based on the following questions: Please tell me how much of the time during the past week: (1) you felt depressed? (2) you felt that everything you did was an effort? (3) your sleep was restless? (4) you were happy? (5) you felt lonely? (6) you enjoyed life? (7) you felt sad? and (8) you could not get going? The answer options (and scores assigned) are: None or almost none of the time (0), some of the time (1), most of the time (2), all or almost all of the time (3). The two positively worded items (items 4 and 6) are reverse-coded. Before summing into a single depression index, we used a regression-based multiple imputation procedure to deal with missing values on the depression items (which constitute 6% of the sample), where estimates are based on the non-missing items within the CES-D battery. This means, for example, a single missing item will have a value imputed based on regressing the other seven items in the battery, and so on. The advantage of this imputation approach is that any bias related to particular items that are difficult to answer (perhaps more so for those with depression) will be reduced. Nonetheless we subject our dependent variable to a number of robustness checks and use alternative specifications (see section on “Robustness checks”). Individuals with missing values for all eight questions are dropped from the analysis (n = 78). The resulting dependent variable scale runs from 0 to 24 with higher scores indicating greater severity and frequency of depression. The eight items have a Cronbach’s alpha of 0.84 after imputation. 4
Subjective social status
SSS is captured with a single survey item and is formulated in the survey as follows: There are people who tend to be toward the top of our society and people who tend to be toward the bottom. Where would you place yourself on this scale nowadays? The respondents were presented with an 11-box display from bottom to top and where 0 is “the bottom of our society” and 10 “the top of our society.” We also include a quadratic term of SSS to test for non-linear effects. Missing cases on SSS were 2 percent of the sample and were dropped from the analysis.
SSS inequality
The main contribution of this study is to introduce a novel measure of SSS inequality in a country. To measure SSS inequality, we take the standard deviation as a measure of variation or dispersion, expressing the variability of a population around the mean. A low standard deviation indicates that data points are close to the mean, while a high standard deviation indicates that the data points are spread out over a wider range of values, the latter suggesting more inequality. Standard deviation is a reliable measure of inequality when it comes to variables of this nature (Kalmijn and Veenhoven, 2005). One concern with using standard deviation as a measure of inequality is the fact that it is correlated with the mean; however, we can account for this common variance between the mean and the standard deviation by including them to the model simultaneously (Veenhoven, 2012).
To compare how our new measure of status inequality compares with income inequality, we incorporate the Gini coefficient in household equivalized income attained from the World Bank in our analyses.
Control variables
We control for a range of socio-economic status and demographic variables. Socio-economic status is captured via three different variables. First, social class is measured using the European Socioeconomic Classification (hereafter ESeC) that is based on occupations and is specifically designed to facilitate comparison across countries (Rose and Harrison, 2010). ESeC scale is collapsed into a five-category hierarchical occupational class scale running from highest to lowest social class: (1) high salariat, (2) low salariat, (3) intermediate (including the self-employed and lower technical and supervisory occupations), (4) lower service, sales, technical, and (5) routine. We include a sixth category to indicate that information on class is missing (11.5% of the population). Second, where someone stands in terms of household total net income (after taxes and deductions) is captured in each country as 10 deciles, which we recode within each country into four income groups: (1) low (decile 1–2), 2) middle and below (decile 3–5), (3) upper middle (decile 6–8), and (4) high (decile 9–10). We include a fifth category in the income variable to indicate missing information on household income (18.8% of the population). Third, we include economic activity in the following categories: (1) employed, (2) unemployed, (3) long-term ill, (4) retired, and (5) other (including missing). In terms of demographic factors, we include age, sex, and ethnic minority as controls in all models. Age is captured as a continuous variable while sex and ethnic minority status are captured with a single dummy variable indicating female (vs male) and ethnic minority (vs native). Finally, to account for between-country heterogeneity in economic development, we control for country gross domestic product (GDP) per capita adjusted for purchasing power parity (PPP), which we log to correct for its skewed distribution. These data are attained from the World Bank.
Descriptive statistics of all variables are presented in Table 1.
Summary statistics (N = 46,169).
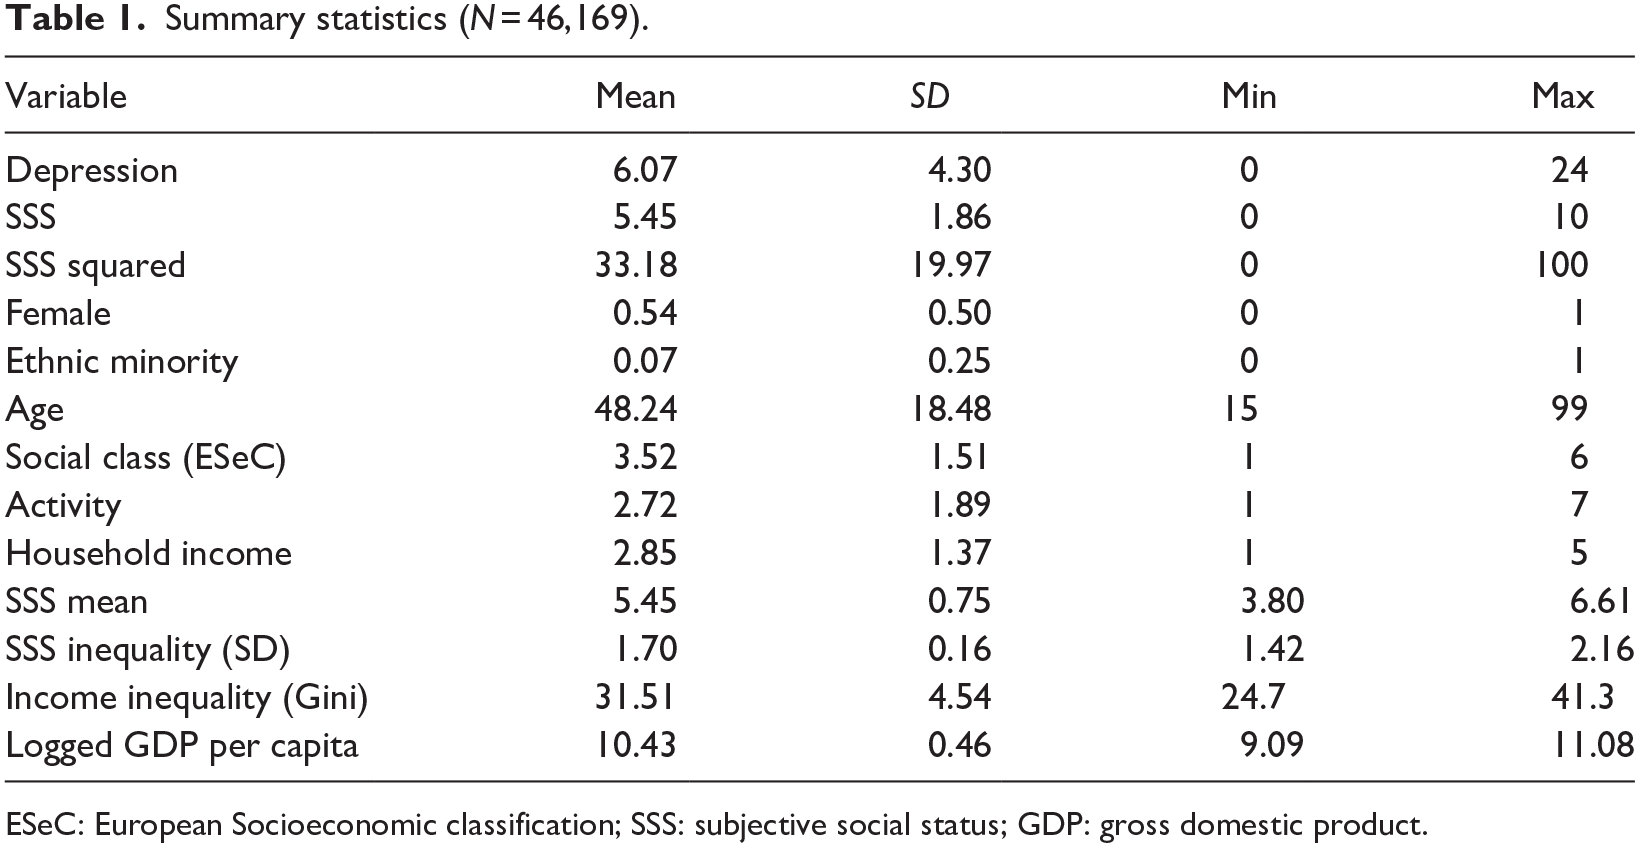
ESeC: European Socioeconomic classification; SSS: subjective social status; GDP: gross domestic product.
Results
Social status inequality in European countries
The main variable of interest in this study is social status inequality showing how dispersed the population is in their SSS evaluations. In Figure 1, we depict where countries rank in terms of the level of SSS inequality plotted against average scores on SSS (SSS mean) on the country level. The figure illustrates that countries with the lowest level of social status inequality are the Netherlands, Belgium, Spain, and Nordic countries like Sweden, Denmark, Norway, and Finland. In these countries, people tend to rank their status relatively similarly. By contrast, in countries like Albania, Kosovo, Israel, Bulgaria, and Czech Republic, people differ more in how they rank themselves in the social hierarchy. These countries have high subjective status inequality. There is only a moderate negative correlation between status inequality and average rates of subjective status (correlation =−18). There is a cluster of mostly rich countries (the Netherlands and the Nordic countries) where a high country average in subjective status is paralleled with low status inequality. In those countries, most people score relatively high on subjective status. While country average in subjective status is also high in Albania, Kosovo, and Israel, they score much higher in terms of status inequality. As revealed by Figure 5 in Appendix 1, these different averages and dispersions stem from varying distributions on the subjective status scale across countries. For example, in the Netherlands, the majority of the population (around 80%) ranks their status as 6, 7, and 8, while in Albania, people are more likely to rank themselves across the whole continuum of the status scale ranging from 0 to 10. The high average in Albania is driven by the fact that 10 percent of the population ranks their status as a 10, while only 1.3 percent of the Dutch population ranks their status as a 10. This tells us that country averages and inequality in subjective status can tell a different story.
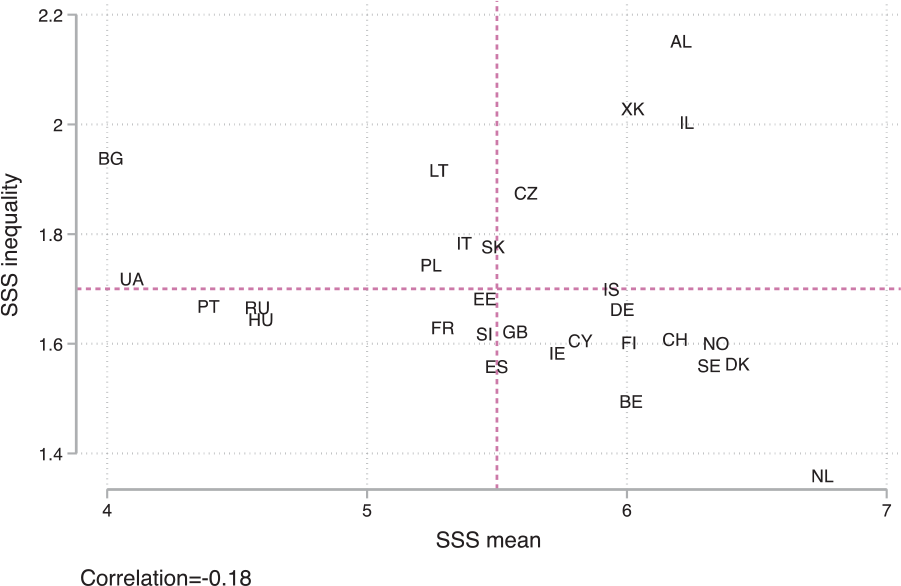
Subjective social status inequality (SSS inequality) and SSS mean across European countries.
SSS inequality and depression: descriptive statistics
We start by looking at the relationship between SSS and depression on the individual level. Figure 2 confirms that there is a negative relationship between SSS and depression, individuals who score higher on SSS have fewer depressive symptoms. The negative relationship between SSS and depression appears to be tailing off at the highest levels of SSS. However, since the absolute number of people scoring very high or very low on SSS is small, the confidence intervals at the top and bottom of SSS are larger. While the direction of causality is unknown, our descriptive data confirm prior findings that lower SSS is associated with more depressive symptoms.
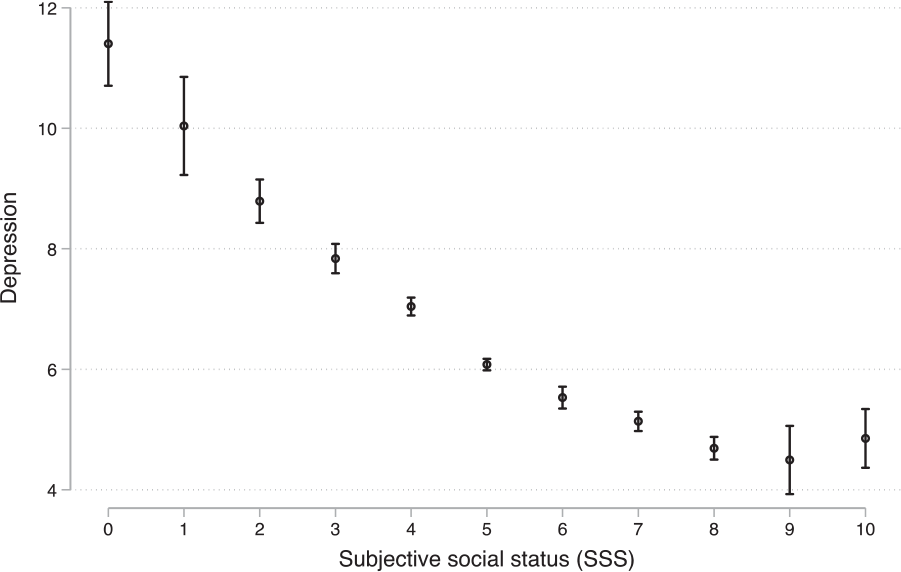
Relationship between SSS and depression on the individual level with 95 percent confidence intervals.
We now move away from the individual level and look at the relationship between SSS and depression on an aggregate country level. Figure 3 depicts bivariate associations between average rate on depression and the following variables: (a) SSS inequality, (b) SSS mean, and (c) income inequality (Gini coefficient). Finally, Figure 3(d) includes a figure to illustrate the relationship between SSS inequality and income inequality. Figure 3(a) shows that there is a positive bivariate association between SSS inequality and depression (correlation coefficient of 0.69). Countries with higher rates of SSS inequality have higher rates of depression. We can see that countries like Norway, Denmark, and Sweden are low on both in SSS inequality and depression, while countries like Albania, Kosovo, Lithuania, and Czech Republic are high on both SSS inequality and depression. The figure shows that Albania is faring by far the worst with an average score of 9 in depression compared with Norway with an average score of 4 on depression. Figure 3(b) shows that there is a negative bivariate association between SSS mean and depression (correlation coefficient of −0.49), countries with higher averages on SSS have lower rates of depressive symptoms. Figure 3(c) depicts the association between depression and income inequality (the latter is measured with a Gini coefficient). We can see that the relationship between depression and income inequality is only weakly positive (correlation coefficient of 0.20). These descriptive figures suggest that SSS inequality is more strongly associated with depression than income inequality. Finally, in Figure 3(d), we show that the correlation between income inequality and SSS inequality is not very high (correlation coefficient of 0.22). The latter casts doubt on the idea that income inequality is a good proxy for status inequality.
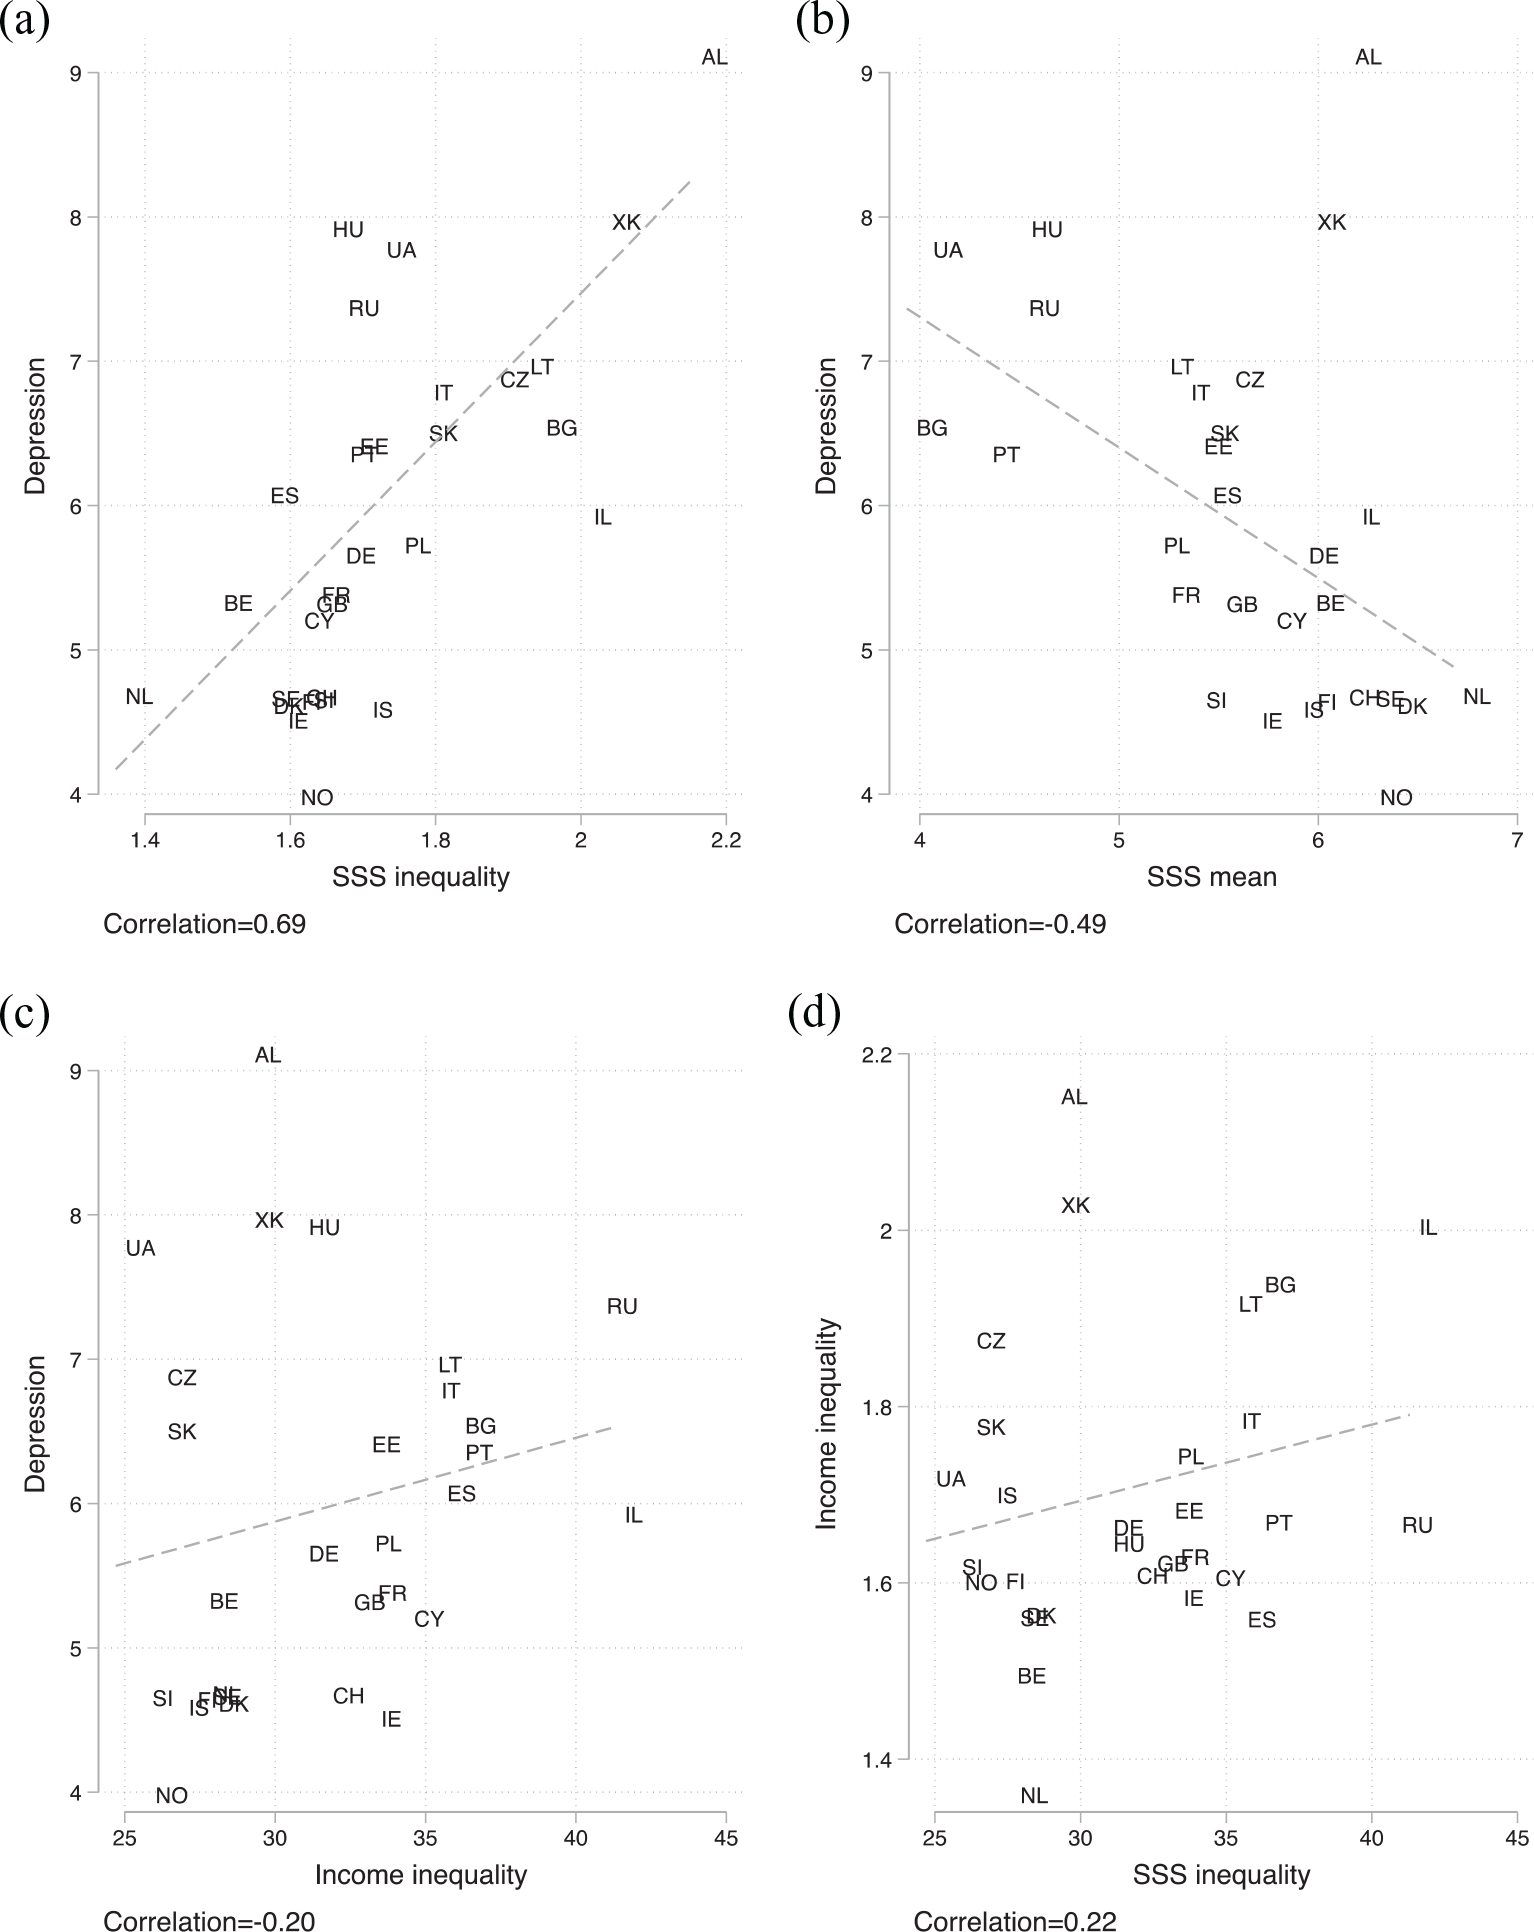
The association between SSS inequality and depression of the population: (a) SSS inequality, (b) SSS mean, and (c) income inequality, and (d) relationship between SSS inequality and income inequality.
Statistical models
To explore the relationship between status inequality and depressive symptoms beyond bivariate associations and to account for a range of micro- and macro-level determinants, we fit a number of multilevel (random intercept) models. The null model (not shown) suggests an intra-class coefficient (ICC) of 0.094, which means that country-level factors explain 9.4 percent of the variance in depression.
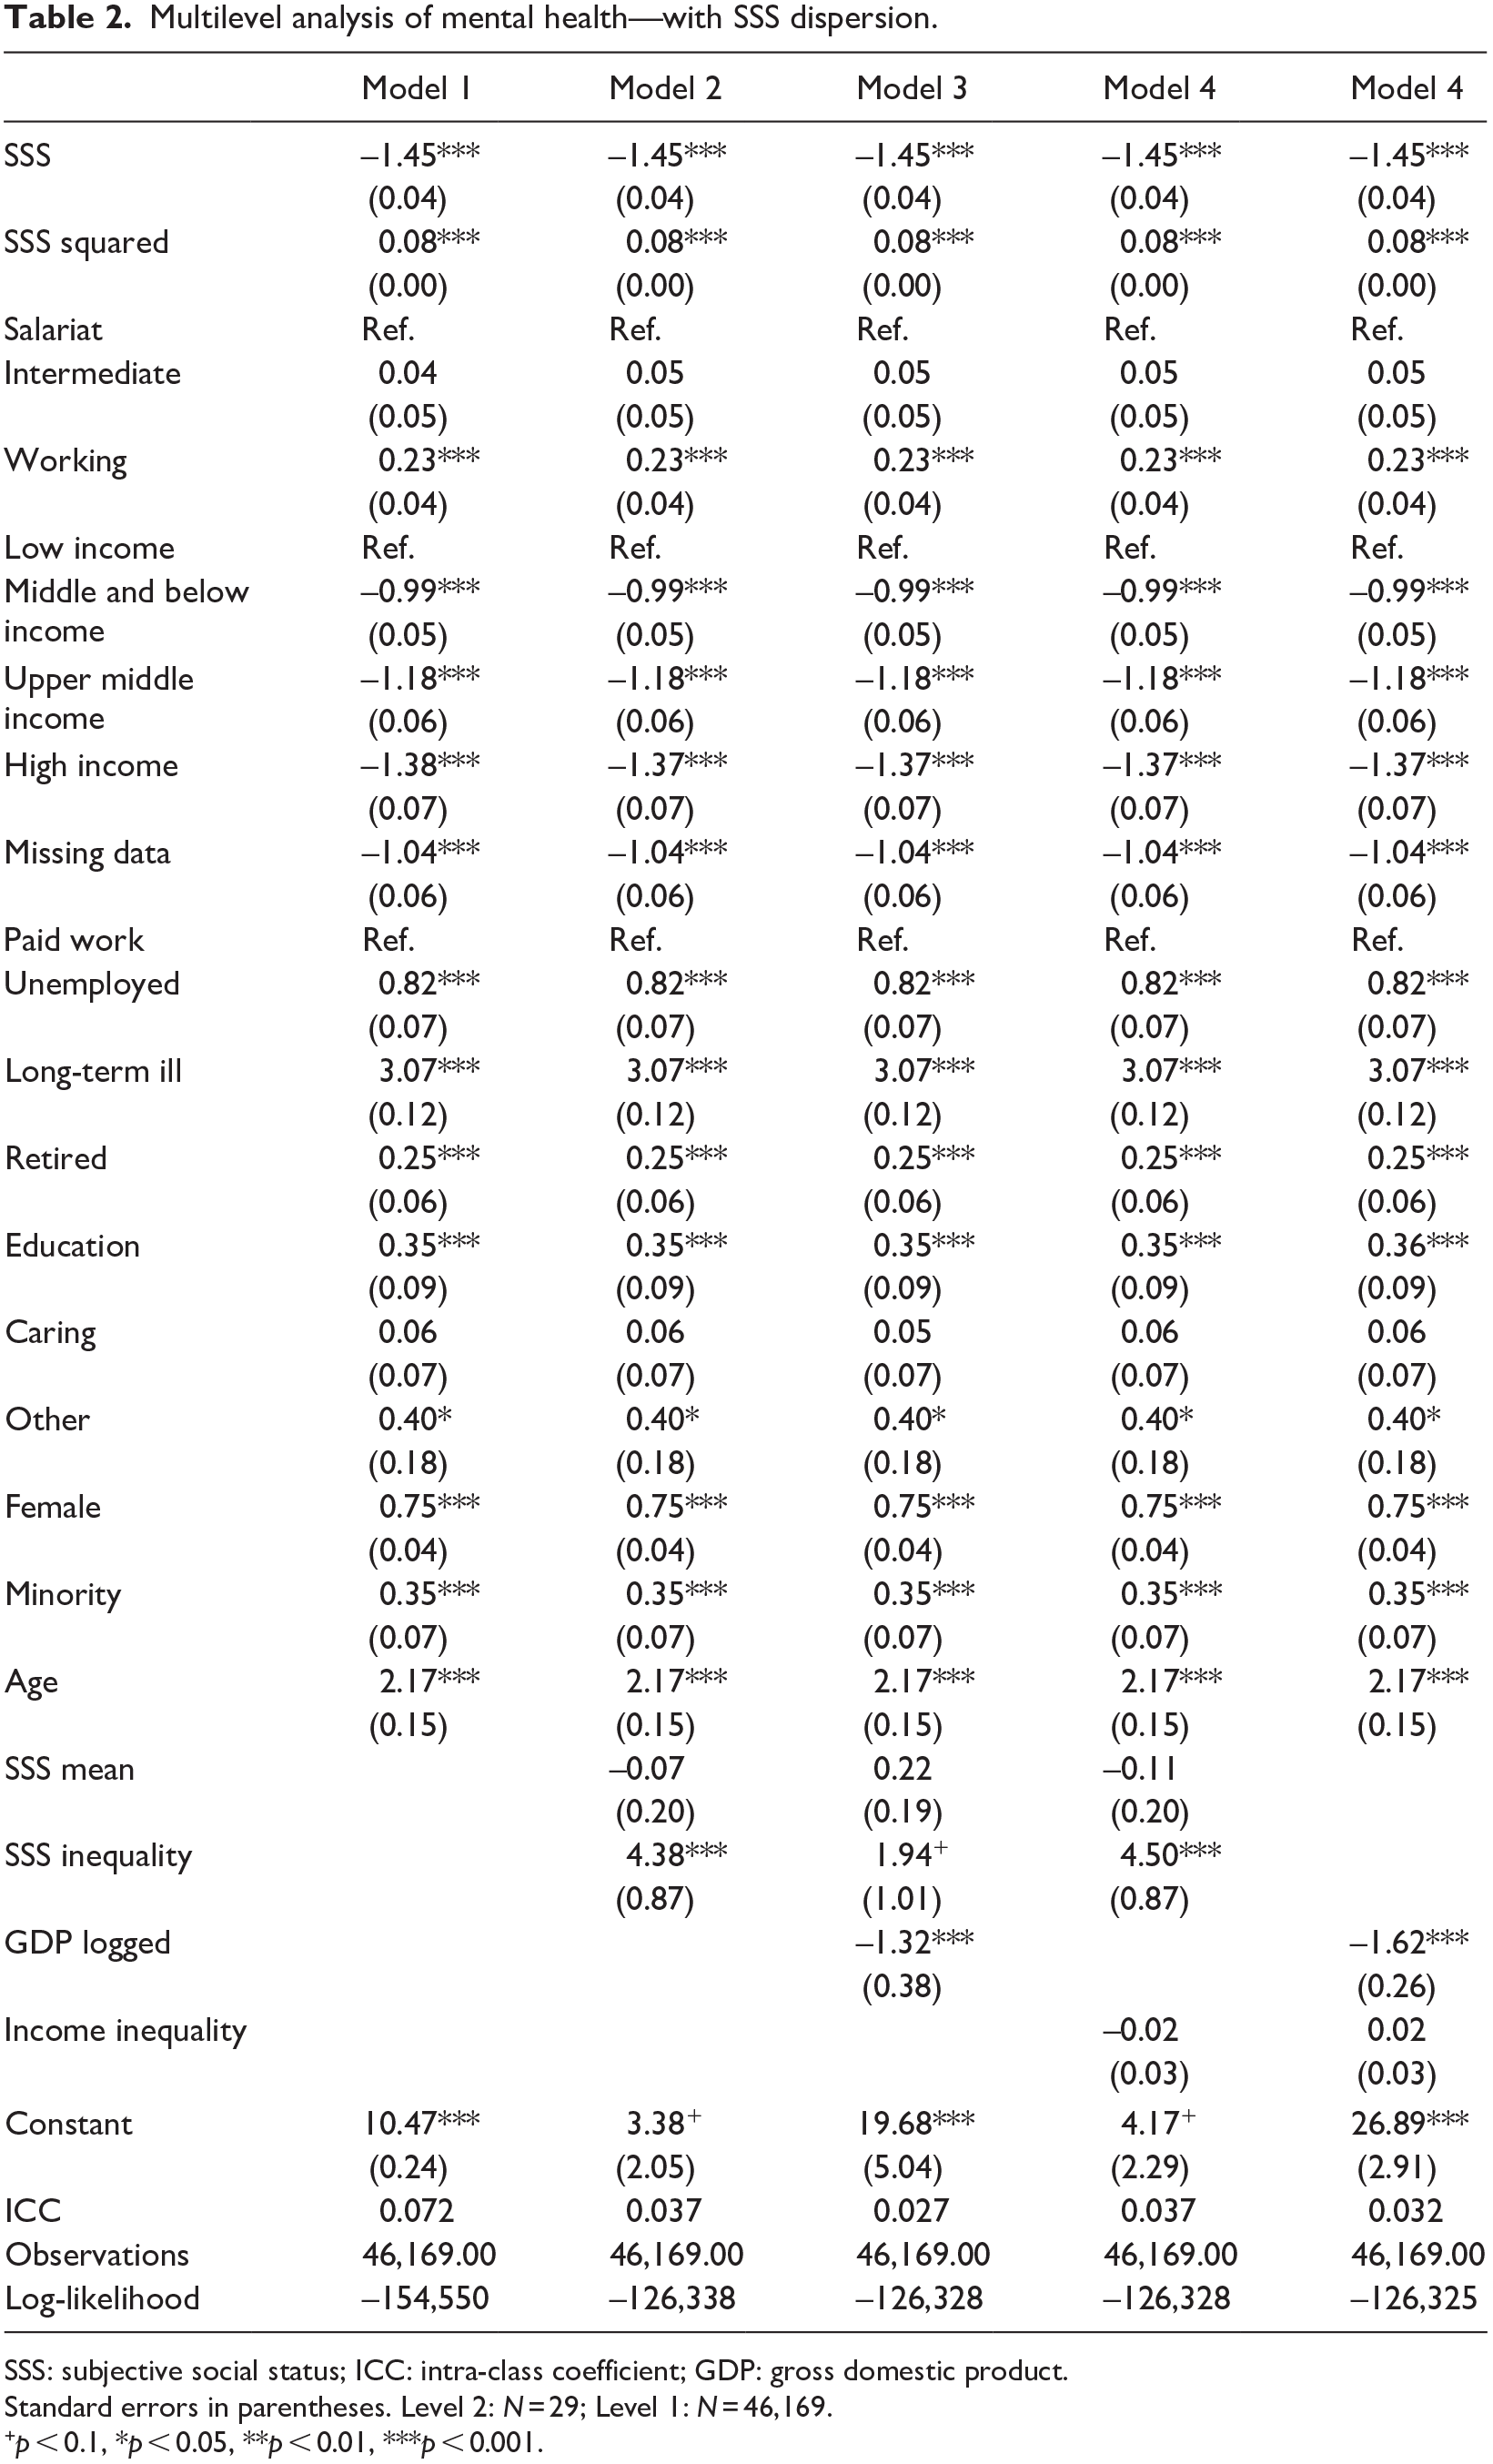
Looking at the model results, in Table 2, we first focus on the role of social status and socio-economic position on the micro level (Model 1). The findings show that, on average in Europe, all these indicators—SSS, social class, household income, and activity status—are associated with depression. We confirm what was already seen in Figure 2, we see that on the individual level, SSS is negatively associated with depression. Holding other factors constant, a one point increase in SSS is associated with a 1.45 point (SE = 0.04) reduction in depression. We thereby confirm the findings of previous studies (Demakakos et al., 2008; Präg et al., 2016) and conclude that SSS is associated with depression independently of other indicators of socio-economic factors. Furthermore, the squared term of SSS is significant and reflects that the relationship between SSS and mental health is not linear. As we saw earlier in Figure 2, the benefits of higher SSS seem to tail off at the highest levels of SSS.
Multilevel analysis of mental health—with SSS dispersion.
SSS: subjective social status; ICC: intra-class coefficient; GDP: gross domestic product.
Standard errors in parentheses. Level 2: N = 29; Level 1: N = 46,169.
p < 0.1, *p < 0.05, **p < 0.01, ***p < 0.001.
When it comes to indicators of socio-economic status, household income, reduces depression with those in the high income group averaging 1.38 points lower on depression (SE = 0.07) than those in the lowest income group. Those in routine occupations experience 0.23 (SE = 0.04) higher depression than the salariat occupational class. Compared with the employed, there are significantly higher levels of depression among those who are unemployed (b = 0.82, SE = 0.07) or out of the labor market due to long-term illness (b = 3.07, SE = 0.12). For the retired and those in education, average depression is higher than among people in the labor market.
In addition, the models show that women, ethnic minorities, and older people report more depression. Once accounting for individual-level factors, the Level 2 ICC is reduced to 0.072, a proportional reduction of error of 23 percent compared with the null model.
Model 2 includes two macro level variables—SSS mean and SSS inequality. The model shows that SSS inequality is associated with higher scores on the depression scale (b = 4.38, SE = 0.87). Hence, in societies where SSS inequality is higher, people on average report higher rates of depression. However, the average SSS score on a country level is not associated with depression. The ICC in Model 2 is 0.037, a proportional reduction of error of 61 percent compared with the null model; thus, SSS mean and SSS inequality account for a considerable share of country-level variation. The log likelihood also confirms that Model 2 fits the data better than Model 1.
Since the countries we observe are vastly different in terms of economic prosperity and this could be influencing the association that was found between SSS inequality and depression, in Model 3, we add a measure of logged GDP per capita. The significant and negative coefficient (b =−1.32, SE = 0.38) for GDP tells us that depression is lower in richer countries. Importantly, accounting for economic prosperity substantially weakens the relationship between SSS inequality and depression. Thus, much of the earlier effect was driven by between-country differences in economic development, the latter appears to be more important for depression than SSS inequality. Nevertheless, a weak positive relationship (significant at 0.1 level) between SSS inequality and depression still persists suggesting that social status inequality is associated with more depression even after taking into account country differences in the level of economic prosperity.
The final two models are included to see the effect of income inequality on depression. In Model 4, we control for income inequality instead of GDP while keeping both SSS mean and SSS inequality in the analysis. Here, we can see that there is no relationship between income inequality and depression, and the inclusion of income inequality does not influence the relationship between SSS inequality and depression. In Model 5, we only include income inequality and GDP without the SSS mean or SSS inequality indicators. Again, we can see that there is still no effect of income inequality on depression.
Figure 4 gives a better sense of the magnitude of the effect of SSS inequality on depression. Based on Model 2 that does not account for GDP per capita, we can see that depression rate in the most status equal context compared with the most status unequal context shift from 4.8 to slightly over 8.3. Hence, depression score is almost twice as high in the most status unequal context compared with the most status equal context. However, based on Model 3, after accounting for GDP, the differences by SSS inequality are reduced and range from 5.4 in most status equal context to 7.9 in the most status unequal context, this difference is now only borderline significant. Our initial evidence therefore supports our main hypothesis that high status inequality as defined by high dispersion of SSS is positively associated with depression of the population. Although GDP can be taken as a control variable that accounts for differences between countries in the level of prosperity, it could also be taken as a mechanism that determines status inequality. GDP is strongly correlated with SSS inequality (correlation coefficient of −0.70), which suggests that richer countries have less status inequality and in poorer countries status inequality is more widespread. It is plausible that high standard of living in rich countries is what induces status equality.
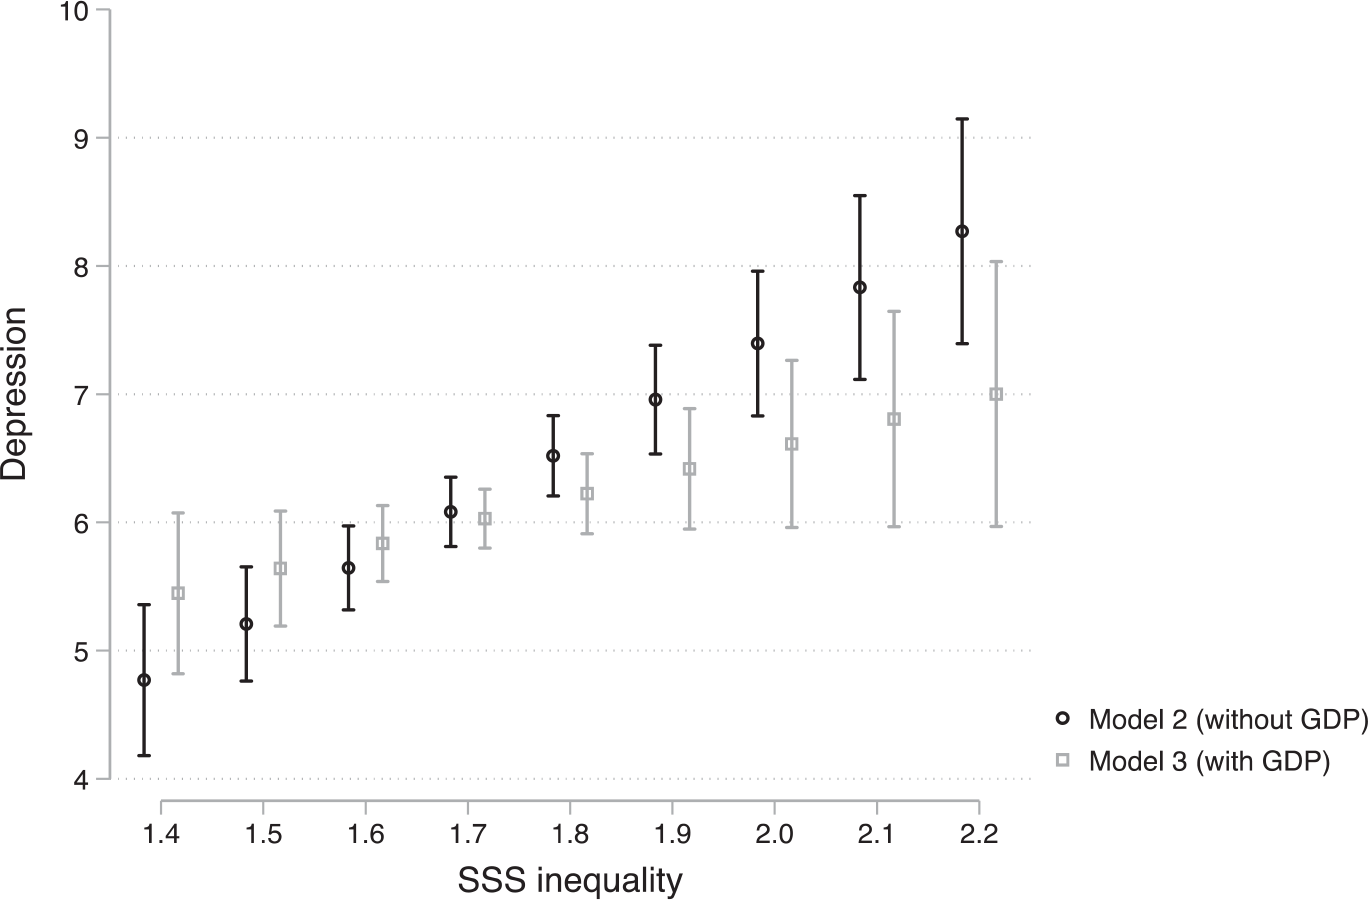
Depression at different levels of SSS inequality, refers to Models 2 and 3 from Table 2.
Robustness checks
From our analysis above, we conclude that although the effect is small and only marginally significant social status inequality is—on average—positively associated with depressive symptoms of the population and GDP appears to be a major factor that that is correlated with both status inequality and depression. Next, we look at whether the association between status inequality and depression holds across various additional robustness checks. First, we study whether the positive relationship between status inequality and depression is consistent across social status groups. We include interactions effects between status inequality and SSS on the individual level (while controlling for individual-level factors and logged GDP per capita) and find that the interaction effects are not significant. The relationship based on the interaction model is depicted in Figure 6 in Appendix 1. We thus conclude that status inequality is associated with higher rates of depression across individuals with low, middle, or high rates of SSS.
Furthermore, we account for potential problems related to the dependent variable—measurement of depression. Comparison of this outcome across different countries assumes measurement invariance, which is to say that differences in scores on the CES-D scale are taken to reflect actual differences in the prevalence of depression. In a study of country measurement bias in this scale, Van de Velde et al. (2010) showed that the survey instrument appears to tap, as expected, into the single underlying dimension of depression in all countries. However, they suggest that the items “happy” and “couldn’t get going” contribute the greatest risk of additive response bias. As an additional check, we re-run our main analysis (i.e. Model 3 from Table 2) using a modified outcome variable based on the other six items leaving out “happy” and “couldn’t get going.” As can be seen in Model 1 of Table 3 in Appendix 1, this does not alter our conclusion since the relationship between SSS inequality and depression is similar to the original baseline model (i.e. Model 3 from Table 2). We also re-run the analysis excluding individuals who had given maximum scores across the eight CES-D items. Again, findings of Model 2 in Table 3 in Appendix 1 confirm that the original results remain robust. In addition, we run the analysis where instead of imputed values we include a sub-sample that has at least seven out of the eight depression items observed. Hence, we focus on depression among a population that have answered to at least seven items required to capture depression, which naturally leads to a reduction in sample size. Model 3 in Table 3 in Appendix 1 suggests that the relationship between SSS inequality and depression remains similar to the baseline model.
Perhaps the most important concern with our study is the relatively small sample size on Level 2 and heterogeneity between countries in terms of wealth, socio-economic development, and many other factors. In the analysis above, we accounted for wealth by controlling for GDP per capita, however, there might be other relevant dimensions along which countries differ. We also run the analysis including a dummy for countries that rank “highly developed” instead of “very highly developed” according to the Human Development Index (HDI; i.e. Albania, Bulgaria, Russia, Ukraine, and Kosovo). The findings in Model 4 in Table 3 in Appendix 1 show that there is a positive and significant relationship between status inequality and depression. Furthermore, since it has been suggested that the welfare regime mediates the effects of inequality on individual well-being (Samuel and Hadjar, 2015), we also control for welfare regime type. Our results remain consistent when we control for the welfare regime, classified into conservative, liberal, social-democratic, family-oriented, or post-socialist regimes.
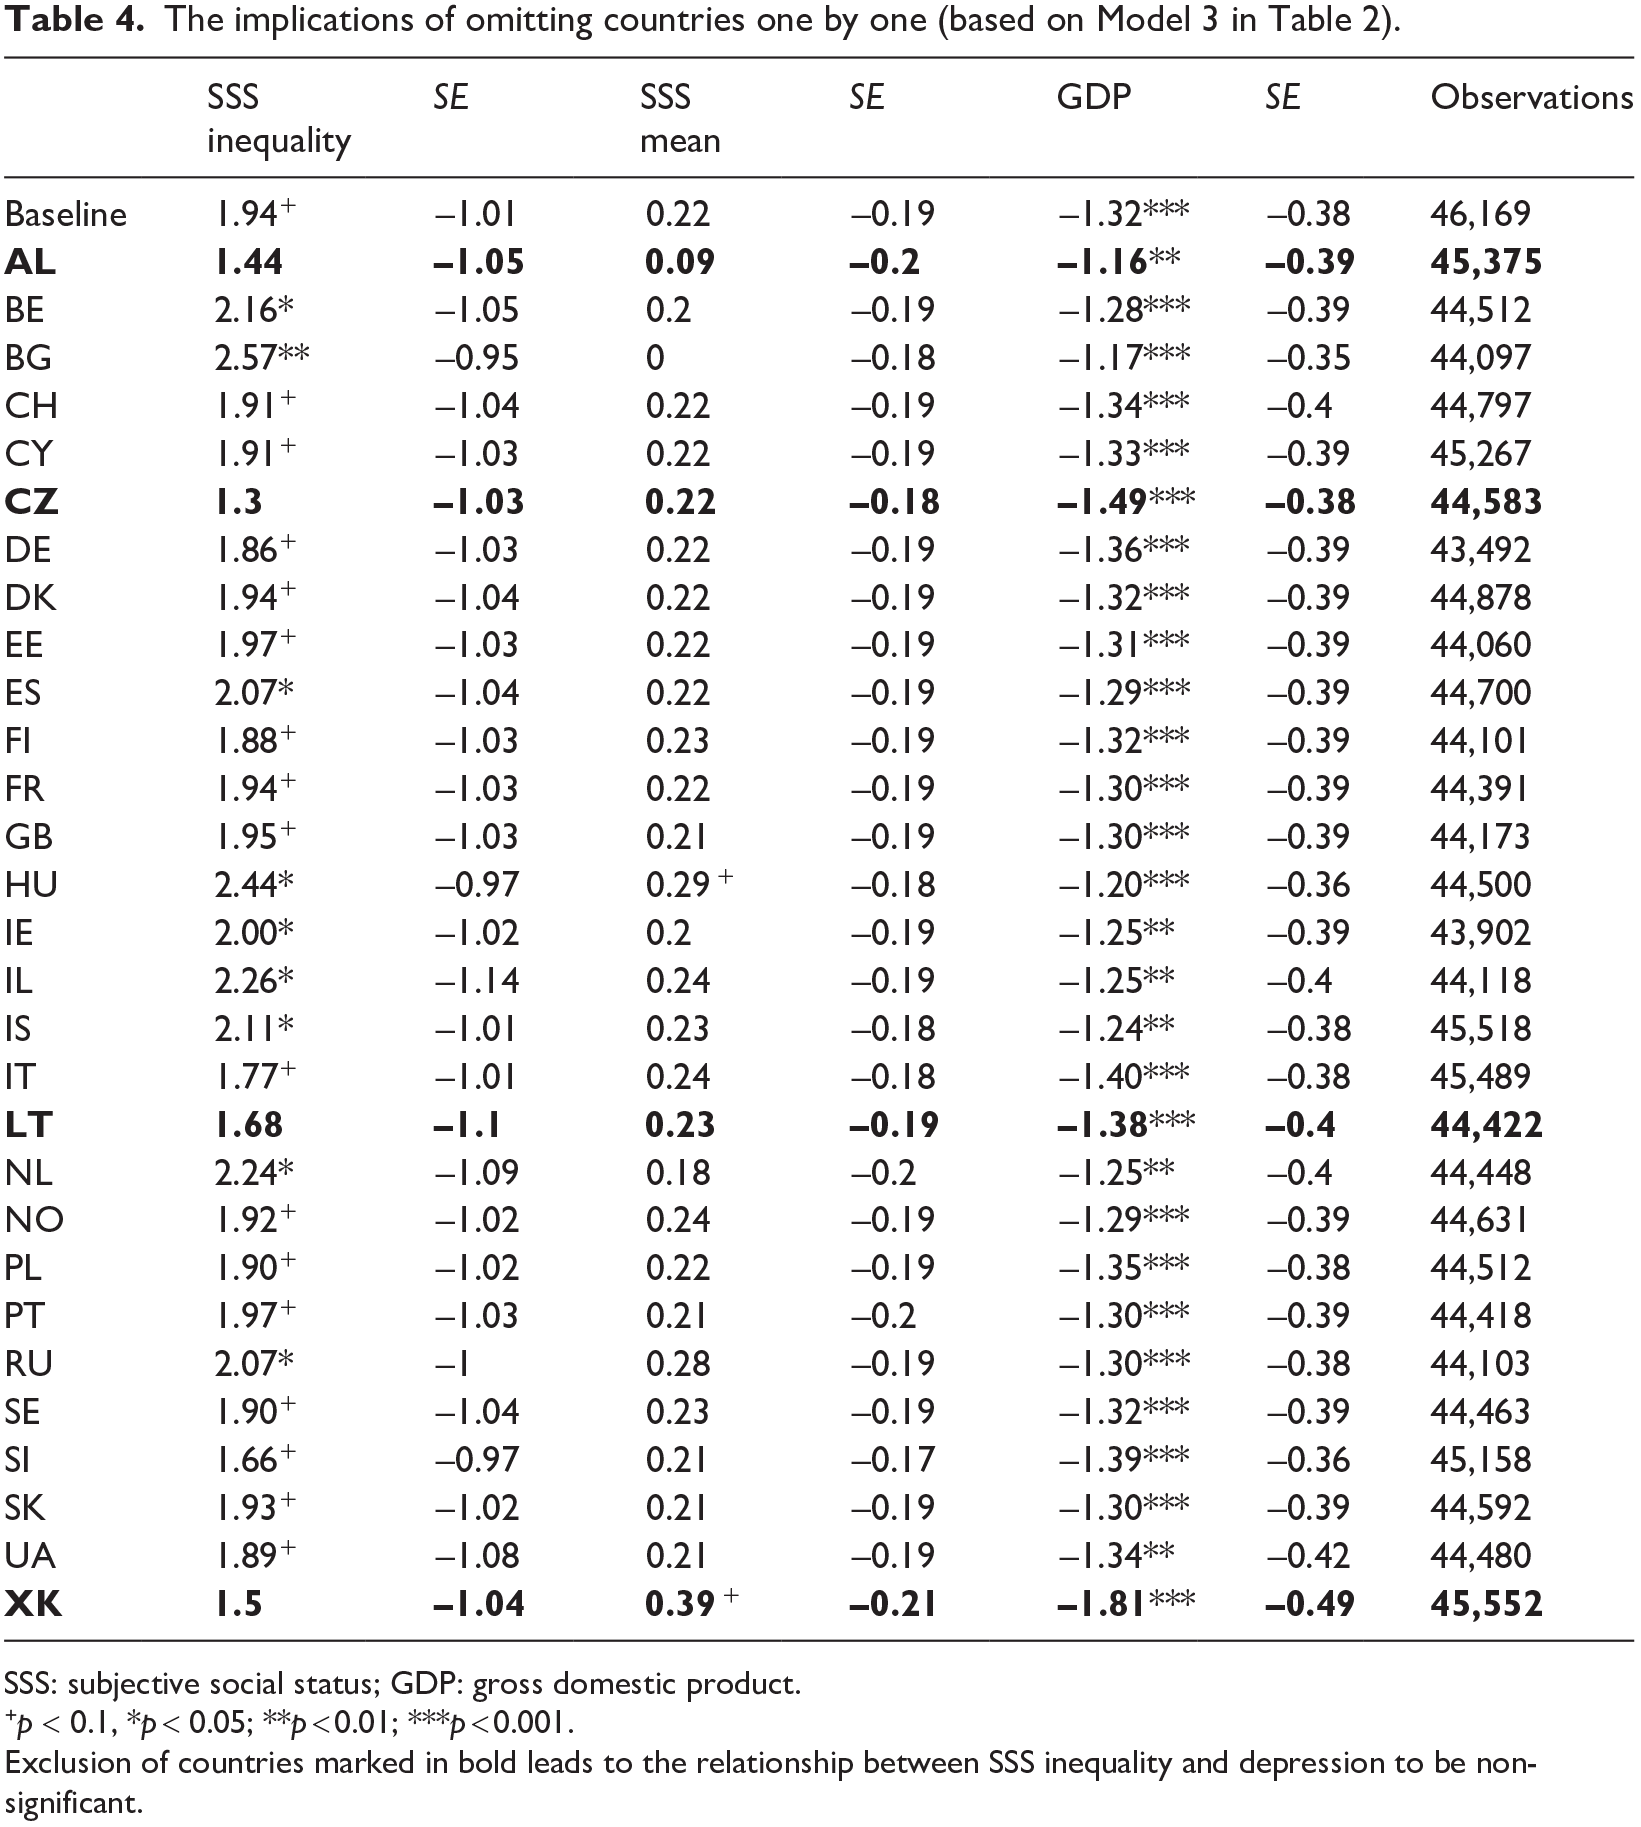
Another important concern with our data is the fact that we have a low number of countries or Level 2 observations. It is well-known that in small sample cross-national multilevel analyses estimates are susceptible to influential cases of Level 2 units (Van der Meer et al., 2010). To test the robustness of our finding, we re-specify our models (Model 3 in Table 2) with modified samples by eliminating one country at a time. The results are presented in Table 4 in Appendix 1. The findings show that the original borderline significant effect of social status inequality disappears when excluding Albania, Czech Republic, Lithuania, or Kosovo. This suggests that these countries play a disproportionate role in driving the positive association between status inequality and depression observed in the original analysis including a control for GDP. While eliminating one of these countries from the sample means that social status inequality is not significant, the coefficients remain positive and in a similar magnitude. Furthermore, it is important to consider that removing some countries (e.g. Bulgaria, Hungary, the Netherlands) leads the coefficient of status inequality to increase.
Discussion and conclusion
Our aim in this article is to move the debate about status inequality forwards. We propose that looking at inequality in SSS would serve as a more direct indicator of status inequality within countries, when compared with the more usual measurement via income inequality. Our empirical application is to study whether depression is more prevalent in contexts with high status inequality and whether it is status inequality or income inequality that is more strongly related with depression rates.
Our findings show that subjective status inequality (measured as dispersion) within countries is associated with depression of the inhabitants of that country. This association operates above and beyond personal ratings of SSS, and held after controlling for the major dimensions of socio-economic status and demographic factors on the individual level, and also accounting for GDP per capita. Although GDP appeared to weaken the relationship between status inequality and depression and is in itself a major factor that explains cross-national differences in depression rates. Furthermore, depression is more strongly linked with our new measure of status inequality compared with income inequality. In fact, status inequality and income inequality correlate only rather weakly with one another. However, the strength of the positive association between status inequality and depression is sensitive to controlling for GDP and to the set of countries included in a sample. Hence, our ability to draw definite conclusions on the relationship between subjective status inequality and depression is limited. However, what we can say is that the coefficient for status inequality remained positive across different model specifications and sample compositions, and status inequality is more strongly correlated with depression than income inequality. Adding to the debate on which type of inequality matters for health outcomes, our evidence is stronger for the importance of subjective status inequality than income inequality.
We propose various mechanisms that could explain the positive relationship between status inequality and depression, including increased status anxiety, fear of falling down the social ladder, more stressful social interactions and restricted opportunities. Future research needs to confirm, first, whether the association between subjective status inequality and depression persists across other samples or contexts and, second, test whether the underlying causal mechanisms proposed hold (Delhey and Dragolov, 2013; Layte and Whelan, 2014). Furthermore, while our analysis suggests that status inequality operationalized as SSS inequality has greater explanatory power than income inequality to explain country level variation in depression, we also think that we ought not be too hasty to write off inequality in material resources as the root cause of inequality in social status (Ribeiro et al., 2017). Income data and the Gini coefficient are subject to various challenges and measurement error, and perhaps have reduced explanatory power as a result (Ferreira et al., 2015). Inequality in wealth may also be more important than income per se, but is difficult to measure and rarely available in standard surveys.
In suggesting that subjective status inequality is a more direct and explicit way to capture status inequality in countries, we are assuming that income inequality does not fully translate into status inequality. This may be because various economic and non-economic attributes have differing value in the status currency of a given country, and also because some contexts may be less concerned with relative economic status altogether. This is turn implies that being of relatively low standing in income terms would have less dire consequences in terms of perceived social standing in some countries than others. For example, we showed that status inequality is lower in rich countries and higher in poor countries. It could be that high standard of living is what helps individuals preserve a relatively equal sense of status even in the face of relative differences in economic position or ascribed characteristics. Next to the level of economic development, other societal factors might equalize status perceptions too. By our estimates, low income would be associated with a lower “cost” to perceived standing in countries such as Spain, where the subjective status inequity is low, despite a Gini coefficient which is moderately high. In turn, this may imply that societies, such as Spain may be “pluralistic” in the sense that opportunities to gain status are more varied, and open to “a broader range of paths that allow people to pursue the activities and goals that add up to a flourishing life.” (Fishkin, 2014: 23). The Netherlands provides an interesting point of contrast; its low status inequality may also indicate that people have wide opportunities to gain status, but income inequality in the Netherlands is low and low status inequality may therefore reflect the small material differences between people and also a high overall standard of living.
The central contribution of this study was to introduce a new measure of contextual inequality—subjective status inequality—to the comparative sociological literature. We need continued debate on the different types of inequalities and how they matter for individual and societal outcomes (Beckfield, 2004; Delhey et al., 2017; Goldthorpe, 2010). Our suggestion to the scientific community is to include measures of SSS in surveys on a more regular basis to advance both social science and epidemiological research. Having better data including repeated measures over time, will also help to establish the causal direction between status inequality and depression (see Nobles et al., 2013).
Footnotes
Appendix 1
The implications of omitting countries one by one (based on Model 3 in Table 2).
| SSS inequality | SE | SSS mean | SE | GDP | SE | Observations | |
|---|---|---|---|---|---|---|---|
| Baseline | 1.94 + | –1.01 | 0.22 | –0.19 | –1.32*** | –0.38 | 46,169 |
|
|
|
|
|
|
|
|
|
| BE | 2.16* | –1.05 | 0.2 | –0.19 | –1.28*** | –0.39 | 44,512 |
| BG | 2.57** | –0.95 | 0 | –0.18 | –1.17*** | –0.35 | 44,097 |
| CH | 1.91 + | –1.04 | 0.22 | –0.19 | –1.34*** | –0.4 | 44,797 |
| CY | 1.91 + | –1.03 | 0.22 | –0.19 | –1.33*** | –0.39 | 45,267 |
|
|
|
|
|
|
|
|
|
| DE | 1.86 + | –1.03 | 0.22 | –0.19 | –1.36*** | –0.39 | 43,492 |
| DK | 1.94 + | –1.04 | 0.22 | –0.19 | –1.32*** | –0.39 | 44,878 |
| EE | 1.97 + | –1.03 | 0.22 | –0.19 | –1.31*** | –0.39 | 44,060 |
| ES | 2.07* | –1.04 | 0.22 | –0.19 | –1.29*** | –0.39 | 44,700 |
| FI | 1.88 + | –1.03 | 0.23 | –0.19 | –1.32*** | –0.39 | 44,101 |
| FR | 1.94 + | –1.03 | 0.22 | –0.19 | –1.30*** | –0.39 | 44,391 |
| GB | 1.95 + | –1.03 | 0.21 | –0.19 | –1.30*** | –0.39 | 44,173 |
| HU | 2.44* | –0.97 | 0.29 + | –0.18 | –1.20*** | –0.36 | 44,500 |
| IE | 2.00* | –1.02 | 0.2 | –0.19 | –1.25** | –0.39 | 43,902 |
| IL | 2.26* | –1.14 | 0.24 | –0.19 | –1.25** | –0.4 | 44,118 |
| IS | 2.11* | –1.01 | 0.23 | –0.18 | –1.24** | –0.38 | 45,518 |
| IT | 1.77 + | –1.01 | 0.24 | –0.18 | –1.40*** | –0.38 | 45,489 |
|
|
|
|
|
|
|
|
|
| NL | 2.24* | –1.09 | 0.18 | –0.2 | –1.25** | –0.4 | 44,448 |
| NO | 1.92 + | –1.02 | 0.24 | –0.19 | –1.29*** | –0.39 | 44,631 |
| PL | 1.90 + | –1.02 | 0.22 | –0.19 | –1.35*** | –0.38 | 44,512 |
| PT | 1.97 + | –1.03 | 0.21 | –0.2 | –1.30*** | –0.39 | 44,418 |
| RU | 2.07* | –1 | 0.28 | –0.19 | –1.30*** | –0.38 | 44,103 |
| SE | 1.90 + | –1.04 | 0.23 | –0.19 | –1.32*** | –0.39 | 44,463 |
| SI | 1.66 + | –0.97 | 0.21 | –0.17 | –1.39*** | –0.36 | 45,158 |
| SK | 1.93 + | –1.02 | 0.21 | –0.19 | –1.30*** | –0.39 | 44,592 |
| UA | 1.89 + | –1.08 | 0.21 | –0.19 | –1.34** | –0.42 | 44,480 |
|
|
|
|
|
|
|
|
SSS: subjective social status; GDP: gross domestic product.
p < 0.1, *p < 0.05; **p < 0.01; ***p < 0.001.
Exclusion of countries marked in bold leads to the relationship between SSS inequality and depression to be non-significant.
Acknowledgements
The authors would like to thank Alice Baderin and Professor Richard Wilkinson for reading earlier versions of the paper. They would also like to thank colleagues at the Nuffield College Sociology Reading Group and at the Employment, Equity and Growth Programme at INET Oxford for helpful discussions around social status and inequality.
Funding
The author(s) disclosed receipt of the following financial support for the research, authorship, and/or publication of this article: Marii Paskov is supported by a grant (no. pf170062) from the from the British Academy.