
Abstract
Theories of change in social class mobility present contrasting expectations of either change or persistence in mobility as societies develop. This article examines intergenerational social class mobility for cohorts born from 1951 to 1980 in Finland. We analyse change across cohorts in the main association between social origins and destinations and the intervening associations between origins and education and education and destinations. We investigate how the association between education and destinations differs by origins and by education levels to gain a more complete picture of how meritocratic fairness has changed. We employ full population census and register data, using multiplicative log-linear models. The results suggest variations in the association between social origins and destinations over cohorts, which disappear when considering this association net of education. Educational inequalities have decreased for both men and women, whereas returns to education decreased for men but remained stable for women. Behind these relatively straightforward results is more complexity when considering how origins – also across cohorts – moderate class returns to education. These results suggest that the labour market is becoming more similar for individuals at different levels of education or coming from different social classes.
Keywords
Introduction
Reducing the importance of family background for social achievement and increasing human capital are common goals of almost all modern societies, both for competitive and ethical reasons. It is important that societies do not waste their human potential and that they move closer to equality of opportunity (e.g. Breen and Müller, 2020; Ruggera and Barone, 2017). However, what happens to the associations between social origin, education, and social destination in societies when they have been reaching for both goals for a long time in relatively stable social conditions? We can argue that many societies, such as Northern European countries, reached those conditions several decades ago (Bukodi et al., 2020; Erikson and Goldthorpe, 1992). However, existing theories of social mobility rarely mention what would follow, and several contradictory mechanisms can be at play (see also Pfeffer and Hertel, 2015).
We study the changes in the associations between social class origin, education, and social class destination in Finland among five-year birth cohorts born from 1951 to 1980. Earlier research has suggested that family background mattered comparatively little for occupational attainment for the youngest cohorts born in the 1960s or later (Erola, 2009). During the period that these birth cohorts reached their occupational maturity, which in our analyses is from 1990 to 2015, the occupational structure changed slowly, whereas the level of education increased rapidly. While Finland is known for its egalitarian welfare state and accessible education system, its labour market remains strongly gendered despite high female labour market participation (Grönlund et al., 2017). These aspects make this country a particularly interesting case for our analyses. Finland has relatively rarely been included in major comparative social mobility studies (such as Breen, 2004; Breen and Müller, 2020), but recent evidence suggests that its social mobility rates are relatively close to European averages, albeit with some above-average mobility rates along with other Nordic countries (Bukodi et al., 2020; see Table 4 in Erola, 2009).
In the empirical part of the article, we begin by observing so-called absolute (total) rates of class mobility, which refer to the proportions of individuals who have remained in the same class as their parents (socially immobile) versus those who have moved away from that class (socially mobile). Afterwards, we concentrate on relative mobility, employing the most often used method, log-linear models (Xie, 1992). Relative social class mobility measured in this way is related to a person's chances to access a given social class compared to people from other social classes. Thus, it measures a society's degree of openness (Breen, 2004).
We conduct our analyses by focussing on birth cohort changes in the associations between Origin (O, i.e. parental social class), Education (E), and Destination (D, i.e. children's social class as adults). This conceptualisation is known as the OED triangle (see Supplemental materials). In our analysis of each association of the OED triangle, we focus on change across birth cohorts (C). We derive our hypotheses for the changes in OED by discussing two main opposing groups of social mobility theories: fluidity versus stability (also Gil-Hernández et al., 2017). Our goal is to understand better where Finnish men and women fit better in theoretical terms. The article thus provides up-to-date and expanded knowledge on social mobility trends in Finland (cf. Erola, 2009).
In addition to contributing an improved country study to the international literature, the article focusses on differential trends by gender, which in the Finnish case is relatively easy to do since women's labour force participation is on a par with men's and part-time work is uncommon. Both of these have previously been argued to complicate the comparison of social mobility patterns between genders (e.g. Bukodi et al., 2020).
Finally, the article provides particularly novel evidence on cohort changes in two types of interactions derived from the OED triangle: how differences in the ED association (social class returns to education) by origin have changed across cohorts (ED|OC) and how differences in the OD association (direct effect of parental social class) by education have changed across cohorts (OD|EC). While previous research has examined these interactions, minimal evidence exists on their change across cohorts.
Theoretical background: Social fluidity versus stability
There are two main competing groups of theories related to relative social mobility: increasing fluidity versus stability. On the side of fluidity, the industrialisation or modernisation theory predicts that post-industrialisation and economic development increase rates of relative mobility (Ganzeboom et al., 1989). These processes lead to achievement (in particular educational attainment) becoming more important and ascription (in particular social origin but also gender and ethnicity) becoming less important for occupational attainment due to the use of educational credentials as the primary selection criterion (e.g. Collins, 1979).
Finland industrialised later than many other Western countries but continues to face an increasing demand for high-skilled labour like many other modern societies (Oesch and Rodríguez Menés, 2011). This implies that to maximise productivity levels, selection into occupations should take place according to education-based merits (Blau and Duncan, 1967; Breen, 2004; Parsons, 1951). Within this context, the ED association is expected to strengthen, and the importance of family origin, reflected in both the OE and OD|E (OD taking into account education-related changes) associations, is expected to decline. The sum of these trends results in increasing social fluidity over time, that is, a weakening OD association.
However, this theory has been increasingly questioned by a different set of theories and hypotheses (e.g. Goldthorpe, 2016). The constant social fluidity thesis developed by Erikson and Goldthorpe (1992) argues that after reaching a comparatively high level of social mobility, societies maintain stability in relative mobility, with only some trendless fluctuations in the OD association. Since the introduction of the theory, various social mobility studies have shown that despite structural changes, relative mobility rates have remained largely stable over time (e.g. Breen and Müller, 2020). Moreover, it has been argued that in liberal democracies there is a limit to the amount of relative mobility that can be achieved through state interventions – and that Nordic countries, including Finland as well as some of the post-socialist countries, are likely to be around this limit (Bukodi et al., 2020). In contrast, in countries with comparatively low relative mobility rates, such as Austria, Germany, Italy, and Spain, there might still be room for institutions and policies to have a mobility-enhancing influence.
Regarding educational inequalities, in other words, the OE association, the view for a long time was that despite educational reforms, including educational expansion, there would be persistent inequality of educational opportunities (e.g. Shavit and Blossfeld, 1993). One explanation for this is that higher social classes’ cultural capital is rewarded in schools and thus reproduces social inequalities intergenerationally (Bourdieu 1986; Bourdieu and Passeron, 1979; Murphy 1988). More recently, persistent educational inequalities have been analysed through the different strategies high social origin parents use to ensure that their children gain the highest possible educational attainment, with the hypothesis that whatever the institutional setting is, “advantage finds its way” (Triventi et al., 2020), partly leading to the limits on relative social mobility discussed above (Bukodi et al., 2020). Nevertheless, it has also been shown that educational expansion eventually leads to reduced inequalities (Ballarino et al., 2009; Breen et al., 2009; Shavit, 2007), even if to a lesser extent than the more optimistic scenarios would predict. This is also clear when considering educational attainments by fields of study (Ruggera, 2021) or by employing a micro-class approach (Ruggera and Barone, 2017).
For a long time, the Finnish education system was characterised by fast educational expansion. In 1970, just under 7% of individuals aged 35–39 had at least a Bachelor's degree (with a gender difference of slightly over two percentage points in favour of men). By 1994, this had doubled to 14%; by 2009, another doubling to over 28% occurred, and in 2020, it had reached almost 43% (with a gender difference of nearly 18 percentage points in favour of women) (Statistics Finland, 2023). Over the same period, the percentage with just basic education dropped from 71 to 14. Increased rates of tertiary education are partly related to a deliberate educational expansion during the economic crisis of the 1990s, as it functioned as an alternative to the growing unemployment, especially for young people (Erola and Moisio, 2007). In terms of intergenerational educational equality, Finland has done comparatively well (Barone and Ruggera, 2018). However, there are indications that educational expansion and the decline in educational inequality have halted for recent birth cohorts (Härkönen and Sirniö, 2020). Given the substantial increase in education over the birth cohorts studied – and in line with modernisation theories – we expect declining educational inequalities by origin (OE) for both men and women (H1).
As mentioned above, a strengthening ED association is one of the cornerstones of the modernisation theory. However, while educational expansion is expected to weaken the OE association, it may also lead to a decline in the ED association due to an inflation of the value of educational credentials in the labour market (e.g. Van de Werfhorst, 2009). Since employers use educational credentials to assess applicants’ skills (Collins, 1979), educational expansion may lower the utility of this signal. Moreover, without sufficient occupational upgrading, educational expansion may produce more highly qualified people than the labour market can incorporate, thus also leading to a loss in the power of a degree in the labour market. In these cases, employers are likely to increasingly look for other signals than just education, including characteristics associated with social origins (see Jackson et al., 2005). Therefore, a declining ED association is a process connected with theories of stability in relative social mobility (Erikson and Goldthorpe, 1992), and we expect decreasing occupational returns to education (ED) (H2a).
On the other hand, Finland has experienced an expansion of welfare state-related institutions and services, which has increased female labour market participation since the 1970s (Grönlund et al., 2017). This has led to women being overrepresented in public sector employment where credentials are often more essential for employment and progression than in the private sector (see also Charles and Bradley, 2009). This is true for many European countries (e.g. Ruggera and Barone, 2017). This likely means that the ED trend is substantially different for men than women. More specifically, we expect the decreasing ED association trend to be weaker for women than for men (H2b).
Next, we consider the change in the OD association accounting for education (OD|E), also referred to as the direct effect of social origin net of education (Erikson and Goldthorpe, 1992). Modernisation theories would predict a weakening of this association. However, as mentioned above, educational expansion may lead to a situation where recruiting employers start to value employees’ characteristics associated with social origins more at the expense of education. This might apply particularly to jobs that do not necessarily require technical skills but where social and cultural skills may be of value (Jackson et al., 2005). A strengthening direct OD relationship may also come through families’ deliberate strategies in the context of policies that aim to equalise educational opportunities through educational expansion, leading to declining class returns to education (Pöyliö et al., 2018). Possible avenues for this would be choosing specific fields of study – which would not show in regular analyses of OE that only look at vertical levels of education – or relying on other family resources such as social connections. Over the longer term, we thus expect a strengthened association between origin and destination (OD), net of education (H3).
We then turn to the particularly interesting interactions in Finland's egalitarian context. First is the ED association by origin (ED|O) and its change across cohorts (ED|OC). Even if the returns to education were decreasing due to credential inflation, processes leading to that would also make credentials increasingly necessary requirements for positions without being sufficient for them. Because of this, it should become more important for advantaged families to ensure that their children acquire credentials that maintain positions of equal standing (e.g. Ruggera, 2021; Barone and Ruggera, 2018). This would imply that any changes that reduce the importance of education for eventual occupational attainment would be weaker for children from higher social origins. Thus, we expect that the variation of the ED association by origin should become stronger across cohorts (H4). Given that we expect the weakening ED association to be less strong for women than men, this should also imply smaller changes among women than men.
Second, we consider the interaction of OD by education (OD|E). Previous research has found that the origin–destination association becomes smaller with higher levels of education, in particular with a university degree (e.g. Hout, 1988; Torche, 2011). The main reason behind this is that the labour market for the highly educated is assumed to be more meritocratic (Ganzeboom et al., 1989). This interaction has also been explained through compensatory advantage: higher social class parents have resources to provide for their children to prevent their downward mobility even when the children obtain a low level of education (Bernardi and Ballarino, 2016). Together, these two mechanisms lead to the expectation of an interaction in the OD association across education so that the association is smaller among higher-educated groups (H5).
This interaction also leads to what is known as the compositional effect of education (Hout, 1988). With the educational expansion, the proportion of individuals with a higher level of education increases in the labour market. Therefore, at the population level, the OD association is reduced because the proportion of the population for whom the OD association is smaller increases. However, there may also be changes across cohorts in the strength of this interaction. On the one hand, educational expansion tends to increase the share of higher education graduates from lower social origins in the labour market (e.g. Pfeffer and Hertel, 2015). On the other hand, occupational upgrading, particularly in the public sector, may mean that credentials become more necessary requirements for positions. Therefore, it is important to analyse how the OD|E interaction changes across cohorts (as a double-layer EC in the OD association, OD|EC).
Hypotheses 4 and 5 aim to go further in-depth regarding the meritocratic fairness of Finnish society and change therein than can be deducted from the main OED associations. Studies of social mobility have usually not considered this kind of change, probably mainly due to limited case numbers. Generally speaking, educational expansion means that a larger proportion of the population should become part of the more meritocratic part of the labour market, including children from lower social origins (H5). However, for this to be realised, there should be increasing space at the top of the occupational hierarchy (specifically classes I, II and IIIa). If this is not the case, credential inflation may eat away this advantage – and it may do so differently by social origins (H4).
Data, variables and methods
Data
Data from Statistics Finland allow us to link parents to children using full-population census data collected in 1970, 1975, 1980 and 1985, and after that, maintain the same five-year structure using full-population register data. We construct mobility tables based on children's five-year birth cohorts, 1951–1955, 1956–1960, 1961–1965, 1966–1970, 1971–1975 and 1976–1980. The occupational standing of children was measured at age 35–39 (in 1990, 1995, 2000, 2005, 2010 and 2015), following many other studies considering Northern Europe (e.g. Breen and Müller, 2020). Parents’ social class was measured when the children were between 10 and 19 years old. The intergenerational link is based on parenthood at birth rather than on the co-residence of children with their parents. We include only Finnish-born children and parents: large-scale migration to Finland only began in the 1990s, and social class of origin is not available for the majority of the foreign-born population, with sometimes patchy information about education, too.
The data are organised into mobility tables according to year and cohort, separately for men and women. While our primary focus is cohort change, a period (P) variable is always included in the models since the data for most cohorts come from multiple years. Table 1 shows how the data are structured according to cohort, period and age, with the sample sizes for cohorts and periods by gender. Overall, the data include 3,945,139 observations for men and 3,709,481 for women. The large number of observations allows us to consider the mobility tables with more complexity, such as within levels of education by birth cohort (see double layers log-linear models’ explanations in the methods section).
Data structure by period, birth cohort and age.
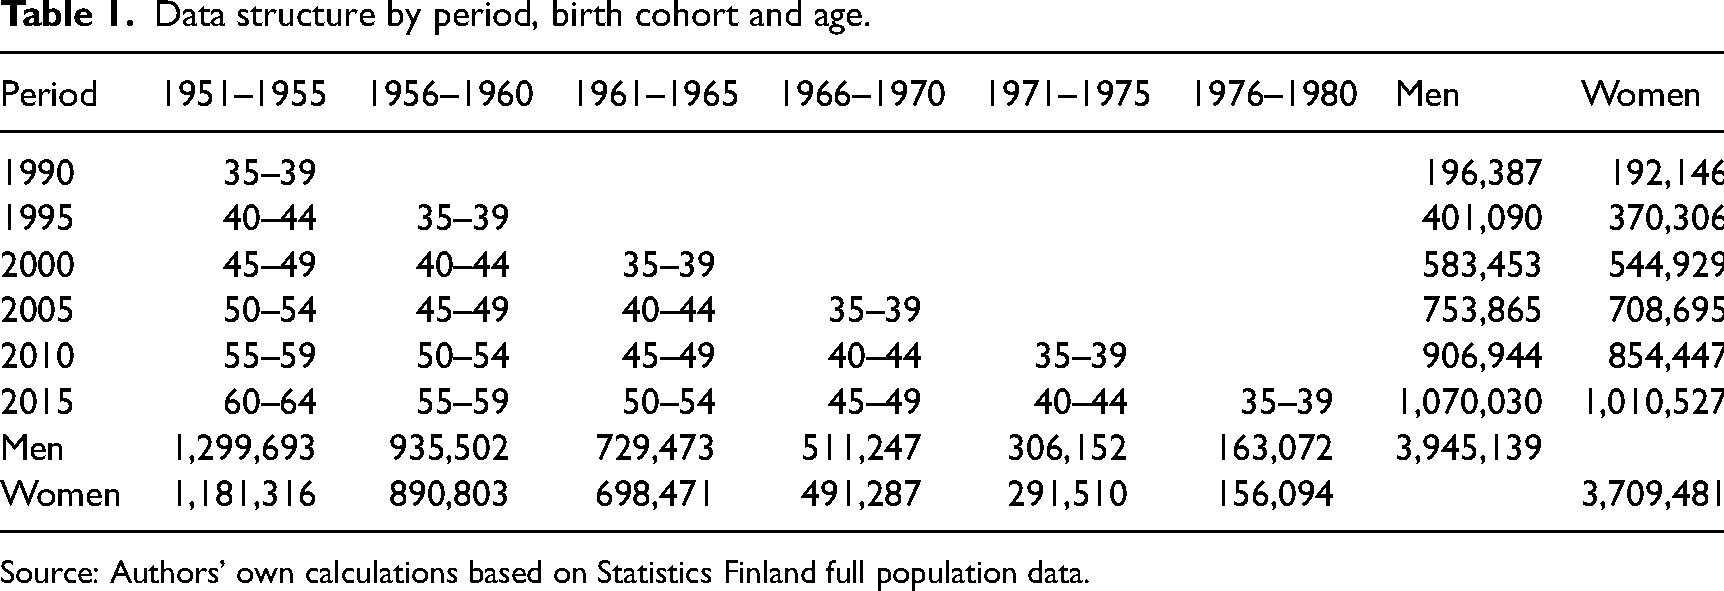
Source: Authors’ own calculations based on Statistics Finland full population data.
Variables
Educational attainment is coded into the following three categories using ISCED (1997 version): ISCED 0–2 for pre-primary, primary and lower secondary; ISCED 3–4 for upper secondary; and ISCED 5 and 6 for tertiary (see Section 2 of the Supplemental materials for descriptive statistics).
Our measure of social class is based on the Erikson–Goldthorpe–Portocarero (EGP) class schema (see Erikson and Goldthorpe, 1992). We use eight class categories with further distinctions based on gender. The classes for men are as follows: I Upper service; II Lower service; III Routine non-manual; IVa + b Self-employed (nonfarming); IVc Self-employed farmers; V + VI Technicians, Supervisors and skilled manual workers; VIIa Semi- or unskilled manual workers; and VIIb Semi- and unskilled manual workers in agriculture. For women, we additionally distinguish between classes IIIa (higher grade; routine non-manual in administration and commerce) and IIIb (lower grade; sales and services), as often suggested for the analysis of mobility for women, and we do not distinguish between VIIa and VIIb at the bottom of the occupational hierarchy (Erikson and Goldthorpe, 1992).
Parents’ class positions are measured when their children are between the ages of 10 and 19. We employ the dominance principle for parental social class, meaning that we take the higher social class of the parents, regardless of whether it is the father or mother. In additional sensitivity analyses, we combine the parents’ three-category version of the social class schema into a joint nine-category social class and replicate our main analyses. These results are reported in Section 3 of the Supplemental materials.
Methods, analytical strategy and model selection criteria
We begin by analysing absolute total mobility, using mobility tables that cross-classify social origin and social position. The cases that fall on the main diagonal of the table are considered immobile (Xie, 1992). Absolute total mobility thus refers to the proportion of all men and women moving to a class different from their parents.
Within absolute mobility, we can further differentiate horizontal and vertical mobility. To do so, origin and destination classes are collapsed into three larger categories that are expected to grasp the main hierarchical element between classes. We follow the classification of Goldthorpe (2016) and Breen et al. (2009). The salariat class is at the top of the class hierarchy, including the two levels of salaried managerial and professional employees (EGP I and II); the bottom consists of the manual working class, including wageworkers in more or less routine jobs (EGP V–VI–VII–IIIb); and the remaining occupations belong to the intermediate class (EGP IIIa and IV). Upward mobility, therefore, concerns movements from the working class to either the intermediate or salariat class or from the intermediate to the salariat class. Downward mobility concerns movements from the salariat to the intermediate or working class or from the intermediate to the working class.
Relative mobility is considered a better measure of a society's degree of openness than absolute mobility (Breen, 2004). In these analyses, the focus is on the relative opportunities to access certain social classes in comparison to others originating from different social classes. The basis for analysing relative mobility is odds ratios, in contrast with the percentages used in absolute mobility calculations. To provide single measures of relative mobility from large mobility tables, log-linear models are applied (see Section 1 of the Supplemental materials for the formulae). Odds ratios and log-linear models control for the marginal distributions of the applied variables, which is why they capture changes in social mobility net of changes in the occupational structure of a society (Hout, 1983).
For a detailed log-linear analysis, we selected the following categorical variables: period (P), birth cohorts (C), social origins (O), education (E) and destinations (D). Rather than using more typical cohort–origin–destination or education (COD or COE) tables, the analysis is conducted by applying the four-way cohort–period–origin–destination or cohort–period–origin–education (CPOD or CPOE) tables. Consequently, all models contain three-way interaction terms. We are particularly interested in contrasting the constant social fluidity (CnSF) model against the Unidiff or log-multiplicative model of change over birth cohorts. The basic assumption of the former is that odds ratios do not vary across birth cohorts or children's education: the pattern of the ED or the OD associations remains constant across birth cohorts. The Unidiff models let the association between each pair of variables vary across birth cohorts or educational levels (technically speaking layers) by a scaling factor, the Unidiff parameter (see Erola, 2009; Gil-Hernández et al., 2017). When the Unidiff parameter increases or decreases over time, the level of intergenerational inequalities varies accordingly.
The interpretation of whether there is substantial (and significant) change across cohorts relies on the model comparisons based on a set of model goodness-of-fit statistics. A model with a smaller value in the likelihood-ratio L2 is considered to have a better fit. This statistic indicates the level of parsimony of a log-linear model relative to the degrees of freedom (the number of parameters employed in each model, see Breen, 2004): a model with a smaller value has a smaller discrepancy between observed and fitted values in the cells of the social mobility tables. Another indicator of goodness-of-fit is the Bayesian information criterion (BIC), with lower values again indicating a better-fitting model. However, given the large number of observations in our sample, relying only on the BIC measure would be misleading – with a large number of cases, a more complex model would almost always have a lower BIC. Therefore, we also consider the dissimilarity index (Δ) that is not sensitive to sample size (see also Ruggera and Erola, 2022). As this discrepancy between observed and fitted values of the cells decreases, the dissimilarity index (Δ) also improves by becoming closer to zero (see Ruggera and Barone, 2017). The final choice of the best fitting model depends on the difference between CnSF and Unidiff models or between one- and two-layer Unidiff models. If this difference in L2, given the additional degrees of freedom needed, is statistically significant (p ≤ 0.05), we prefer the more complex model (Xie, 1992). p-values for these comparisons are also reported in the tables below.
Changes in the occupational structure and absolute mobility
We begin by considering the occupational destinations of the cohorts under study, particularly in terms of structural change (Figure 1). Previous research has indicated that Finland industrialised relatively late but rapidly over the two decades following the Second World War (Erikson and Pöntinen, 1985). In the cohorts considered here, the constant decline of the already quite small farming sector persisted and concerned both men and women (IVc and VIIb for men and IVc for women). In addition, the working classes also saw a reduction among both men and women.
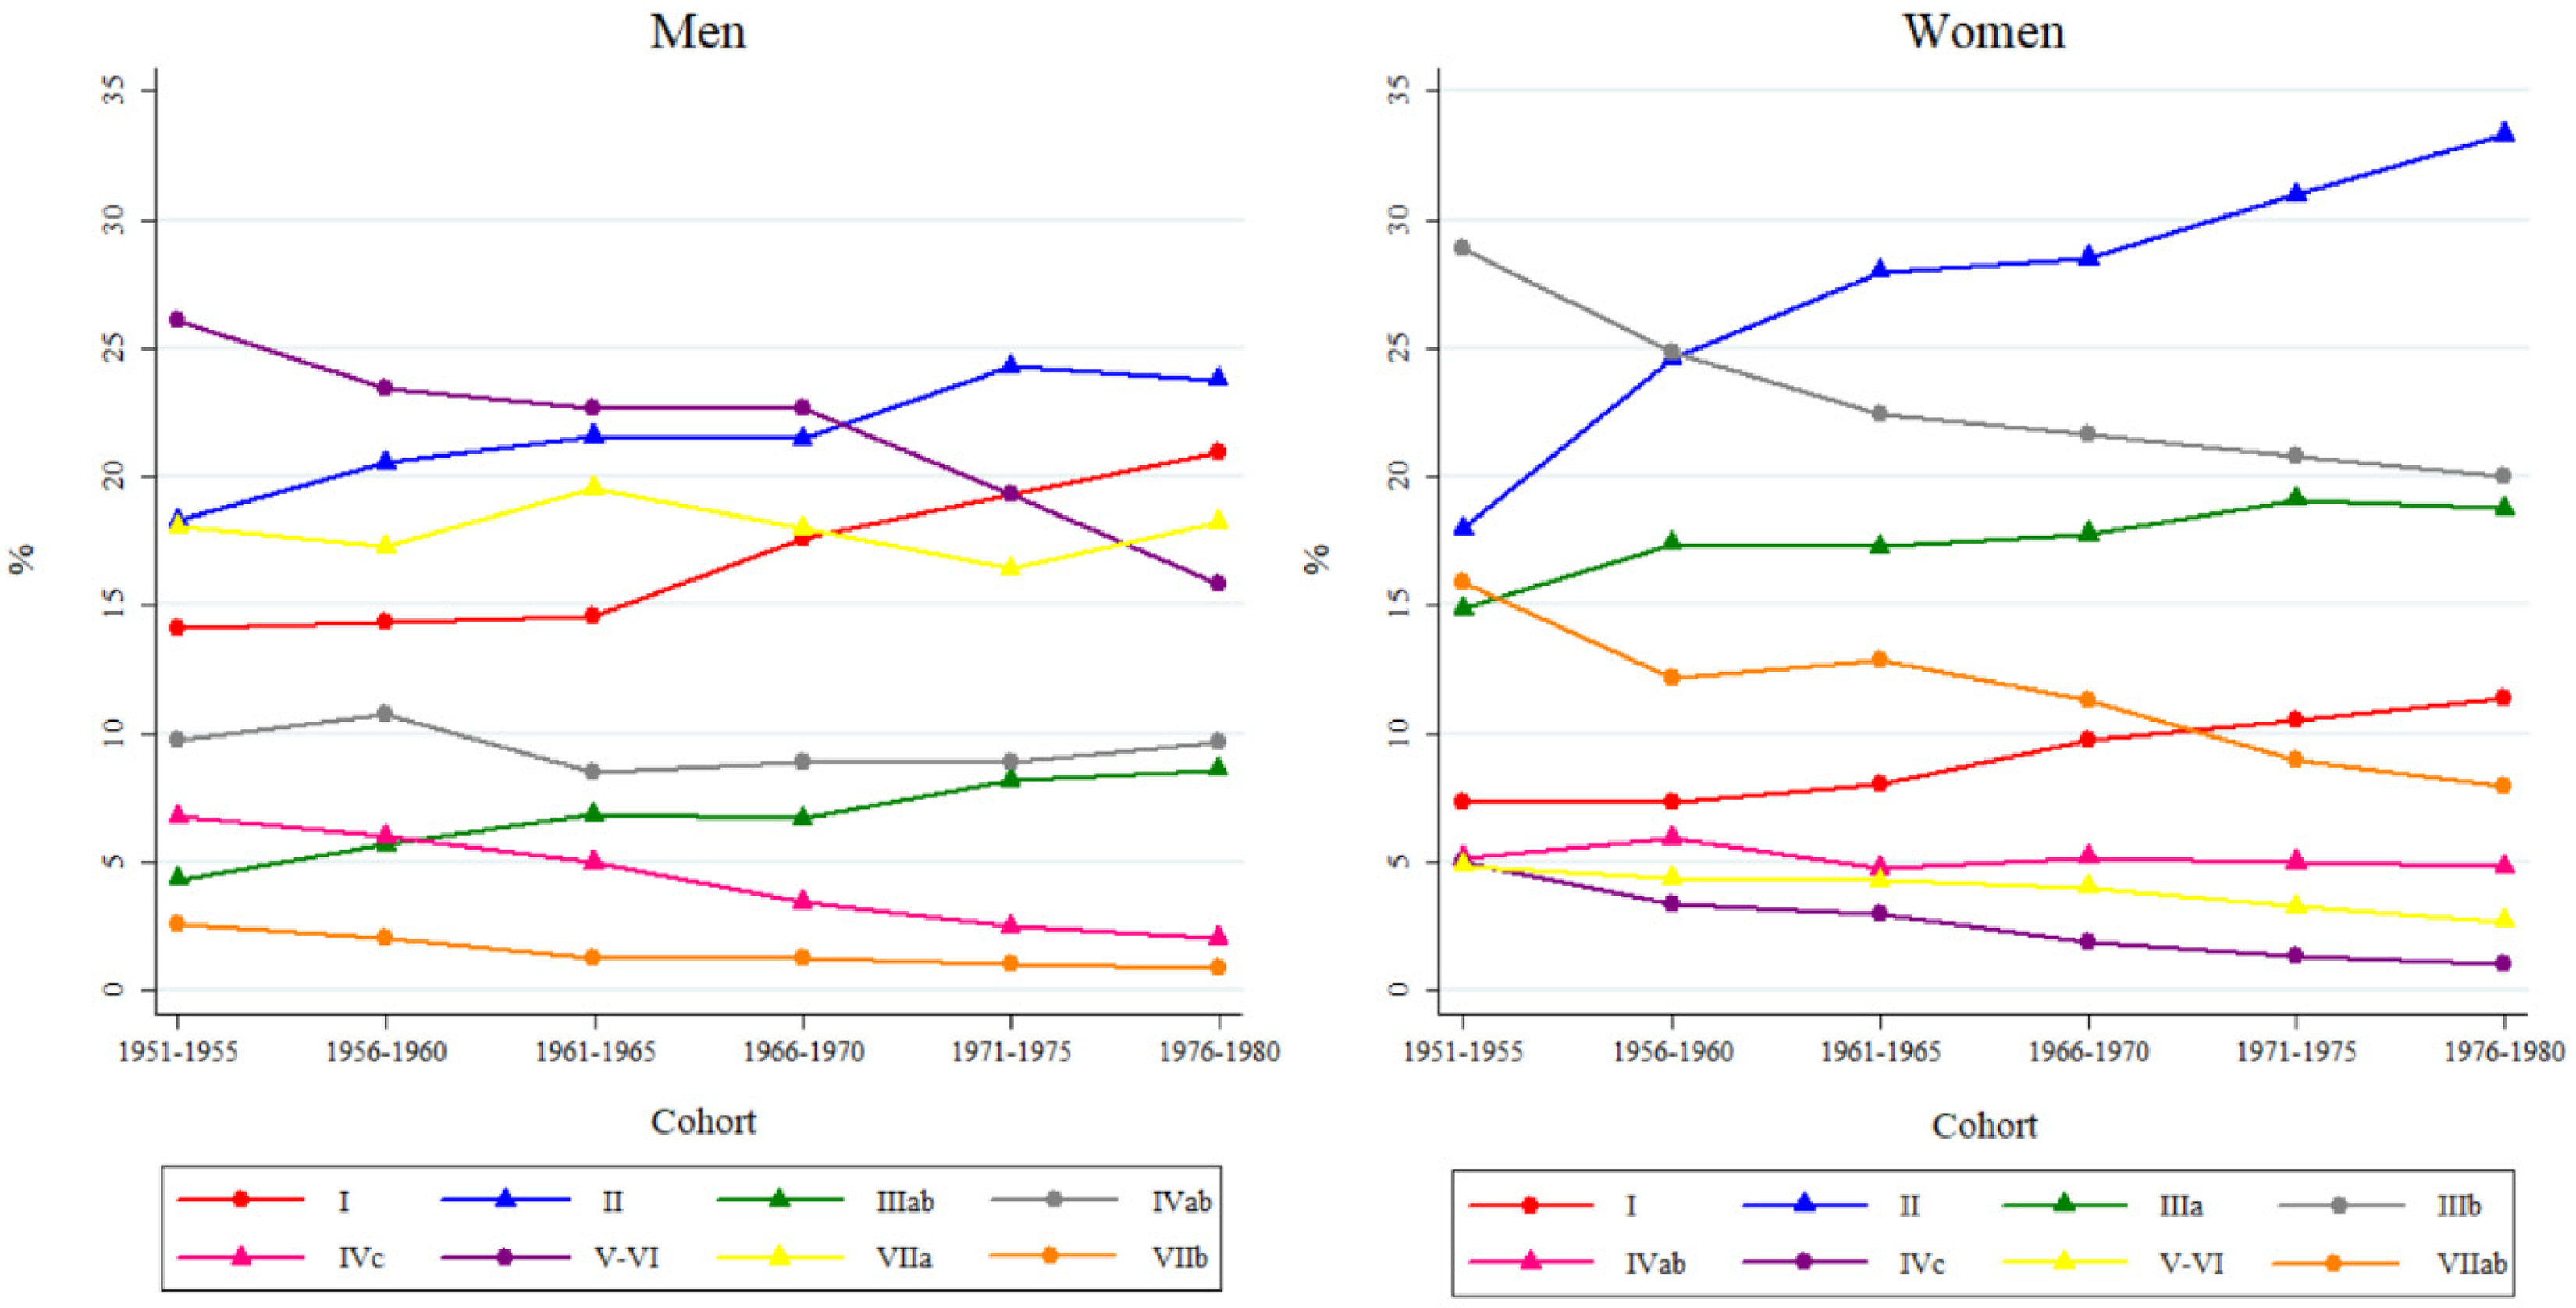
Distribution of occupational attainment over cohorts by gender. Source: Authors’ own calculations based on Statistics Finland full population data.
In contrast, a gendered pattern emerges when considering service class growth. Service classes II and I grew over time for both men and women, but with different sizes and gender compositions, which concerns all European societies (Ruggera and Barone, 2017). Although the educational qualifications of women have exceeded those of men since the 1980s (Erola, 2009), women are overrepresented in service class II (with an increase of 17 percentage points over birth cohorts). In contrast, men are overrepresented in the higher service class I (with a rise of 7 percentage points). The higher service class thus remains male-dominated, and a major part of the global growth of the service class (Service Classes II and I) is due to women's increasing opportunities in Service Class II, which includes many female-dominated occupations. 1
Table 2 shows absolute, vertical, upward and downward mobility for these cohorts at the same age (35–39). Absolute (total) mobility (with the eight categories class schema) appears to have been stable over time for men (only 1.9 percentage points decrease) and diminishing for women (8.8 percentage points). Vertical mobility across the three larger classes increased for men (by 9.7 percentage points) and women (by 4.9 percentage points). Among men, both vertical upward mobility (by 5.9 percentage points) as well as vertical downward mobility (by 3.8 percentage points) increased, whereas for women, vertical upward mobility increased (by 7.8 percentage points), but downward mobility decreased (by 2.8 percentage points).
Absolute and vertical mobility over cohorts for men and women at age 35–39.
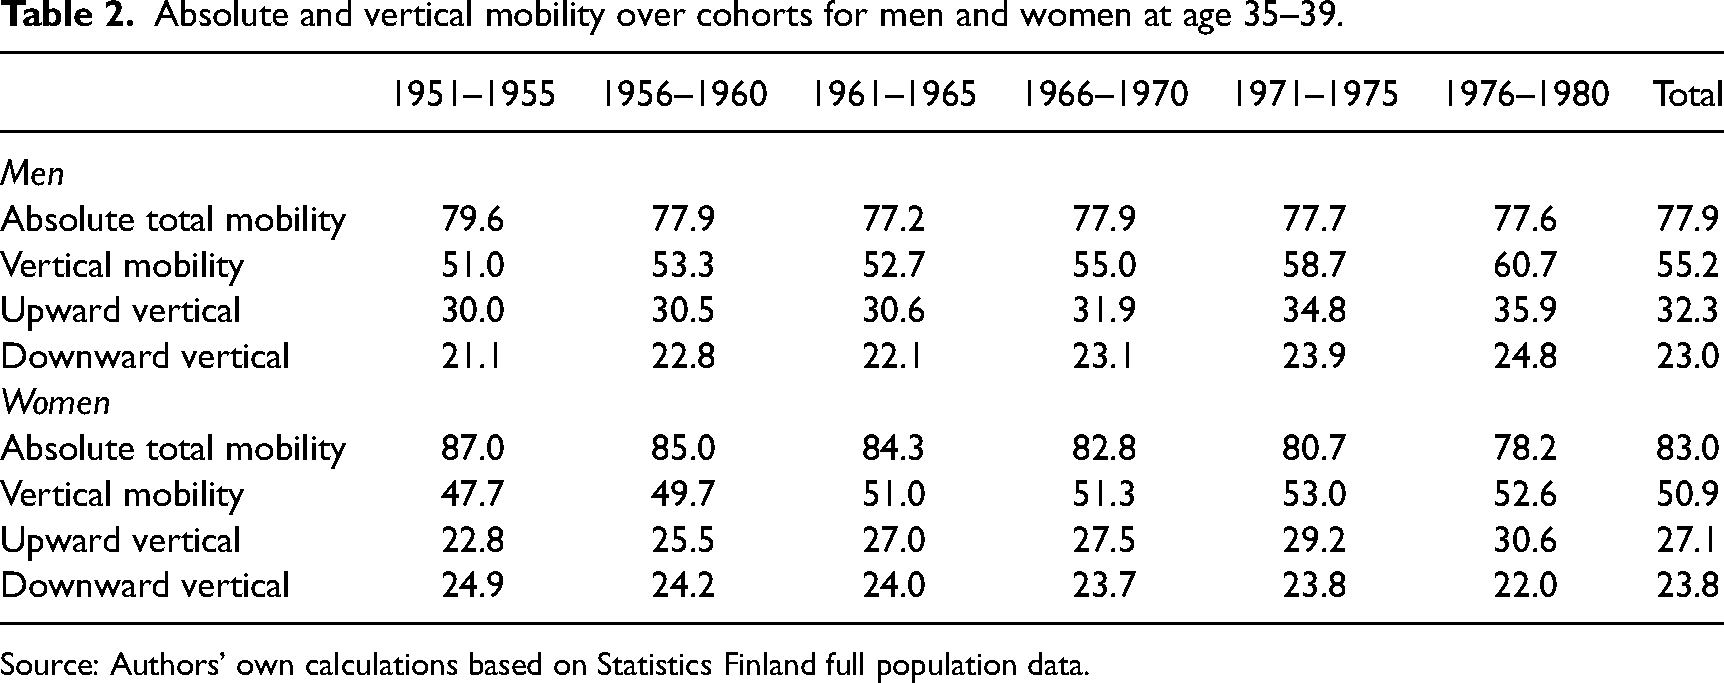
Source: Authors’ own calculations based on Statistics Finland full population data.
Relative mobility: Social fluidity over cohorts within the OED triangle
We then move to assessing changes across cohorts in relative mobility. Table 3 shows the goodness-of-fit of the models estimated for the Gross OD (intergenerational mobility) and the other associations of the OED triangle: OE for educational inequalities by social origin and ED for class returns to education (to understand how much educational attainments correspond to the occupation of children) separately for men and women.
Log-linear models’ goodness-of-fit: constant social fluidity versus Unidiff.
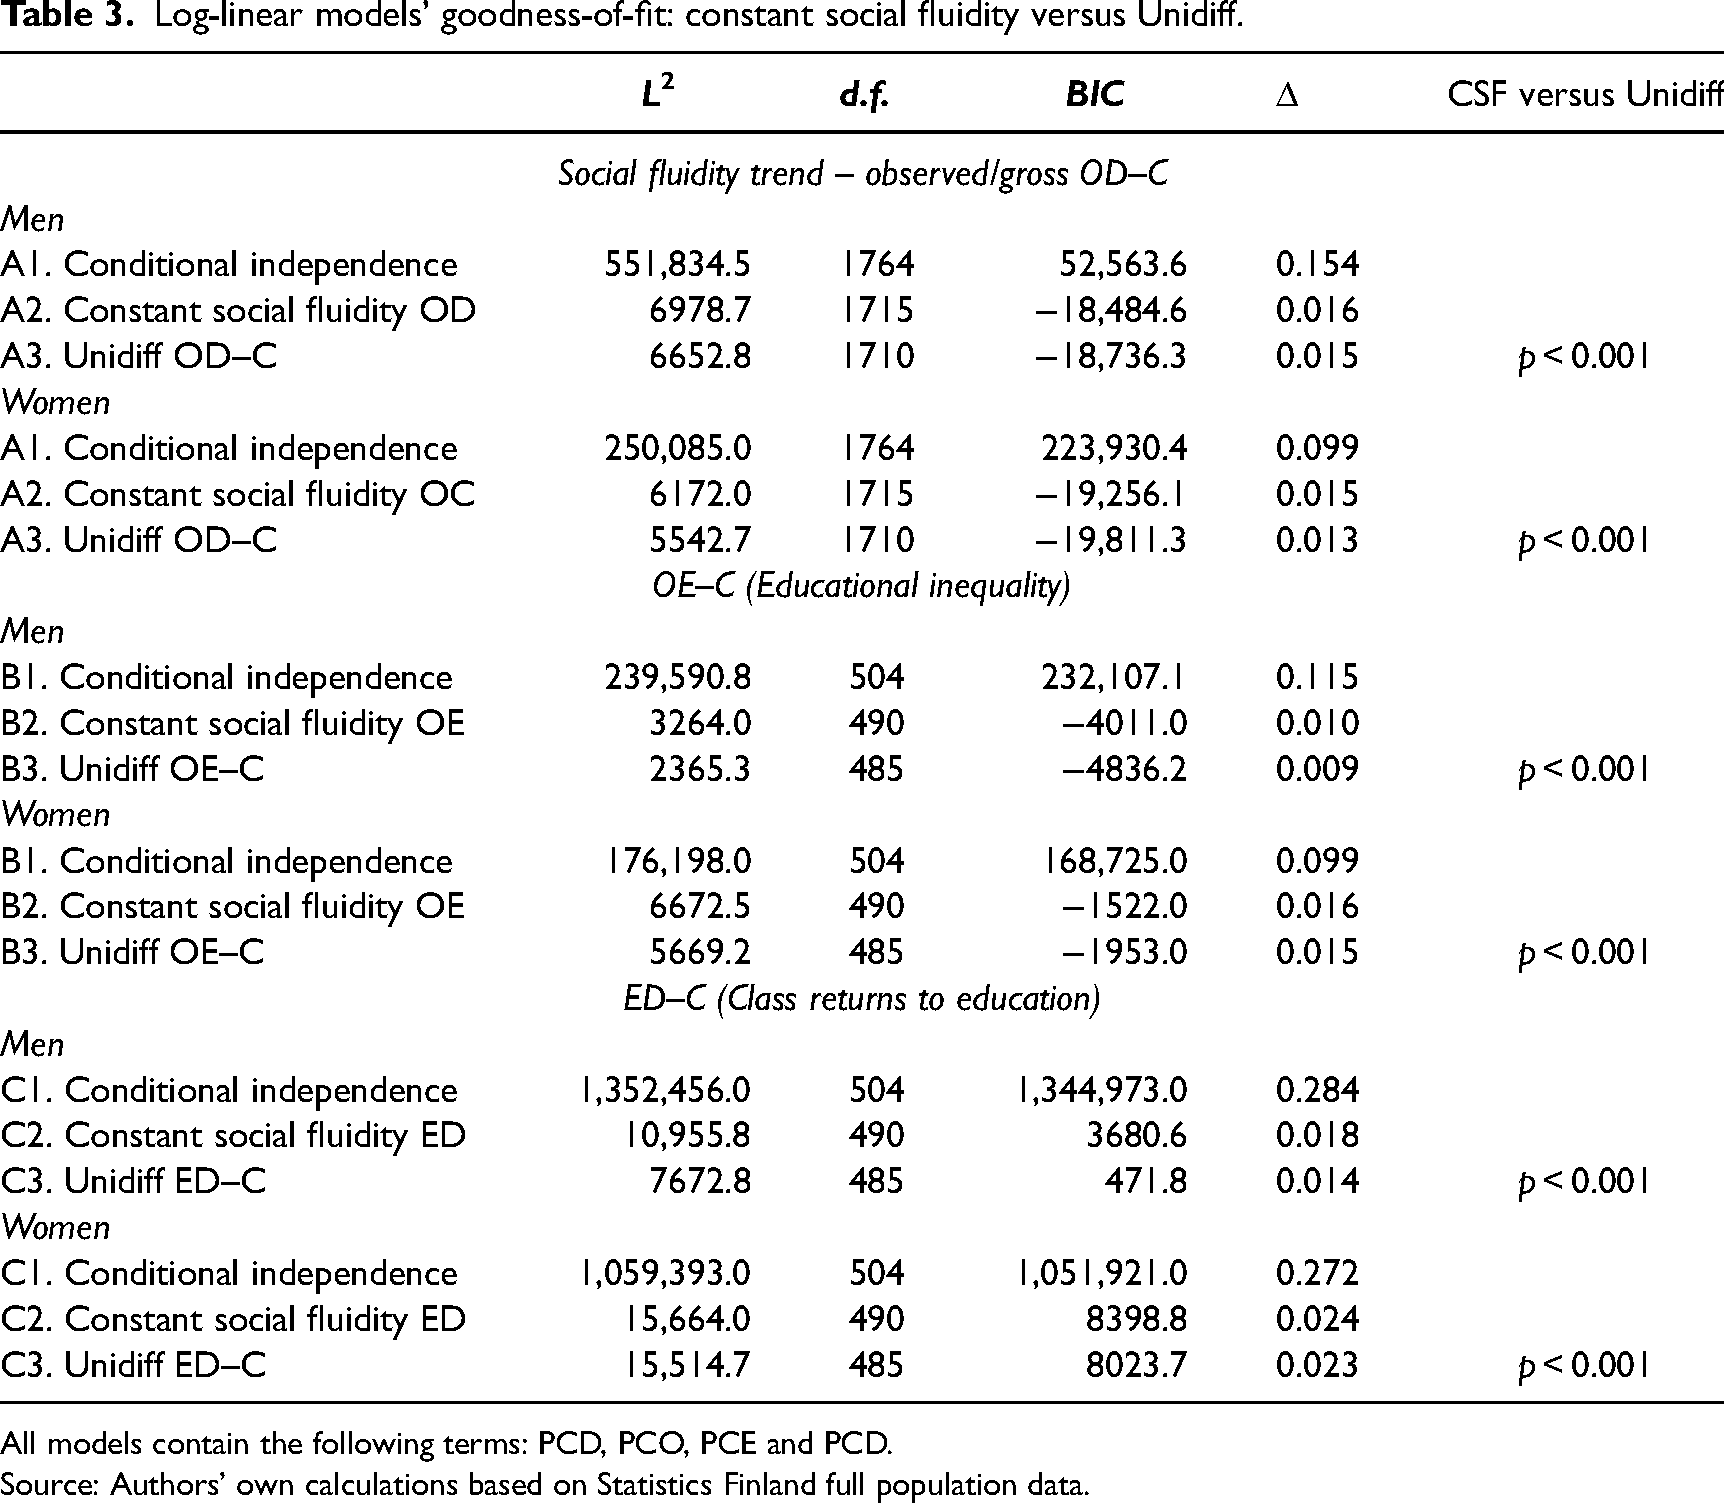
All models contain the following terms: PCD, PCO, PCE and PCD.
Source: Authors’ own calculations based on Statistics Finland full population data.
The conditional independence models are used as baselines for model comparison (models A1, B1 and C1). Based on model fit, the assumption that there is no association between social origins and destinations, origins and education or education and destination is largely unrealistic. The constant social fluidity models (models A2, B2 and C2), which allow these associations but assume that they do not change between cohorts, show a great improvement in goodness-of-fit, with a very low dissimilarity index, as well as a negative BIC in the case of OD and OE. We then move to the Unidiff or log-multiplicative models (models A3, B3 and C3). In the case of OD, for the log-multiplicative model (models A3) we notice that L2 improves slightly and BIC decreases. Nevertheless, the dissimilarity index does not change much, especially for men. However, as our model comparison suggests that the Unidiff models show a better goodness-of-fit for both men and women, we will below plot and discuss the Unidiff parameters to grasp the change over time (see Figure 2 for results of models A3 in Tables 3 and 4).
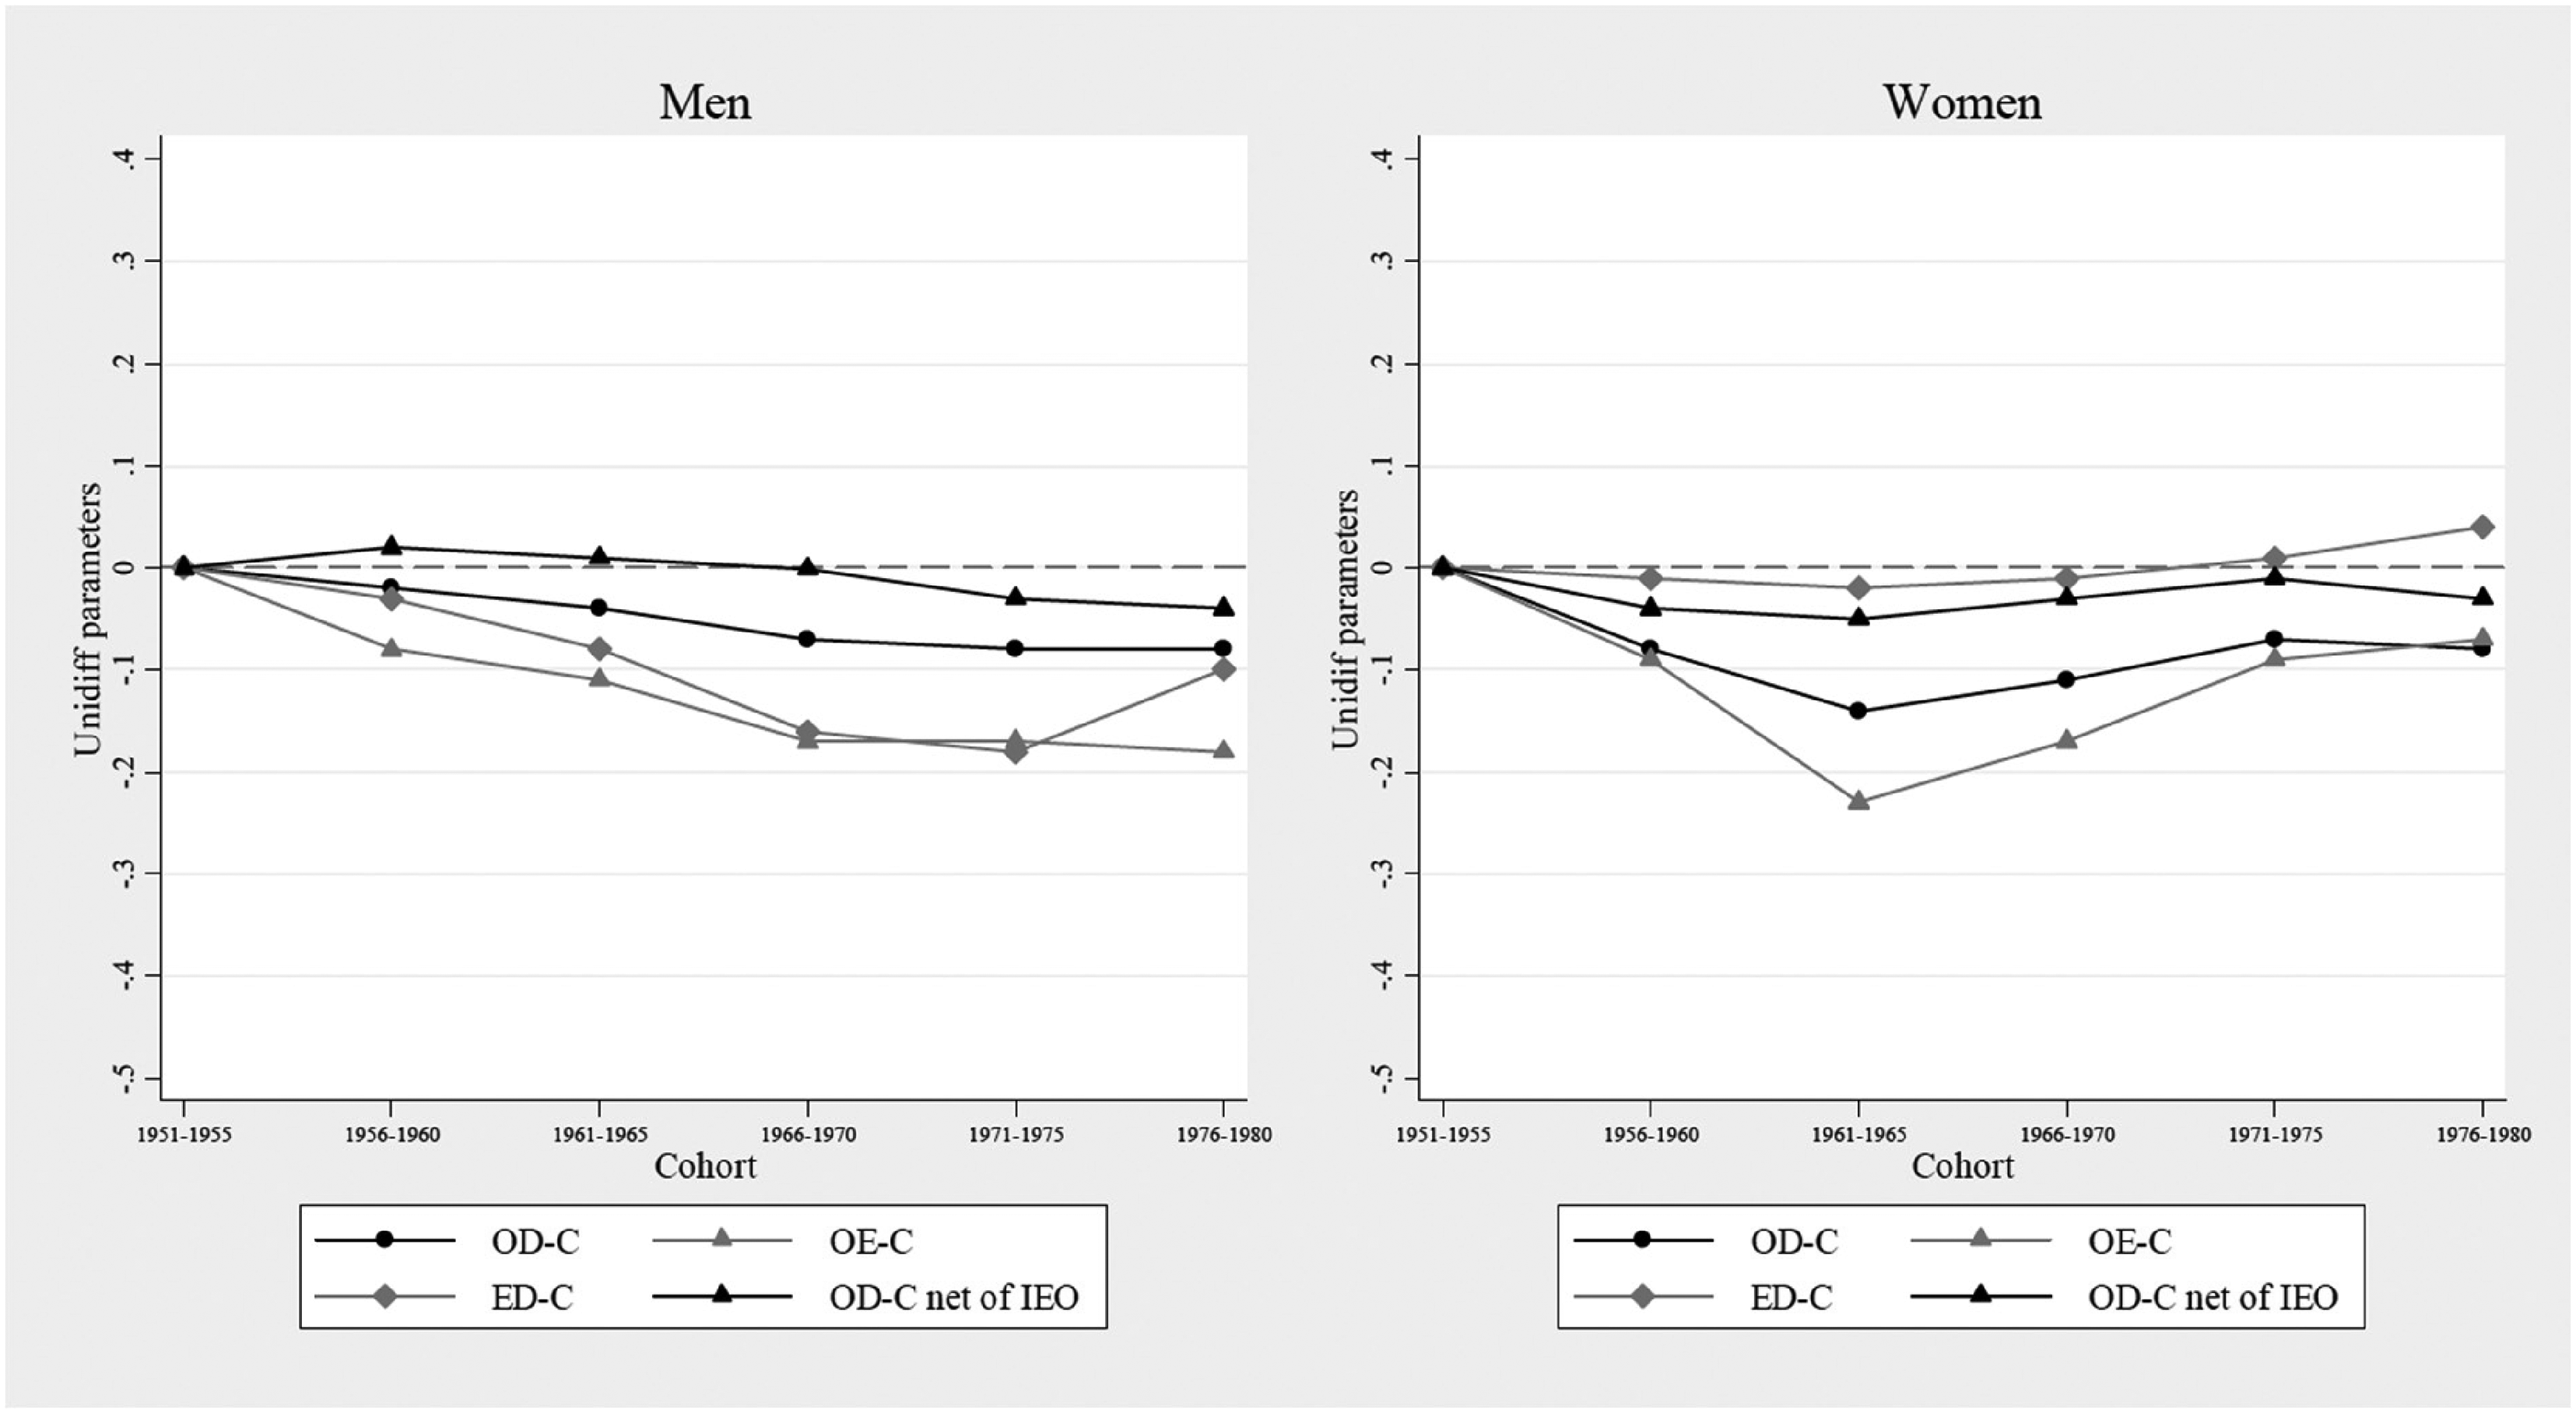
OED trends over birth cohorts and gender: observed (gross) social fluidity trend (OD|C), inequality of educational opportunities (OE|C) and class returns to education (ED|C) and OD|C net of educational changes. Unidiff parameters extrapolated from Model 3 in Tables 3 and 4. Source: Authors’ own calculations based on Statistics Finland full population data.
Log-linear models’ goodness-of-fit: constant social fluidity versus Unidiff with four educational levels (PCOED table).
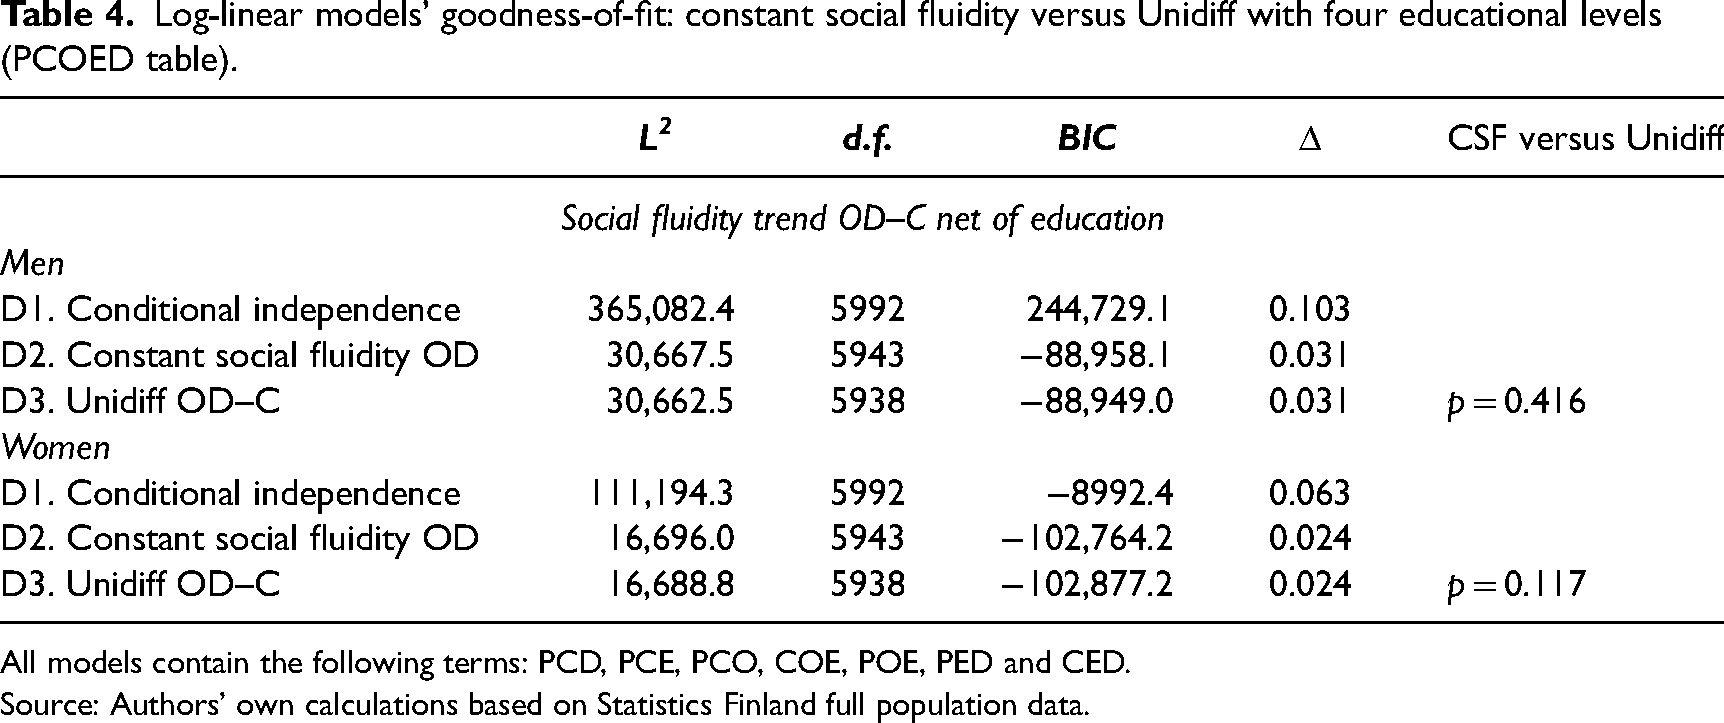
All models contain the following terms: PCD, PCE, PCO, COE, POE, PED and CED.
Source: Authors’ own calculations based on Statistics Finland full population data.
When comparing models B2 and B3 for the OE association, the Unidiff models again have the best fit for both men and women. Finally, with regard to the ED association, the Unidiff models (C3) show a substantial improvement over the constant social fluidity model (C2) in terms of the dissimilarity index, particularly for men.
Before interpreting the Unidiff parameters graphically, we examine the OD association while taking into account educational changes (Table 4). The model results in Table 4 suggest that the OD associations’ net of educational changes is mainly defined by stability: assuming change in the models does not improve the fit over the constant fluidity models (D3 vs D2). According to our interpretation, most of the changes in intergenerational mobility were related to education. In other words, without educational expansion, social mobility would have remained largely stable over time.
Next, we turn to a graphical representation of all four associations that have been examined so far (Figure 2). Even if the gross OD association (intergenerational mobility) shows a slight decline over time (which is significant in terms of p-value, but not so much when considering the dissimilarity index) for men (black line with circles), the pattern is even more stable when we account for educational changes (black line with triangles). For women's gross OD association, variations over birth cohorts are pronounced (as well as the decrease of the dissimilarity index), decreasing until the 1961–1965 cohort and then increasing after the 1970–1974 cohort. Nevertheless, stability in social fluidity also characterised the OD association net of educational changes for women.
Regarding the change in OE over cohorts (grey line with triangles), educational inequalities for women are U-shaped, indicating that there was first a decline in educational inequality but that most of this faded away by the most recent cohort. For the youngest cohorts of men, there is a relatively continuous downward trend (i.e. decreasing educational inequalities over time).
Finally, the ED association (grey line with diamonds) shows a higher decrease in class returns to education for men than for women; the trend is positive for women. While this shows a continued dependence on educational credentials in the labour market for women, to understand the trend for men better, we turn to models that also consider origins as a second layer in the ED relationship.
Table 5 shows the results when first adding origins as a layer to the ED relationship (models E3) and then pairing together with cohorts to assess change (models E4). Single-layer Unidiff models (E3) have a significantly better fit for both men and women than Constant Social Fluidity models (E2). This suggests that the education–destination association differs by origin. However, the comparison between single- and double-layer models (E3 vs E4) suggests that this difference also varies according to cohort.
Education–destination association taking into account differences across social origins and cohorts.
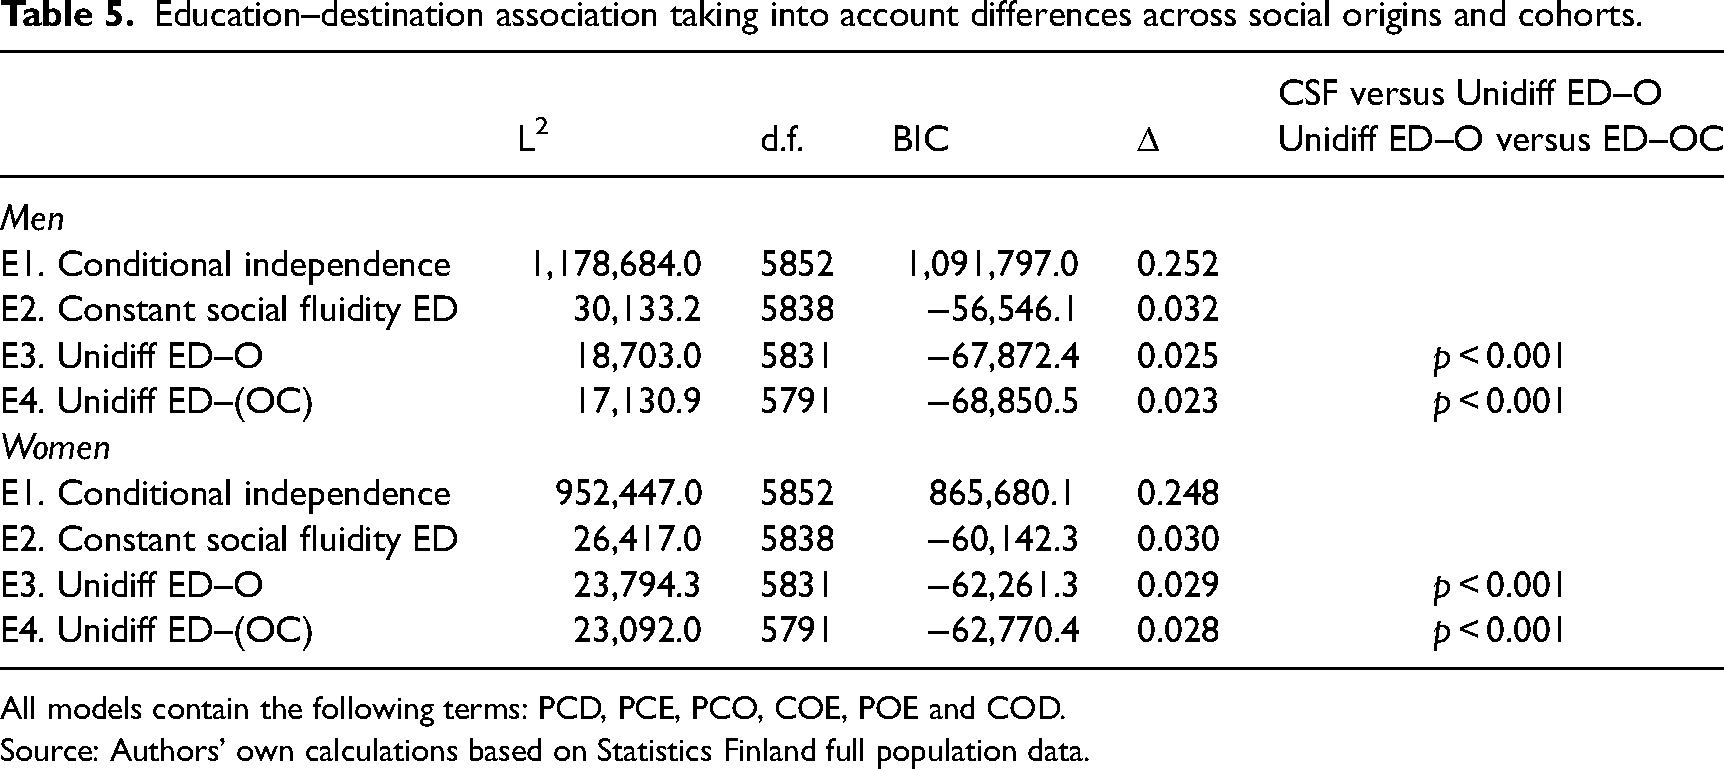
All models contain the following terms: PCD, PCE, PCO, COE, POE and COD.
Source: Authors’ own calculations based on Statistics Finland full population data.
Figure 3 shows Unidiff parameters for models E4 extrapolated from Table 5. The estimates clearly show how the change in ED across cohorts has differed by social origins. Although the negative trend in ED for men is apparent for almost all classes (except routine non-manual employees), the urban and agricultural petit bourgeoisie classes are the ones driving the trend. As was shown in Figure 1, men are overrepresented in the petit bourgeoisie and working class, and they also have higher responsibility, autonomous and well-paid positions in service class I than women with the same level of education. It can also be noted that while a positive trend in ED is evident across origin classes for women, the trend for the agricultural petit bourgeoisie is also negative for women. This origin class is a disappearing one, and fewer individuals obtain educational titles related to this career. The latter also applies to the (male) urban petit bourgeoisie. On the contrary, for women, the value of education seems to increase over time, but most of all for those originating from the upper classes (I and II but also III). It should also be noted that overall, the classes with the greatest decline in the ED association among men are the ones that have tended to have the highest ED associations (see Supplemental materials, Section 4), so at least to some extent, these changes represent convergence among classes. Likewise, among women, classes I and II have tended to have the lowest ED associations; thus, their stronger growth represents convergence.
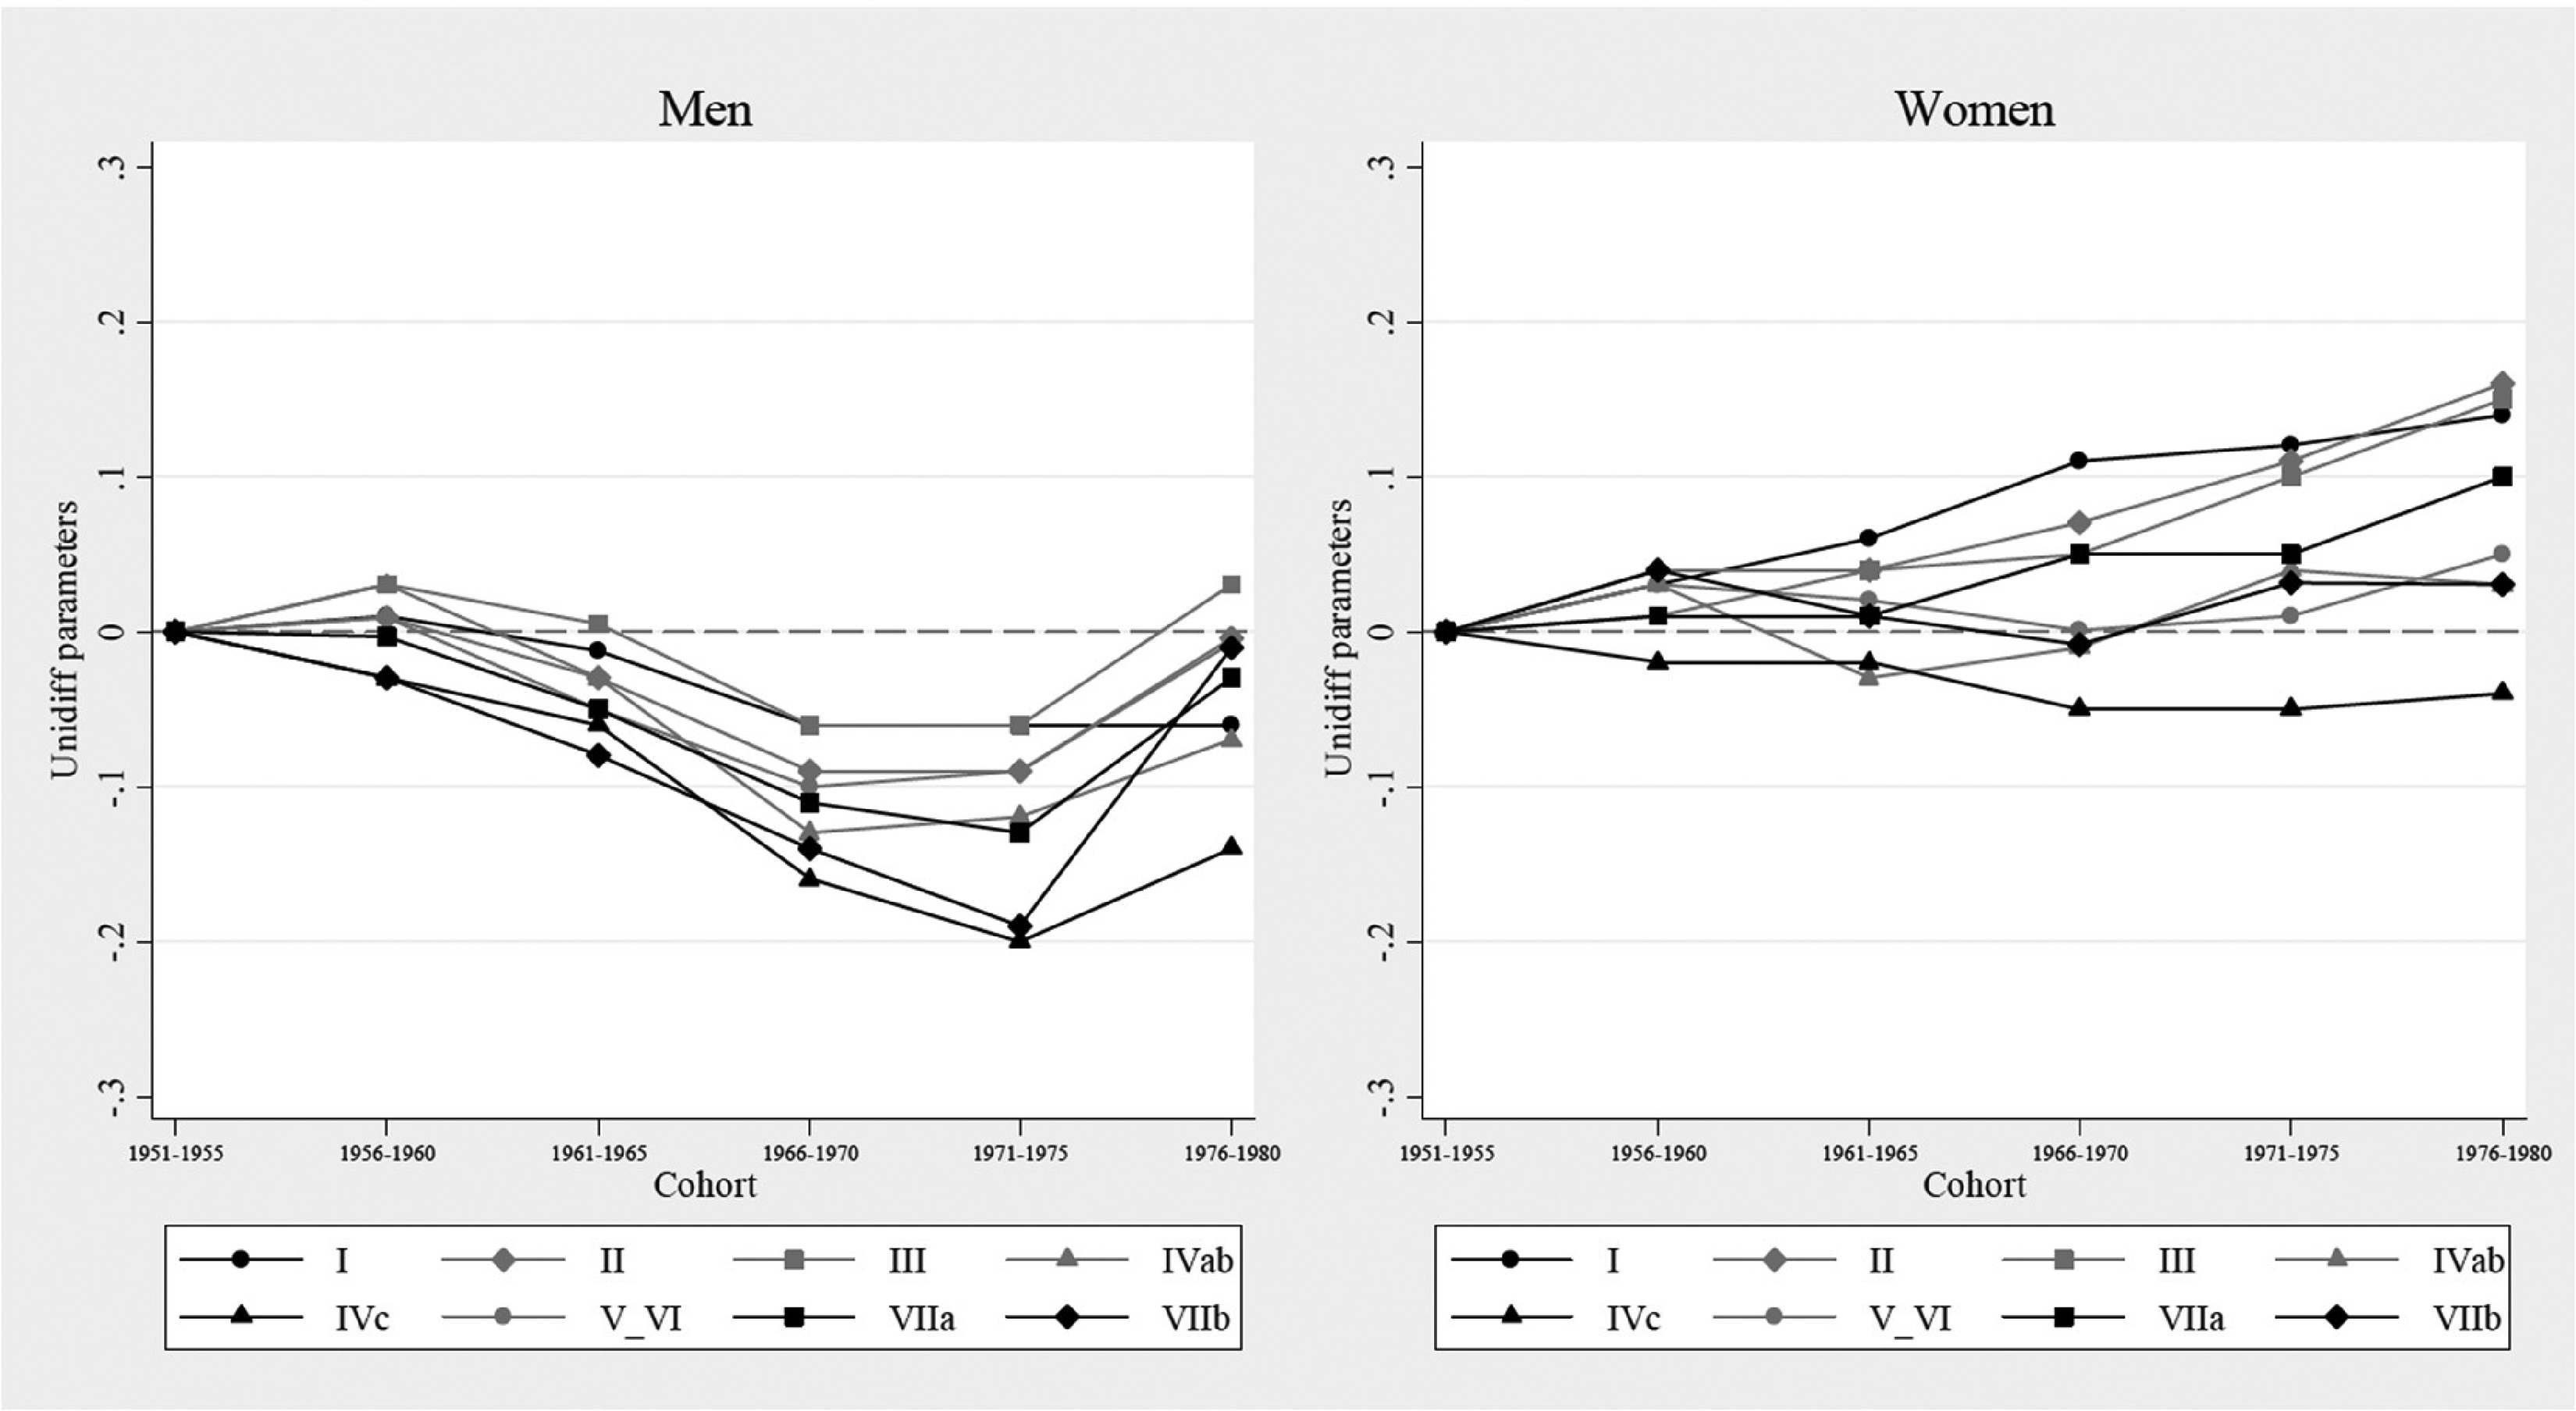
Cohort changes in class returns to education by origin class and gender. Unidiff parameters extrapolated from Model 4 in Table 4. Source: Authors’ own calculations based on Statistics Finland full population data.
In the final part of our empirical analysis, we return to the OD association, concentrating on differences by education level. Table 6 reports the results for the log-linear analyses using education as a single-layer (models F3) and considering this with changes across cohorts with the double-layer EC Unidiff parameters (models F4).
OD association taking into account differences across education levels and cohorts.
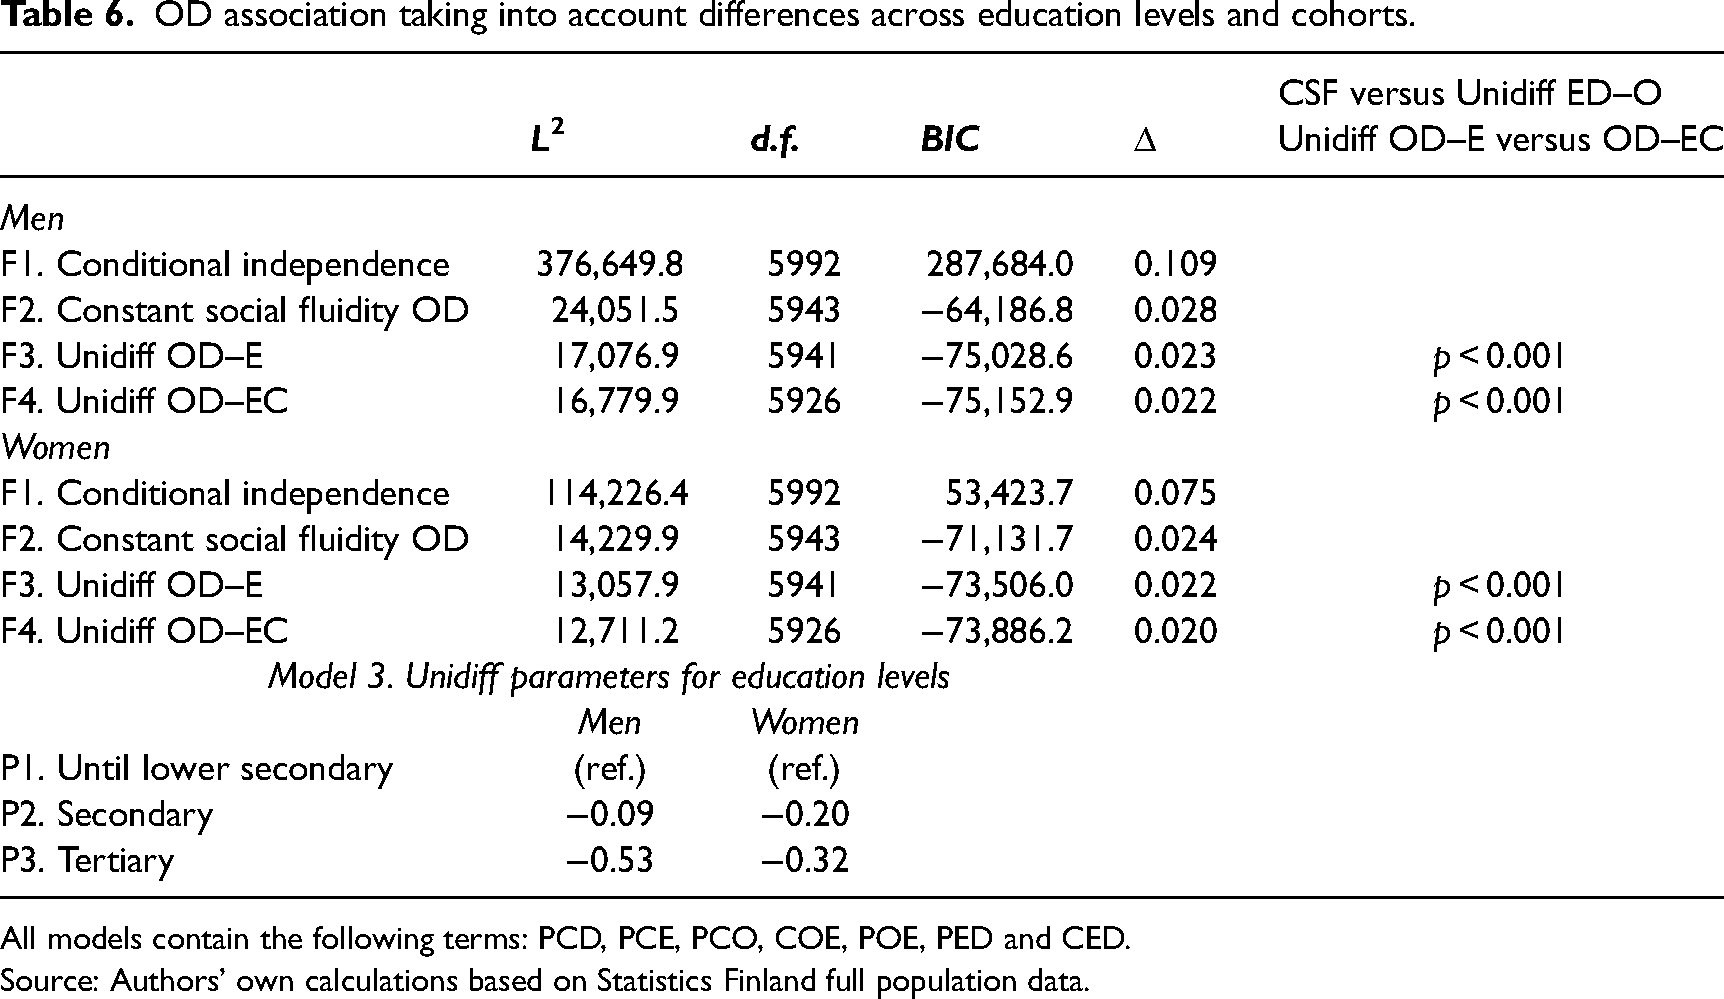
All models contain the following terms: PCD, PCE, PCO, COE, POE, PED and CED.
Source: Authors’ own calculations based on Statistics Finland full population data.
The results suggest that there are clear differences in the OD association across education levels for men and women (see the model comparison: Constant Social Fluidity vs Unidiff OD–E). The lower part of the table shows the Unidiff parameters from Model 3, indicating that the OD association is less strong for the tertiary educated than for those who have a lower education – these results are consistent with the comparative results reported by Bernardi and Ballarino (2016) – and the difference compared to the lowest educated is larger for men than for women. When comparing those educated at the secondary level to those with the lowest level of education, the difference is larger for women than men. From these models, it is evident that education functions as a social leveller, and this holds particularly for men.
As a last part of the analyses, we test whether this has changed across cohorts by comparing the fit between single and double-layer models (Unidiff OD|E vs OD|EC). The model fit improvement is statistically significant in both cases of men and women. To illustrate this change, we plot the OD model with the Unidiff parameters for cohorts and education (Figure 4, based on models F4 in Table 6). Whereas at lower levels of educational attainment, there is a tendency for more fluidity over time, the OD association for tertiary graduates has increased. These trends are stronger for women, whereas for men, the change happened later and to a slightly lesser extent. The change means that the education levels have converged in terms of the strength of the OD association since the change is in the opposite direction as the overall differences between the education levels shown at the bottom of Table 6.
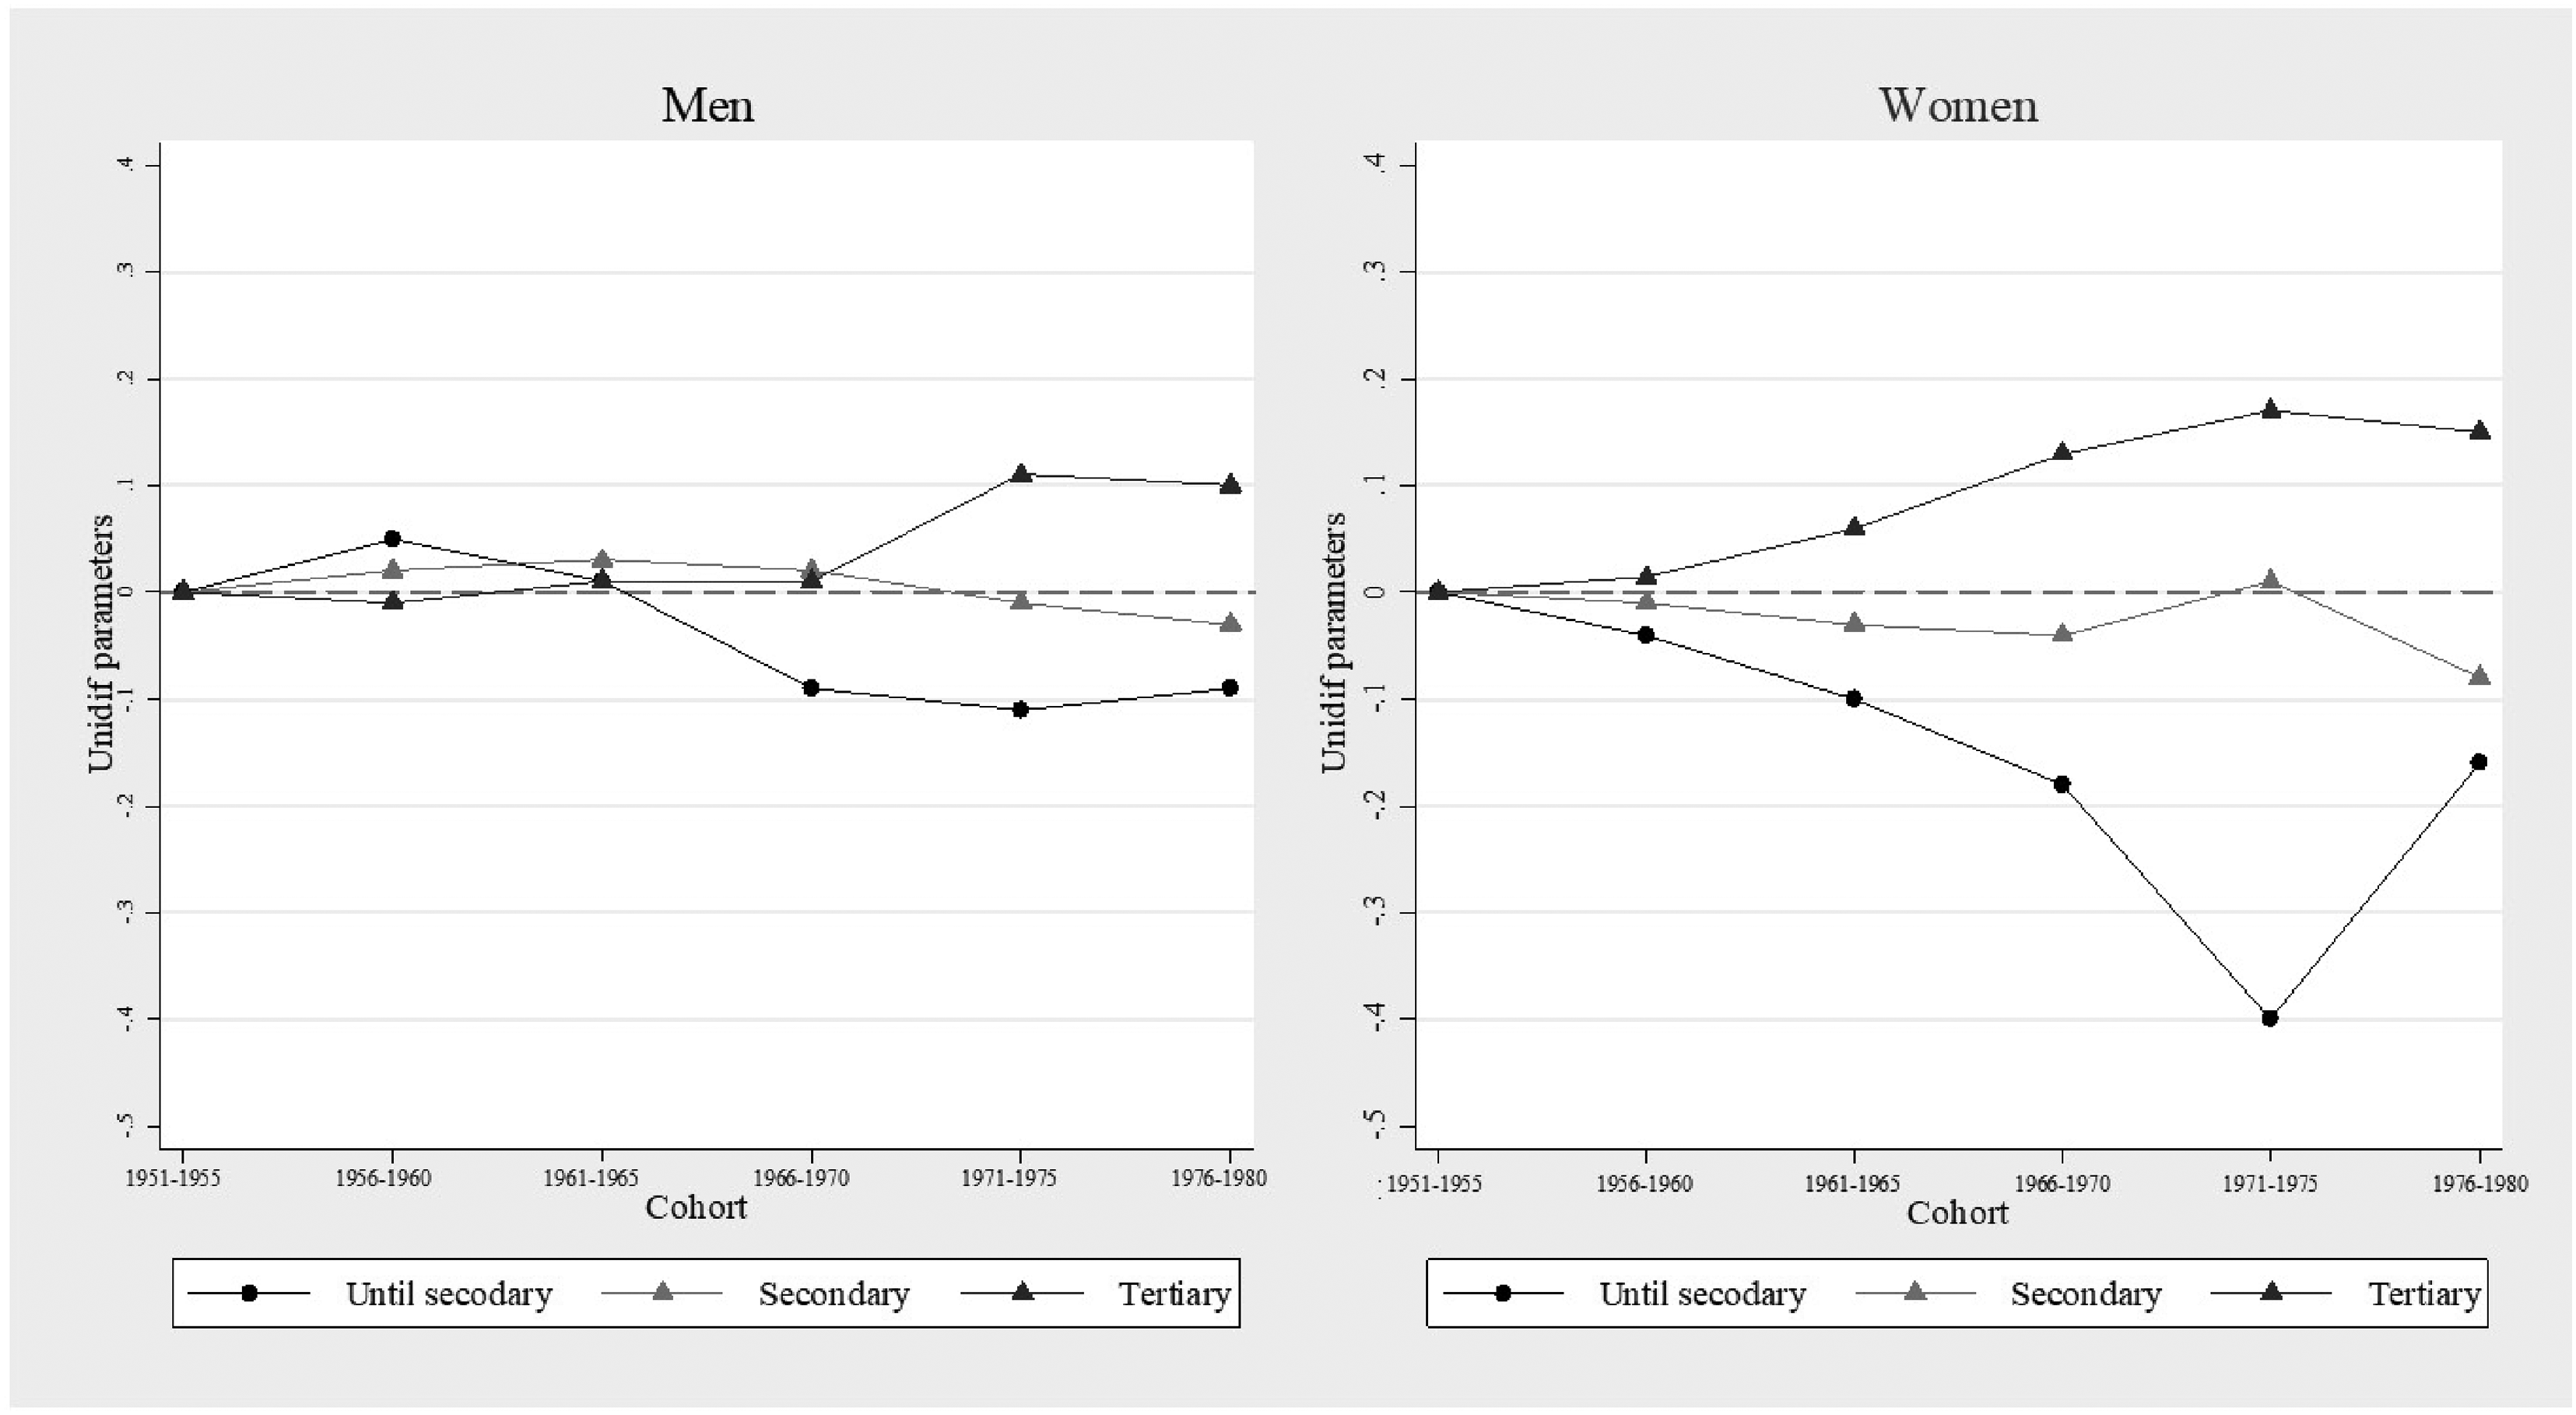
Cohort changes in the effect of origin on destination by education level and gender. Unidiff parameters extrapolated from Model 4 in Table 6. Source: Authors’ own calculations based on Statistics Finland full population data.
Discussion
We have analysed intergenerational social class mobility for cohorts born from 1951 to 1980 in Finland from the perspective of the associations in the OED triangle, including various interactions (double layers). We now summarise our results in relation to our hypotheses. First, we hypothesised a decline in educational inequalities by family background (H1) along the lines of the modernisation theory. H1 is overall supported, particularly for men. As Erola (2009) and Breen and Jonsson (2007) asserted, this trend correlates with the rapid and steep expansion in education. However, for women, a relatively dramatic reduction in educational inequalities has been followed by an increase, though still leaving them at a slightly lower level than for the oldest cohorts.
Our second hypothesis (H2) concerned the potential emerging education–jobs gap. We found a declining ED association for men but a strengthening association for women. Thus, even if the modernisation theory expects an increasing education-based meritocracy, we find that while the argument holds for Finnish women (H2b), men's occupational achievements have become more detached from this principle (cf. Jackson, 2006). The family background-related factors that are not correlated with education are increasingly important for men's occupational attainments.
Why do we observe such gender-based divergence? Work experience and cultural and social resources can play a crucial role in men's career development and occupational achievements, over and above the effects mediated by education (Bourdieu, 1986). Social networks, work experience and cultural resources are especially important for the petit bourgeoisie. The petit bourgeoisie depends more on experience and social networks, fundamental resources for developing a large client portfolio. In contrast, higher education is not necessary to improve work performance. This social class does not have high social prestige (and an intermediate ranking in terms of social class) but can nonetheless achieve high levels of income (Meraviglia and Buis, 2015).
Women, instead, are overrepresented in the lower service class (II) and white-collar positions of the working class (IIIa). This is particularly relevant for the Finnish case, where the public sector is a particularly important employer for women in these classes. As in many other countries, many public sector jobs have formal educational credential requirements (e.g. nursing, social work, teaching). This is different in private sector jobs, where more men are employed. Therefore, despite stronger educational expansion among women, occupational upgrading in the context of a segregated labour market has meant that educational inflation has not been a problem among women.
Considering H4, we find that there have been differential trends in class background returns to education – with some differences across genders, too. For this phenomenon, petit bourgeoisie families play a crucial role with the strongest decline in the ED association. This does not necessarily mean that children of the urban and agricultural petit bourgeoisie do not graduate or value education to improve their social class. However, as explained above, for this class, succeeding in the labour market is more dependent on experience and social networks and less dependent on formal education. As this class position is more commonplace for men than women, the same factors increase gender differences.
Nevertheless, many of these trends also represent convergence across classes over time. We found support for the hypothesis that the OD association is weaker among the higher educated (H5). However, when examining intergenerational mobility (OD) across educational levels and cohorts (EC), we found that these differences are becoming smaller: fluidity has increased for those with lower levels of educational attainments, whereas it has reduced for tertiary graduates. The first observation suggests that the compensatory advantage of higher social class background has diminished: they are less and less able to improve the social class destinations of their children who end up with a low level of education, potentially because this level of education has become increasingly rare and selective. The second observation suggests that occupational upgrading has not kept pace with rapid educational expansion. Thus, the “meritocratic fairness” in the labour market for the highly educated has slowly been eroded, leaving space for social origins to play a larger role in occupational attainments – in this case of both men and women.
This leads us back to our third hypothesis (H3), expecting a strengthening association between origin and destination (OD). Overall, we found that the gross OD association had decreased across the cohorts. Still, after accounting for education-related change, we saw relative stability for both men and women (see Figure 2). This suggests that without changes in education, there would have been great stability in relative social mobility in Finland between the cohorts analysed here.
Conclusion
Finland is a Nordic country characterised by a generous welfare state, and its large public sector has promoted a high level of female labour force participation since the 1970s. Compared to many other European countries, Finland has slightly higher levels of social fluidity, even though they have not been further increasing: while there was some increase for the oldest cohorts, particularly women, the trend for the younger cohorts has been relatively stable for both men and women. Theoretically, this means that the mobility pattern of men tends to follow the constant flux hypothesis of Erikson and Goldthorpe (1992). In contrast, women's social mobility for the oldest cohorts is more in line with modernisation theories (e.g. Blau and Duncan, 1967). As mentioned in the discussion, the professional careers of women in Finland are more predictable than those of men, considering their level of education.
The picture of relative stability in social mobility hides some interesting differential changes, which can be considered stricter tests of how meritocratic societies are or how equality of opportunity is realised. On the one hand, the smaller direct effect of social origins for the highly educated has been interpreted as a more meritocratic labour market for this group (e.g. Hout, 1988), and what we see in Finland is an increase in that direct effect, thus indicating movement toward a less meritocratic labour market. On the other hand, the strength of the ED relationship is also a good test of how equality of opportunity is realised in a society. There is no reason why children coming from different social origins should see their educational credentials being differentially related to their occupational outcomes. Here, we also see differential trends. In both cases, the trends indicate convergence, which suggests that the labour market is becoming more similar for individuals at different levels of education or coming from different social classes (also Erola et al., 2020).
It should be noted that our research has not considered migrants or their descendants. As mentioned previously, this decision is partly driven by data – if migrants’ parents are not resident in Finland, their social class is unknown – but also Finland is a relatively new country of immigration and migrants and their descendants are only now becoming a substantial part of the population. Nevertheless, social mobility studies would benefit from giving greater attention to social mobility processes in different parts of the population to understand better the mechanisms involved (see Ferry and Ichou, 2024, for a review of the social mobility of migrants and their descendants).
Further, social mobility studies should take into account both the unique contributions of the social class of mothers and fathers separately and their joint effects over and above the individual influences; the existing evidence quite convincingly shows that key elements of intergenerational transmission are missed unless both parents’ social status is taken into account (Ballarino et al., 2021; Thaning and Hällsten, 2018). This can be particularly useful considering the high rate of female labour market participation, which started in the 1970s, and gendered labour market segregation that, according to our results above, continues to matter for social mobility even in one of the most advanced economies with large and consistent welfare provisions in Europe.
Finland is not considered in most of the comparative social mobility studies, where Sweden is often used as the case study representing the four Nordic countries characterised by a social democratic welfare regime (Esping-Andersen, 1999) in intergenerational mobility studies (e.g. Jonsson et al., 2009). However, welfare regimes are not necessarily that determining social mobility; thus, future comparative social mobility studies should include more varied countries, including Finland.
It seems clear that in the future, social mobility can increase further only with large structural changes. For example, the only significant increase in social fluidity in Italy happened during the economic boom after the Second World War, when a large structural change created more space at the top of the occupational hierarchy (see, for example, Barone and Guetto, 2020). Without such large structural changes, social inheritance is at risk of becoming stronger than before.
Supplemental Material
sj-docx-1-asj-10.1177_00016993241265597 - Supplemental material for Intergenerational social mobility of cohorts born from 1951 to 1980 in Finland
Supplemental material, sj-docx-1-asj-10.1177_00016993241265597 for Intergenerational social mobility of cohorts born from 1951 to 1980 in Finland by Lucia Ruggera, Elina Kilpi-Jakonen and Jani Erola in Acta Sociologica
Footnotes
Funding
The authors disclosed receipt of the following financial support for the research, authorship, and/or publication of this article: This work was supported by the Academy of Finland (INVEST research flagship decision numbers 320162 and 345546); Finnish Cultural Foundation (decision number 00210935) and Kone Foundation (decision number 202107088).
Supplemental material
Supplemental material for this article is available online.
Notes
Author biographies
References
Supplementary Material
Please find the following supplemental material available below.
For Open Access articles published under a Creative Commons License, all supplemental material carries the same license as the article it is associated with.
For non-Open Access articles published, all supplemental material carries a non-exclusive license, and permission requests for re-use of supplemental material or any part of supplemental material shall be sent directly to the copyright owner as specified in the copyright notice associated with the article.