
Abstract
Religiously unaffiliated Canadians have been persistently more likely to reside in the western provinces. In parallel, the degree of religiosity of the affiliates has been generally higher in the low affiliation provinces of the west. This pattern has led some scholars to characterize Canada as religiously polarized. However, in the literature, a quantitative measure of polarization is lacking. Moreover, religious polarization, a rather vividly debated characterization, is not by itself an explanation for the patterns. The present article, using the Canadian General Social Surveys of 1985 to 2011, contributes to the debate in three ways. First, this article establishes the robustness of the geographic discrepancies in unaffiliation rates and the degree of religiosity in Canada. Second, this study proposes and computes a quantitative measure of polarization. Finally the article explores the role of free-rider exclusion as an explanation for the patterns.
Introduction
Unequivocally, the share of Canadians who report no religious affiliation has continuously increased since the second half of the 20th century (Beyer, 1997; Eagle, 2011). According to the data from the 2010s, above 20% of Canadians claim no religious affiliation (Wilkins-Laflamme, 2015). About half of this group has no tie with either religion or spirituality, even in a private manner (Dilmaghani, 2017a). More strikingly, almost 45% of Canadians, religiously affiliated or not, state that they never attend religious services (Dilmaghani, 2017a). Canadian nones have been persistently more likely to reside in the Pacific coast province of British Columbia. Using the first cycle of the Canadian General Social Survey conducted in 1985, Veevers (1990) reported that on the Atlantic coast, just below 5% of the population had no affiliation with organized religion, while on the Pacific coast the figure was above 34%. Veevers (1990), rejecting the provincial differences in the age structure, gender ratio, or the mix of Catholics and Protestants as the reason for the observed pattern, concluded that there is no immediate explanation for the phenomenon.
Historian Lynne Marks (2007), noting the circumstances of the settlement of the Canadian Pacific coast, asserts that British Columbia was born secular. There is also a compatible literature surrounding the resource extraction-based settlements in the western regions of North America and how the skewed gender ratio and the absence of social institutions such as religion shaped the distinctive, rather secular, culture of these regions (Aldrich, 2004; Johnson, 2000; Mann, 1982). But, in contradiction with the assumption of the secularity of the Canadian west, the degree of religious involvement of the affiliated is noticeably higher in this part of the country than those observed in the eastern and central provinces (Dilmaghani, 2017b; Van Die, 2001; Wilkins-Laflamme, 2014; 2017). This rather vividly debated pattern has been taken as a sign of religious polarization in Canada (Bibby, 2011; Reimer, 2017; Wilkins-Laflamme, 2014).
A few other Western countries have been reported to have comparably ‘polarized’ religious landscapes (Achterberg et al., 2009; Kaufmann et al., 2012; Ribberink et al., 2013; 2018). In the context of Western countries, the polarization hypothesis refers to the pattern in which religious decline is accompanied with the stabilization in size of a cluster of actively religious individuals (Martin, 1978; 2005). As such, the fall in the average religiosity figures is fuelled by a fall in religious involvement of those in the religious middle ground. While religious polarization as a characterization is gaining empirical support, it is not by itself an explanation for the observed patterns. The religious free-riding model of Iannaccone (1992; 1994) demonstrates that the exclusion of nominal or low commitment affiliates, considered free-riders, leads to a greater involvement of the remaining members. The exclusion of the free-riders strengthens a religious organization by increasing the average quality of the religious commodity they supply. This increased quality in turn fuels the engagement of the remaining members. While this model was devised to explain the rise of Conservative denominations in face of the decline of the moderate ones in the United States (Kelley, 1972), it may also have some relevance to the current patterns of the persistence of a high commitment cluster in face of a general religious decline.
The present article uses multiple cycles of the Canadian General Social Survey from 1985 to 2011 to critically examine the reported polarization of the Canadian religious landscape, and its possible link with free-rider exclusion framework. After establishing the robustness of the regional discrepancies in religiosity patterns in Canada, the concept of religious polarization is quantified to measure its relative importance across Canadian provinces. The present study then examines whether the exclusion of free-riders through unaffiliation plays a role in shaping the observed patterns. The remainder of this article is organized as follows. Section 2 is devoted to a brief review of the literature. Data and descriptive statistics are presented in Section 3. Section 4 lays out the methodology. Section 5 reports the results. The concluding remarks follow.
Literature review
In Canada, the share of those who report no affiliation with organized religion in the surveys, has grown from under 7% in the 1970s to significantly above 20% in the 2010s (Beyer, 1997; O’Toole, 2000; Wilkins-Laflamme, 2015). About half of the unaffiliated Canadians have no tie with either religion or spirituality, even in a private manner (Dilmaghani, 2017a). In Canada, affiliation with Catholicism, most prevalent in Québec, has been much more stable than Protestant affiliation. A sharp decline in affiliation with the five main Protestant denominations of Canada (the United Church, Anglican, Presbyterian, Baptist, and Lutheran) has been reported (Clarke and Macdonald, 2011). Bibby (2007) attributes the stability of Catholic identity in Québec to the particular stance of Québecers towards religion in which they keep the parts of religion that they like, and reject the rest.
The rise in the number of Canadian nones has been accompanied by a more than proportionate fall in religious attendance rates. Eagle (2011) reports that the Canadian religious attendance rates have declined by about 20% from 1986 to 2008. The francophone province of Québec in which 24% of the population resides stands out for its greater trends of religious attendance decline (Bibby et al., 2007; Eagle, 2011). More recently, Dilmaghani (2017a) reports that around 45% of Canadians claim that never attend religious services. The low rate of religious service attendance in Canada is all the more remarkable in light of the well-documented over-reporting of church attendance rates in the country (Brenner, 2012).
In the past couple of decades, several conflicting characterizations have been offered to describe the Canadian religious landscape. Bibby (2002; 2004) noted the emergence of an upward trend in the weekly religious attendance rates in the late 20th century and early 2000s, which he interpreted as a religious renaissance. Thiessen and Dawson (2008) criticized the religious renaissance thesis and asserted that the extant evidence is indicative of a continued preference for private spirituality, rather than the revival of organized religion. Some scholars believe that the religiosity patterns in Canada correspond to a classic version of secularization (Eagle, 2011; Hay, 2014; Thiessen, 2012; 2015). In 2011, Bibby put forth a new characterization, religious polarization, arguing that a fairly stable core of Canadians seem to retain their ties with organized religion, in face of the growth of the unaffiliated (Bibby, 2011).
The debate on the religious polarization in Canada continued with Wilkins-Laflamme (2014; 2017) and Reimer (2017). In Wilkins-Laflamme (2014; 2017), the polarization hypothesis refers to a later stage in the secularization process where religious decline is accompanied with the stabilization in size of a cluster of actively religious individuals as theocratized by Martin (1978; 2005). As such, the fall in average religiosity figures is fuelled by a fall in religious involvement of those in the religious middle ground. A long history of secularization is a requirement for this pattern. Conversely, Reimer (2017) asserts that the evidence for religious polarization is weak, if Canada as a whole is considered. Also examining ideological polarization, Reimer (2017) reports that there is no sign of increased conservatism among Canadian conservative Protestants.
In any case, religious polarization is rather a characterization than an explanation for these emerging patterns. As a characterization, religious polarization presents commonalities with the religious trends reported in Kelly (1972). In the 1970s, Kelley (1972; 1978) noted the concomitant decline of the mainline and the thriving of the strict denominations in the United States. The secularization thesis was incompatible with these contradictory patterns. Iannaccone (1992) attempted to explain them with his free-riding exclusion model. Iannaccone (1992) conceived religious organizations as means of the collective production of a religious output and asserted that the nominal ‘free-riding’ members drive down the average quality of the religious output and consequently the appeal of the group. Free-riding is an established pattern when it comes to non-excludable public goods. Iannaccone argues that most of the services provided by religious organizations are akin to non-excludable public goods. For instance, the pleasure derived from Sunday services by a churchgoer depends on his or her own attendance but also on how many others attend, how deep their commitments are, and so forth (Iannaccone, 1992; 1994; Iannaccone et al., 1995).
Iannaccone’s contribution generated a sustained research following and numerous empirical verifications (Dilmaghani, 2017c; McBride, 2007; 2015). There are empirical studies that support the model. In these studies, free-rider exclusion is operationalized by the degree of the strictness of a religious group, assuming that strictness acts as a screening (Iannaccone, 1994). Hoge (1996) found that strict churches, more likely to have excluded the free-riders, receive a higher average contribution from their members. Sherkat and Ellison (1999) attested that both survey data and denominational statistics support marginal growth of highly strict religious groups, such as Jehovah’s Witnesses. Olson and Perl (2001) found that between denominations, strictness is strongly correlated with several important measures of member involvement. Iannaccone’s thesis has motivated criticism as well (Roozen and Hadaway, 1993; Marwell, 1996). For instance, some scholars question the validity of Iannaccone’s thesis in face of the growing strength of megachurches where many among the members qualify as free-riders (Brewer et al., 2006; Perrin and Mauss, 1993; Thumma and Travis, 2007; Von der Ruhr and Daniels, 2012). McBride (2007; 2015) asserted that the Mormon Church, a strict religious group with a high member involvement, does not exclude potential or actual free riders.
Thus far overlooked in the scholarship, there is a parallel between the trends reported in Kelley (1972; 1978), Iannaccone’s free-rider exclusion model (1992; 1994), and the recent reports of religious polarization in the West. The parallel becomes more evident if the denominational variations are ignored and the focus is shifted to the degree of religiosity. In Canada and most Western European countries for which patterns congruent with religious polarization are reported, denominational variation is much smaller than in the United States (Greeley, 2017; Hamberg and Patterson, 1994; McBride, 2010). The free-rider exclusion model is explicit in stating that only strict denominations manage to exclude free-riders and by virtue of this exclusion, they attain a greater vibrancy than mainline denominations. Abstracting from denominational differences, the outcome of free-rider exclusion is not incompatible with religious polarization. The positive effect of free-rider exclusion on the engagement of the remaining members appears valid, regardless of how this exclusion is achieved. If the nominal, free-riding members relinquish their affiliation by their own volition, as it is the case in Canada and many Western European countries, their exit should exercise a positive effect on the engagement of others. Assuming that the level of free-rider exclusion is reflected in the share of those who report no religious affiliation, the present article examines this strand of literature as a potential explanation for the Canadian religiosity patterns.
Data and descriptive statistics
The first part of the analysis is conducted using the General Social Survey of 2011 (GSS, 2011). There are four questions in the GSS-2011 that explicitly deal with religion. First, religious affiliation of the respondents is surveyed. The three other religious questions of GSS-2011 invite the respondents to (i) rank the importance of their religious or spiritual beliefs to their way of life, from 1 for very important to 4 for not important at all (termed belief); (ii) report their frequency of religious or spiritual practice on their own (termed prayer); (iii) report their frequency of religious service attendance. For the two religious practice questions, the first GSS-2011 category pertains to a frequency of at least 52 times a year, while in the second category it falls to monthly attendance, and from there to 3 times a year. This non-linearity is corrected using the approach proposed by Sander (2002). 1 To create a comparable range of variation for the ‘belief’ question, its 4 response categories are rescaled so that this metric also varies between 0 and 52. 2 An indicator of overall degree of religious commitment, the Composite Religiosity Index (CRI), is constructed by adding the rescaled individual scores of these three questions. This index is grounded in the scholarship that asserts multiple dimensions of religion (Clark and Schellenberg, 2006; Voas, 2009).
The variables used in this article are defined in Table 1, and the descriptive statistics are shown in Table 2. The missing observations, minimal except for the income question, are dealt with through listwise deletion. The missing income data are rather considerable at 12%. But, the mean income computed after applying the survey weights did not differ much from the official reports of Statistics Canada for year 2011. In addition, several previous studies have used the GSS in wage comparisons (Dilmaghani, 2017b; Mueller, 2014). Hence, the missing income data are assumed ‘missing at random,’ and are also dealt with through listwise deletion (Allison, 2001).
As shown in Table 2, nones constitute about 22% of the sample. Their share varies broadly across Canada, from 7% in the eastern province of Newfoundland to above 41% in the western province of British Columbia. Religious nones typically score relatively low on all religious intensity metrics, but their involvement is not 0. Religious intensity varies significantly across Canada as well, although not as widely as unaffiliation rates. Among different dimensions of religiosity, the salience of religious belief has the highest mean score, invariably across Canadian provinces. The scores on prayer are lower than that of the belief dimension, but they are measurably higher than the mean attendance scores for all provinces.
Figure 1 plots the metric of the overall degree of religious intensity (CRI) against unaffiliation rates, using provincial means. The ordering that emerges from the share of nones appears to almost perfectly coincide with an east to west ordering of the Canadian provinces. Religious intensity of the affiliated appears to be increasing as the presence of nones strengthens in the provinces. The Pacific coast province of British Columbia has an unaffiliation rate almost twice as high as the Canadian average and a comparably high religious intensity among its affiliated. The francophone province of Québec, appears to be an outlier, exhibiting by far the lowest religious intensity. These provincial variations have been the basis of polarization characterization of the Canadian religious landscape (Wilkins-Laflamme, 2014; 2017).
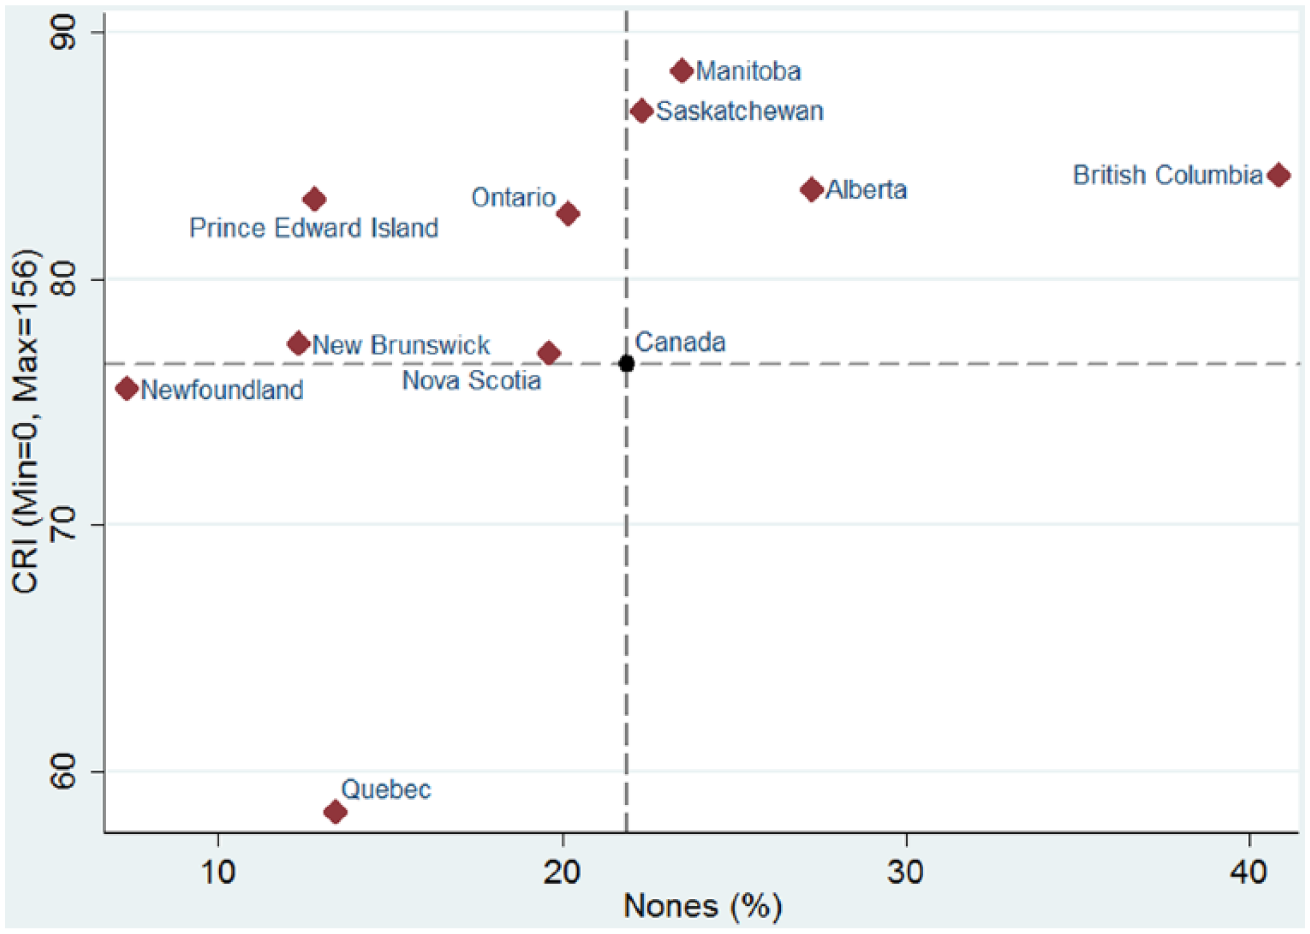
Religious Affiliation Status and Religious Intensity across Canadian Provinces.
To gain insight about the polarization hypothesis, two discrete categories of ‘strictly secular’ and ‘very religious’ are defined. The ‘very religious’ refers to those who score the maximum possible on the CRI. Hence, a ‘very religious’ individual attends religious services at least once a week, engages in individual religious or spiritual activities at least once a week, and considers religion or spirituality very important in life. As reported in Table 2, they constitute just below 14% of the sample. The ‘strictly secular’ refers to the respondents with a CRI score of 0. A ‘strictly secular’ individual places no importance on religion or spirituality in her life, and never engages in religious or spiritual practices on her own or with others. Strictly seculars constitute just below 13% of the sample. Only 38% of Canadian nones are ‘strictly secular.’ Using these two identifiers standing as polar opposites, and the rest of the population forming another group, the sample is divided into three segments. As explained in the next section, this classification is used to compute fragmentation and polarization indices for all Canadian provinces.
The second part of the analysis uses 12 cycles of the Canadian GSS from 1985 to 2011. There are 3 years or less intervals between two consecutive cycles employed. The older cycles of the Canadian GSS have routinely excluded religious nones from their religious intensity questions, under the assumption of their absence of involvement. As shown in Table 2 and reported in Wilkins-Laflamme (2015), this assumption is largely inaccurate. This exclusion makes it impossible to use the definitions proposed for strictly secular and very religious for these GSS cycles. Hence, an alternative classification is used to divide the population into three segments. A ‘Most Religious’ group pertains to the affiliates who attend religious services weekly. The ‘Least Religious,’ on the other hand, either self-report of no religious affiliation or they are affiliates who never attend religious services. The remainder of the population forms the third group. Figure 2 plots the share of these 3 groups from 1985 to 2011 for all Canadian provinces, Canada as a whole excluding immigrants, and immigrants regardless of their province of residence.
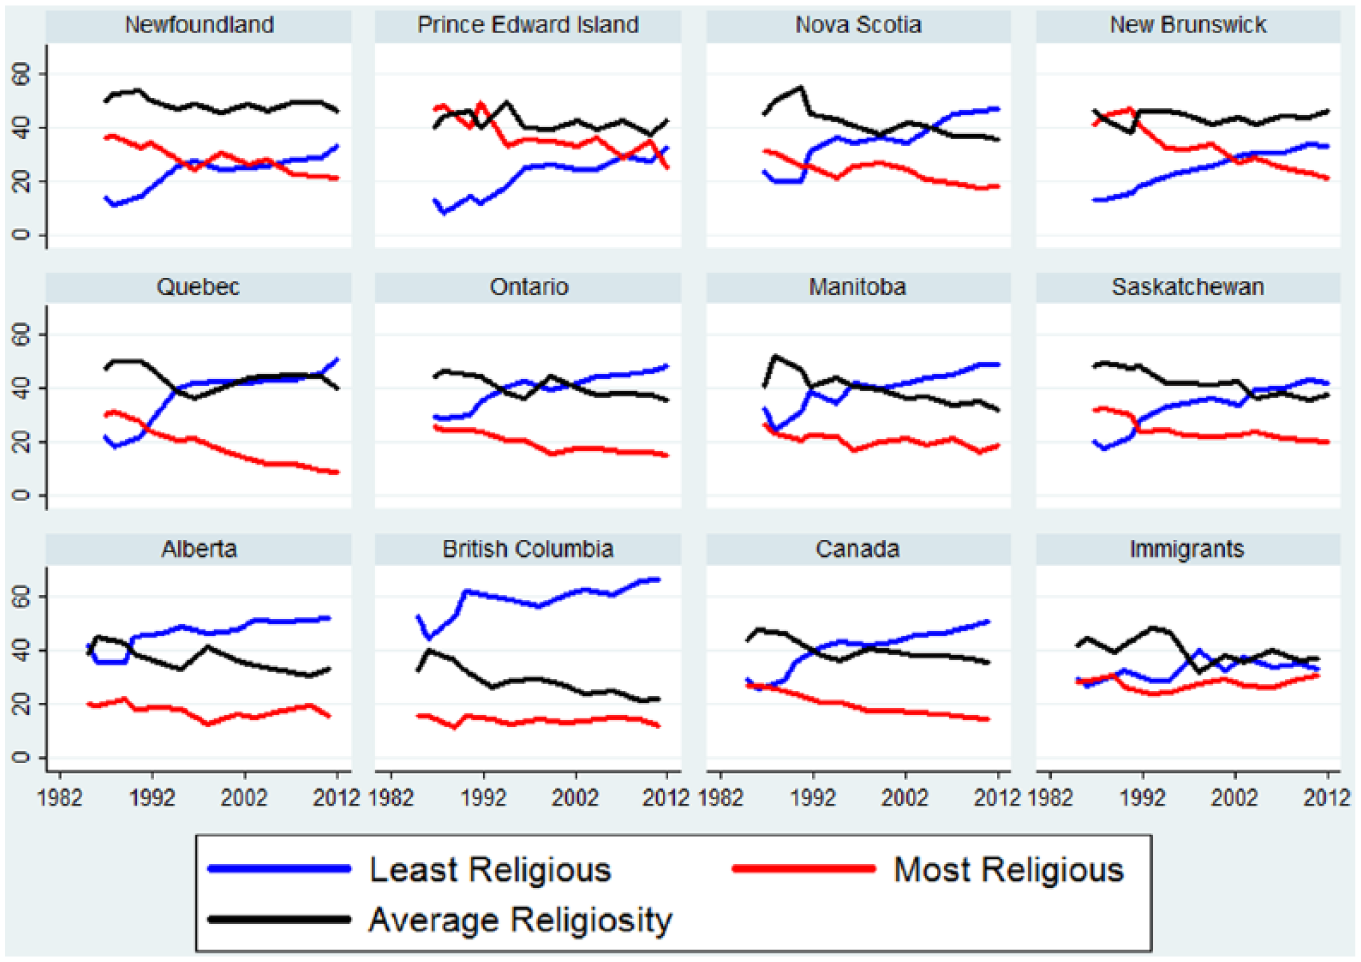
Religiosity Trends across Canadian Provinces, 1985–2011.
Figure 3 shows the linear fits to the time series depicted in Figure 2. As Figure 3 demonstrates, the share of Least Religious is uniformly increasing in all Canadian provinces and the slopes are largely comparable. This uniform rise seems to be more strongly at the expense of the Most Religious in Newfoundland, Prince Edward Island, New Brunswick, and Québec. For Nova Scotia, Ontario and Saskatchewan, the rise in the share of Least Religious is fuelled almost equally by the declines of Most Religious and those with Average Religiosity. In British Columbia, Alberta, and Manitoba, however, the share of Most Religious is relatively stable, while the Least Religious rises at the expense of the individuals with Average Religiosity. Figure 4 plots the quadratic fits to the same data. The figures show that the projected minimums for the Most Religious are non-zero and seem to be identical for all provinces, except for Québec. For Québec, the projected minimum for the Most Religious appears to be the lowest, while the maximum projected for the Least Religious will likely surpass other provinces.
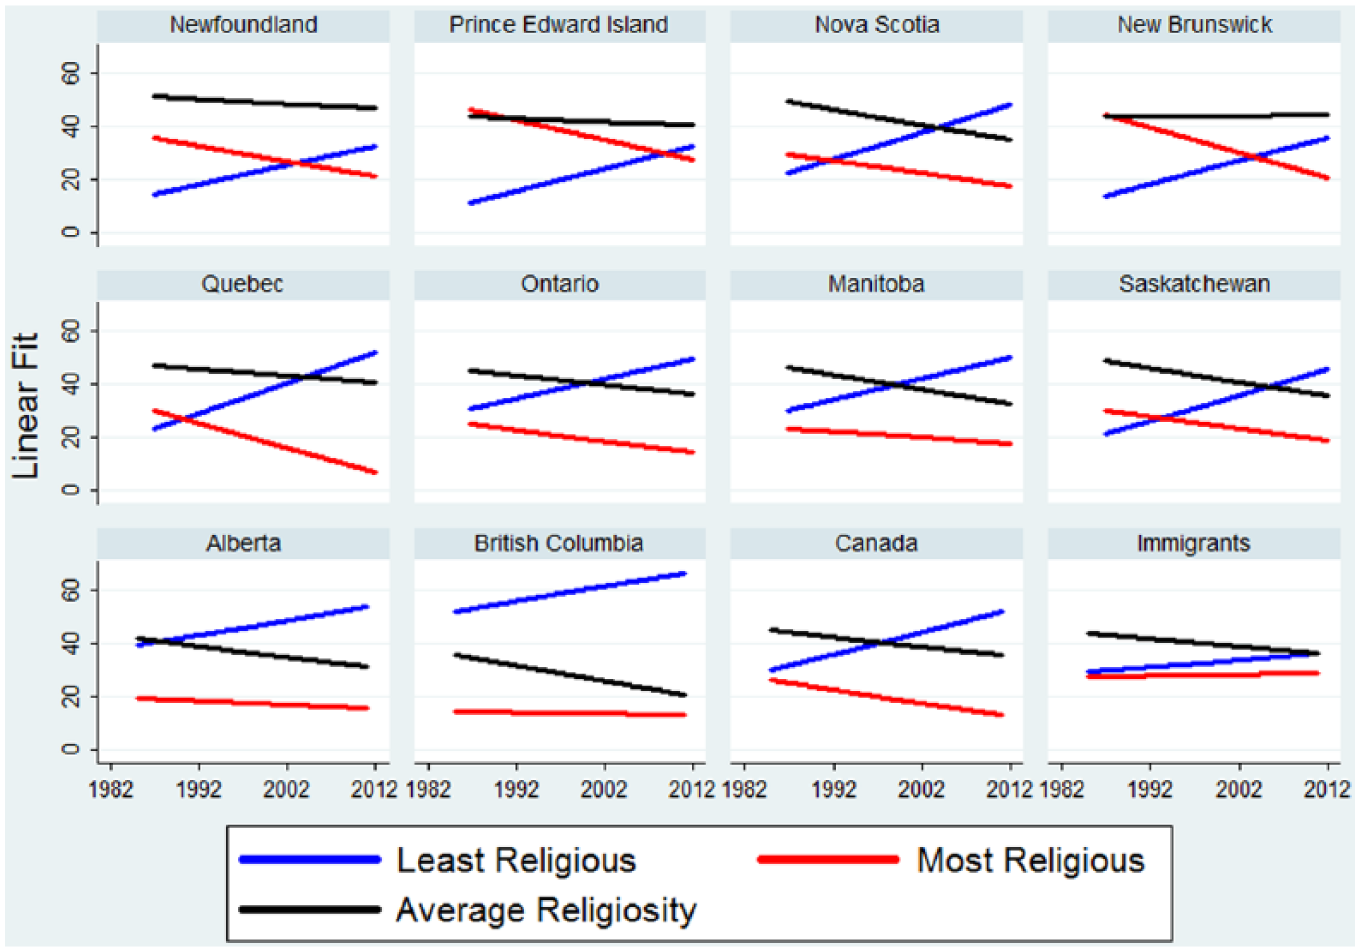
Linear Fit of Religiosity Trends across Canadian Provinces, 1985–2011.
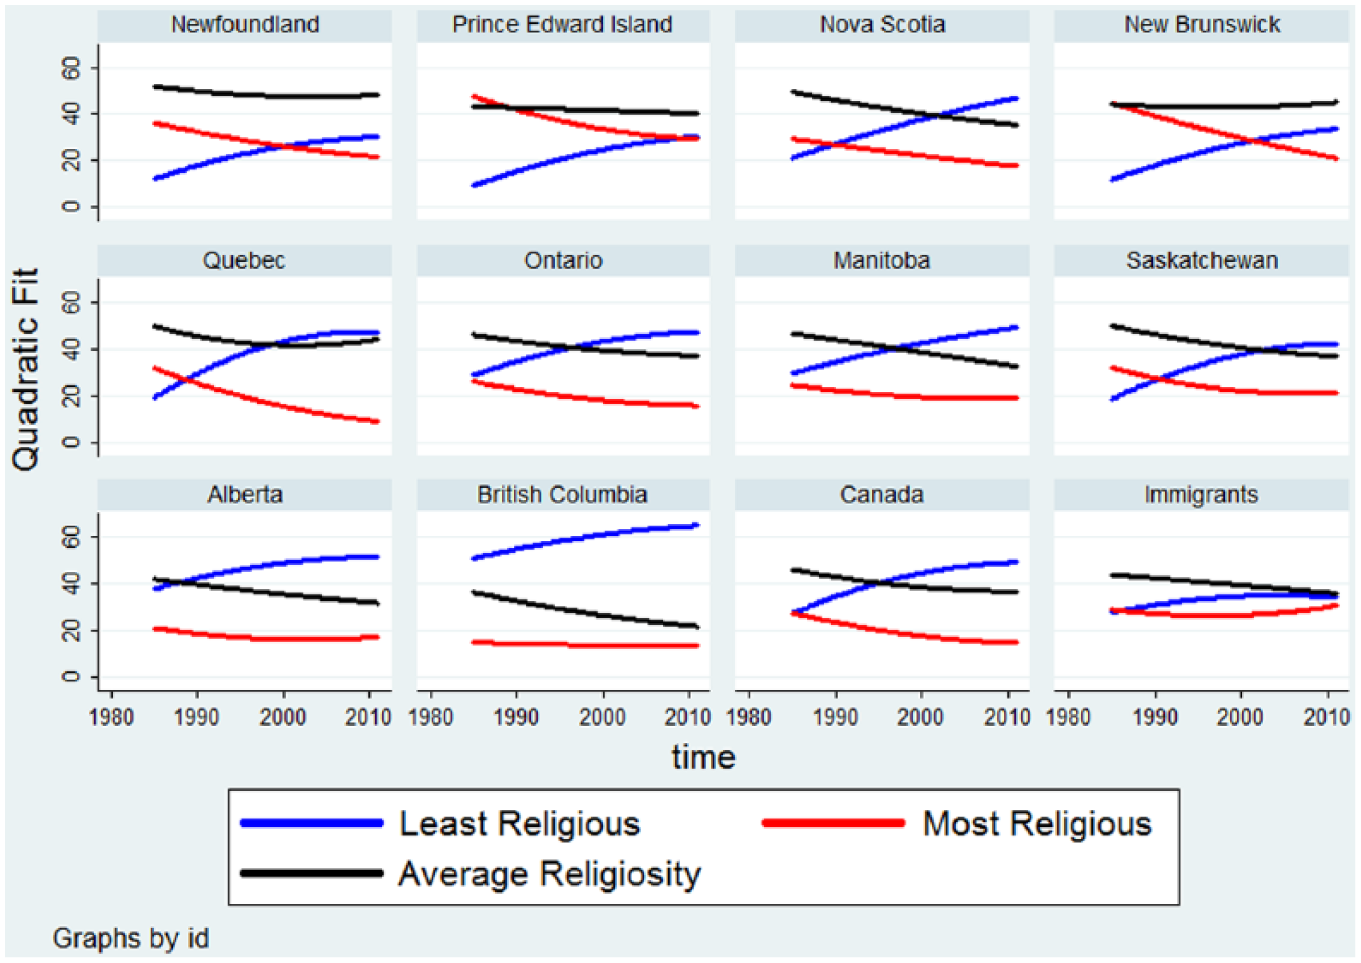
Quadratic Fit of Religiosity Trends across Canadian Provinces, 1985–2011.
Additionally, using the GSS data of 1985 to 2011, the provincial means of religiosity indicators, age, and the percentage share of females and seniors are computed. Then, a panel dataset in which the Canadian provinces are the unit of observation and are followed from 1985 to 2011 is constructed. The panel is used in a multivariate regression to examine whether the share of religious nones has a positive association with the share of ‘Most Religious.’ This investigation produces evidence for or against the religious free-riding framework of Iannaccone (1992).
Methodology
The first set of regressions, focused on affiliation status, assesses whether the provincial patterns are robust to the inclusion of other determinants of religiosity:

The variable None is a dummy taking the value of 1 for the respondents of no religious affiliation. The variables denoted by
The equation set to assess the correlates of religious intensity is as follows:

The left hand side variable is the natural logarithm of the Composite Religiosity Index (CRI). The set of controls is identical to those employed for Equation (1). For this equation, the appropriate estimation methodology is OLS. Since the GSS data are collected as probability samples of the population collected by Statistics Canada (Statistics Canada, 2017), the required assumptions of the estimation methods are assumed to be satisfied.
The recent contributions which evoke the emergence of a religious polarization in Canada base their conclusions on the persistent growth of nones and the relative stability of the share of highly religious without employing a reference numeric scale. It is however useful to have a quantitative measure for the degree of polarization (Esteban and Ray, 1999). Accordingly, a religious fragmentation index is computed following Collier and Hoeffler (2000):

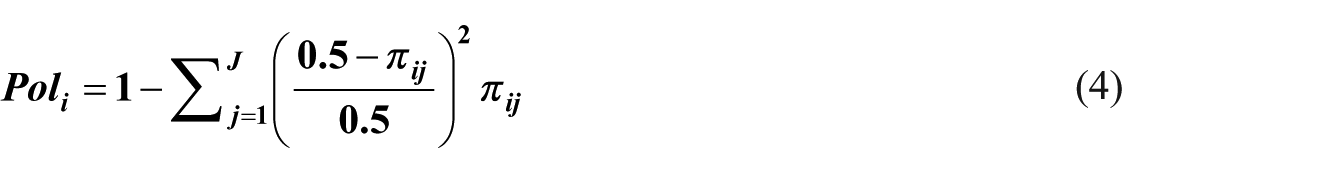
Additionally, a religious polarization index is computed, as proposed by Montalvo and Reynal-Querol (2003):
Finally, to produce evidence for or against the religious free-riding model of Iannaccone (1992), the linear regression model below is fitted to the panel data:

The subscript
Results
Table 3 shows a set of six Probit regressions in accord with the specification proposed in Equation (1). The dependent variable is a dummy taking the value of 1 for the religiously unaffiliated and 0 otherwise. Extra explanatory variables are gradually added to the equations, starting with the unique regressors of dummies for province of residence. The omitted category is Ontario, the most populated province. In Column (2), demographic variables, such as gender, age and marital status are added to the regression. In Column (3), human capital variables, such as years of schooling and having a university degree, are included. Column (4) further adds immigration and ethnic background. Column (5) includes socioeconomic variables such as labour market status and occupational class. The respondent’s income is only added in Column (6), to make sure that the large number of missing data does not cause major changes in the coefficients. This set of regressions shows whether the provincial discrepancies are impervious to the inclusion of explanatory variables other than the province of residence.
As the top panel of Table 3 shows, the provincial differences in unaffiliation rates are largely impervious to the inclusion of the control variables. According to Column (6) in which all the controls are included, respondents residing in Newfoundland, Prince Edward Island, New Brunswick and Québec are 13.9%, 9.8%, 10.1%, and 10.4% less likely to be unaffiliated, compared with the residents of Ontario. On the other hand, the residents of Alberta and British Columbia are 4.7% and 20.3% more likely than Ontarians to be unaffiliated.
Regarding the controls, married respondents are found to be less likely than singles to be religiously unaffiliated. The number of children is also a negative predictor of the outcome. Having a university degree is a positive predictor of unaffiliation only for women, congruent with the US pattern (Schnabel, 2015; Baker and Whitehead, 2016). Visible minorities and non-native speakers of the official languages of Canada (English and French) are less likely to be unaffiliated. Controlling for visible minority status and mother tongue, being an immigrant and having foreign-born parents are not statistically significantly related to the outcome. Labour market variables, such as being a public-servant and a unionized worker, turn up with statistically insignificant coefficients. The coefficient for income is also statistically insignificant.
Two important conclusions can be drawn from Table 3. First, much like for the United States (Baker and Smith, 2009; Cimino and Smith, 2014; Kosmin et al., 2009), Canadian nones do not greatly differ from the general population in socioeconomic characteristics such as income and education. Second, the province of residence, more strongly than any other attribute, predicts the affiliation status in Canada.
Table 4 reports the results of the OLS estimation of Equation (2). The sample is restricted to the affiliated respondents. The dependent variable is the natural logarithm of the CRI. As such, the coefficients signify percentage changes. Here too, all the controls are gradually added to the equation. However, the controls are supressed in the table to save space. The full set of result is available upon request. As the last column of Table 4 shows, in the high affiliation province of Québec, the degree of religious commitment is 44.5% below that of Ontario, indicating that a large portion of Québec affiliates are nominal. The same holds for Newfoundland, a high affiliation province. For the low affiliation provinces of the west, the affiliates are more religious than those residing in Ontario, except for British Columbia. For British Columbia, the coefficient is not statistically significant, indicating the same degree of religious intensity as prevailing in Ontario. An extrapolation from the share of nones, 41% in British Columbia and 20% in Ontario, would have largely suggested otherwise. Also, residence in Alberta, a low affiliation province, is found associated with about 21% higher degree of religiosity compared with Ontario. Overall, Table 4 indicates that the low affiliation rates of the Canadian west do not mean that the remaining affiliates are less committed to their religion and are likely to follow along.
Table 5 reports the Fragmentation and Polarization indices as proposed in Equations (3) and (4). Figures 5 and 6 provide visuals for this table. As the table shows, British Columbia and Manitoba have the highest scores in these indices, followed by Alberta. Based on Martin (1978; 2005), Wilkins-Laflamme (2014) only notes British Columbia and Alberta as polarized provinces of Canada. But, the indices computed here indicate that Manitoba is more polarized than Alberta. Martin (1978) surmises that polarization, a later stage in the secularization process, emerges in regions with a long history of religious decline. The finding regarding Manitoba seems to contradict Martin (1978) and Wilkins-Laflamme (2014); since, unlike Alberta and British Columbia, the presence of nones in Manitoba was not much stronger than the national average during the 1980s and the 1990s (Veevers, 1990).
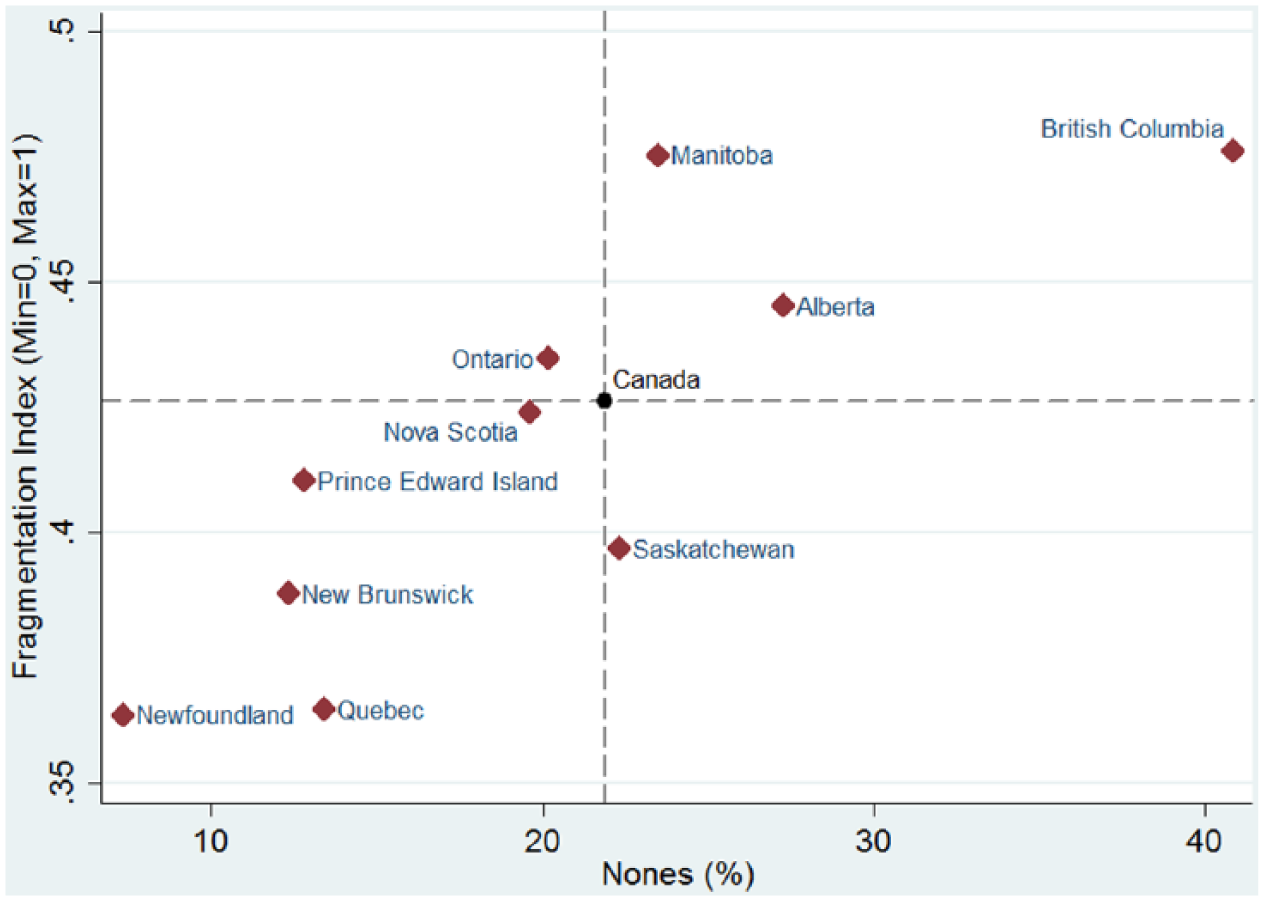
Religious Fragmentation Index across Canadian Provinces.
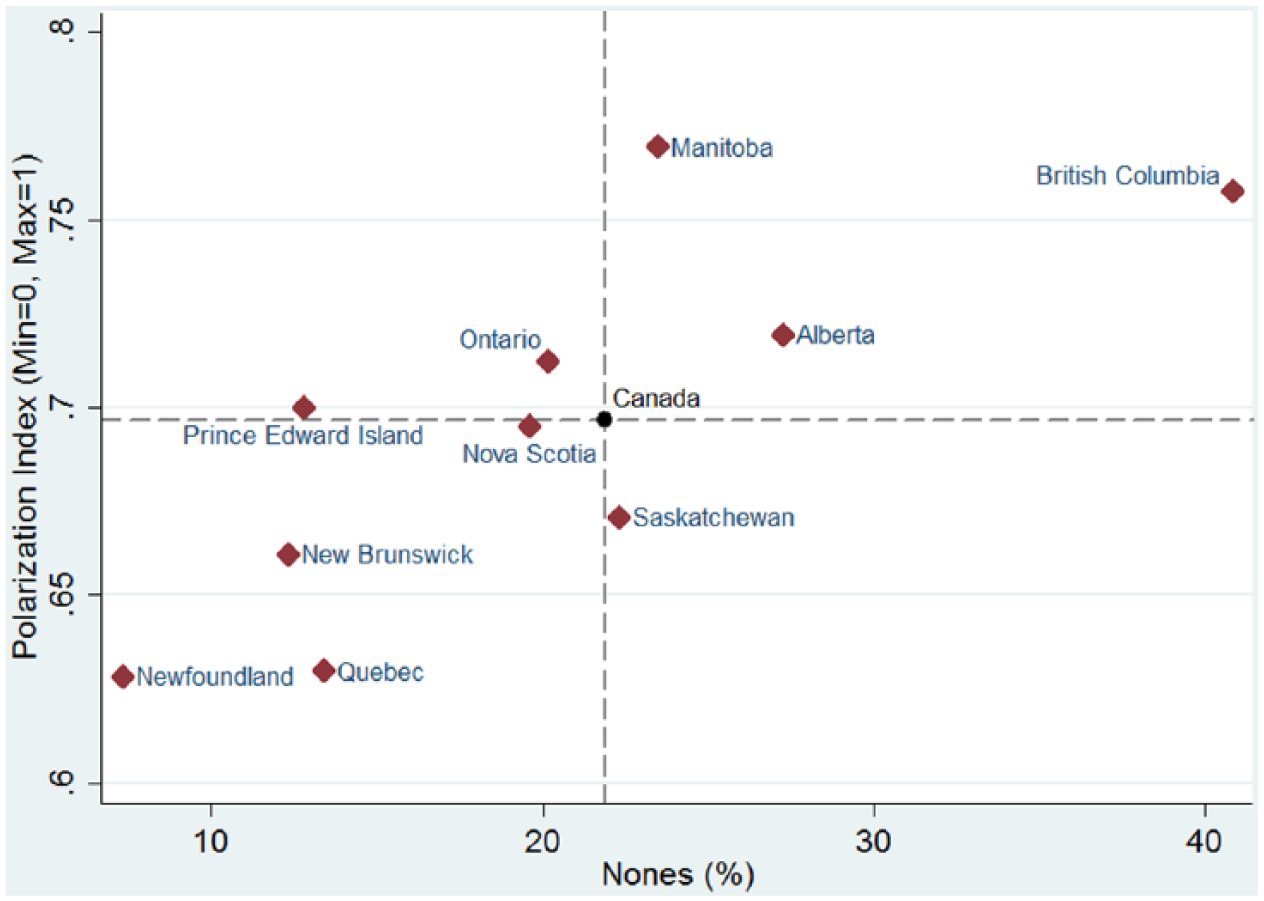
Religious Polarization Index across Canadian Provinces.
As previously explained, the empirical pattern of ‘polarization’ observed in various countries is also compatible with the religious free-riding model of Iannaccone (1992; 1994). According to this model, if less committed members are excluded from a religious group, the average quality of the religious good supplied by this group increases and this higher quality fuels a greater engagement in the remaining members. A corollary to this framework implies a direct relationship between the share of nones in a given province and the commitment of others.
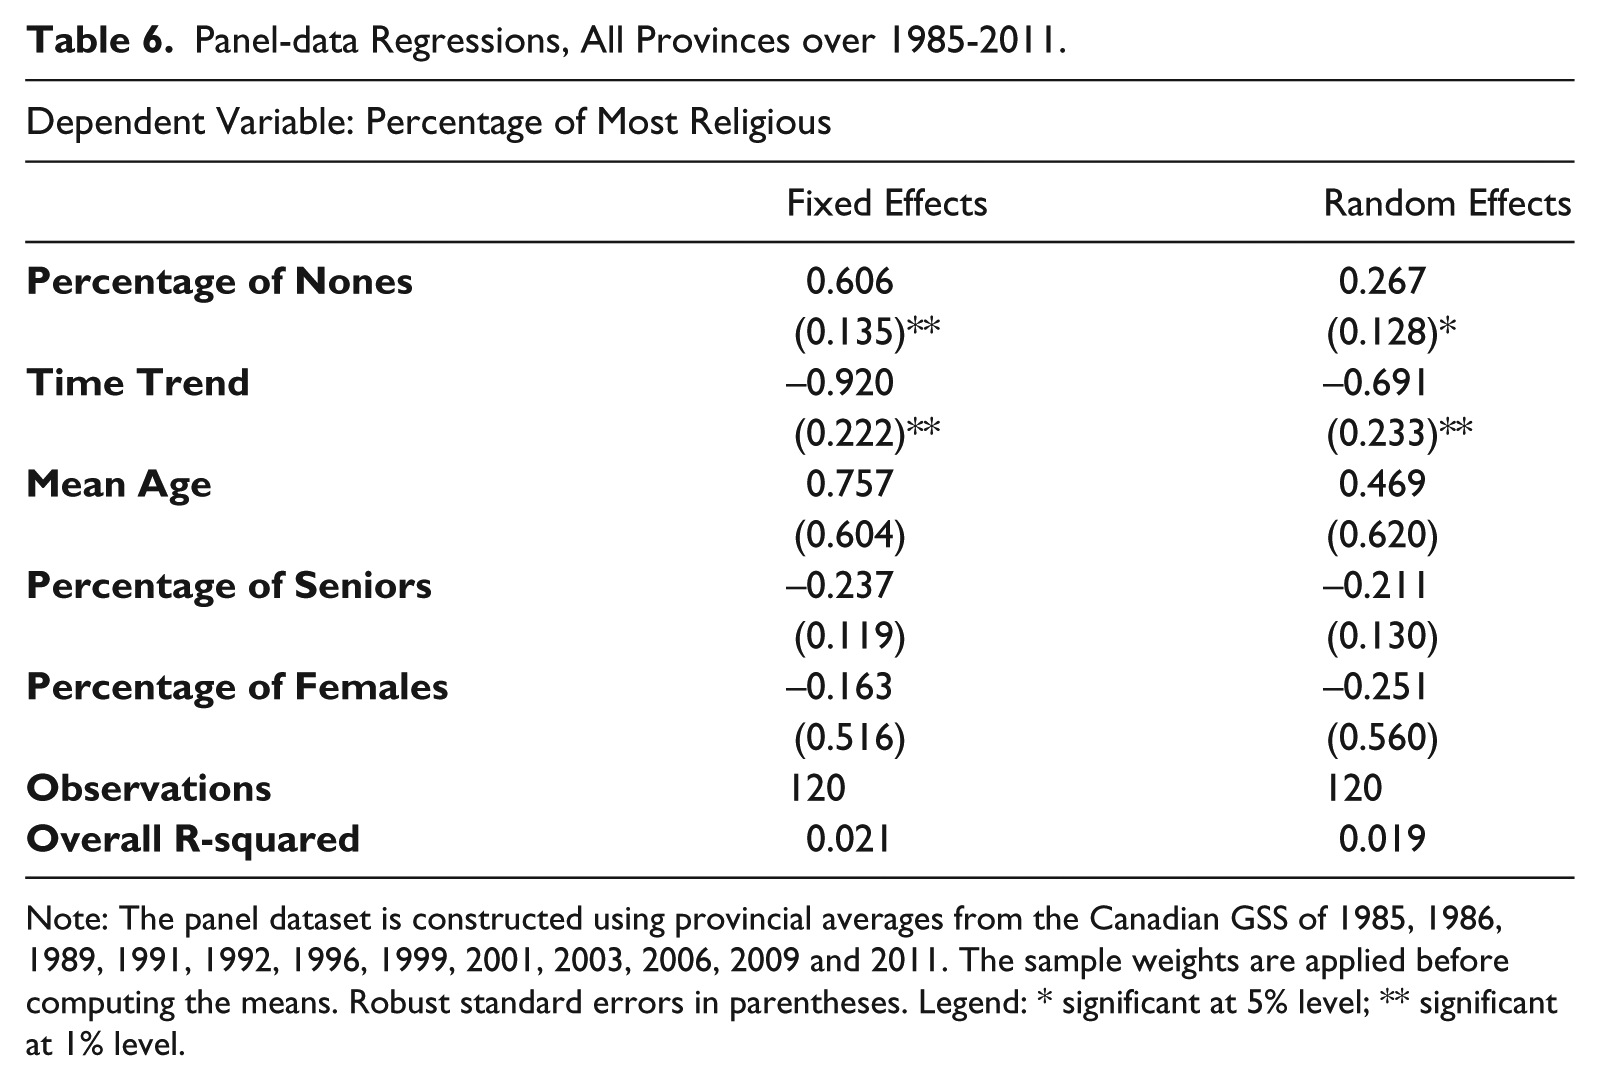
Table 6, using the panel dataset and the specification of Equation (5), tests whether the presence of religiously unaffiliated has a positive association with the share of the Most Religious. The dependent variable is the percentage of ‘Most Religious’ in a given province. The explanatory variables are the percentage of nones, average age, the percentages of seniors and females, as well as the time trend. Both Fixed Effect and Random Effect coefficients of the variable ‘Nones’ are statistically significant and positive. It suggests that an increase in the share of nones predicts an increase in the share of Most Religious, net of the effects of the controls (average age, share of females and seniors, and the time trend). A Hausman (1978) specification test indicates that the Fixed Effect model, which returns the larger coefficient, is more appropriate. Hence, the results reported in Table 6 produce some support for the religious free-riding model of Iannaccone.
The limitations of this analysis must be noted. First, in this study, it remained impossible to gauge the direction of causality. In general, establishing the direction of causation has nontrivial data requirement. Its implementation to test the religious free-riding model is particularly challenging. Most previous studies have only assessed correlations, and have operationalized the free-riding exclusion using proxies such as church strictness. The approach taken here is similar as it does not produce evidence on the direction of causality and uses a proxy for free-rider exclusion. More precisely, the level of free-rider exclusion is proxied here by the share of those who report no religious affiliation. Also, using a province level panel dataset is not ideal. Data broken down to the district level could provide more compelling evidence. But, the GSS microdata files did not allow this approach. Another limitation relates to the control variables that could be included in the regressions. One important omitted variable is political leaning. According to Hout and Fischer (2002; 2014), many Americans who disagree with the religious right regarding polarizing issues, such as abortion and same-sex marriage, state no religious affiliation in the surveys. But, they retain private ties with religion. Since this pattern likely has some relevance to Canada as well, datasets allowing to differentiate these non-affiliates from others could provide more accurate estimates.
Discussion and conclusion
The contributions of this article to the literature is threefold. First, the analysis confirmed the robustness of the provincial discrepancies in the presence of religious nones in Canada. Likewise, the higher religiosity of the affiliates in the Canadian west is demonstrated to be robust to the inclusion of controls. Third, quantifying the concept of polarization, three provinces of British Columbia, Manitoba, and Alberta were found to be more polarized than the rest of the country. Finally, the analysis showed a positive relationship between the presence of nones and the religiosity of the affiliates across Canada.
The persistent and robust provincial discrepancies in unaffiliation rates are best explained by the cultural particularity of each province. Affiliation with the Roman Catholic Church is part of collective identity and social capital in Québec, a linguistic minority seeking to preserve its difference from the English-speaking and mainly Protestant rest of Canada. Atlantic Canada is characterized by its longer history of settlement, lower population density, and a weaker presence of immigrants. All these characteristics point to a stronger role for traditions, making religious disaffiliation less common (Martin, 1978, 2005). The protracted pattern of a greater presence of nones in the west may be an indicative of lowered social bonds in this region of Canada (Putnam and Campbell, 2010). It is also compatible with some historical studies of the western settlements (Marks, 2001; 2007). Nonetheless, as the religious intensity of the affiliated is demonstrated to be higher in the low affiliation provinces of the west than in the high affiliation, eastern provinces, the regional distribution of nones cannot be interpreted as an outright religious decline, even for British Columbia. This previously debated pattern (Bibby, 2011; Reimer, 2017; Wilkins-Laflamme, 2014; 2017) is suggestive of polarization.
The concept of religious polarization is one of the newest developments in the scientific study of religion in the Western world (Achterberg et al., 2009; Kaufmann et al., 2012; Ribberink et al., 2013; 2018). Based on Martin (1978), Wilkins-Laflamme (2014; 2017) reports evidence of religious polarization in Canada. Conversely, Reimer (2017) is critical of religious polarization characterization and finds only weak evidence for it. The analysis conducted in this article aimed at a relative ranking of the degree of polarization across Canada, rather than an absolute and binary characterization. The analysis returned higher polarization indices for British Columbia, Manitoba, and Alberta, in that order. Manitoba does not have a long history of secularization, as required by Martin’s thesis. Hence, the analysis conducted in this article indicates that factors other than those previously noted (Wilkins-Laflamme, 2014; 2017) need to be considered to fully explain the patterns. With the greater intergenerational transmission of religious values and the higher fertilities of the religious (Dilmaghani, 2018; Kaufmann et al., 2012), it is possible that the size of the actively religious core remains stable. This demographic factor perhaps had played a role in the emerging polarization of the Canadian religious landscape.
The higher religious intensity of the affiliated in the high unaffiliation provinces is also compatible with the premise that the exit of nominal members fuels the commitment of the remaining members. This interpretation is not far from the religious free-riding model of Iannaccone (1992; 1994). The analysis of the province-level panel dataset returned a statistically significant and positive association between religious unaffiliation and the share of the most religious, producing some support for this model. However, as previously noted, conclusive empirical evidence for the theoretical contribution of Iannaccone is not easy to produce, with the type of data currently available. In sum, this study illustrates that both an accurate characterization and a complete explanation are currently lacking for the Canadian religious landscape. The need for further research is also underscored by the evolving nature of the documented patterns.
Footnotes
Annex 1: Tables
Panel-data Regressions, All Provinces over 1985-2011.
| Dependent Variable: Percentage of Most Religious |
||
|---|---|---|
| Fixed Effects | Random Effects | |
|
|
0.606 | 0.267 |
| (0.135)** | (0.128)* | |
|
|
−0.920 | −0.691 |
| (0.222)** | (0.233)** | |
|
|
0.757 | 0.469 |
| (0.604) | (0.620) | |
|
|
−0.237 | −0.211 |
| (0.119) | (0.130) | |
|
|
−0.163 | −0.251 |
| (0.516) | (0.560) | |
|
|
120 | 120 |
|
|
0.021 | 0.019 |
Note: The panel dataset is constructed using provincial averages from the Canadian GSS of 1985, 1986, 1989, 1991, 1992, 1996, 1999, 2001, 2003, 2006, 2009 and 2011. The sample weights are applied before computing the means. Robust standard errors in parentheses. Legend: * significant at 5% level; ** significant at 1% level.
Funding
This research received no specific grant from any funding agency in the public, commercial, or not-for-profit sectors.
Notes
Author biography
Address: Sobey School of Business, Saint Mary’s University, 903 Robie St, Halifax, NS B3H 3C3, Canada.
Email: