
Abstract
Objective
To investigate the associations of baseline serum lactate level, lactate quartiles, and lactate trajectories with 30-day mortality in critically ill adults with acute kidney injury (AKI) and delirium.
Methods
Data were extracted from the Medical Information Mart for Intensive Care IV (MIMIC-IV) database. Adult patients admitted to the intensive care unit (ICU) with concurrent AKI and delirium were included. Lactate levels over the first 72 hours were analyzed using group-based trajectory modeling. In parallel, baseline lactate levels were examined as a continuous variable and categorized into quartiles. The primary outcome was defined as 30-day mortality. Restricted cubic splines (RCS), multivariable Cox regression, and subgroup analyses were conducted to evaluate prognostic associations.
Results
RCS revealed a linear positive association between lactate levels and 30-day mortality. However, after adjusting for multiple confounders, baseline lactate alone was not independently associated with 30-day mortality. When categorized by quartiles, only the third quartile group was associated with higher mortality compared to the first quartile. In contrast, lactate trajectories demonstrated strong and consistent predictive value. Four distinct dynamic patterns were identified: low-stable, mildly elevated-decreasing, high-decreasing-rebound, and moderate-early rise-decline. Patients in the low-stable trajectory had the most favorable prognosis, while those with early elevation or fluctuating trends exhibited significantly higher mortality. Subgroup analyses confirmed the robustness of these associations across different comorbidities.
Conclusions
Dynamic lactate trajectories provide more robust prognostic information than baseline metrics, complementing the role of lactate in risk stratification and prognostic assessment for patients with AKI and delirium.
Keywords
1. Introduction
Acute kidney injury (AKI) is a common and serious complication among critically ill patients and represents a major contributor to intensive care unit (ICU) mortality and multi-organ dysfunction.1,2 Delirium, an acute and fluctuating disturbance of consciousness and cognition, is another frequent neuropsychiatric manifestation in the ICU. It reflects systemic inflammation, metabolic dysregulation, and cerebral dysfunction, and has been linked to prolonged ICU stay, increased short-term mortality, and long-term cognitive impairment.3,4 Notably, AKI and delirium frequently coexist in critically ill patients, with delirium reported in up to 60.1% of ICU patients with AKI. 5 Recent studies have further identified AKI as an independent predictor of delirium, even after adjustment for major clinical confounders. 6 A recent comprehensive meta-analysis further confirmed a significant bidirectional association between AKI and delirium, demonstrating that AKI substantially increases the risk of delirium in critically ill populations, while delirium may also contribute to adverse renal outcomes, 7 underscore the clinical importance of this dual pathology. The pathogenesis of AKI-associated delirium is multifactorial, involving systemic inflammation, accumulation of uremic toxins and drugs, altered fluid and electrolyte homeostasis, and neurohormonal dysregulation. 8 Their coexistence often indicated a state of profound metabolic derangement and systemic stress, accompanied by impaired organ recovery and poor outcomes. However, the metabolic signatures and reliable prognostic biomarkers of this complex clinical phenotype remain poorly understood.
Serum lactate, as a byproduct of anaerobic metabolism, serves as a sensitive indicator of tissue hypoperfusion and cellular oxygen imbalance. Elevated lactate levels are widely recognized as a marker of disease severity and poor prognosis in diverse critical illnesses, including sepsis, shock, and acute hepatic or renal injury.9–12 Despite extensive evidence linking hyperlactatemia to adverse outcomes in general ICU populations, few studies have specifically examined the prognostic significance of lactate in patients with concurrent AKI and delirium, a population characterized by both metabolic stress and neurological vulnerability. Whether lactate levels, as a static or dynamic biomarker, can effectively predict short-term mortality in this complex cohort remains uncertain.
Group-based trajectory modeling (GBTM) offers a novel statistical approach to explore heterogeneous longitudinal patterns of biomarkers over time. Unlike single-time-point or mean-value analyses, GBTM can identify latent subgroups of patients who share similar temporal trajectories, 13 thus revealing clinically relevant phenotypes that may otherwise be obscured by population averages. This method has been successfully applied in studies of sepsis, heart failure, and metabolic disorders to characterize biomarker dynamics and predict outcome.14–16 However, the application of lactate trajectory modeling in ICU patients with AKI and delirium has not yet been reported.
Therefore, this study aimed to comprehensively investigate the prognostic value of lactate indicators, including baseline lactate concentration, early lactate trajectories, and lactate quartiles, in ICU patients with AKI and delirium. Using a large, well-characterized cohort derived from the Medical Information Mart for Intensive Care IV (MIMIC-IV) database, we sought to (1) identify distinct dynamic trajectory of lactate change during the first 72 hours in ICU, (2) evaluate their associations with 30-day all-cause mortality, and (3) determine whether lactate-based metrics could provide incremental value for early risk stratification in this high-risk population.
2. Methods
2.1. Data source
The present investigation was based on the MIMIC-IV (version 3.1) database, an openly accessible resource jointly curated by the Massachusetts Institute of Technology (MIT) and Beth Israel Deaconess Medical Center (BIDMC). The authors obtained legitimate access after completing the official credentialing process through the Collaborative Institutional Training Initiative program (Record ID: 64595863). All records within MIMIC-IV have been rigorously de-identified in accordance with the Health Insurance Portability and Accountability Act regulations, ensuring the privacy and confidentiality of participants. Given that the dataset contains no directly identifiable patient information, the requirement for individual informed consent was waived. The database construction received institutional review approval from both MIT and BIDMC, and our secondary analysis of the anonymized data was deemed exempt from additional ethical oversight by our local review board. The study was conducted in full alignment with the ethical standards articulated in the Declaration of Helsinki of 1975, as revised in 2024. This study was reported following the STROBE statement. 17
2.2. Study design and population
This retrospective cohort study was designed to identify critically ill adults diagnosed with AKI from the MIMIC-IV database. The diagnosis of AKI was determined according to the Kidney Disease: Improving Global Outcomes (KDIGO) criteria, 18 which define AKI as meeting any of the following conditions: (1) an increase in serum creatinine by ≥0.3 mg/dL (26.5 μmol/L) within 48 hours; (2) a rise in serum creatinine to ≥1.5 times the baseline level known or presumed to have occurred within the prior seven days; or (3) urine output <0.5 mL/kg/h for at least six consecutive hours.
To identify patients with delirium, the Confusion Assessment Method for the Intensive Care Unit (CAM-ICU) was applied. 19 Delirium was considered present if patients exhibited both (1) acute onset or fluctuating mental status and (2) inattention, together with either (3) disorganized thinking or (4) altered level of consciousness, as evaluated by trained ICU staff in the original dataset.
Patients were excluded if they met any of the following criteria: (1) non-index ICU admissions; (2) ICU length of stay <72 hours; (3) age younger than 18 years or older than 100 years; or (4) missing lactate measurements on any of the first three ICU days. The detailed screening process for study enrollment is illustrated in Supplementary Figure 1.
2.3. Data extraction
Data were extracted from the MIMIC-IV database using Navicat Premium (version 16.3.2). Structured query language (SQL) scripts were developed to retrieve demographic characteristics, physiological variables, laboratory parameters, comorbidities, therapeutic interventions, and outcome indicators at the time of the initial ICU admission. The demographic included age, gender, race, and marital status. Anthropometric and vital signs collected at ICU entry comprised weight, height, heart rate, systolic, diastolic, and mean arterial pressure (SBP, DBP, and MBP), respiratory rate, and body temperature. Laboratory data encompassed hematologic and biochemical indicators: white blood cell count (WBC), differential leukocytes (basophils, eosinophils, lymphocytes, monocytes, neutrophils), hemoglobin, hematocrit, platelet count, red blood cell count (RBC), C-reactive protein (CRP), albumin, γ-glutamyl transpeptidase (GGT), alanine aminotransferase (ALT), alkaline phosphatase (ALP), aspartate aminotransferase (AST), total bilirubin, blood urea nitrogen (BUN), creatinine, lactate dehydrogenase (LDH), chloride, anion gap, calcium, potassium, sodium, glucose, D-dimer, fibrinogen, international normalized ratio (INR), prothrombin time (PT), partial thromboplastin time (PTT), oxygen saturation (SO2), lactate, bicarbonate, partial pressure of oxygen (PaO2), partial pressure of carbon dioxide (PaCO2), PaO2/FiO2 ratio, pH, and base excess. Preexisting comorbidities were identified from the diagnostic records and included myocardial infarction, congestive heart failure, cerebrovascular disease, chronic pulmonary disease, liver disease, diabetes mellitus, renal disease, malignant tumor. The stage of AKI was determined following KDIGO guidelines. Therapeutic and supportive interventions during ICU stay comprised the use of vasoactive agents, nonsteroidal anti-inflammatory drugs (NSAIDs), statins, proton pump inhibitors (PPIs), systemic glucocorticoids, mechanical ventilation, and continuous renal replacement therapy (CRRT). Disease severity and organ dysfunction were evaluated using multiple scoring systems, including the Charlson Comorbidity Index, Acute Physiology Score III (APSIII), Logistic Organ Dysfunction Score (LODS), Oxford Acute Severity of Illness Score (OASIS), Systemic Inflammatory Response Syndrome (SIRS) criteria, Sequential Organ Failure Assessment (SOFA) score, Simplified Acute Physiology Score II (SAPSII), and Glasgow Coma Scale (GCS). Outcome variables included hospital length of stay, ICU length of stay, hospital mortality, ICU mortality, 30-day survival time, 30-day mortality, 90-day survival time, and 90-day mortality. And the primary outcome was 30-day mortality.
2.4. Trajectory modeling
Dynamic changes in serum lactate levels during the early ICU period were analyzed using a GBTM framework. This approach identifies latent subpopulations within heterogeneous clinical data that share similar longitudinal trends over time, allowing for the exploration of distinct temporal patterns of biomarker evolution. For each patient, the first available serum lactate measurement from each of the first three ICU days was extracted to represent the early-phase biochemical trajectory. Patients missing serum lactate values on any of these days were excluded from the modeling cohort to ensure trajectory stability and comparability across individuals. A series of models with 2 to 6 trajectory groups were fitted, and the optimal number of trajectories was determined according to multiple complementary criteria, including the Bayesian Information Criterion (BIC), Akaike Information Criterion (AIC), average posterior probability (AvePP ≥ 0.70), odds of correct classification (OCC ≥ 5), and class size ≥ 2% of the total sample.20,21 The final model was selected by considering both statistical performance and clinical interpretability.
2.5. Statistical analysis
Variables with more than 25% missing values were excluded from further analysis (Supplementary Table 1). For variables with missingness less than 25%, data imputation was performed using the missForest algorithm.
The relationships between lactate level, lactate trajectories, and lactate quartiles with 30-day outcomes were evaluated using Kaplan-Meier (KM) survival analysis and Cox proportional hazards regression models. Both univariable and multivariable Cox models were fitted, and the multivariable model adjusted for potential confounders identified in the preliminary analysis, and the significant variables in baseline analysis for groups by 30-day survival status were identified as candidate covariables (Supplementary Table 2). To control for multicollinearity and high correlation of those variables, pairwise correlation analyses were conducted within the subset of variables showing significant differences between 30-day survivors and non-survivors. For continuous variables, the Spearman rank correlation coefficient was used (Supplementary Figure 2); when the absolute correlation coefficient (|r|) exceeded 0.6, the variable showing a weaker association with the outcome was excluded. For categorical variables, Cramér’s V coefficient was calculated (Supplementary Figure 3); when V exceeded 0.5, the variable less strongly correlated with 30-day mortality was removed. The remaining variables were entered into the multivariable Cox regression as covariates. The potential nonlinear association between lactate concentration and 30-day mortality was examined using restricted cubic spline (RCS) functions. To further explore the robustness of the observed associations, subgroup analyses were conducted across clinically relevant categories.
For descriptive analyses, normally distributed continuous variables were expressed as mean ± standard deviation (SD), and non-normally distributed continuous variables were expressed as median with interquartile range (IQR). For comparisons across the more than two groups, one-way analysis of variance (ANOVA) was used for normally distributed variables and the Kruskal-Wallis test for non-normally distributed variables. For two-group comparisons, the unpaired Student’s t-test was used for normally distributed variables and the Mann-Whitney U test for non-normally distributed variables. Categorical variables were reported as counts (percentages) and compared using the Chi-square test or Fisher’s exact test, as appropriate. All statistical analyses were performed using R software (version 4.4.2). A two-sided p-value < 0.05 was considered statistically significant.
3. Results
3.1. Lactate trajectory model selection and final model in ICU patients with AKI and delirium according to lactate trajectory groups
A total of 2664 patients with AKI and delirium were included in the final cohort for trajectory analysis (Supplementary Figure 1). Dynamic changes in serum lactate levels within the first 72 hours of ICU admission were modeled using GBTM to identify distinct temporal patterns. Five candidate trajectory models, containing 2 to 6 latent classes, were fitted to the data. As shown in Supplementary Table 3, both the BIC and AIC values decreased with increasing class number, suggesting improved statistical fit. However, models with five or more classes exhibited very small subgroup proportions (<2% of the population) and reduced odds of correct classification (OCC <5), indicating potential overfitting. Taking into account statistical performance, classification accuracy, subgroup size, and clinical interpretability, the four-class model was selected as the optimal solution. This model achieved an average posterior probability (AvePP) of 0.898 and a minimum OCC of 5.50, meeting conventional quality thresholds for trajectory differentiation.
As illustrated in Figure 1(A), four distinct lactate trajectories were identified: Class 1 (black): persistently low and stable lactate levels throughout the 72-hour observation window. Class 2 (red): mildly elevated lactate at admission followed by a gradual decline. Class 3 (green): initially high lactate with a rapid early decrease and subsequent rebound (U-shaped curve). Class 4 (blue): moderate baseline lactate with a transient rise followed by a continuous decrease (inverted U-shaped curve). (A) Group-based lactate trajectories among AKI patients with delirium in the MIMIC-IV database. GBTM identified four distinct lactate trajectories within the first 72 hours after ICU admission among patients with AKI and delirium. Class 1 (black): low-stable. Persistently low lactate across the entire 72-hour window. Class 2 (red): mildly elevated-slowly decreasing. Slightly elevated at admission, followed by a gradual, steady decline throughout the observation period. Class 3 (green): high-decreasing-rebound (U-shaped). Very high at admission, declines markedly to near-normal levels by mid-course, then shows a secondary rise in the late phase. Class 4 (blue): moderate-early rise-sustained decline (inverted U). Starts at a moderate level with a modest early increase, followed by a pronounced, continuous decrease thereafter. Dashed lines indicate 95% confidence intervals for each trajectory. These heterogeneous temporal patterns were subsequently used to examine associations with 30-day all-cause mortality. (B) Distribution of serum lactate levels across lactate quartiles. Q1 = 0.4-1.5 mmol/L, Q2 = 1.5-2.5 mmol/L, Q3 = 2.5-4.2 mmol/L, and Q4 = 4.2-28.0 mmol/L. Abbreviations: AKI, acute kidney injury; GBTM, group-based trajectory modeling; MIMIC-IV, Medical Information Mart for Intensive Care IV.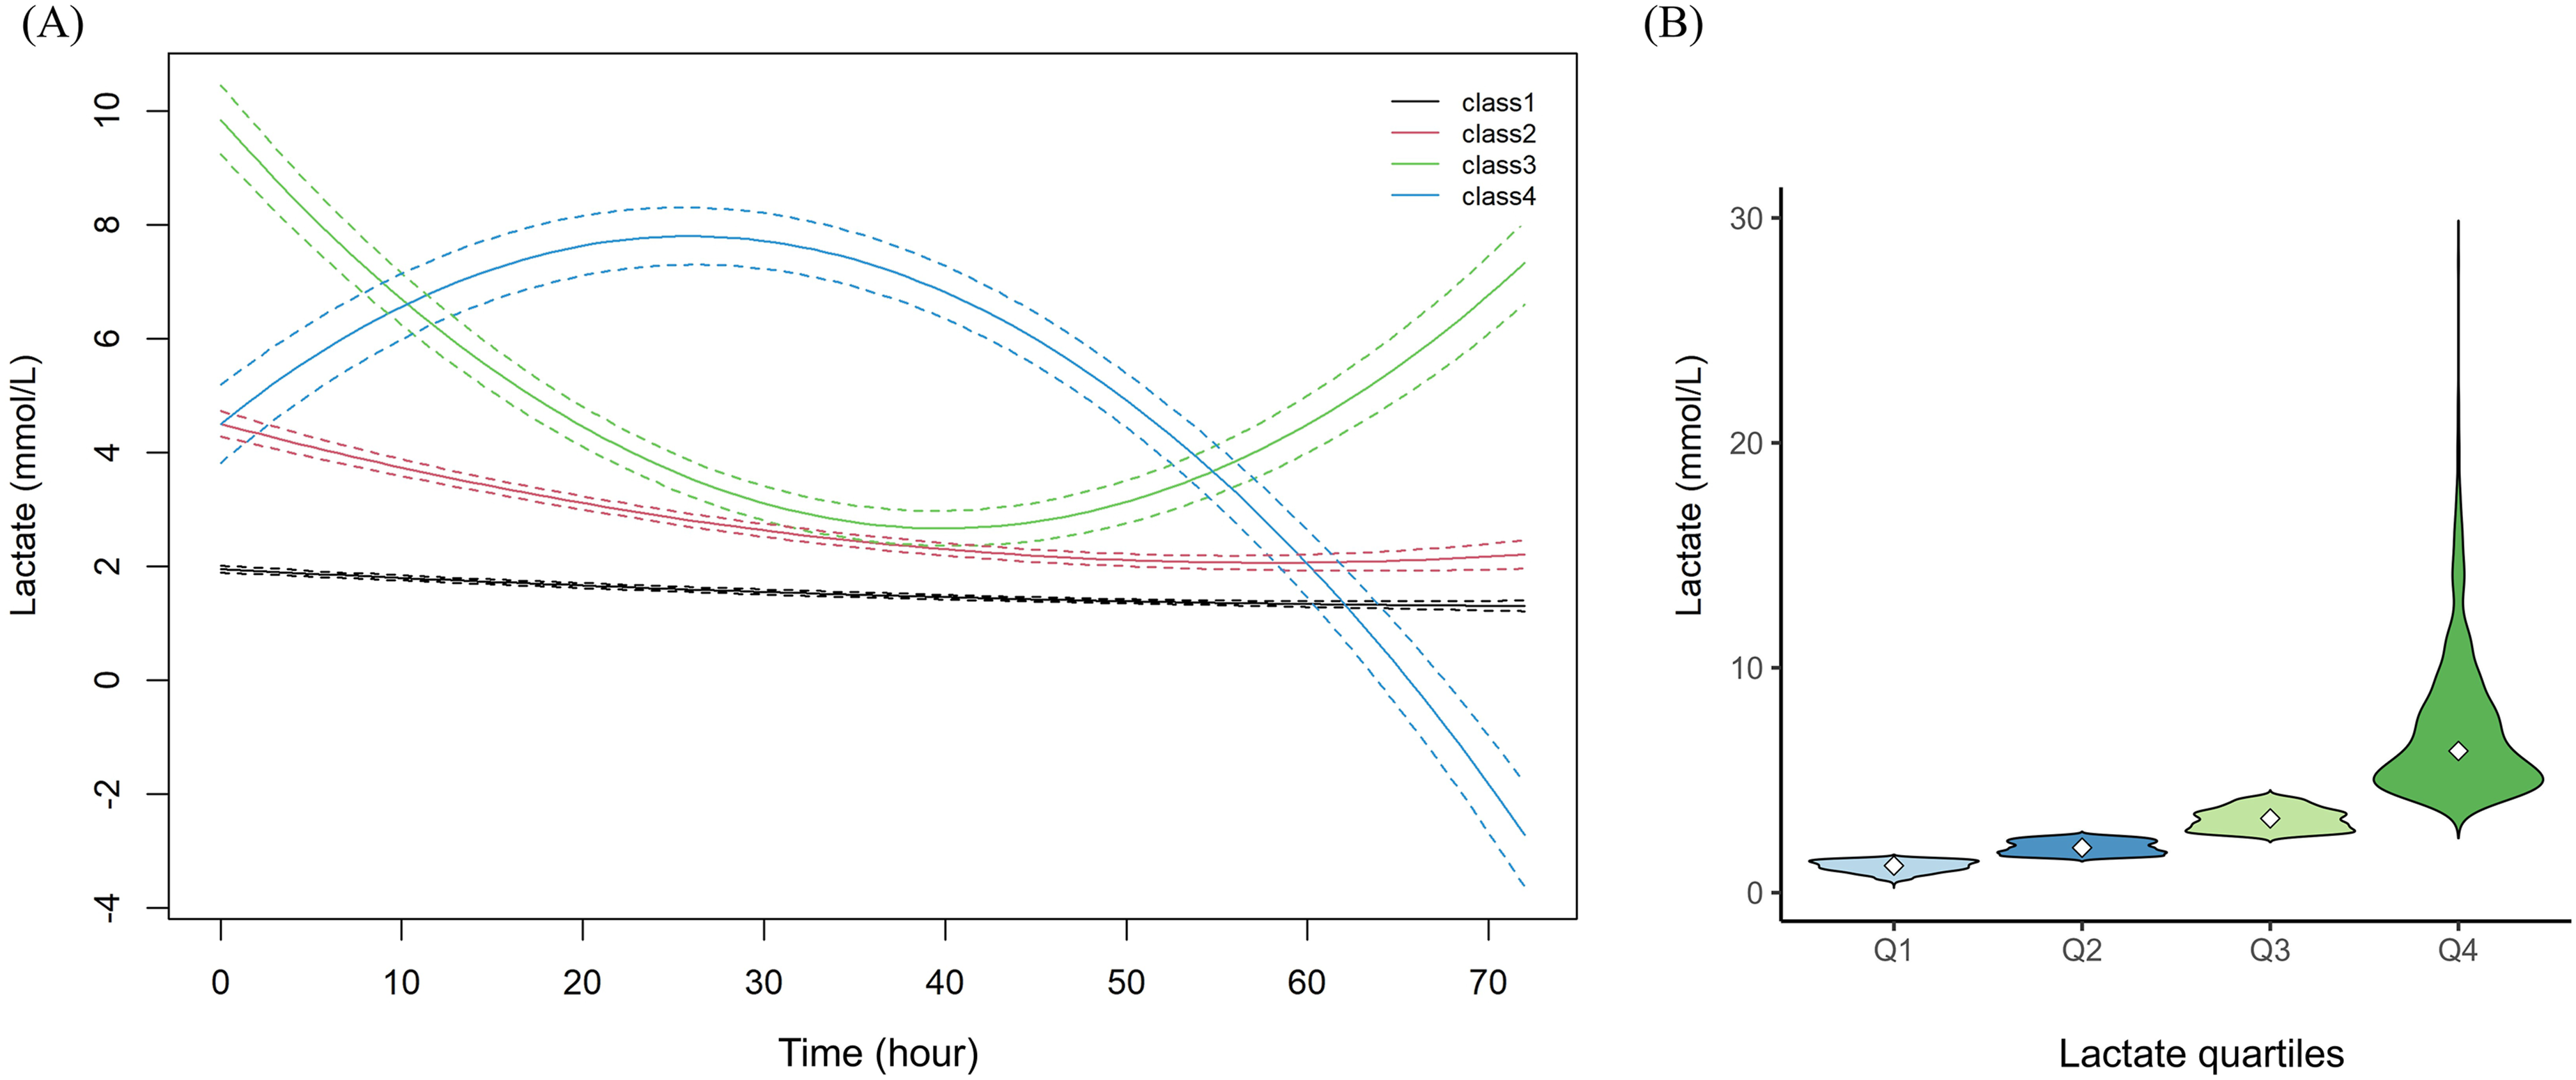
3.2. Baseline characteristics of ICU patients with AKI and delirium according to lactate trajectory groups
Baseline characteristics of AKI patients with delirium according to lactate trajectory groups.

Abbreviations: AKI, acute kidney injury; SBP, systolic blood pressure; DBP, diastolic blood pressure; MBP, mean blood pressure; WBC, white blood cell count; RBC, red blood cell count; ALT, alanine aminotransferase; ALP, alkaline phosphatase; AST, aspartate aminotransferase; BUN, blood urea nitrogen; LDH, lactate dehydrogenase; INR, international normalized ratio; PT, prothrombin time; PTT, partial thromboplastin time; SO2, oxygen saturation; PO2, partial pressure of oxygen; PCO2, partial pressure of carbon dioxide; PaO2/FiO2, oxygenation index; BE, base excess; CRRT, continuous renal replacement therapy; APSIII, Acute Physiology Score III; LODS, Logistic Organ Dysfunction Score; OASIS, Oxford Acute Severity of Illness Score; SIRS, systemic inflammatory response syndrome; SOFA, Sequential Organ Failure Assessment; SAPSII, Simplified Acute Physiology Score II; GCS, Glasgow Coma Scale; LOS, length of stay.
Compared with Class 1, patients in Classes 2-4 presented with higher heart rate and lower systolic, diastolic, and mean arterial pressures, suggesting greater hemodynamic instability. In laboratory profiles, neutrophil count, ALT, AST, total bilirubin, LDH, and coagulation markers (INR, PT, and PTT) were significantly higher in Classes 2-4, while albumin was markedly lower. These groups also demonstrated elevated lactate levels accompanied by lower SO2, pH, and base excess, indicating impaired oxygen metabolism and metabolic acidosis. Regarding comorbidities, the prevalence of chronic pulmonary disease was lower in Classes 2-4, whereas liver disease and sepsis were more common. Class 3 exhibited the highest proportions of congestive heart failure, diabetes mellitus, and malignant cancer. Notably, higher AKI stages were progressively more represented in higher trajectory classes, and stage 3 AKI accounted for 44.5% in Class 3, and 45.5% in Class 4 (p < 0.001). Therapeutically, patients in Classes 2-4 required more vasoactive support and CRRT, and had higher usage rates of systemic glucocorticoids and PPIs, whereas NSAIDs and statins were used less frequently. In particular, the proportion of patients receiving CRRT increased markedly across trajectory classes (44.9% for Class 3, and 59.3% for Classes 4, p < 0.001), paralleling the rising 30-day mortality observed from Class 1 to Class 4. Disease severity scores (APSIII, LODS, OASIS, SIRS, SOFA, and SAPSII) were all higher in Classes 2-4, with the most severe profile observed in Class 4. In terms of outcomes, the overall 30-day mortality was 29.1% (771/2664). And the 30-day mortality, together with hospital mortality, ICU mortality, and 90-day mortality were substantially higher in Classes 2-4 compared with Class 1, again peaking in Class 4, which also showed the shortest survival times.
3.3. Association between lactate trajectories and 30-day mortality in ICU patients with AKI and delirium
Figure 2(A) presents the Kaplan-Meier survival curves for 30-day all-cause mortality among the four lactate trajectory groups. A clear separation of the survival curves was observed (log-rank test, p < 0.0001). Patients in Class 1 (low-stable lactate) demonstrated the highest survival probability, followed sequentially by Class 2, Class 3, and Class 4. The lowest 30-day survival rate was observed in Class 4, which exhibited a moderate-early rise-subsequent decline in lactate, whereas Classes 3 and 4, both characterized by elevated or fluctuating lactate levels, showed substantially reduced survival within the first month of ICU admission. Kaplan-Meier survival curves for 30-day all-cause mortality according to lactate trajectory groups (A), as well as lactate quartiles (B). Abbreviations: AKI, acute kidney injury; GBTM, group-based trajectory modeling. Q1 = 0.4-1.5 mmol/L, Q2 = 1.5-2.5 mmol/L, Q3 = 2.5-4.2 mmol/L, and Q4 = 4.2-28.0 mmol/L.
Cox proportional hazards regression analyses for the association between lactate indicators and 30-day all-cause mortality in ICU patients with AKI and delirium.

Model 1: Univariate Cox regression without covariate adjustment. Model 2: adjusted for marital status, weight, MBP, respiratory rate, and temperature. Model 3: further adjusted for monocytes, neutrophils, RBC, albumin, ALP, total bilirubin, BUN, chloride, INR, PTT, SO2, PO2, PCO2, PaO2/FiO2 ratio, base excess, Charlson comorbidity index, SIRS, SAPSII, GCS. Model 4: fully adjusted for all variables in Model 3 plus congestive heart failure, cerebrovascular disease, liver disease, vasoactive drug use, NSAIDs, PPIs, AKI stage, and ventilation. Abbreviations: AKI, acute kidney injury; ALP, alkaline phosphatase; BUN, blood urea nitrogen; CI, confidence interval; HR, hazard ratio; INR, international normalized ratio; MBP, mean blood pressure; NSAIDs, nonsteroidal anti-inflammatory drugs; PPI, proton pump inhibitor; PTT, partial thromboplastin time; RBC, red blood cell; SO2, oxygen saturation; APSIII, Acute Physiology Score III; LODS, Logistic Organ Dysfunction Score; OASIS, Oxford Acute Severity of Illness Score; SIRS, systemic inflammatory response syndrome; SOFA, Sequential Organ Failure Assessment; SAPSII, Simplified Acute Physiology Score II; GCS, Glasgow Coma Scale. Q1 = 0.4-1.5 mmol/L, Q2 = 1.5-2.5 mmol/L, Q3 = 2.5-4.2 mmol/L, and Q4 = 4.2-28.0 mmol/L.
3.4. Baseline characteristics of ICU patients with AKI and delirium according to lactate quartiles
Figure 1(B) illustrated the distribution of serum lactate concentrations across quartiles (Q1 = 0.4-1.5 mmol/L, Q2 = 1.5-2.5 mmol/L, Q3 = 2.5-4.2 mmol/L, Q4 = 4.2-28.0 mmol/L). As shown in Supplementary Table 4, With increasing lactate levels, patients exhibited higher heart rate and lower systolic, diastolic, and mean blood pressures (all p < 0.05). Laboratory findings showed marked biochemical deterioration across quartiles. Higher lactate groups had increased WBC and neutrophil counts, transaminases (ALT, AST), bilirubin, LDH, INR, PT, PTT, anion gap, and glucose (all p < 0.001), but lower platelet count, albumin, and pH/base excess. SO2 decreased and PCO2 fell slightly with rising quartiles. Regarding comorbidities, liver disease and malignant cancer were more common in Q4, whereas chronic pulmonary disease and congestive heart failure were less frequent (all p < 0.05). For treatments, patients in higher quartiles required more vasoactive agents and CRRT and received more glucocorticoids, but used fewer NSAIDs and statins (all p < 0.01). Disease severity increased steadily with lactate: APSIII, LODS, OASIS, SIRS, SOFA, and SAPSII scores were highest in Q4 (all p < 0.001). In outcomes, hospital, ICU, 30-day, and 90-day mortality rose significantly across quartiles, peaking in Q4 (34.1%, 25.8%, 34.6%, and 42.1%, respectively; all p < 0.001). Overall, elevated lactate quartiles identified patients with greater physiological instability, multi-organ dysfunction, and substantially worse short- and long-term prognosis.
3.5. Association between lactate quartiles and 30-day mortality in ICU patients with AKI and delirium
Kaplan-Meier survival analysis (Figure 2(B)) demonstrated that 30-day all-cause mortality increased progressively with higher lactate quartiles (log-rank p = 0.00023). Patients in Q4 (>4.2 mmol/L) showed the lowest survival probability throughout the 30-day observation, whereas those in Q1 (0.4-1.5 mmol/L) exhibited the most favorable outcomes.
Cox regression analyses in Table 2 confirmed a graded association between lactate quartiles and mortality risk. Compared with Q1, the univariate model revealed significantly higher hazard ratios in Q2 (HR 1.31, 95% CI 1.06-1.61, p = 0.012), Q3 (HR 1.32, 95% CI 1.07-1.64, p = 0.009), and Q4 (HR 1.58, 95% CI 1.29-1.93, p < 0.001). In the fully adjusted model, Q3 remained significantly related to increased 30-day mortality (HR 1.32, 95% CI 1.06-1.65, p = 0.013), while Q4 demonstrated a borderline trend toward higher risk (HR 1.28, 95% CI 1.01-1.62, p = 0.041). Overall, patients with elevated lactate concentrations within the Q3 experienced markedly poorer short-term outcomes.
Restricted cubic spline analysis (Supplementary Figure 4) demonstrated a continuous positive association between serum lactate levels and 30-day all-cause mortality in patients with AKI and delirium (overall p < 0.001) and the test for nonlinearity was not statistically significant (p = 0.092). The overall trend suggested that higher lactate levels were consistently associated with an increased hazard of death.
3.6. Subgroup analyses
Subgroup analyses were conducted to examine whether the association between lactate indicators and 30-day all-cause mortality varied across major comorbidities. For lactate trajectories, the positive association with mortality was consistently observed across all subgroups, including those with or without congestive heart failure, cerebrovascular disease, chronic pulmonary disease, liver disease, and renal disease (all p for interaction > 0.05), suggesting that higher lactate trajectory classes remained robustly associated with increased 30-day mortality irrespective of underlying comorbidities (Figure 3). For lactate quartiles, a consistent dose-response relationship with mortality was also observed across most subgroups. Notably, a significant interaction was found for congestive heart failure (p for interaction = 0.016), indicating that the prognostic impact of elevated lactate was more prominent in patients without heart failure. In this subgroup, mortality risk increased steadily from Q2 (HR 1.58, 95% CI 1.18–2.13) to Q4 (HR 2.19, 95% CI 1.65–2.9). In contrast, no significant interactions were detected for cerebrovascular disease, chronic pulmonary disease, liver disease, or renal disease (all p > 0.05). Overall, these findings demonstrate that elevated lactate, whether assessed dynamically through trajectories or as baseline quartiles, was independently associated with higher short-term mortality across diverse clinical subgroups. Subgroup analyses of the association between lactate trajectories, as well as lactate quartiles and 30-day all-cause mortality in ICU patients with AKI and delirium. Q1 = 0.4-1.5 mmol/L, Q2 = 1.5-2.5 mmol/L, Q3 = 2.5-4.2 mmol/L, and Q4 = 4.2-28.0 mmol/L.
4. Discussion
In this study, we comprehensively evaluated the prognostic significance of base lactate, lactate quartiles, and early lactate trajectories in ICU patients with concurrent AKI and delirium. After adjusting for multiple confounders, baseline lactate concentration alone was not independently associated with 30-day mortality, and only the third quartile group was associated with higher 30-day mortality. In contrast, lactate trajectories demonstrated strong and consistent predictive value. Four distinct dynamic patterns of lactate evolution were identified, among which patients in the low-stable trajectory had the most favorable prognosis, while those with early elevation or fluctuating lactate trends exhibited significantly higher mortality. RCS analysis revealed a linear positive association between lactate and short-term mortality, and subgroup analyses confirmed the robustness of these associations across different comorbidities. Together, these findings suggest that dynamic lactate trajectories provide more robust prognostic information, complementing the role of lactate in risk stratification and prognostic assessment.
The strong epidemiological link between AKI and delirium has been further substantiated by a recent meta-analysis, which demonstrated a significant and bidirectional association between these two conditions across heterogeneous ICU populations. 7 To our knowledge, no previous studies have specifically examined the prognostic implications of lactate in critically ill patients with concurrent AKI and delirium. Prior studies have demonstrated that lactate is a robust prognostic biomarker in patients with AKI. Chen et al. analyzed more than 4,000 AKI cases from the MIMIC-III database and found that elevated serum lactate levels were independently associated with increased one-year mortality, even after adjustment for comorbidities and disease severity. 22 Similarly, Fang et al. used GBTM to classify hyperlactatemic ICU patients into distinct temporal patterns and showed that persistent or slowly declining hyperlactatemia predicted both AKI development and hospital mortality. 23 These findings support the strong link between lactate accumulation, renal hypoperfusion, and adverse outcomes in the setting of kidney injury. Elevated lactate was also reported to predict higher mortality of patients with delirium. Qian et al. reported that early hyperlactatemia and lactic acidosis within the first 24 hours of ICU admission were significantly correlated with higher odds of delirium and 30-day mortality, while higher lactate clearance was protective. 24 Lactate trajectory analysis has been increasingly applied in general ICU populations, such as those with sepsis, ARDS, or ischemic stroke. Across these studies, several consistent trajectory patterns have emerged, including typically low-stable, moderately elevated-declining, and persistently high courses, all showing clear stratification of mortality risk.23,25–27 Our trajectory patterns paralleled these observations, that patients with stable lactate exhibited the most favorable outcomes, whereas those with early elevation or rebound patterns had markedly increased mortality. These parallels reinforce the reproducibility of trajectory-based lactate assessment across heterogeneous critical illness, while our study extended this framework to the coexisting of AKI and delirium. Our findings extend this body of evidence by showing that within this high-risk population, dynamic lactate trajectories can further stratify prognosis, suggesting that metabolic monitoring may offer practical tools for risk assessment in patients with concurrent AKI and delirium.
The pathophysiological basis linking lactate dysregulation to adverse outcomes in patients with concurrent AKI and delirium is multifactorial, involving systemic inflammation, renal metabolic failure, and cerebral dysfunction. Elevated lactate levels in critical illness arise from an imbalance between oxygen delivery and cellular demand, mitochondrial dysfunction, and impaired clearance, while AKI further limits lactate utilization and excretion through reduced renal perfusion and tubular injury.28,29 Sustained hyperlactatemia therefore reflected an integrated marker of renal hypoperfusion, hemodynamic instability, and global metabolic stress. Concurrently, delirium represented an acute cerebral manifestation of systemic inflammation and metabolic derangement. Inflammatory mediators, endothelial injury, and oxidative stress disrupted the blood-brain barrier, leading to neuroinflammation, microglial activation, and neurotransmitter dysregulation, while uremic toxins and cytokine cascades further impair neuronal energy metabolism. 8 Thus, elevated lactate may not only signify systemic hypoperfusion but also localized cerebral metabolic distress, linking peripheral metabolic dysfunction with acute brain injury. The bidirectional interaction between AKI and delirium formed a vicious cycle in which renal injury amplifies inflammation and acidosis, promoting neuroinflammation, whereas delirium-associated sympathetic activation and hemodynamic instability exacerbate renal ischemia and oxidative damage. Furthermore, our study demonstrated that patients with higher lactate trajectory classes were more likely to present with advanced AKI (KDIGO stage 3) and to require CRRT, with this gradient closely mirroring the escalation in 30-day mortality across trajectory groups. These observations underscore that fluctuating lactate levels may reflect more severe renal injury and greater need for organ support. Prior studies have established that advancing AKI stage was associated with progressively worse outcomes in critically ill populations, 30 and that the requirement for CRRT in the setting of AKI confers a substantial mortality burden, with reported short-term mortality rates ranging from 30% to 70%. 31 Our findings extend this evidence by suggesting that lactate trajectories may serve as an integrative marker capturing both the severity of renal dysfunction and the adequacy of metabolic compensation, thereby providing additional prognostic value beyond static AKI staging alone.
It is also worth considering the heterogeneous etiologies underlying lactate elevation in this population. Type A lactic acidosis, driven by tissue hypoperfusion and oxygen delivery-demand mismatch, is commonly encountered in patients with septic or cardiogenic shock, and may predominate in trajectory classes showing early and pronounced lactate elevations. In contrast, type B lactic acidosis arising from hepatic dysfunction, medication effects (e.g., epinephrine, metformin), or mitochondrial dysfunction, may contribute to persistent or rebound patterns, particularly in patients with underlying liver disease or those receiving certain pharmacological agents. 32 In our cohort, patients with fluctuating lactate trajectory exhibited greater prevalence of liver disease and vasoactive agent use, suggesting a mixed contribution from both type A and type B mechanisms. Restricted to the database limitation, it is difficult to identify the detailed subtypes of lactic acidosis in our study. Future studies are needed to enable more refined subtyping and clarify whether specific etiological patterns of hyperlactatemia carry differential prognostic implications.
Clinically, our findings suggest that combining static and dynamic lactate assessments yields complementary prognostic insights in ICU patients with concurrent AKI and delirium. Quartile-based stratification reflects the patient’s initial metabolic burden at ICU entry, providing a rapid and intuitive indicator of early disease severity and short-term risk. In contrast, trajectory modeling captures the temporal evolution of lactate and thus reveals ongoing metabolic stress, organ interaction, and treatment responsiveness over time. These two indicators describe different but interrelated aspects of metabolic physiology. In practice, early quartile stratification can assist in initial triage, enabling clinicians to promptly identify patients who warrant intensified monitoring or hemodynamic optimization. Subsequently, dynamic lactate trajectories provide continuous feedback on resuscitation adequacy, renal recovery, and systemic oxygen balance. Persistently elevated or rebound patterns may indicate unresolved hypoperfusion, mitochondrial dysfunction, or inflammatory activation, even when conventional vital signs appear stable. Recognizing these dynamic warning signals could encourage earlier therapeutic reassessment and prevent secondary organ injury. Importantly, lactate monitoring remains inexpensive, widely available, and rapidly measurable, making it a practical tool for bedside risk assessment. Embedding trajectory visualization or automated lactate-trend alerts into ICU monitoring systems may enhance situational awareness and support precision-based management. In the complex setting of AKI with delirium, where metabolic, renal, and cerebral dysfunctions intersect, integrating both baseline lactate stratification and trajectory monitoring may enable clinicians to detect subtle physiological deterioration earlier, optimize multi-organ support, and improve overall outcomes.
Several limitations of this study should be acknowledged. First, this was a retrospective analysis based on the MIMIC-IV database, and despite rigorous statistical adjustment, the possibility of residual confounding and selection bias cannot be entirely excluded. Second, delirium identification in MIMIC-IV relied on CAM-ICU documentation, which may be subject to underdiagnosis or inter-observer variability. Third, our trajectory modeling was limited to the first 72 hours of ICU stay; thus, later metabolic changes and delayed recovery patterns were not captured. Future studies incorporating longer observation windows and repeated biomarker measurements may provide a more complete depiction of metabolic evolution. Fourth, a formal sample size calculation was not performed a priori, as this was a retrospective study and the cohort size was determined by the availability of eligible patients in the MIMIC-IV database. Nevertheless, the final sample of 2,664 patients with 771 events (30-day deaths) provided adequate statistical power for multivariable Cox regression and trajectory analyses. Moreover, although we explored both baseline lactate quartiles and early dynamic trajectories, causality cannot be inferred. Elevated or fluctuating lactate may represent the downstream effect of disease severity rather than a direct contributor to mortality. Interventional studies are therefore warranted to determine whether lactate-guided management or early correction of persistent hyperlactatemia could improve outcomes in patients with combined AKI and delirium. In addition, future research integrating lactate kinetics with multimodal physiologic and biochemical data, such as renal injury markers, cerebral oximetry, and inflammatory mediators, could facilitate the development of dynamic risk models and personalized decision-support tools.
5. Conclusions
In ICU patients with concurrent AKI and delirium, dynamic lactate trajectories were associated with 30-day mortality, whereas baseline lactate levels showed limited independent predictive value. Longitudinal lactate monitoring may complement single-point measurements for early risk stratification in this population.
Supplemental material
Supplemental material - Association between lactate trajectory and 30-day mortality in patients with acute kidney injury and delirium: A retrospective study
Supplemental material for Association between lactate trajectory and 30-day mortality in patients with acute kidney injury and delirium: A retrospective study by Mei Ye, Xingshan Lu, Suying Peng, Haowen Zhang, Jie Mao, Zhiyue Cai, Wenwen Ji and Xiaocui Zhang in Science Progress.
Footnotes
Acknowledgments
The authors would like to acknowledge the MIT Laboratory for Computational Physiology for providing access to the Medical Information Mart for Intensive Care IV (MIMIC-IV) database. We sincerely appreciate the efforts of the MIMIC-IV development team in maintaining and curating this valuable critical care dataset, which has significantly contributed to advancements in clinical research.
Ethical considerations
This study was approved by the Institutional Review Board of Beth Israel Deaconess Medical Center. The requirement for informed consent was waived because the MIMIC-IV database contains de-identified patient information.
Author contributions
Mei Ye: Conceptualization, Data curation, Formal analysis, Writing-original draft. Xingshan Lu, Suying Peng, and Haowen Zhang: Investigation, Methodology, Writing-review & editing. Jie Mao, Zhiyue Cai, and Wenwen Ji: Validation, Supervision, Writing-review & editing. Xiaocui Zhang: Conceptualization, Project administration, Supervision, Writing-review & editing. All authors have read and agreed to the published version of the manuscript.
Funding
The authors disclosed receipt of the following financial support for the research, authorship, and/or publication of this article: This work was supported by the Chongqing regional Specialized Clinical Center for Nephrology (Internal Medicine) Establishment Project.
Declaration of conflicting interests
The authors declared no potential conflicts of interest with respect to the research, authorship, and/or publication of this article.
Data Availability Statement
Supplemental material
Supplemental material for this article is available online.
References
Supplementary Material
Please find the following supplemental material available below.
For Open Access articles published under a Creative Commons License, all supplemental material carries the same license as the article it is associated with.
For non-Open Access articles published, all supplemental material carries a non-exclusive license, and permission requests for re-use of supplemental material or any part of supplemental material shall be sent directly to the copyright owner as specified in the copyright notice associated with the article.