
Abstract
Objective
To clearly state the identification of key correlates of depression and construction of a cross-sectional association-based nomogram for individualized current risk assessment, and clarify the role of each predictor via SHapley Additive exPlanations (SHAP) analysis.
Methods
This cross-sectional study included 3,701 participants with Activities of Daily Living dysfunction from the China Health and Retirement Longitudinal Survey Wave 3. Data were split into training (70%, n=2590) and testing (30%, n=1111) sets. Least Absolute Shrinkage and Selection Operator regression screened predictors from 79 variables, multivariate logistic regression built the nomogram, and model performance was validated using Receiver Operating Characteristic curves, Area Under the Curve (AUC), calibration plots, and Decision Curve Analysis. SHAP analysis interpreted predictor contributions.
Results
Ten key predictors were identified: age, pain, disability, fall history, right grip strength, waist circumference, self-rated health, sleep duration, social activity level, and memory problems. The nomogram showed acceptable discriminatory ability (AUC=0.757 in training set, 0.751 in testing set), good calibration, and clinical utility. Pain and disability were top risk factors, while right grip strength and self-rated health were protective.
Conclusion
The validated nomogram integrates multidimensional predictors to enable individualized depression risk assessment in this population, supporting early screening and targeted interventions to improve mental health outcomes.
Keywords
Introduction
Activities of Daily Living (ADL) dysfunction, encompassing limitations in basic self-care (BADL) and instrumental daily tasks (IADL), is a prevalent health challenge among middle-aged and elderly populations globally. 1 With the acceleration of population aging, the incidence of ADL dysfunction continues to rise, affecting approximately [relevant data if available] individuals aged 45 and above in China alone.2,3 Beyond the impairment of physical independence, ADL dysfunction often intersects with profound psychological distress, with depression emerging as one of the most common and debilitating comorbidities. 4 Clinical evidence indicates that individuals with ADL limitations face a 2–3 times higher risk of developing depressive symptoms compared to those with intact functional capacity, severely compromising their quality of life, rehabilitation outcomes, and long-term survival.5,6 Depression in the context of ADL dysfunction is a multifaceted condition shaped by biological, psychological, and social factors.6,7 Physiologically, functional impairment may trigger neuroinflammatory cascades, disrupt neurotransmitter balance, and exacerbate chronic disease burden—all pathways closely linked to depressive pathogenesis.8,9 Psychologically, the loss of autonomy, social isolation, and reduced sense of self-efficacy associated with ADL limitations can induce persistent negative emotions, laying the groundwork for depression.10,11 Socially, inadequate social support, financial strain, and limited access to rehabilitation resources further amplify this risk, creating a vicious cycle where depression and functional decline mutually reinforce each other.12,13 Despite its high prevalence and severe consequences, depression in individuals with ADL dysfunction is often underdiagnosed and undertreated, partly due to the lack of practical tools to identify high-risk individuals early. 14
Existing depression risk models focus on the general elderly or specific chronic disease cohorts, with no targeted assessment tools available for middle-aged and elderly adults with ADL dysfunction. 15 However, this population is not only large in size but also characterized by a high prevalence of depression, leading to an urgent clinical and public health demand for targeted assessing tools. While some studies have explored individual correlates such as pain, sleep disturbance, or chronic illness, few have integrated multidimensional predictors to construct a comprehensive risk assessment model. 16 Nomograms, as visual predictive tools, have gained widespread recognition in clinical practice for their ability to synthesize multiple risk factors into actionable probabilities, facilitating rapid and personalized risk stratification. 17 However, no validated nomogram currently exists for predicting depression risk specifically in middle-aged and elderly adults with ADL dysfunction. To address this gap, this study leveraged data from the China Health and Retirement Longitudinal Survey (CHARLS) Wave 3, a large-scale national cohort with rich multidimensional data. By integrating demographic characteristics, lifestyle factors, physical symptoms, and clinical indicators, we aimed to: (1) identify key predictors of depression in individuals with ADL dysfunction; (2) construct and validate a nomogram-based risk assessing model; (3) interpret the model using SHAP analysis to clarify the relative importance and action direction of each predictor. The findings of this study are expected to provide a practical tool for clinicians and public health professionals to screen current high-risk individuals, implement targeted interventions, and ultimately improve the mental health outcomes of this vulnerable population.
Methods
Ethics approval
This study is a retrospective analysis based on publicly available de-identified data from the CHARLS. The original CHARLS dataset was approved by the Biomedical Ethics Review Committee of Peking University (IRB00001052–11015), with all participants providing written informed consent at the time of enrollment, and the study was conducted in accordance with the ethical principles outlined in the Declaration of Helsinki (1975), as revised in 2024. All participant data included in this study were fully de-identified by removing all personally identifiable information to ensure no individual could be identified in any way. The reporting of this cross-sectional study conforms to the Strengthening the Reporting of Observational Studies in Epidemiology (STROBE) guidelines. 18
Study design and population
This cross-sectional study utilized data from CHARLS Wave 3, collected between July 2015 and January 2016. The primary objective was to identify current risk factors associated with depression among individuals with existing ADL dysfunction, rather than to predict incident depression. Eligibility criteria included: (1) age ≥ 45 years and (2) presence of ADL dysfunction. Participants were excluded if they had missing data on BADL, IADL, or the 10-item Center for Epidemiologic Studies Depression Scale (CESD-10). Of the 21,097 participants in CHARLS Wave 3, 3,701 were included in the final analysis after applying the above inclusion and exclusion criteria. The CESD-10 comprises 10 items (including positively and reverse-scored items) with a 4-point response scale (0 = low to 3 = high), yielding a total score ranging from 0 to 30. Higher scores indicate more severe depressive symptoms, and a cut-off score of >10 was used to define possible depression—consistent with previous studies demonstrating the scale’s acceptable reliability, validity, and clinical applicability in Chinese elderly populations.19,20 Participants were divided into two groups based on CESD-10 scores: the depression group (n=1899) and the non-depression group (n=1802).
Candidate predictor variables
Seventy-nine potential predictor variables (with missing rates < 20%) were selected from the CHARLS dataset, guided by clinical practice and existing literature on depression correlates in ADL-impaired populations.21–23 Variables were categorized into four domains: Demographic characteristics: sex, age, marital status, educational level, family size, and number of healthy children; Lifestyle and behavioral habits: smoking status, alcohol consumption, and engagement in social activities (e.g., visiting friends, playing board/card games, community participation); Physical symptoms and functional status: fall history, hip fracture history, number of pain sites (e.g., headache, shoulder pain, back pain, leg pain), sleep duration, and comorbid medical conditions; Clinical examination indicators: laboratory test results, physical measurements, and metabolic parameters. For detailed information, please refer to Appendix Table S1.
Statistical analysis
Data were randomly split into a training set (70%, n=2590) for model development and a testing set (30%, n=1111) for validation. LASSO regression was applied to the training set to screen key predictors, reduce multicollinearity, and select predictive variables. All 79 variables met three criteria: theoretical/clinical relevance to depression risk, missing rate <20%, and compatible data types (standardized before analysis); only variables missing BADL, IADL, or CESD-10 data were excluded. The 1 SE rule was used to determine λ (prioritizing parsimony while retaining predictability), with 10-fold cross-validation for optimal λ; variables with zero coefficients were excluded. Selected predictors were included in multivariate logistic regression to build an initial nomogram, and non-significant predictors (Wald p>0.05) were excluded for parsimony, generating a final nomogram to visualize each predictor’s contribution to depression risk.
Model performance was evaluated using receiver operating characteristic (ROC) curves, area under the curve (AUC), calibration plots, and decision curve analysis (DCA). ROC curves and AUC assessed discriminatory ability, calibration plots examined the agreement between predicted probabilities and observed outcomes, and DCA evaluated clinical utility by comparing net benefits across different threshold probabilities. SHAP (SHapley Additive exPlanations) analysis was conducted to interpret the model: SHAP values were calculated for each predictor, and global importance, swarm, waterfall, and force plots were generated to illustrate the direction and magnitude of each variable’s associative effect.
All statistical analyses and figure generation were conducted in R 4.4.2. For variables with <20% missing data, multiple imputation was performed using the MICE package (v3.16.0) with predictive mean matching (meth = “pmm”), which is robust for mixed data types (continuous, binary, ordinal) and preserves original distributions. We generated 5 imputed datasets (m=5) with 20 iterations (maxit=20); convergence was verified via lattice package plots (stable distributions after 15 iterations). A random seed (seed=500) was set for reproducibility. The imputation model included all 80 dataset variables (Appendix Table S3), complying with the multiple imputation inclusion principle to reduce bias. Distribution consistency, predictive coherence with depression outcomes, Rubin’s Rules pooling, and sensitivity analyses were evaluated. The 3rd imputed dataset was selected via quantitative screening (Appendix Table S2). Variable missing rates and between-group missing value differences are shown in Appendix Table S3. Categorical variables were reported as frequencies and percentages, continuous variables as means ± SD. Between-group comparisons used t-tests (continuous), chi-square tests (categorical), or non-parametric tests (violated parametric assumptions). Statistical significance was defined as P < 0.05.
Results
Flow chart
As shown in Figure 1, a total of 21,097 participants from CHARLS Wave 3 were initially screened. Participants with normal ADL function and those with missing data on BADL, IADL, or CESD-10 were excluded, resulting in a final analytic sample of 3,701 participants with ADL dysfunction. Based on CESD-10 scores, these participants were divided into the depression group (n=1899) and non-depression group (n=1802). The data were then split into a training set (n=2590, 70%) and a testing set (n=1111, 30%). LASSO regression was used to screen candidate predictors from 79 potential variables, followed by multivariate logistic regression to construct a depression risk assessing model and corresponding nomogram. The model’s performance was validated using ROC curves, calibration plots, and DCA, and SHAP analysis was conducted to interpret the predictive role of each key variable. Flow chart of participant enrollment and study procedures. A total of 21,097 participants from CHARLS Wave 3 (July 2015–January 2016) were initially included. Participants with normal ADL function and those missing data on BADL, IADL, or CESD-10 were excluded, resulting in 3,701 eligible participants with ADL dysfunction. These participants were divided into the depression group (n=1899, CESD-10 score >10) and non-depression group (n=1802, CESD-10 score ≤10). The data were split into a training set (70%, n=2590) and a testing set (30%, n=1111). LASSO regression was used to screen key predictors from 79 potential variables, followed by multivariate logistic regression to construct a nomogram-based depression risk assessing model. The model was validated using ROC curves, calibration plots, and DCA, and SHAP analysis was performed to interpret the predictive role of each key variable. Key candidate predictors include age, pain, disability, fall history, right grip strength, waist circumference, self-rated health (SRH), sleep duration, social activity level, and memory problems.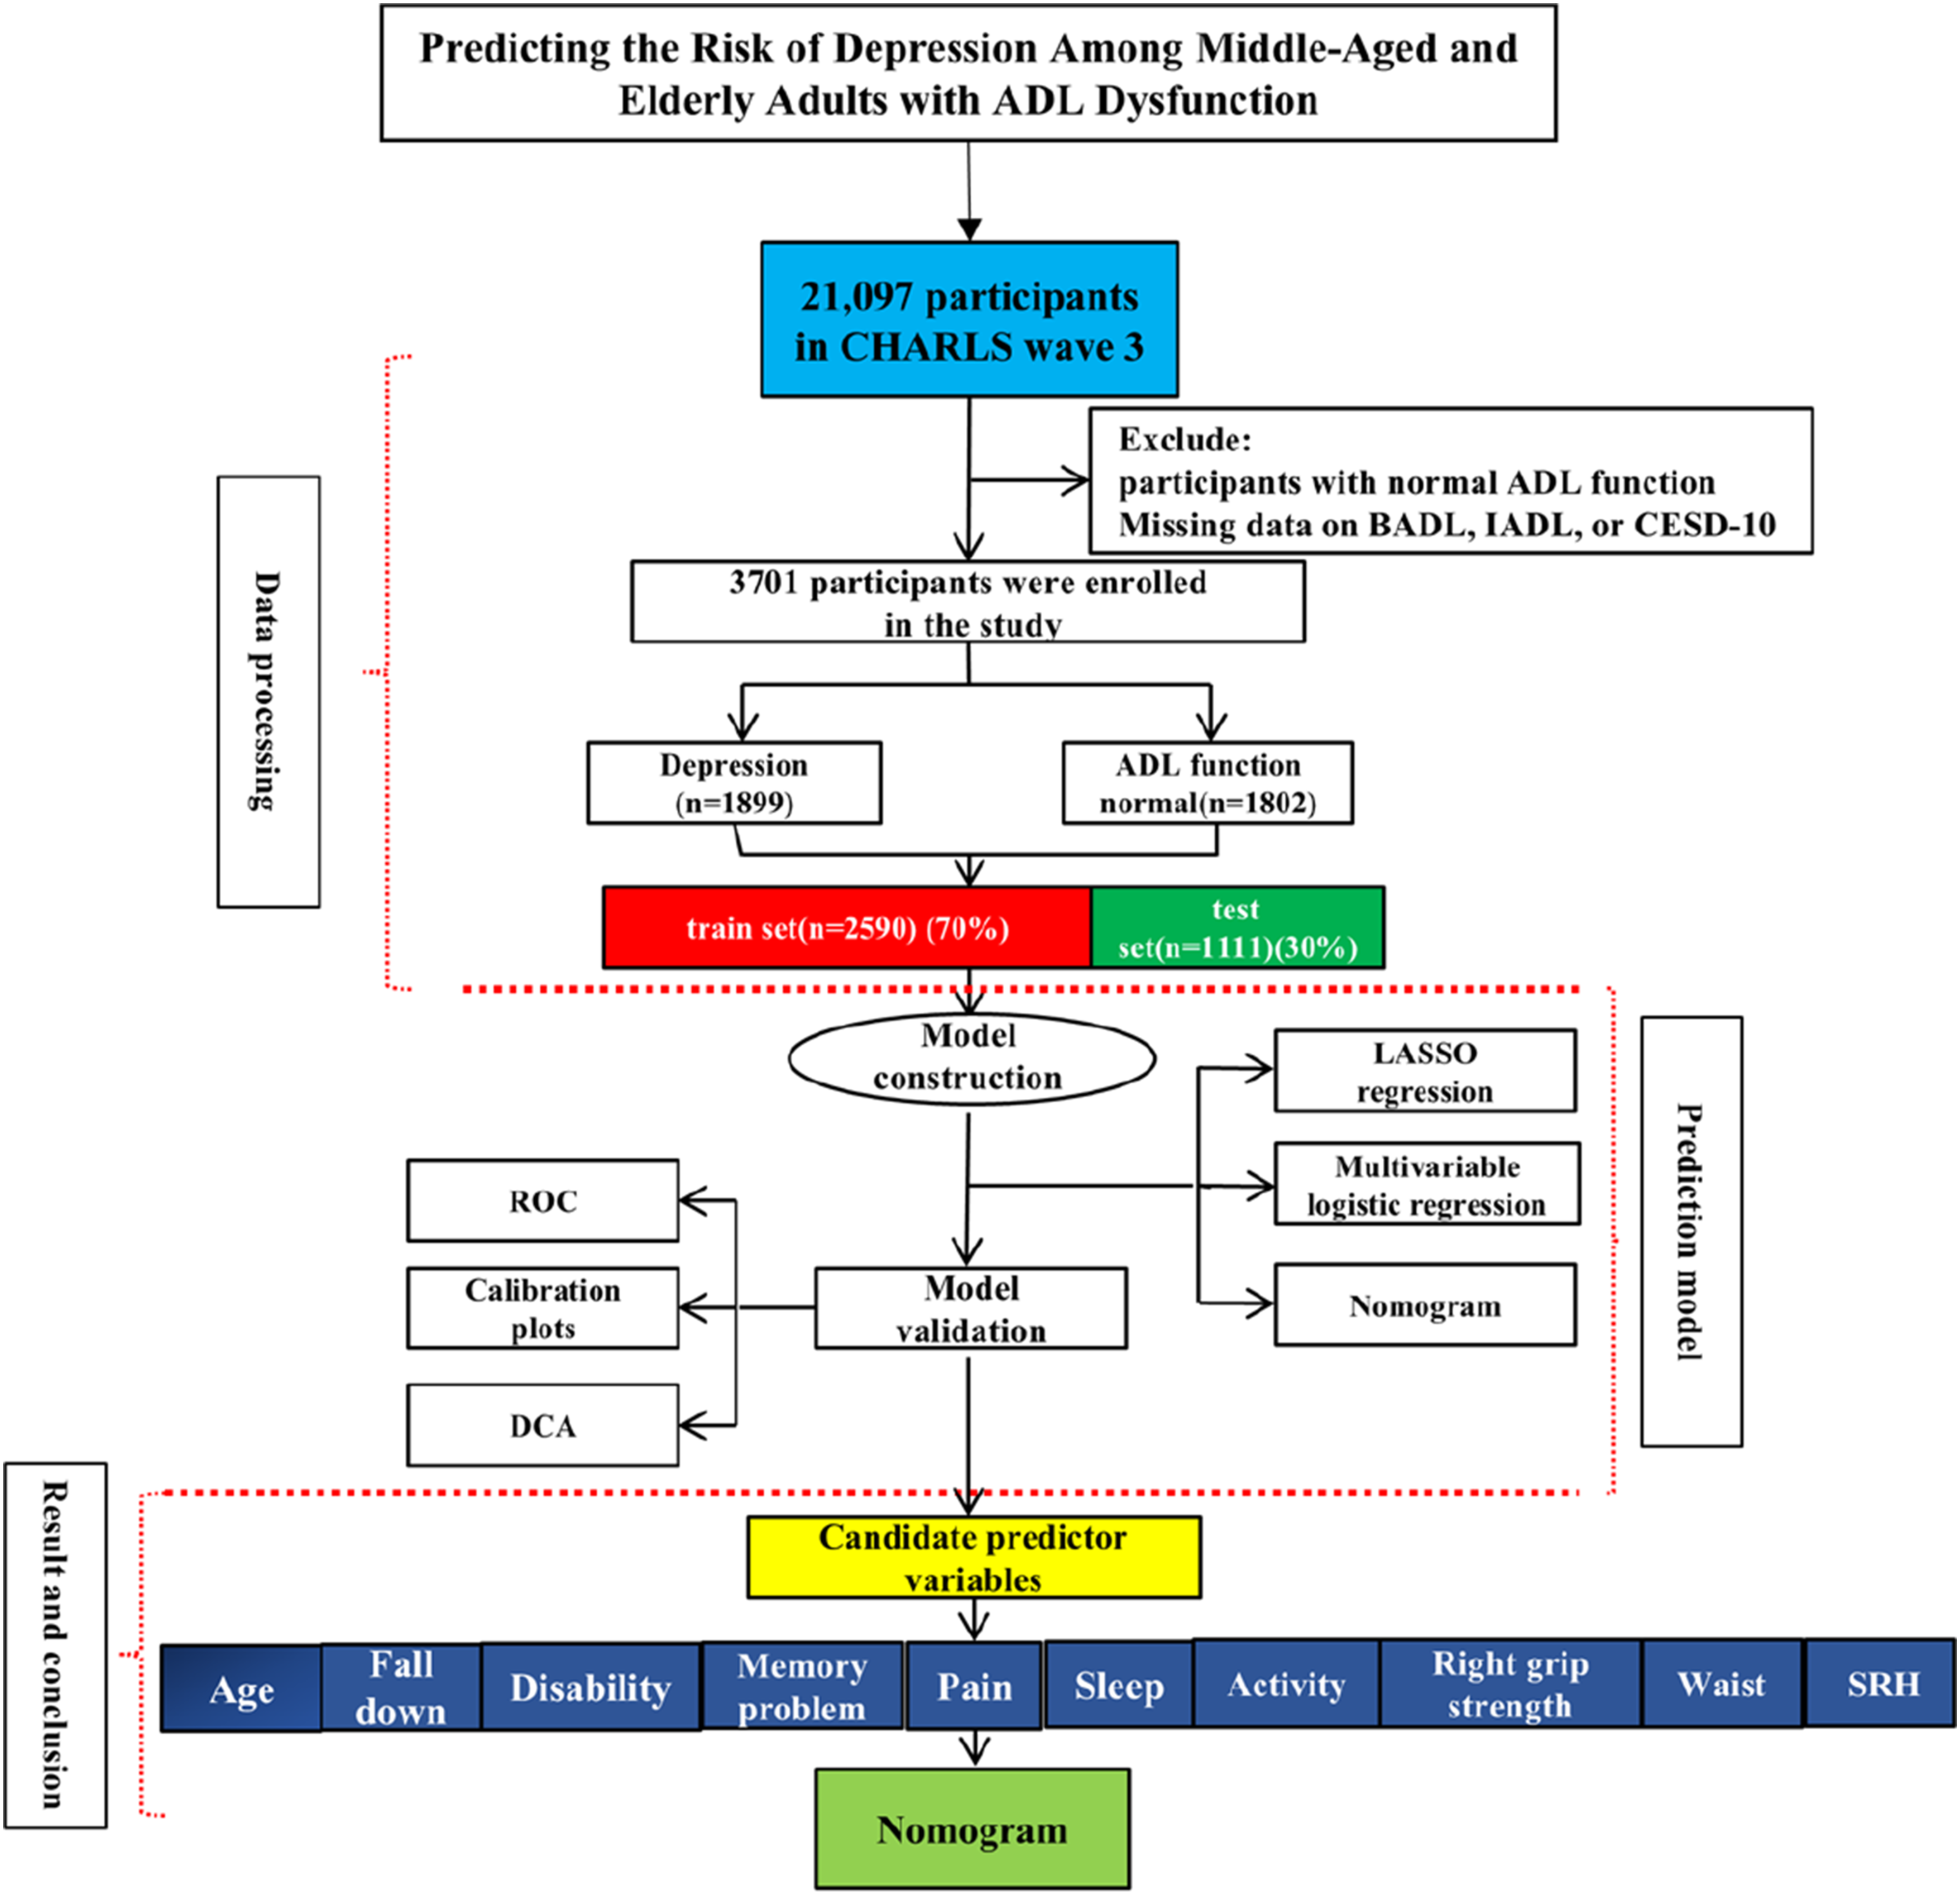
Baseline characteristics
Baseline characteristics of participants with ADL dysfunction in non-depression and depression groups.

Data are presented as mean ± SD or n (%). Abbreviations: hibpe = hypertension; arthre = arthritis; memrye = memory-related problems; systo = systolic blood pressure; lgrip = left grip strength; rgrip = right grip strength; mwaist = waist circumference; puff = peak expiratory flow; act = social activity level; cysc = cystatin C; srh = self-rated health. P < 0.05 indicates statistical significance.
Predictor selection and model development
To identify key predictors of depression in patients with ADL dysfunction, 79 potential variables were initially analyzed. After splitting the data into training (n=2590) and testing (n=1111) sets at a 7:3 ratio, LASSO regression with ten-fold cross-validation was performed on the training set to screen predictors and determine the optimal tuning parameter λ, reducing multicollinearity while selecting the most predictive factors (Figure 2). The selected predictors were then incorporated into multivariate logistic regression, and a preliminary nomogram was constructed. Following the exclusion of predictors with minimal influence, multivariate logistic regression was re-conducted, and a final nomogram was established to visualize the associative effect of each key factor (Figure 3). The key predictors identified included age, pain, disability, fall history, right grip strength, waist circumference, self-rated health (SRH), sleep duration, social activity level, and memory problems, which collectively contributed to the model’s performance. LASSO regression analysis for predictor selection and optimal λ determination. (a): This figure shows the process of screening 79 potential predictors using LASSO regression. (b): The vertical lines represent the optimal tuning parameter λ (selected via ten-fold cross-validation) and the λ corresponding to the minimum partial likelihood deviance. Variables with non-zero coefficients at the optimal λ were retained as candidate predictors for subsequent multivariate logistic regression, which helps reduce multicollinearity and select factors with predictive value. Nomogram for assessing depression risk in middle-aged and elderly adults with ADL dysfunction. The nomogram visualizes the associative effect of key factors on depression risk. Each predictor is assigned a corresponding point on the point scale. By summing the points of all predictors for an individual, the total points can be mapped to the “Total Points” axis, and the corresponding value on the “Predicted Risk” axis represents the individual’s probability of having depression. The included predictors are age, pain, disability, fall history, right grip strength, waist circumference, self-rated health (SRH), sleep duration, social activity level, and memory problems.

Validation of the model
The constructed depression risk prediction model was validated in the testing set (n=1111). As shown in Figure 4, ROC analysis demonstrated good discrimination: training set AUC=0.757 (95% CI: 0.738–0.775), testing set AUC=0.751 (95% CI: 0.723–0.779). Using the Youden index, the optimal threshold was 0.145, with testing set sensitivity of 62.56% and specificity of 74.91%, indicating acceptable discriminatory ability. Calibration was assessed via the R rms package with 400 bootstrap resamples and adaptive binning. Calibration metrics were excellent: training set (n=2590): mean absolute error=0.017, mean squared error=0.0004, 0.9 quantile absolute error=0.026; testing set (n=1111): mean absolute error=0.011, mean squared error=0.00016, 0.9 quantile absolute error=0.02, confirming reliable risk estimation. Decision curve analysis (DCA) with a 0–100% threshold range showed the model yielded positive net benefits at 0.1–0.8 thresholds compared with “Treat none” and “Treat all” strategies, verifying its clinical utility. Performance validation of the model. This figure includes three parts for comprehensive model validation. (a) and (d): Receiver Operating Characteristic (ROC) curve, where the Area Under the Curve (AUC) quantifies the model’s discriminatory ability to distinguish between participants with and without depression. (b) and (e): Calibration plot, showing the agreement between predicted probabilities of depression and actual observed outcomes, reflecting the model’s reliability in risk estimation. (c) and (f): Decision Curve Analysis (DCA), which evaluates the clinical utility by comparing net benefits of the model across different threshold probabilities; positive net benefits within a reasonable threshold range indicate the model’s potential value for clinical or community decision-making.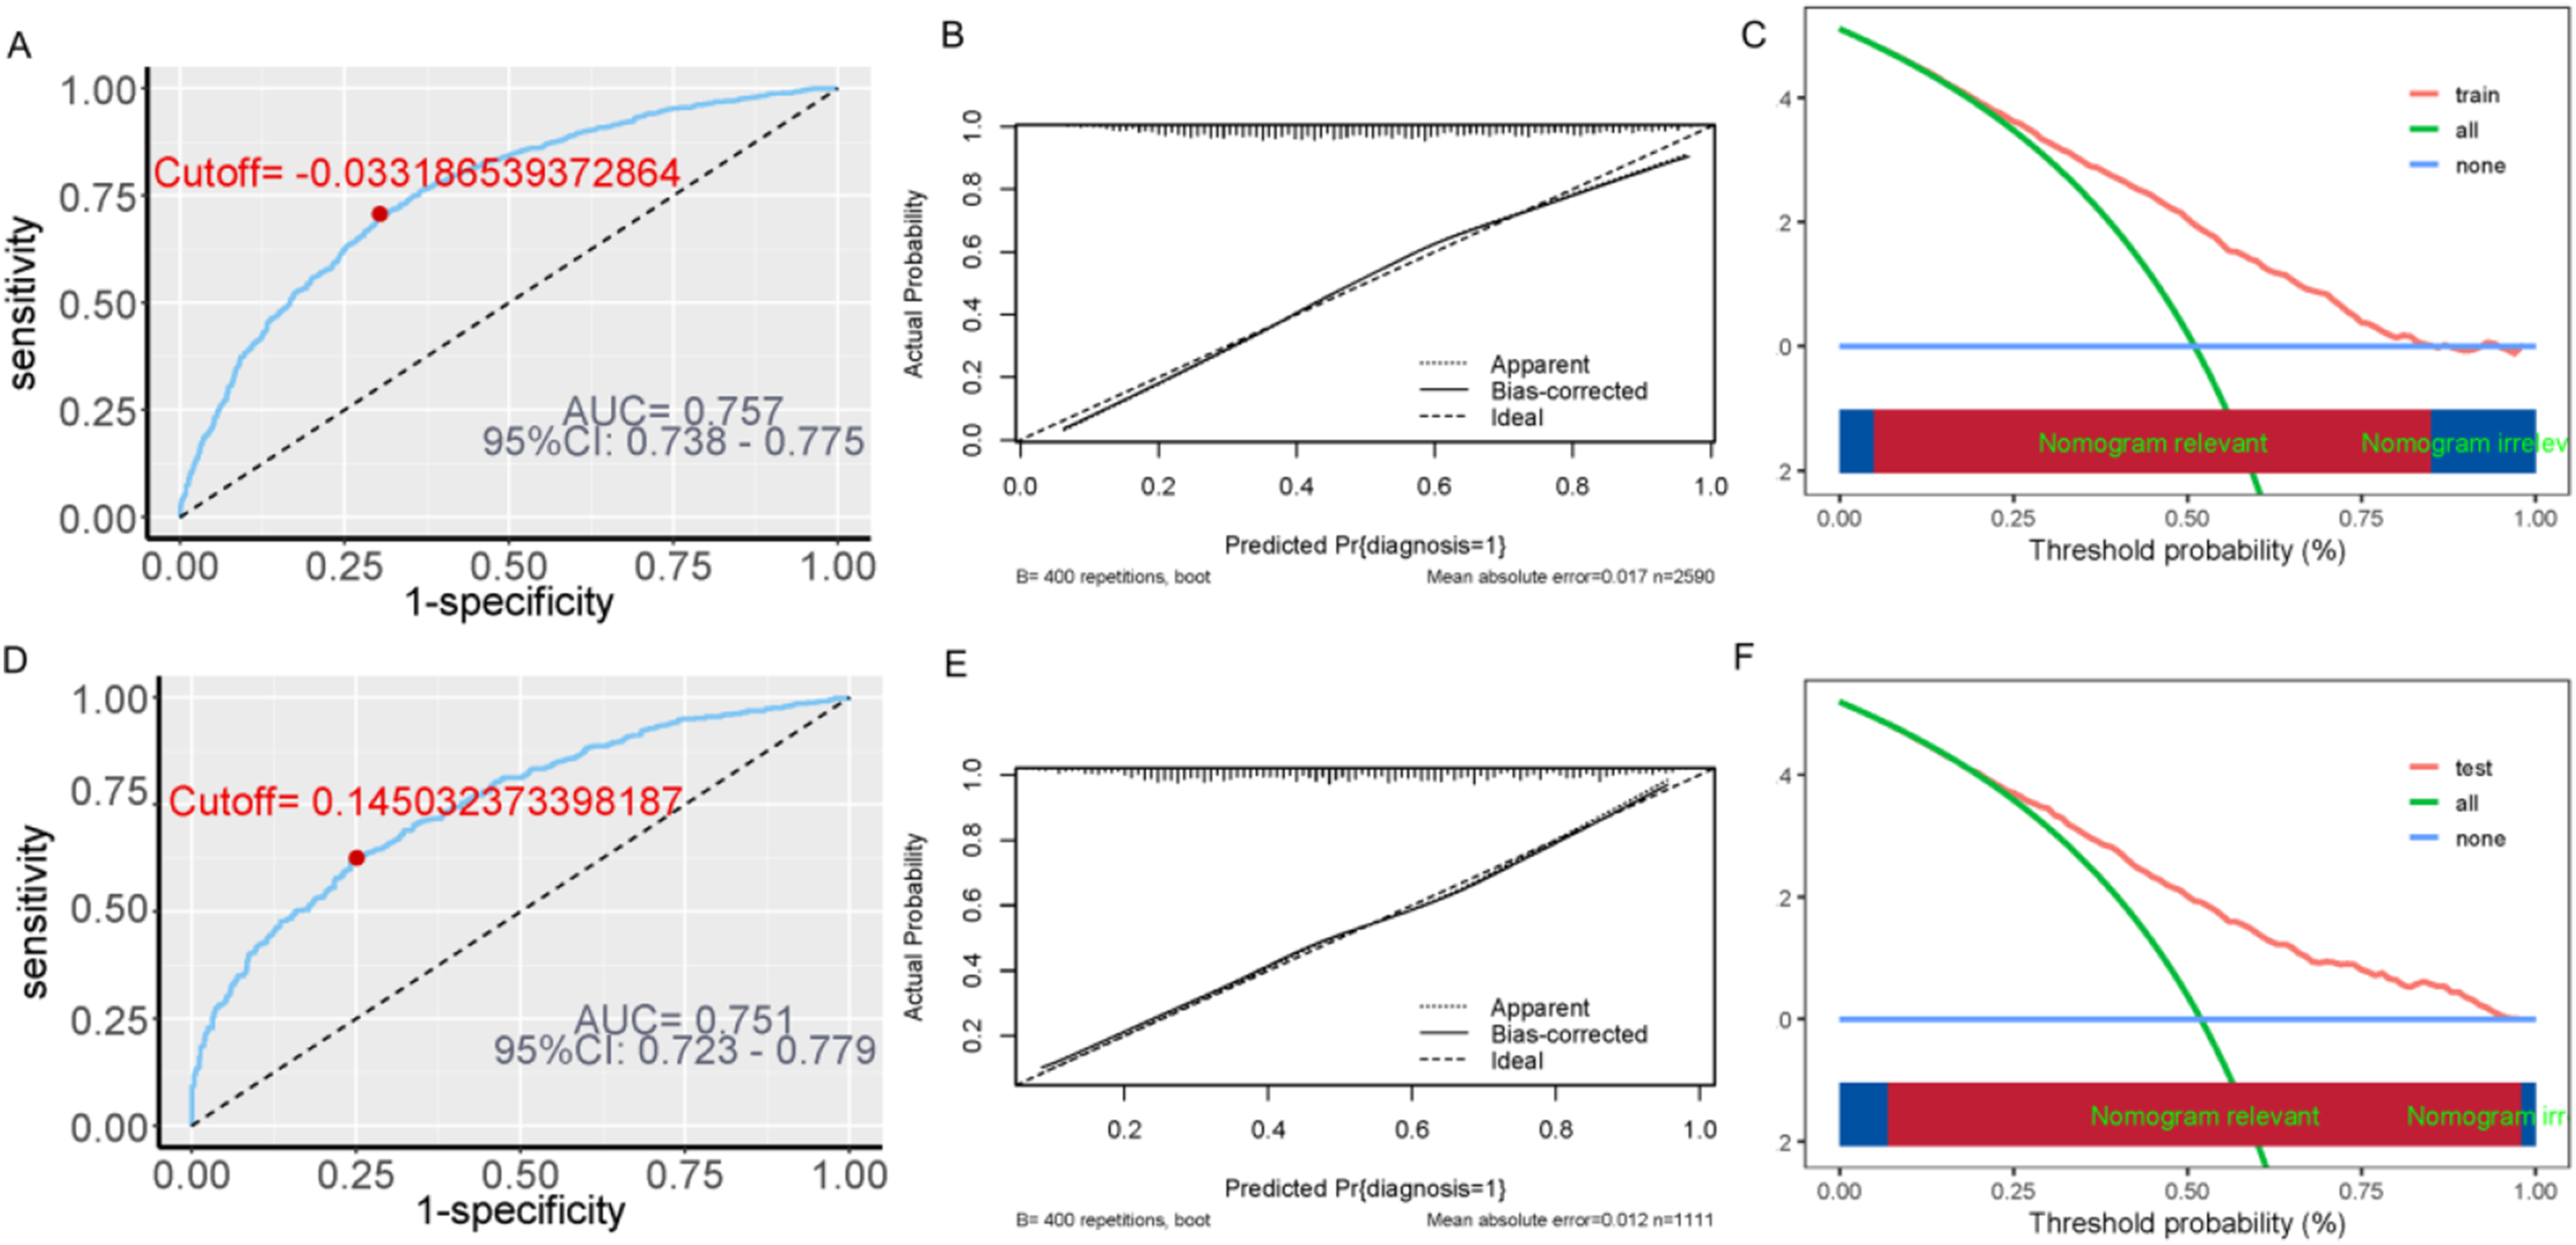
Explanation of model characteristic variables
SHAP analysis was performed to clarify the contribution of each key predictor to the depression risk prediction model (Figure 5). The ‘fastshap’ package was used to calculate SHAP values, with 100 Monte Carlo simulations and exact computation to ensure accuracy, based on the full dataset (n=3701) after multiple imputation. Categorical variables were encoded as 0 (absence) or 1 (presence), while continuous variables were retained in their original scale without additional normalization. Results showed that pain, disability, fall history, age, and right grip strength were the key influential factors. Pain and disability significantly increased depression risk, whereas higher right grip strength and self-rated health (SRH) were protective factors. This analysis enhanced the model’s interpretability by clarifying the relative importance and direction of action of each predictor. SHAP-based interpretation of key predictors in the model. This figure includes global importance, swarm, waterfall, and force plots to illustrate the contribution of each key predictor. (a): Global importance plot (reflecting the average absolute SHAP value of each variable, with pain, disability, fall history, age, and right grip strength as the top influential factors); (d): Swarm plot (showing the direction of variable effects: positive SHAP values indicate increased depression risk, while negative values indicate decreased risk); (b) and (e): Waterfall plot (visualizing the cumulative impact of predictors on individual depression risk); (c) and (f): Force plots (demonstrating how each variable’s SHAP value pushes the predicted probability away from the average baseline risk [E [f(x)]]). Higher age, more pain sites, presence of disability or fall history, and larger waist circumference are risk factors; higher right grip strength, self-rated health (SRH), social activity level, and sleep duration are protective factors.
Discussion
Principal findings
This study successfully identified 10 key predictors of depression in middle-aged and elderly adults with ADL dysfunction, encompassing demographic (age), physical symptom and functional status (pain, disability, fall history, memory problems, sleep duration, social activity level), and clinical examination (right grip strength, waist circumference) as well as subjective health (self-rated health, SRH) dimensions. The constructed nomogram, validated through ROC curves, calibration plots, and DCA, exhibited acceptable discriminatory ability and clinical utility, providing a visualized tool for individualized depression risk assessment. SHAP analysis further clarified the relative importance and action direction of each predictor: pain and disability emerged as the most prominent risk factors amplifying depression risk, while higher right grip strength and SRH served as protective factors. Additionally, advanced age, fall history, larger waist circumference, shorter sleep duration, lower social activity level, and memory problems were confirmed to increase depression risk, collectively forming a multidimensional risk profile for this vulnerable population. In clinical practice, the risk of depression in this group can be reduced by interventions such as managing pain and sleep, preventing highly disabling diseases including stroke, reducing dementia risk, preventing falls, and controlling body weight.
Comparison to prior work
Our findings align with and extend existing literature on depression correlates in older adults and functional impairment populations. 24 Consistent with previous studies, pain and disability have been repeatedly recognized as core risk factors for depression, as chronic pain triggers persistent physical distress and emotional exhaustion, while functional disability undermines autonomy and self-efficacy, fostering negative cognitive appraisals.25,26 The protective role of grip strength observed in this study echoes research linking muscular strength to mental health, where enhanced grip strength reflects better physical resilience and may mitigate the psychological impact of functional decline through improved self-perceived health and reduced dependency.27,28 Similarly, the association between poor sleep and depression is well-documented, with sleep deprivation disrupting neurotransmitter balance and neuroinflammatory pathways that regulate mood. 29 Notably, our study advances current knowledge by integrating multidimensional predictors into a practical nomogram specifically tailored to adults with ADL dysfunction, a population often overlooked in general depression prediction models. Unlike single-factor analyses or models developed for healthy older adults, our tool synthesizes demographic, lifestyle, physical, and clinical indicators, capturing the complex interplay of biological, psychological, and social determinants of depression in this high-risk group. For instance, while prior studies have highlighted the role of social activity in mental health, our findings quantify its protective effect alongside other modifiable factors (e.g., sleep duration, pain management) in the context of ADL impairment. 30 Additionally, the inclusion of waist circumference as a risk factor adds a metabolic dimension to depression risk, complementing emerging evidence linking abdominal obesity to neuroinflammation and mood disorders. 31
Strengths and limitations
This study boasts several notable strengths. First, the use of data from the nationally representative CHARLS cohort ensures a large sample size (n=3701) and broad generalizability to middle-aged and elderly adults with ADL dysfunction in China. Second, the rigorous analytical approach—combining LASSO regression for predictor selection (mitigating multicollinearity) and multivariate logistic regression for model construction—enhances the reliability and parsimony of the nomogram. Third, the integration of SHAP analysis addresses the “black box” limitation of traditional predictive models, clarifying the contribution of each predictor and facilitating clinical interpretation. Finally, the model’s validation through multiple metrics (AUC, calibration plots, DCA) confirms its discriminatory ability, reliability, and clinical utility, supporting its application in real-world settings. Despite these strengths, several limitations warrant consideration. First, the cross-sectional design is the key limitation precluding inference of temporal ordering and prospective predictive relationships, and clarified the model only identifies contemporaneous associations between variables and depressive symptoms. Longitudinal studies are needed to explore the dynamic interplay between predictors and depression over time. Second, the reliance on self-reported data (e.g., ADL function, depressive symptoms, lifestyle factors) may introduce information bias, although the use of validated scales (e.g., CESD-10) mitigates this concern. Third, the AUC of approximately 0.75 indicates acceptable but not strong discriminatory ability. Some potential confounders, such as social support quality, cognitive function, and medication use, were not included in the model due to data availability, which may limit its predictive accuracy. Fourth, the model was developed using Chinese data, and its generalizability to other ethnic or cultural groups remains to be tested. Indoor localization is relevant to depression risk modeling in middle-aged and elderly adults with ADL dysfunction, as ADL limitations often present as location-specific functional breakdowns.32,33 Due to data constraints of the CHARLS dataset (lack of indoor movement and location-linked behavior data), we did not integrate indoor localization into the current model.
Future directions
Future research should address these limitations by implementing longitudinal designs to track the trajectory of depression and its predictors among adults with ADL dysfunction, expanding the predictor set to include subdomains of social support and cognitive function, applying machine learning ensemble methods to capture nonlinear relationships among variables, integrating objective physical activity and indoor localization data from wearable devices, using longitudinal CHARLS waves to develop prospective models and reduce reverse causality, and performing external validation and calibration across diverse populations to improve generalizability and discriminatory performance. Additionally, external validation in diverse populations (e.g., different regions, ethnicities, healthcare settings) is essential to confirm its generalizability. Given the modifiable nature of several key predictors (e.g., pain, sleep, social activity), future studies could evaluate the efficacy of targeted interventions (e.g., pain management programs, sleep hygiene education, social engagement initiatives) in reducing depression risk among high-risk individuals identified by the nomogram. In subsequent prospective studies, we will collect indoor localization data (e.g., ADL-related location distribution, inter-zone movement frequency) via wearable devices, explore the role of location-linked behaviors in the ADL dysfunction-depression relationship, and refine the nomogram to enhance its predictive value. Finally, integrating the nomogram into electronic health records or developing mobile health tools could facilitate its widespread use in clinical and community settings, enabling early screening and personalized intervention.
Conclusion
This study identified 10 key predictors of depression in middle-aged and elderly adults with ADL dysfunction, namely age, pain, disability, fall history, right grip strength, waist circumference, self-rated health, sleep duration, social activity level, and memory problems. The constructed nomogram demonstrated acceptable discriminatory ability, reliability, and clinical utility through ROC curves, calibration plots, and DCA validation. SHAP analysis revealed that pain and disability had the most prominent impact on elevated depression risk, while higher right grip strength and self-rated health were protective factors. These findings highlight the value of this model for current depression risk assessment and targeted intervention among high-risk individuals; however, this model is not intended for prospective depression risk prediction and its results should be combined with clinical judgment and patient-reported symptoms for application.
Supplemental material
Supplemental material - Development and validation of a nomogram for assessing depression risk in middle-aged and elderly adults with activities of daily living dysfunction: A cross-sectional study based on CHARLS data
Supplemental material for Development and validation of a nomogram for assessing depression risk in middle-aged and elderly adults with activities of daily living dysfunction: A cross-sectional study based on CHARLS data by Ting Peng, Rujia Miao, Wen Zeng in Science Progress.
Footnotes
Acknowledgments
We are grateful to all the participants and staff of the China Health and Retirement Longitudinal Survey.
Author contributions
Funding
The authors disclosed receipt of the following financial support for the research, authorship, and/or publication of this article: This study was funded by the Natural Science Foundation of Hunan Province (2025JJ90208 and 2026JJ80446).
Declaration of conflicting interests
The authors declare that they have no known competing financial interests or personal relationships that could have appeared to influence the work reported in this paper.
Data Availability Statement
Data may be requested from the corresponding author.
Supplemental material
Supplemental material for this article is available online.
References
Supplementary Material
Please find the following supplemental material available below.
For Open Access articles published under a Creative Commons License, all supplemental material carries the same license as the article it is associated with.
For non-Open Access articles published, all supplemental material carries a non-exclusive license, and permission requests for re-use of supplemental material or any part of supplemental material shall be sent directly to the copyright owner as specified in the copyright notice associated with the article.