
Abstract
Objective
To estimate and compare the impact of malnutrition and fluid overload on mortality among patients with chronic kidney disease (CKD) undergoing renal replacement therapy (RRT), considering their frequent coexistence and potential to exacerbate underlying comorbidities.
Methods
We conducted a retrospective cohort study of patients on dialysis between January 2018 and January 2020 in six dialysis units across six Colombian cities. Multivariate analysis was conducted using multiple regression models, adjusting for clinically and statistically significant covariates. Survival at 12 months was compared between groups.
Results
A total of 807 patients were included. Of these, 154 (19.1%) presented malnutrition and 369 (45.8%) fluid overload. In multivariate analysis, malnutrition was the strongest predictor of mortality, increasing the risk of death more than sixfold compared to baseline (HR = 7.4; 95% CI: 1.7–31; p = 0.006). Fluid overload was also significantly associated with higher mortality risk (HR = 1.7; 95% CI: 1.0–2.9; p = 0.05).
Conclusions
Both malnutrition and fluid overload adversely affected survival in CKD patients undergoing RRT, with malnutrition emerging as the strongest independent risk factor for mortality.
Keywords
Introduction
Chronic kidney disease (CKD) is an increasingly prevalent condition and a growing burden for healthcare systems. 1 It is estimated to affect more than 50 million people worldwide. 2 In the United States, by 2010, approximately 70 million individuals had some degree of impaired kidney function. 3 While prevalence has stabilized in developed countries, it continues to rise in developing nations. In Colombia, the prevalence of CKD at any stage was 1.84 per 100 inhabitants in 2019, and CKD requiring renal replacement therapy (RRT) reached 86.1 per 100,000, reflecting an increase compared with previous years. 4 That same year, CKD-related mortality was 36.9 per 100,000 inhabitants, including 8.83 per 100,000 among patients receiving RRT and 10.4 per 100,000 among those with stage 5 CKD. 4 These data highlight the need to identify clinical factors associated with adverse outcomes, particularly mortality, in patients with CKD.2–4
Several factors influence survival in CKD, including demographic characteristics (age, sex, socioeconomic status), type of RRT, anemia, blood pressure control, comorbidities, fluid overload, and nutritional status.5–12 Fluid overload is a critical determinant in the evaluation, management, and prognosis of patients undergoing RRT.9–11,13 Traditionally, euvolemia has been defined as “dry weight,” corresponding to the minimum ultrafiltration weight tolerated without intradialytic symptoms of fluid overload, dehydration, or hypotension.12–14 However, this estimation is subjective and prone to inaccuracy. Fluid overload has been associated with increased mortality, with a reported hazard ratio (HR) of 1.59 (95% CI: 1.08–2.33). 14 Similarly, malnutrition has been consistently linked to higher mortality and longer hospitalizations, with muscle mass loss recognized as one of the strongest predictors.8,9 In a cohort of 200 patients with an average follow-up of 18 months, malnutrition was identified as a robust predictor of mortality. 11
Bioelectrical impedance analysis (BIA) has emerged as a practical tool for assessing body composition in CKD, offering advantages such as speed, ease of use, minimal invasiveness, and cost-effectiveness. 5 It enables evaluation of fluid distribution through the hydration index or the extracellular-to-intracellular fluid ratio, both validated as reliable indicators of fluid overload. 15 Additionally, the Global Leadership Initiative on Malnutrition recognizes BIA as a valid method for defining muscle mass loss and diagnosing malnutrition. 16 Two types of BIA are currently available, differing in wave frequency.17–19 Both have been validated for assessing body composition in CKD, with multifrequency BIA offering greater precision, although single-frequency BIA remains widely used and clinically valuable. 20
Malnutrition and fluid overload are both associated with adverse outcomes in CKD, and their coexistence is common.10–14,20 Given the limitations of traditional methods for assessing fluid status, BIA provides a practical alternative for evaluating body composition in routine clinical settings. Although previous studies have explored these factors, data evaluating their combined and independent impact on mortality in dialysis populations from Latin America remain limited. Therefore, the aim of this study was to quantify the effect of malnutrition and fluid overload on the prognosis of CKD patients undergoing dialysis and to explore the relative contribution of each factor to survival in this population using real-world multicenter data.
Methods
Study design and setting
This retrospective cohort study was conducted using data from digitized medical records of patients enrolled in dialysis programs at a renal care network in six Colombian cities: Bogotá, Medellín, Pereira, Armenia, Popayán, and Cúcuta. Patients were classified into exposed and unexposed groups according to the presence of malnutrition and/or fluid overload. Follow-up was historical, reconstructed from existing clinical records, with a duration of 12 months starting from the date of BIA. Patients were consecutively selected. The primary outcome was all-cause mortality within one year of measurement.
The study was conducted in accordance with the principles of the current Helsinki Declaration of 1975, as revised in 2024, as well as local, regional, and international regulations pertaining to clinical research. Ethical approval was obtained from the Ethics Committee of Universidad El Bosque on April 13, 2021 (Record number: 007–2021). All personal data of patients has been deleted. This was a retrospective study, and informed consent was not required. The reporting of this study conforms to STROBE guidelines. 21
Eligibility criteria
Patients were eligible if they had stage 5 CKD, were ≥18 years old, and were receiving RRT through hemodialysis or peritoneal dialysis. Additionally, patients were required to have at least one BIA measurement recorded between 2018 and 2020. Exclusion criteria included patients with stage 5 CKD not undergoing RRT. Measurements were performed by nutritionists, and data were extracted from nephrology clinical records. No standardized bioimpedance measurement protocol was applied, and no information regarding the brand or model of the device used was available.
Measurements were performed by nutritionists, and data were extracted from nephrology clinical records. Bioimpedance assessments were performed using devices available in routine clinical practice at participating centers, most commonly systems comparable to multi-frequency bioimpedance spectroscopy devices such as the Body Composition Monitor (BCM®, Fresenius Medical Care), which estimate body fluid compartments using proprietary algorithms validated in dialysis populations. However, due to the retrospective design and heterogeneity of records across centers, the specific device model and algorithm used for each measurement were not consistently documented. No standardized bioimpedance measurement protocol was applied, and the exact timing of measurements in relation to dialysis sessions was not uniformly recorded across centers.
Variables
Fluid overload was assessed using the HI, calculated from single-frequency BIA measurements of extracellular fluid (ECF) and intracellular fluid (ICF) with the formula:

Patients were classified as overhydrated with HI >90% for women and >80% for men, according to device-derived reference standards used in routine clinical practice and consistent with previous studies employing bioimpedance-based extracellular-to-intracellular water ratios to identify fluid overload.21,22 Malnutrition and protein-energy wasting (PEW) were analyzed jointly and defined by muscle mass loss, assessed using the BIA-derived phase angle.19,22 Nutritional status was categorized into six groups, from optimal to severe muscle atrophy. 23 For this study, a phase angle <4 in women and <4.5 in men was considered indicative of very poor nutritional status. The primary outcome was all-cause mortality within one year after the impedance measurement.
Sample size
Sample size was calculated using the STATCALC module of Epi Info™. Estimates were based on reported mortality incidence associated with the exposures of interest.11,18 Assuming a statistical power of 80%, a 99% confidence interval, and a significance level (α) of 0.01, the required sample size was 76 patients for the malnutrition exposure and 324 patients for fluid overload.
Data collection and management
Data were extracted from the e-Sii (Comprehensive Information System) used across the six dialysis centers. A database was constructed in Microsoft Excel and subsequently exported for statistical analysis in Stata/IC® version 16.0 (StataCorp, College Station, TX, USA).
Statistical analysis
Categorical variables were summarized as absolute and relative frequencies. Continuous variables were described using means and standard deviations for normally distributed data, and medians with interquartile ranges for non-normally distributed data. Normality was assessed using the Shapiro–Wilk test. Group comparisons were conducted using Student’s t-test for normally distributed continuous variables, Mann–Whitney U test for non-normally distributed continuous variables, and the chi-square test for categorical variables. A two-sided p value <0.05 was considered statistically significant.
For the association between exposures and outcomes, bivariate analyses were performed to estimate relative risks (RR) and risk differences for mortality within one year. Multivariate analysis was conducted using multiple regression models, adjusting for clinically and statistically significant covariates. Survival analysis was performed using Cox proportional hazards regression to estimate HR for time to death, with exposure to malnutrition and fluid overload as main predictors, adjusting for relevant confounders.
Results
General characteristics of the population.

Note. SD: Standard deviation; APD: Automated Peritoneal Dialysis; CAPD: Continuous Ambulatory Peritoneal Dialysis; PKD: Polycystic kidney disease.

Study flowchart of patients.
A total of 807 patients were included in the analysis: 438 (54.2%) without fluid overload and 369 (45.8%) with fluid overload; 653 (80.9%) without malnutrition and 154 (19.1%) with malnutrition. Patients with fluid overload were older (63.4 ± 13 vs. 51.8 ± 15 years) and had a higher prevalence of diabetes mellitus (50.4%; 186/369 vs. 17.8%; 78/438) compared to non-overloaded patients. Similarly, malnourished patients were older (63.1 ± 14 vs. 55.2 ± 15 years) and showed a higher frequency of diabetes (52.6%; 81/154 vs. 28.0%; 183/653).
Hemodialysis was the predominant modality across groups (74.8% in non-overloaded, 66.6% in overloaded; 72.4% in non-malnourished, 65.5% in malnourished), followed by automated peritoneal dialysis (20.3% in overloaded; 21.4% in malnourished). Serum albumin levels were lower among peritoneal dialysis patients, particularly in those with malnutrition (3.2 ± 0.4 g/dL).
Regarding comorbidity burden, patients with fluid overload and those with malnutrition had higher Charlson Index scores; a high index (≥4) was observed in 24.6% (91/369) of overloaded and 27.9% (23/154) of malnourished patients, compared with 9.1% (40/438) and 13.4% (88/653) in their respective comparison groups. Anemia (Hb < 10 g/dL) was more frequent in overloaded (14%; 52/369) and malnourished patients (18.8%; 29/154) than in their counterparts.
Bivariate and multivariate analysis
Relative risks for mortality according to clinical and demographic factors.

Cox regression: Characteristics independently associated with mortality.
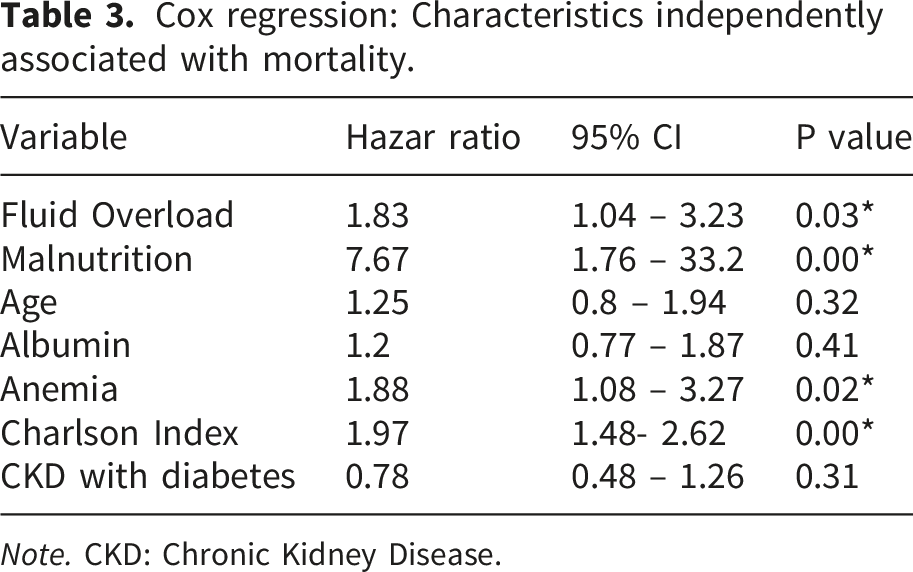
Note. CKD: Chronic Kidney Disease.
Survival
At the end of the 12-month follow-up, crude mortality was 16.5% among patients with fluid overload (61 deaths) and 21.0% among those with malnutrition (32 deaths). The mean follow-up duration was 365 days. Kaplan–Meier survival analysis demonstrated 12-month survival rates of 83% for patients with fluid overload and 79% for those with malnutrition, indicating comparable survival across both groups. However, exposure to either risk factor (fluid overload or malnutrition) was associated with an increased incidence of fatal outcomes compared with non-exposed patients (Figure 2). The difference between survival curves was statistically significant (p<0.05). Kaplan & Meier curve for exposure to malnutrition and fluid overload.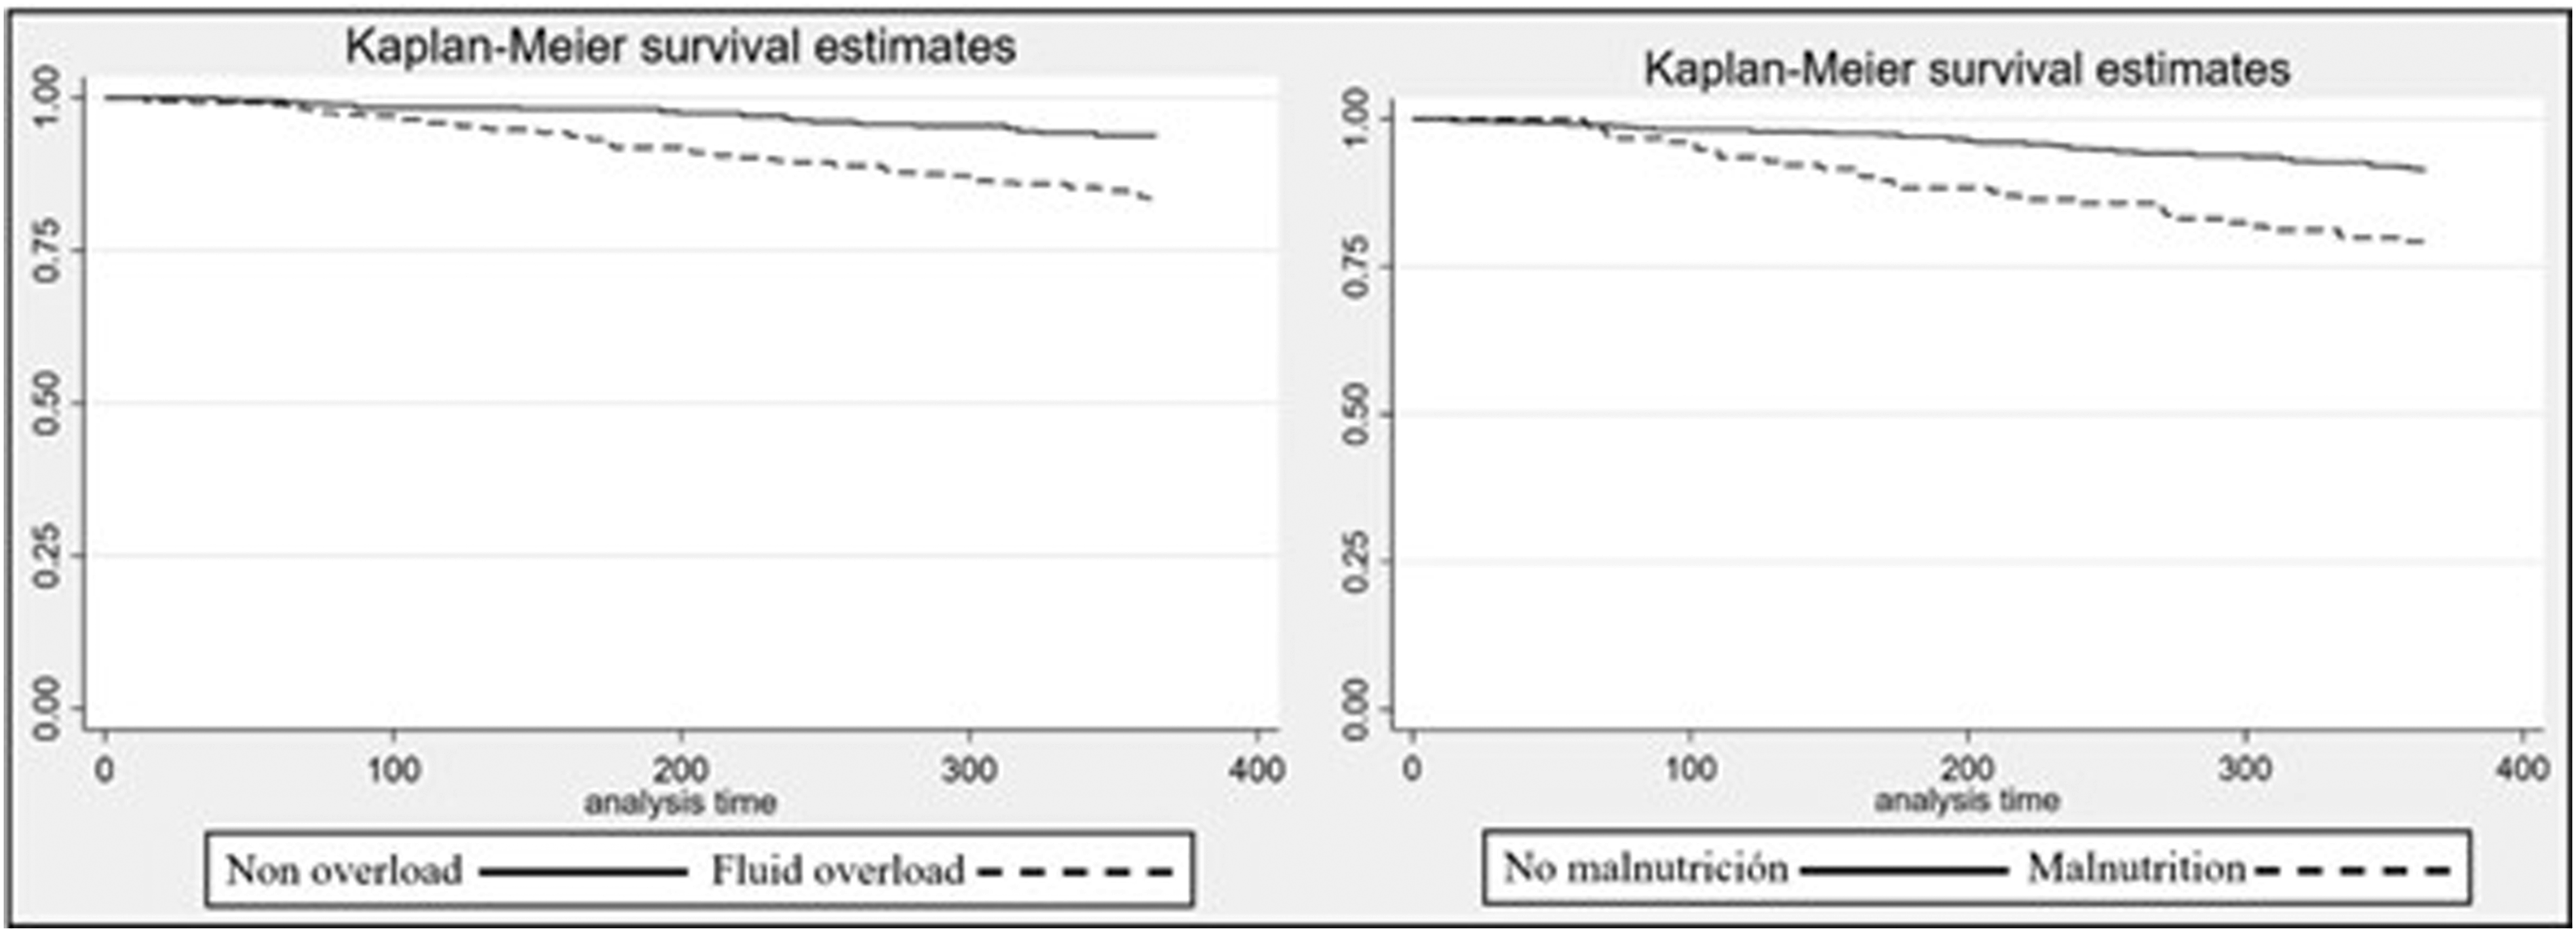
Discussion
In this multicenter cohort of dialysis patients, both malnutrition and fluid overload were common and strongly associated with adverse outcomes. Survival analysis confirmed significantly higher mortality among patients exposed to malnutrition or fluid overload, with malnutrition emerging as the strongest independent predictor. Patients with these conditions tended to be older, presented higher rates of diabetes and anemia, and had a greater comorbidity burden as reflected by Charlson Index scores. Hemodialysis was the predominant modality, although peritoneal dialysis patients with malnutrition showed lower serum albumin levels. These findings highlight the clinical relevance of nutritional and fluid status in CKD prognosis.
The present study demonstrates that both fluid overload and malnutrition exert a significant adverse impact on the survival of patients undergoing dialysis-based renal replacement therapy. Malnutrition emerged as the strongest predictor of mortality, a finding that remained robust after multivariate adjustment. Although the prognostic impact of fluid overload should not be underestimated, its association with mortality in our cohort aligns with previous evidence. A recent longitudinal study of 9,332 incident hemodialysis patients treated across seven countries found that individuals in the highest fluid overload trajectory had a significantly increased adjusted mortality risk (HR = 2.20) compared with those in the lowest trajectory, reinforcing the strong association between fluid overload and mortality in dialysis populations. 24 Nonetheless, the magnitude of risk conferred by malnutrition is particularly striking, especially considering that fluid management traditionally represents a central focus of dialysis care.
Protein-energy malnutrition and fluid overload are highly prevalent among patients with CKD and have been consistently identified as key prognostic factors in individuals undergoing RRT.10,24,25 These conditions were recognized as major clinical problems in RRT cohorts more than three decades ago and have gained increasing relevance as growing evidence demonstrates their strong association with adverse outcomes and poorer prognosis.26,27 In our cohort, the average age of patients on RRT was 60.2 years, with a notable increase in prevalence from age 50 onward, a distribution consistent with international reports of maintenance dialysis populations. 28 The sex distribution was approximately 1.3:1 (male-to-female), indicating a slight male predominance. This finding aligns with national data from Colombia’s high-cost account, where in 2019, 40.7% of incident RRT cases corresponded to females. 4
With respect to clinical characteristics, most patients in the cohort were receiving hemodialysis as their RRT modality. This predominance reflects the wider availability and implementation of hemodialysis programs compared with other modalities in the participating renal care centers. For the analysis of serum albumin, therapy-specific cutoff points were applied to account for differences in protein loss, particularly the greater loss observed in peritoneal dialysis. The leading etiologies of CKD in this cohort were arterial hypertension and diabetes mellitus, together representing 66% of the sample, consistent with their well-established role as the primary causes of CKD globally.28,29
In hemodialysis populations, a high ECF/ICF ratio can reflect not only extracellular fluid expansion but also the coexistence of malnutrition, inflammation, and vascular abnormalities such as arterial stiffness, all of which are associated with increased cardiovascular risk and mortality. 15 Therefore, the observed association between fluid imbalance and mortality in our cohort could partly reflect the combined effect of volume overload and these interrelated pathological processes, particularly in patients with protein-energy wasting, which could amplify the observed prognostic impact. 15
Consistent with our results, previous studies underscore the relevance of nutritional status in CKD prognosis.30–32 Large cohorts have shown survival improvements ranging from 9% to 34% in patients receiving supervised nutritional supplementation. 30 Moreover, the benefits of optimizing nutritional status extend beyond mortality reduction. More than two decades ago, research from Vanderbilt University highlighted significant alterations in BIA-derived nutritional indicators among dialysis patients who required hospitalization, establishing malnutrition as an independent predictor of morbidity in this population. 31 Although the present study was not designed to establish therapeutic priorities, its findings suggest that the impact of malnutrition on mortality may be more pronounced than that of fluid overload. These observations underscore the need for future research aimed at clarifying which clinical goal should take precedence in patients presenting with both conditions.
Limitations
This study has several limitations; first, malnutrition was assessed using a single bioimpedance measurement, which may not fully reflect the dynamic and multifactorial nature of nutritional status in dialysis patients. Additional nutritional biomarkers, such as prealbumin, transferrin, or serum creatinine, were not consistently available across participating centers and therefore could not be incorporated into the analysis. Likewise, inflammatory markers were not systematically collected, limiting our ability to distinguish between true nutritional deficiency and inflammation-related alterations that may also influence mortality.33,34
Second, fluid overload assessment was based on bioimpedance measurements obtained according to routine clinical practice at each center, and the exact timing relative to dialysis sessions was not uniformly documented, which may have affected volume status estimation.33,34 Although the selected parameter has demonstrated clinical relevance and practical applicability, bioimpedance analysis provides multiple complementary metrics that reflect different aspects of fluid distribution, body composition, and nutritional status. 35 The exclusive use of one parameter may therefore oversimplify the complex physiological processes involved in volume assessment and could limit the comprehensive interpretation of patients’ hydration status.33,34 Finally, no specific exclusion criteria were established for chronic comorbidities such as heart failure or cancer, which may independently affect hydration status and potentially confound bioimpedance measurements.
Furthermore, the inclusion of both hemodialysis and peritoneal dialysis patients introduces potential clinical heterogeneity due to differences in hemodynamic and volume management characteristics. Nevertheless, these findings remain meaningful, as they mirror real-world clinical practice where such comorbidities are frequent and measurements are performed without strict timing protocols, thereby enhancing the external validity of our results. Future studies should incorporate bioimpedance analysis approaches, standardized measurement protocols, and longitudinal nutritional and inflammatory assessments, as well as modality-specific analyses, to provide a more comprehensive understanding of the relationships between fluid balance, nutritional status, and clinical outcomes, including mortality, in dialysis populations.
Conclusions
In this multicenter cohort of Colombian dialysis patients, both fluid overload and malnutrition were common and significantly associated with increased mortality. Malnutrition emerged as the strongest independent predictor of death, even after adjustment for confounders, while fluid overload and anemia also conferred significant risk. These findings underscore the critical role of nutritional and fluid status in the prognosis of patients with CKD undergoing RRT.
Footnotes
Acknowledgments
The authors are most thankful for the Universidad de La Sabana and Universidad El Bosque.
Ethical considerations
The study was conducted in accordance with the principles of the current Helsinki Declaration of 1975, as revised in 2024, as well as local, regional, and international regulations pertaining to clinical research. Ethical approval was obtained from the Ethics Committee of Universidad El Bosque on April 13, 2021 (Record number: 007–2021).
Consent to participate
This is a retrospective database analysis study and the consent to participate is waived by the institutional review board.
Author contributions
VVG, JJOC, EVA, SGJ, and ETQ contributed to the conception and design. They also supervised the whole process, data collection, analysis, and interpretation of the patient data. VVG and ETQ wrote major parts of the manuscript, and JJOC revised it. All authors read and approved the final manuscript.
Funding
The authors disclosed receipt of the following financial support for the research, authorship, and/or publication of this article: This work was supported by Universidad de La Sabana and Universidad El Bosque.
Declaration of conflicting interests
The authors declared no potential conflicts of interest with respect to the research, authorship, and/or publication of this article.
Data Availability Statement
The data that support the findings of this study are available from the corresponding author upon reasonable request.