
Abstract
Background and objective
Hyperhomocysteinemia (HHCY) is regarded as a significant risk factor for both fatal and non-fatal cardiovascular incidents in chronic kidney disease (CKD) patients. The objective of this research was to investigate the association between cystatin C (CYSC) and HHCY in individuals diagnosed with CKD.
Methods
Retrospective cross-sectional study was conducted on clinical data and laboratory data of 85 individuals with CKD. The patients were divided into two distinct groups according to a threshold homocysteine (HCY) level of 15 µmol·L-1: the normal HCY group consisting of 40 cases, and the high HCY group (HHCY) comprising 45 cases. Moreover, the correlation between CYSC and HCY was examined. The correlation between CYSC and HCY was assessed. To further validate this relationship, HCY levels were measured in the culture medium following CYSC overexpression and silencing in vitro.
Results
Our study found that CYSC levels were significantly elevated in CKD-associated HHCY patients compared to CKD patients without concurrent HHCY (p < 0.05). CYSC and HCY showed a positive correlation (p < 0.05). CYSC was determined to be an Independent risk factor for CKD-associated HHCY. In vitro experiments have demonstrated that elevated levels of HCY were observed in the culture supernatants from OE-CYSC mesangial cells compared with the control and OE-negative control groups (p < 0.05). Conversely, the opposite trend occurs.
Conclusions
In conclusion, the findings suggest that CYSC may be the potential to serve as a biomarker to detect high HCY levels associated with CKD.
Introduction
Chronic kidney disease (CKD) affects over 20,000 individuals worldwide each year, and the figure is continuously rising. CKD contributes substantially to global morbidity and mortality and is also a well-established risk factor for cardiovascular disease (CVD). 1 Hyperhomocysteinemia (HHCY) is one of the most common complications of CKD. Previous studies have shown that CKD patients have significantly higher levels of homocysteine (HCY), a blood amino acid biomarker often correlated to coronary disease, compared to the general population.2,3Additionally, approximately 85–100% of end-stage renal disease (ESRD) patients develop HHCY, 4 which is recognized as a significant risk factor for both fatal and non-fatal cardiovascular incidents in CKD patients.5,6 Furthermore, Capelli I et al. demonstrated a correlation between HHCY and an increased mortality risk in CKD patients. 7 While it is possible to treat HHCY, studies suggest that treatment of HHCY does not lower the mortality rate or the occurrence of cardiovascular events among individuals with CKD.8–10 These findings indicate that prioritizing disease prevention may be more effective than focusing on treatment. Hence, developing early and precise predictions of CKD-related HHCY is imperative to optimize treatment.
The mechanism by which HHCY is induced in CKD patients has not been fully elucidated. However, the pathogenic concentrations of circulating HCY have been linked to the activation of inflammatory factors and oxidative stress levels, 11 indicating that inflammation and oxidative stress may be the primary pathogenic mechanisms.12,13 Moreover, several studies suggest that inflammation and oxidative stress are pivotal factors in advancing CKD.14,15 Previous research has shown that HCY increases oxidative stress levels by promoting the generation of reactive oxygen species (ROS) through self-oxidative processes. 16 Elevated levels of MCP-1 protein and its corresponding mRNA in the kidneys of rats with methionine-induced HHCY are dependent on the NF-κB signaling pathway. This suggests that HHCY facilitates the advancement of renal disease through the promotion of inflammatory processes. 17 Furthermore, oxidative stress and inflammation may synergize,18,19 suggesting that markers associated with inflammation or oxidative stress may be correlated with CKD-associated HHCY.
Cystatin C (CYSC) is a biomarker that reflects the renal function in CKD patients. 20 Empirical evidence indicates that impaired renal function increases the concentration of serum CYSC, with the main factor determining CYSC levels in the bloodstream being the glomerular filtration rate of CYSC. 21 Nevertheless, numerous studies indicate that CYSC directly affects various immunological disorders beyond renal disease. Cytokines can modulate the expression of CYSC coding genes during inflammatory or infectious states.22,23 Furthermore, numerous studies suggest a correlation between CYSC levels and oxidative stress,24,25 implying that CYSC may serve as a comprehensive marker reflecting inflammatory processes and oxidative stress. This study proposes that there might be a correlation between CYSC and HHCY among individuals suffering from CKD since inflammation processes and oxidative stress are the leading pathological causes of HHCY. Thus, the objective of this research was to examine the relationship between CYSC levels and CKD-associated HHCY. The provided findings enhance the comprehension of the role of CYSC in cardiovascular disorders and offer novel insights for clinical management.
Materials and methods
Subject information
From

Subject recruitment flowchart.
Criteria for hyperhomocysteinemia
The upper boundary of the reference range for HCY was established as the threshold value (Cut-off = 15 μmol/L). 28 Upon admission, CKD patients with blood HCY levels were categorized into two distinct groups: those with high HCY levels (HHCY) comprising 45 individuals, and those with normal HCY levels (NHCY) consisting of 40 individuals.
Clinical assessment and laboratory data
Clinical data collected from each patient included demographic and lifestyle variables such as age, sex, alcohol consumption (defined as more than 84–167 g of ethanol per week for at least 1 year), smoking status (defined as more than 10 cigarettes per day for at least 1 year), and history of hypertension (systolic blood pressure ≥140 mmHg or diastolic blood pressure ≥90 mmHg sustained for more than 1 year). Furthermore, a comprehensive evaluation of clinical laboratory parameters was conducted, encompassing leukocyte count (WBC), lymphocyte count (L), neutrophil count (N), platelet count (PLT), platelet crit (PCT), mean platelet volume, platelet distribution width, red blood cell distribution width, red blood cell count, hemoglobin concentration (Hb), albumin levels (ALB), glucose levels, triglyceride levels, total cholesterol, high-density lipoprotein, low-density lipoprotein, very low-density lipoprotein, apolipoprotein A1, apolipoprotein B, lipoprotein(a), hypersensitive C-reactive protein (hs-CRP), D-dimer, HCY, cholinesterase activity (CHE), CYSC, and the levels of potassium (K), sodium (Na), chlorine (Cl), calcium (Ca), phosphorus (P), magnesium (Mg), and iron (Fe). Upon patient admission, samples were meticulously collected and analyzed in accordance with the specific requirements of each indicator. These procedures were executed with precision within a 2-hour timeframe, conforming strictly to the standard operating protocols of the analytical instruments, as well as the guidelines provided by the reagent manufacturer (Sysmex Corporation, Japan; Automated Hematology Analyzer XN-1001, Sysmex Corporation, Japan; Automatic Biochemical Analyzer HITACHI LABOSPECT 008AS, Hitachi, Japan).
Cell culture
The HBZY-1 rat glomerulus-derived mesangial cell (MC) line was obtained from YEASEN (Shanghai, China). The MCs were cultivated in RPMI-1640 medium enriched with fetal bovine serum, along with streptomycin (100 μg/ml) and penicillin (100 IU/ml), under conditions of 37°C in an incubator with 5% CO2 and elevated humidity levels. To ensure the sustainability of the culture, the cells were subcultured regularly.
Reverse transcription-quantitative polymerase chain reaction
To evaluate the expression levels of the target genes, total RNA was extracted from rat MCs utilizing a TRIzol Total RNA Extraction Kit. The RNA was diluted 20-fold and its purity was assessed by evaluating the optical density (OD) at wavelengths of 260 nm and 280 nm, utilizing a UV spectrophotometer. The OD260/280 ratio ranged from 1.7 to 2.1, indicating satisfactory purity for further experiments. The RNA underwent reverse transcription to generate complementary DNA (cDNA) utilizing a kit from YEASEN, following the manufacturer's instructions. The reverse transcription-quantitative polymerase chain reaction (RT-qPCR) analysis was conducted using a LightCycler 480 Real-Time PCR System (Roche, Basel, Switzerland). The 2-ΔΔCT method was employed to calculate the expression levels of target genes, using the expression of rat β-actin for normalization. The sequences of the primers used were Rat β-actin-F: 5′-CTTCCTGGGTATGGAATCCT-3′ Rat β-actin-R: 5′-TCTTTACGGATGTCAACGTC-3′ Rat CYSC-F: 5′-CGCTCCTTGATGCTACTGCT-3′ Rat CYSC-R: -TGCCCTTGTTGTACTCGCTT. The reaction conditions for RT-qPCR included 95°C for 3 min, 95°Cfor 15 s, and 60°C for 30 s for 40 cycles. Each experiment was performed in triplicate.
Cell transfection
The MCs were allocated into five experimental groups for transfection studies:
(i) Negative control (NC): cells maintained in RPMI-1640 medium without transfection reagents; (ii) OE-NC: transfected with empty pcDNA3.1 vector (Shanghai Genemedicine, China); (iii) OE-CYSC: transfected with pcDNA3.1-CYSC overexpression vector (Shanghai Genemedicine, China); (iv) Si-NC: transfected with non-targeting scrambled siRNA (Shanghai Genemedicine, China); (v) Si-CYSC: transfected with CYSC-specific siRNA plasmid (Shanghai Genemedicine, China).
Cell transfections were carried out using Lipofectamine 2000 (Invitrogen, Waltham, MA, USA) in accordance with the manufacturer's instructions, with 2 μg of plasmid DNA or 50 nM siRNA applied per 10⁶ cells. After 48 h of incubation at 37°C in a humidified atmosphere containing 5% CO2, the transfected cells were collected for subsequent analysis. The HCY levels in the culture supernatants were measured using commercial ELISA kits (Abcam, #ab228559), following the manufacturer's protocol. Absorbance was recorded at 450 nm with reference correction at 570 nm using a BioTek Synergy H1 microplate reader. The expression of CYSC in mesangial cells was determined by RT-qPCR, with relative expression levels calculated using the 2−ΔΔCT method and normalized to rat β-actin expression.
Statistical analysis
Employing SPSS 21.0, statistical analysis was carried out. The Kolmogorov–Smirnov test was employed to assess the normality of the data. The chi-square test was utilized for the analysis of categorical data. In contrast, continuous data were assessed using the independent samples t-test (unpaired), while Pearson correlation analysis was implemented for examining linear correlations. To explore the relationship between laboratory indicators and HCY, binary logistic regression analysis was conducted. A significance threshold was established at α = 0.05.
Results
Clinical data and laboratory results of normalhomocysteinemia and hyperhomocysteinemia groups
The clinical data and laboratory parameters were analyzed for a total of 45 patients in the HHCY group and 40 patients in the NHCY group. Compared to the NHCY group, the HHCY group exhibited a significantly higher NLR, PLR, CYSC, ALB, Ca, HCY, P, and Mg, while Cl and L showed the opposite trend (p < 0.05) (Table 1).
Comparison of baseline demographic characteristics and laboratory parameters between the hyperhomocysteinemia group (HHCY) and the normohomocysteinemia group (NHCY), mean ± SD.

CYSC: cystatin C; HCY: homocysteine; NLR: neutrophil-to-lymphocyte ratio; MPV: mean platelet volume; PDW: platelet distribution width; RDW: red blood cell distribution width; RBC: red blood cell count; ALB: albumin levels; GLU: glucose levels; TG: triglyceride level; CHOL: total cholesterol; HDL-c: high-density lipoprotein; LDL-c: low-density lipoprotein; VLDL-c: very low-density lipoprotein; ApoA1: apolipoprotein A1; ApoB: apolipoprotein B; Lpa: lipoprotein; hs-CRP: hypersensitive C-reactive protein; D-D: D-dimer.
Receiver operating characteristic curve analysis for inflammation and oxidative stress-related indicators predicting chronic kidney disease-associated hyperhomocysteinemia
ROC curves were generated with NHCY and HHCY as state variables (NHCY was assigned a value of 0 and HHCY a value of 1) and CYSC, NLR, and PLR as test variables. CYSC has the largest AUC, followed by NLR and PLR (Figure 2 and Table 2).

ROC curve analysis for inflammation and oxidative stress-related indicators predicting chronic kidney disease (CKD)-associated hyperhomocysteinemia (HHCY).
Receiver operating characteristic (ROC) curve of laboratory inflammatory markers for predicting hyperhomocysteinemia (HHCY) in chronic kidney disease (CKD) patients.

CYSC: cystatin C; NLR: neutrophil-to-lymphocyte ratio.
Correlation analysis among cystatin C and homocysteinemia in individuals suffering from chronic kidney disease
A bivariate Pearson correlation analysis was conducted between CYSC and HCY in all 85 patients with CKD. A positive correlation was identified between CYSC and HCY, with a fair correlation coefficient of r = 0.367 and a significance level of p = 0.001. Conversely, no significant correlation was observed between NLR and PLR, as indicated by a p-value greater than 0.05 (Figure 3).

Correlation analysis between cystatin C (CYSC) and homocysteinemia (HCY) in individuals suffering from chronic kidney disease.
Correlation analysis between cystatin C and other laboratory indicators
A bivariate Pearson correlation analysis was performed between CYSC and other indicators that showed p-values less than 0.05 in Table 1 across all 85 patients with CKD. Substantial negative correlations (p < 0.05) were found with Cl and L, while significant positive correlations (p < 0.05) were observed between CYSC and ALB, Ca, P, and Mg (Table 3).
Correlation analysis between cystatin C (CYSC) and other laboratory indicators.
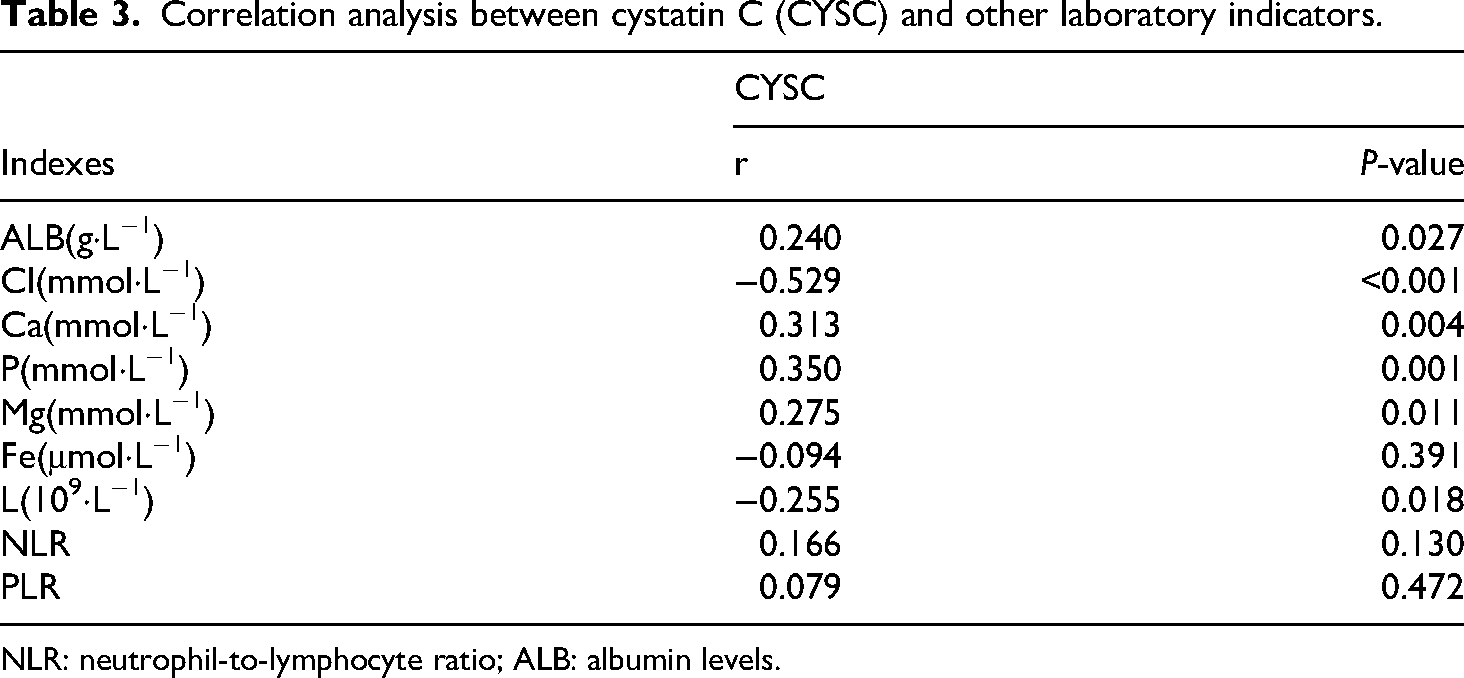
NLR: neutrophil-to-lymphocyte ratio; ALB: albumin levels.
Multifactor logistic regression model analysis for chronic kidney disease-associated hyperhomocysteinemia
Subsequently, the elements that showed significant differences between the two groups (as indicated in Table 1) were selected as meaningful variables for the study of a multifactor logistic regression model. Three models were established: Model 1 (CYSC, NLR, PLR, eGFR), Model 2 (CYSC, ALB, Cl, Ca), and Model 3 (CYSC, P, Mg, Fe). The results suggest that increased CYSC levels are a distinct major risk factor for patients with CKD who also have high levels of HCY in all three statistical models (p < 0.05) (Table 4).
Multivariate logistic regression model for chronic kidney disease-associated hyperhomocysteinemia.
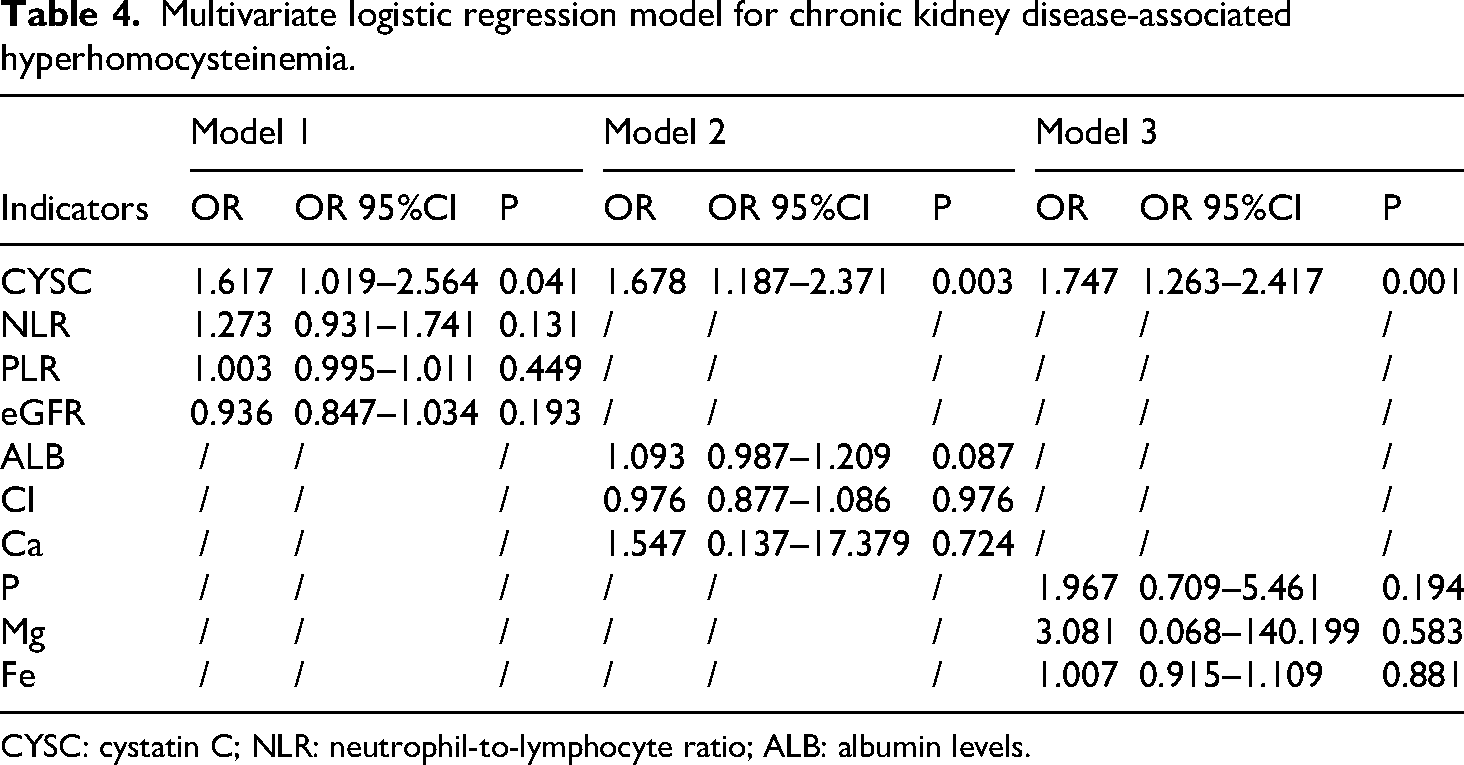
CYSC: cystatin C; NLR: neutrophil-to-lymphocyte ratio; ALB: albumin levels.
Cystatin C is directly implicated in the elevation of hyperhomocysteinemia
To investigate the role of CYSC in HHCY, MCs were divided into five groups, namely, the NC, OE-NC, OE-CYSC, Si-NC, and Si-CYSC groups. The levels of CYSC in the cells were measured by RT-qPCR to verify the overexpression and interference efficacies (Figure 4(a)). Additionally, ELISA was used to measure HCY levels in the cell culture supernatant after 48 h of incubation (Figure 4(b)). The lysates of OE-CYSC MC showed a significant increase in CYSC expression, while CYSC expression was reduced more than threefold in Si-CYSC MC, thus meeting the criteria for subsequent experiments. Elevated levels of HCY were observed in the culture supernatants from OE-CYSC MC compared with the control and OE-NC groups (p < 0.05). Conversely, reduced levels of HCY were detected in the culture supernatants from the Si-CYSC group compared with the control and Si-NC groups (p < 0.05).

Cystatin C is directly implicated in the elevation of hyperhomocysteinemia; note: (a) OE-CYSC MC showed a significant increase in CYSC expression, while CYSC expression was reduced more than threefold in Si-CYSC MC; (b) the levels of HCY were observed in the culture supernatants from OE-CYSC MC compared with the control (***p < 0.05) and OE-NC groups (*p < 0.05). Conversely, reduced levels of HCY were detected in the culture supernatants from the Si-CYSC group compared with the control (***p < 0.05) and Si-NC groups (**p < 0.05). CYSC: cystatin C; HCY: homocysteine; MC: mesangial cell; NC: negative control.
Discussion
This research examined the association between CYSC and HHCY in individuals with CKD. The primary results of this study show that individuals with CKD-associated HHCY have significantly higher levels of CYSC, which positively correlate with raised HCY levels compared to CKD patients without HHCY. Furthermore, CYSC demonstrated the highest predictive value for CKD-associated HHCY compared to other parameters, with the AUC exceeding 0.7, signifying substantial predictive capability. Furthermore, CYSC was discovered to be an independent risk factor for CKD-associated HHCY in all three adjustment models. CYSC may, therefore, be a valuable biomarker for identifying HHCY associated with CKD.
Previous research demonstrated that inflammatory processes and oxidative stress are integral factors in the initiation and advancement of CKD.29–31 Although CYSC is a well-known biomarker indicative of renal function in individuals suffering from CKD, increasing evidence indicates that CYSC is also directly involved in several immunological processes. 32 CYSC is regulated by various inflammatory mediators, influencing inflammation and its induced immune responses. For instance, CYSC is involved in regulating retinal permeability and inflammatory pathways, 33 correlates with the inflammatory state in patients with primary hypertension, 34 and serves as an inflammatory marker in stages 1–4 of CKD. 35 According to a different study, oxidative stress-induced neuronal cell death in rats involves CYSC. 25 During extended inflammation processes, there is an increase in oxygen consumption, resulting in a phenomenon known as “respiratory burst.” This leads to higher production and ROS buildup, thereby raising oxidative stress levels.36,37 Conversely, sustained oxidative stress can also lead to inflammation. 18 Therefore, oxidative stress and inflammation exhibit a mutually reinforcing impact. Research indicates that CKD contributes to CVD through mechanisms involving inflammation and oxidative stress, 38 HHCY has been shown to accelerate CKD progression by downregulating the expression of heme oxygenase-1, 5 Based on this evidence, it is reasonable to consider HHCY as a potential risk factor for CVD in patients with CKD. However, findings remain inconsistent. For instance, Adeoye M et al. reported that Hcy levels may not be a reliable predictor of CVD outcomes across populations with varying kidney function and cardiovascular risk profiles. 39 However, a community-based study in China identified elevated Hcy as an independent predictor of kidney function decline in CKD patients. 40 These discrepancies may be attributed to differences in patient grouping, inclusion criteria, and regional or ethnic variations. Similarly, a study from Germany found that after adjusting for age, sex, and renal function, plasma Hcy was not an independent predictor of major cardiovascular events in CKD patients, possibly due to differences in CKD stage distribution, the covariates included in regression models, and ethnic diversity. 41 The evidence indicates that CYSC may play a role in a detrimental loop of inflammation processes and oxidative stress, worsening the advancement of CKD and offering more understanding of immune activity in the development of CKD. Prior research has indicated that CYSC is linked to the advancement of ESRD and mortality among patients with CKD.42,43 It has also been correlated with cognitive levels in elderly patients with CKD. 44 Nevertheless, no studies have evaluated the connection between CYSC and HHCY in CKD. According to our research, CYSC levels are considerably higher in patients with CKD and HHCY than those without HHCY. Moreover, there exists a substantial positive correlation between CYSC and HCY levels, but NLR and PLR did not significantly correlate with HCY. These findings imply that the pathogenic mechanism of HHCY could not be a single source of inflammation but rather that a combination of several pathogenic mechanisms, including oxidative stress and inflammation processes in CKD patients, could be responsible for this condition. We hypothesize that CYSC may be a biomarker for predicting CKD-associated HHCY and that it may either directly or indirectly contribute to the pathophysiology of the condition because it is an independent risk factor for CKD-associated HHCY in all three adjustment models. Our in vitro experiments revealed that overexpression of CYSC in MC led to a significant increase in HCY levels in the culture supernatant, whereas silencing CYSC expression resulted in a significant decrease. These findings align with our observed positive correlation between CYSC and HCY, suggesting that CYSC directly contributes to the onset and progression of HHCY. This provides strong evidence supporting CYSC as an independent risk factor for CKD-related HHCY. NLR and PLR are widely recognized systemic inflammation indicators, extensively utilized in assessing inflammation in patients with schizophrenia and the severity evaluation of pneumonia after cerebral hemorrhage.45,46 Furthermore, studies have demonstrated associations between NLR, PLR, overall mortality rates, and inflammatory status in patients with CKD.47,48 Additionally, they have been proven as biomarkers for the progression of CKD. 49 Nonetheless, the relationship among NLR, PLR, and CKD-related HHCY has yet to be reported in existing scholarly works. According to our research, CKD-associated HHCY patients have higher NLR and PLR. Taking into account that the underlying mechanism of HHCY is associated with inflammatory processes, 12 these findings provide additional evidence to reinforce the hypothesis of a potential association between inflammatory indicators and CKD-related HHCY. However, a study by Kim et al. demonstrated an absence of a notable relationship between the values of NLR and hs-CRP levels, 50 suggesting that the increase in NLR values may not solely be attributed to systemic inflammation in CKD patients. Activation of neutrophils can lead to the production of myeloperoxidase, which elevates oxidative stress levels. 51 These results might support the complementary roles of oxidative stress and inflammation in developing CKD-associated HHCY. Thus, these findings might account for the variable NLR and hs-CRP variations in CKD patients. Our research did not find an increase in hs-CRP in HHCY patients with CKD, which is consistent with observations in the literature that there is no substantial relationship between NLR and CRP in CKD patients.
Our study has several limitations that need to be discussed. Firstly, there are only a small number of cases because this is a retrospective case–control study. Patients’ CKD stages and other medical histories were not carefully evaluated, and the number of patients in stages 1 to 2 was lower than expected. Secondly, there is a possibility of selection bias due to the limited sample size of this study. Third, other oxidative stress markers, such as superoxide dismutase, were not evaluated. Last, a prospective study was not conducted to explore the pathogenic mechanisms of CYSC in CKD-related HHCY.
In conclusion, this retrospective clinical investigation examined the association between CYSC levels and CKD-related HHCY. The results reveal a noteworthy correlation between CYSC and HHCY among patients with CKD, positioning CYSC as an independent risk factor for CKD-related HHCY. Therefore, CYSC may serve as a predictive biomarker for CKD-related HHCY.
Footnotes
Acknowledgments
We extend our gratitude to Sufang Xu and Yun Wang for their invaluable guidance and contributions to the revision of the manuscript. We also wish to acknowledge Mei Feng for her support in data analysis and project management, along with Minjie Sun for her efforts in the collection of materials and data.
Ethical approval and statement
This research adhered to the ethical standards set forth by the Ethics Committee of Anhui No.2 Provincial People's Hospital. Given the retrospective design of the study, the Ethics Committee granted a waiver for the necessity of obtaining informed consent. Following a preliminary and expedited review process, approval for both participation and publication was obtained, and it is noteworthy that a clinical trial number was deemed irrelevant for this study.
Author contributions
The initial manuscript was written and revised by BL; significant modifications to the manuscript were made by YW and SX; data collection and analysis were conducted by MS, while MF handled project management.
Funding
The authors disclosed receipt of the following financial support for the research, authorship, and/or publication of this article: Specifically, this study was funded by the Natural Science Key Project Foundation of the Anhui Province Education Department, along with the general project grant from the Anhui Provincial Health Commission (grant number KJ2019A1099, AHWJ2023BAa20108).
Declaration of conflicting interests
The authors have disclosed that there are no potential conflicts of interest pertaining to the research, authorship, and/or publication of this article.
Data availability statement
The datasets produced and/or examined throughout the present investigation can be obtained from the corresponding author upon a reasonable request, provided that the requisite data is included within the manuscript or supplementary information files.