
Abstract
Objective
In older adults with Type 2 diabetes mellitus (T2DM), the risk of delirium is significantly increased, driven by neuropathological alterations stemming from chronic insulin resistance. We utilized artificial intelligence and geriatric electronic health records to create an interpretable online machine-learning algorithm for predicting delirium risk. This tool facilitates prompt identification of high-risk elderly T2DM patients, enabling optimized interventions and improved clinical outcomes.
Methods
This retrospective cohort study identified older adults with T2DM using International Classification of Diseases (ICD) codes, with delirium defined by the Confusion Assessment Method for the intensive care unit (CAM-ICU). We extracted baseline demographics, vital signs, laboratory measurements, comorbidities and clinical severity scores. Candidate predictors for eight machine-learning algorithms were selected using least absolute shrinkage and selection operator regression and the Boruta method. Discrimination was assessed using accuracy, sensitivity, specificity and the F1 score. The final model was interpreted using SHapley Additive exPlanations (SHAP) and deployed as an online risk calculator.
Results
Integrating dual feature selection methods identified 14 key predictors and the gradient boosting machine (GBM) model accurately predicted delirium risk in elderly patients with T2DM, demonstrating strong discriminatory performance with robust calibration in both internal and external validation. SHAP analysis highlighted the Glasgow Coma Scale, ICU length of stay and Sequential Organ Failure Assessment score as the predominant contributors to model predictions. The model was successfully deployed as an accessible online tool and the accompanying web-based calculator enables rapid, personalized risk assessment to support early intervention in ICU settings.
Conclusions
The GBM model showed strong performance in predicting delirium risk among elderly patients with T2DM, supporting clinically meaningful risk stratification. The accompanying web-based calculator enables rapid, individualized bedside assessment and may facilitate early identification of high-risk patients and timely intervention in ICU settings.
Keywords
Introduction
Type 2 diabetes mellitus (T2DM) is a metabolic disorder defined by chronic hyperglycemia and is increasingly prevalent in older adults, underpinned by sustained dysregulation of carbohydrate, lipid and protein metabolism. T2DM is associated with a higher risk of mild cognitive impairment and accelerated decline in learning and memory. Diabetes-related neuropathy further compromises quality of life and reduces capacity for activities of daily living. With the global burden of T2DM continuing to rise, epidemiological projections estimate a prevalence of 7079 per 100,000 by 2030, underscoring T2DM as a major public health challenge.1–3
Delirium is an acute neuropsychiatric syndrome that commonly affects critically ill patients in intensive care units (ICU) and is triggered by diverse organic insults and functional disturbances. It is associated with poorer treatment adherence, longer hospital stays, greater sedative exposure, prolonged mechanical ventilation (MV) and increased mortality. In older adults, delirium presents as an abrupt disturbance of attention, awareness and cognition, with a fluctuating course that often shows circadian variation. Its heterogeneous clinical manifestations contribute to underrecognition and diagnostic difficulty. Because delirium arises from interacting pathophysiological pathways, prevention is generally more effective than treatment.4,5 Reportedly, T2DM is a major risk factor for delirium, older adults with T2DM have a heightened risk of delirium due to chronic insulin resistance–related neuropathological changes.6–8 Delirium in the ICU is mainly assessed with the Confusion Assessment Method for the ICU (CAM-ICU) and the Intensive Care Delirium Screening Checklist (ICDSC), both of which require repeated, serial assessments to confirm the diagnosis.9,10 However, existing delirium risk models remain suboptimal for bedside use because most are derived from unselected ICU populations and do not specifically address older adults with T2DM, a high risk subgroup with distinct pathophysiology and exposure profiles. Early identification of T2DM-related delirium risk is therefore essential to guide preventive strategies and improve outcomes.11,12
With the rapid advancement of artificial intelligence and the accumulation of longitudinal geriatric cohort studies and electronic health record data, new opportunities have emerged for applying machine learning in ageing research. 13 Compared to traditional statistical methods, machine learning can more effectively leverage expanding healthcare data to enhance prediction model accuracy and computational efficiency. Recent pipeline-based machine-learning frameworks have further demonstrated the feasibility and robustness of automated feature selection, model optimization and early disease prediction in metabolic disorders such as diabetes. While traditional statistical approaches remain suitable for simple linear problems, they struggle to resolve complex nonlinear relationships and are typically limited to small-scale datasets, demonstrating restricted analytical capacity for high-dimensional data.14,15 Conversely, machine learning can process large-scale, high-dimensional data, identify associations among complex variables and screen for optimal predictors of clinical outcomes, thereby significantly improving prediction precision.16,17 In parallel with advances in predictive analytics, diabetes care is moving toward more precise, targeted strategies, including nanocarrier-based drug delivery systems that aim to improve pharmacokinetics and therapeutic efficacy.18,19 This shift heightens the need for early, accurate risk stratification to direct intensified interventions to those most likely to benefit. Accordingly, we aim to develop an online, interpretable machine-learning tool to estimate delirium risk in older adults with T2DM, enabling early identification of high-risk patients and timely optimization of management to reduce delirium and improve outcomes.
Methods and materials
Data source and ethical considerations
This study was conducted under the PhysioNet data use agreement using the publicly available, fully deidentified Medical Information Mart for Intensive Care (MIMIC)-III (v1.4; 2001–2012) and MIMIC-IV (v3.1; 2008–2022) databases. All investigators completed the required human-subjects training before data access (certification ID: 66380198). Because MIMIC data are fully deidentified, institutional review board approval and informed consent were waived by the original ethics boards at the source institutions (Massachusetts Institute of Technology and Beth Israel Deaconess Medical Center); no additional consent was required for this secondary analysis. The study adhered to the Declaration of Helsinki and its 2024 revision and is reported in accordance with the STROBE guidelines. 20 Neither the manuscript nor the accompanying online tool contains any identifiable personal information.
Selection and definitions of variables
All data in this study were extracted from the MIMIC databases using structured query language. The extracted data included: (1) Demographic information: age, gender, weight, ICU length of stay; (2) Vital signs within 24 h of ICU admission: heart rate (HR), respiratory rate, systolic blood pressure (SBP), diastolic blood pressure, mean arterial pressure (MAP), body temperature, percutaneous arterial oxygen saturation; (3) Laboratory test results: red blood cell (RBC), white blood cell (WBC), platelet, hemoglobin, hematocrit, red blood cell distribution width (RDW), international normalized ratio (INR), prothrombin time, activated partial thromboplastin time (APTT), creatinine, blood urea nitrogen, partial pressure of oxygen, partial pressure of carbon dioxide, PH, lactate, anion gap, bicarbonate, calcium, magnesium, phosphate, chloride, potassium, sodium, glucose; (4) severity scores, such as Glasgow Coma Scale (GCS), sequential organ failure assessment (SOFA); (5) comorbidities: hypertension, acute kidney injury (AKI), cerebrovascular accident (CVA), chronic kidney disease (CKD), chronic bronchitis (CB), myocardial infarction (MI), sepsis; (6) interventions: MV, continuous renal replacement therapy (CRRT), vasopressors (VP), sedatives. Operational definitions and data sources for all variables are summarized in Supplemental Table S1. Missing values were addressed using multiple imputation (m = 5) to limit bias and preserve statistical power. The extent and pattern of missingness are presented in Supplemental Figure S1.
Study population
We conducted a secondary analysis of two publicly available critical care databases (MIMIC-III and MIMIC-IV); the study workflow is shown in Figure 1. Older adults with T2DM were identified using relevant ICD-9 and ICD-10 diagnosis codes. Delirium during the ICU stay was assessed using the CAM-ICU, in accordance with the 2013 Society of Critical Care Medicine guidelines. The CAM-ICU evaluated four features: (1) acute onset or fluctuating course, (2) inattention, (3) disorganized thinking and (4) altered level of consciousness. Delirium was diagnosed when features (1) and (2) were present together with either feature (3) or (4).

The comprehensive research flowchart.
We excluded patients with (1) schizophrenia, dementia, diabetic ketoacidosis or hyperosmolar hyperglycemic state; (2) an ICU length of stay shorter than 24 h; (3) a nonfirst ICU admission; (4) implausible extreme values in vital-sign records; (5) age younger than 65 years; (6) more than 30% missing data in key variables. Only participants who met all inclusion criteria and none of the exclusion criteria were included in the final analysis.
Feature selection and model construction
This study employed random sampling to allocate enrolled patients into training and validation sets at a 7:3 ratio. The training set was primarily used for feature selection and model training, while the validation set served for independent assessment of model performance. To identify potential predictive variables within the training set, two distinct methods were utilized to screen baseline variables: Least Absolute Shrinkage and Selection Operator (LASSO) Regression and the Boruta algorithm. LASSO regression was used to perform feature selection by applying L1 regularization, which shrinks the coefficients of redundant features to zero. 21 This model excels with high-dimensional data, effectively mitigates overfitting and provides coefficient estimates that facilitate the assessment of feature importance. The Boruta algorithm evaluates feature importance based on random forests, selecting features by comparing the importance of original features against that of “shadow” features. 22 This algorithm efficiently handles high-dimensional data and yields more robust assessments of feature importance. To strengthen the robustness of feature selection, reduce overfitting, improve clinical interpretability and ensure feasibility for an online calculator, we constructed the prediction model using the intersection of variables selected by LASSO regression and the Boruta algorithm. This conservative approach retains predictors that are consistently identified by both sparse penalized regression and Random-Forest–based importance ranking, thereby limiting model-dependent selection bias and improving generalizability while avoiding potentially redundant or unstable predictors that might arise from a union strategy. Variables selected by each method and their overlap are shown in Supplemental Table S2.
Given the relatively low incidence of delirium among ICU patients, the dataset exhibited substantial class imbalance, which may bias model training toward the majority class and consequently impair recognition of minority-class events, thereby undermining model robustness and diagnostic performance. To mitigate this issue, supplementary analyses were conducted using resampling strategies, including oversampling, undersampling and the Synthetic Minority Over-sampling Technique (SMOTE), to construct more balanced training datasets. All resampling procedures were applied exclusively to the training set. After resampling, both classes were balanced at 3684 observations per class, which effectively reduced distributional bias and improved the model's ability to identify minority-class outcomes such as delirium. We compared the performance of eight machine-learning algorithms for predicting delirium risk in older adults with T2DM. These algorithms included adaptive boosting (AdaBoost), categorical boosting (CatBoost), light gradient boosting machine (LightGBM), extreme gradient boosting (XGBoost), logistic regression (LR), support vector machine (SVM), gradient boosting machine (GBM), K-nearest neighbors (KNN) and neural network (NN). Internal validation was performed using a training and validation split strategy, with 70% of the data allocated to the training set and 30% to the internal validation set, rather than using cross-validation as the final internal validation approach. Using the caret framework in R, hyperparameter optimization and model stability assessment were conducted exclusively within the training set via repeated 10-fold cross-validation with five repeats combined with grid search. Detailed parameter settings are provided in Supplemental Table S3. 23 For the GBM model, tuning ranges were defined in accordance with established methodological guidance indicating that smaller learning rates (shrinkage, typically below 0.1) enhance generalization when combined with a sufficiently large number of boosting iterations, reflecting the fundamental tradeoff between shrinkage and model complexity. Accordingly, the candidate search space was expanded to include entrees ranging from 100 to 500 and shrinkage ranging from 0.05 to 0.10. The optimal hyperparameter combination was identified through cross-validated grid search. Following model optimization, performance was evaluated in an independent internal validation cohort and generalizability was further assessed using an external validation dataset.24–26
Model discrimination, calibration and potential clinical benefit were comprehensively evaluated using receiver operating characteristic curve analysis, calibration curves and decision curve analysis. In addition, classification performance metrics were reported, including accuracy, sensitivity, specificity, F1 score, Cohen's kappa, positive predictive value (PPV) and negative predictive value(NPV), to provide an integrated assessment of predictive performance. Differences in areas under the receiver operating characteristic curves between models were statistically compared using DeLong's test to further assess the robustness of model discrimination. This hierarchical validation and tuning strategy was designed to minimize the risk of information leakage and to provide an unbiased estimate of model performance on previously unseen data.
To enhance interpretability of the optimal model, SHapley Additive exPlanations (SHAP) were applied to quantify the relative contribution of individual predictors and to elucidate the pathways through which key features influenced model outputs. Based on this model, a dynamic online risk assessment tool was developed and deployed using the Shiny platform to facilitate clinical translation and real-world application.
Statistical analysis
Statistical analyses were conducted using R software (version 4.4.2). Given the retrospective observational design, conventional statistical tests were applied solely to describe and compare baseline characteristics between patients with and without delirium and were not used for model development. Continuous variables are reported as mean with standard deviation if approximately normally distributed, or as median with interquartile range (IQR) otherwise. Between-group comparisons for normally distributed variables were performed using an independent (unpaired) two-sample Student's t test. Welch's t test was used when the assumption of homogeneity of variance was violated. For nonnormally distributed variables, the Wilcoxon rank-sum test (Mann–Whitney U test) was applied. Categorical variables are presented as counts (percentages) and were compared using the chi-square test or Fisher's exact test, as appropriate. All tests were two sided, with a significance threshold of p < .05. For predictive model development, sample size adequacy was evaluated using the events-per-variable (EPV) principle. In the training cohort, 1228 delirium events were observed among 4509 participants, with 48 candidate predictors, yielding an EPV of approximately 25.6. This value exceeds the commonly recommended minimum of 10 and supports the statistical stability and reliability of the predictive modeling process.
Results
Baseline characteristics of the study cohort
This study enrolled 6440 elderly patients with T2DM from the MIMIC-IV database to form the primary cohort (of whom 1754 developed delirium, accounting for 27.2%) and extracted 823 patients from the MIMIC-III database as an external validation set (391 with delirium, 47.5%). The detailed screening process is shown in Figure 1. Table 1 shows significant differences in multiple clinical characteristics between the delirium and nondelirium groups: The delirium group had a marginally higher proportion of males (57% vs 55%, p = .289) and a higher median age (76 years [IQR: 71–83] vs 75 years [IQR: 70–81], p < .001). Regarding comorbidities, the delirium group had higher proportions of AKI, sepsis, CKD and a history of CVA compared to the nondelirium group. In terms of disease severity, the delirium group had a higher median SOFA score, a lower median GCS score and a longer ICU length of stay (3.69 days vs 2.3 days, p < .001). For treatment interventions, the delirium group had significantly higher rates of receiving MV, CRRT, VP and sedatives. Laboratory indicators revealed that the delirium group had elevated white blood cell counts, lactate and creatinine levels, along with coagulation abnormalities and acid–base imbalances. In contrast, there were no statistically significant differences between the two groups in gender, weight, hypertension, CB, history of MI, or vital signs such as HR and blood pressure (p > .05). These results suggest that elderly patients with delirium are more critically ill, exhibit more prominent multiorgan dysfunction and inflammatory responses and require more aggressive life-supportive therapies.
Baseline characteristics of delirium and nondelirium.
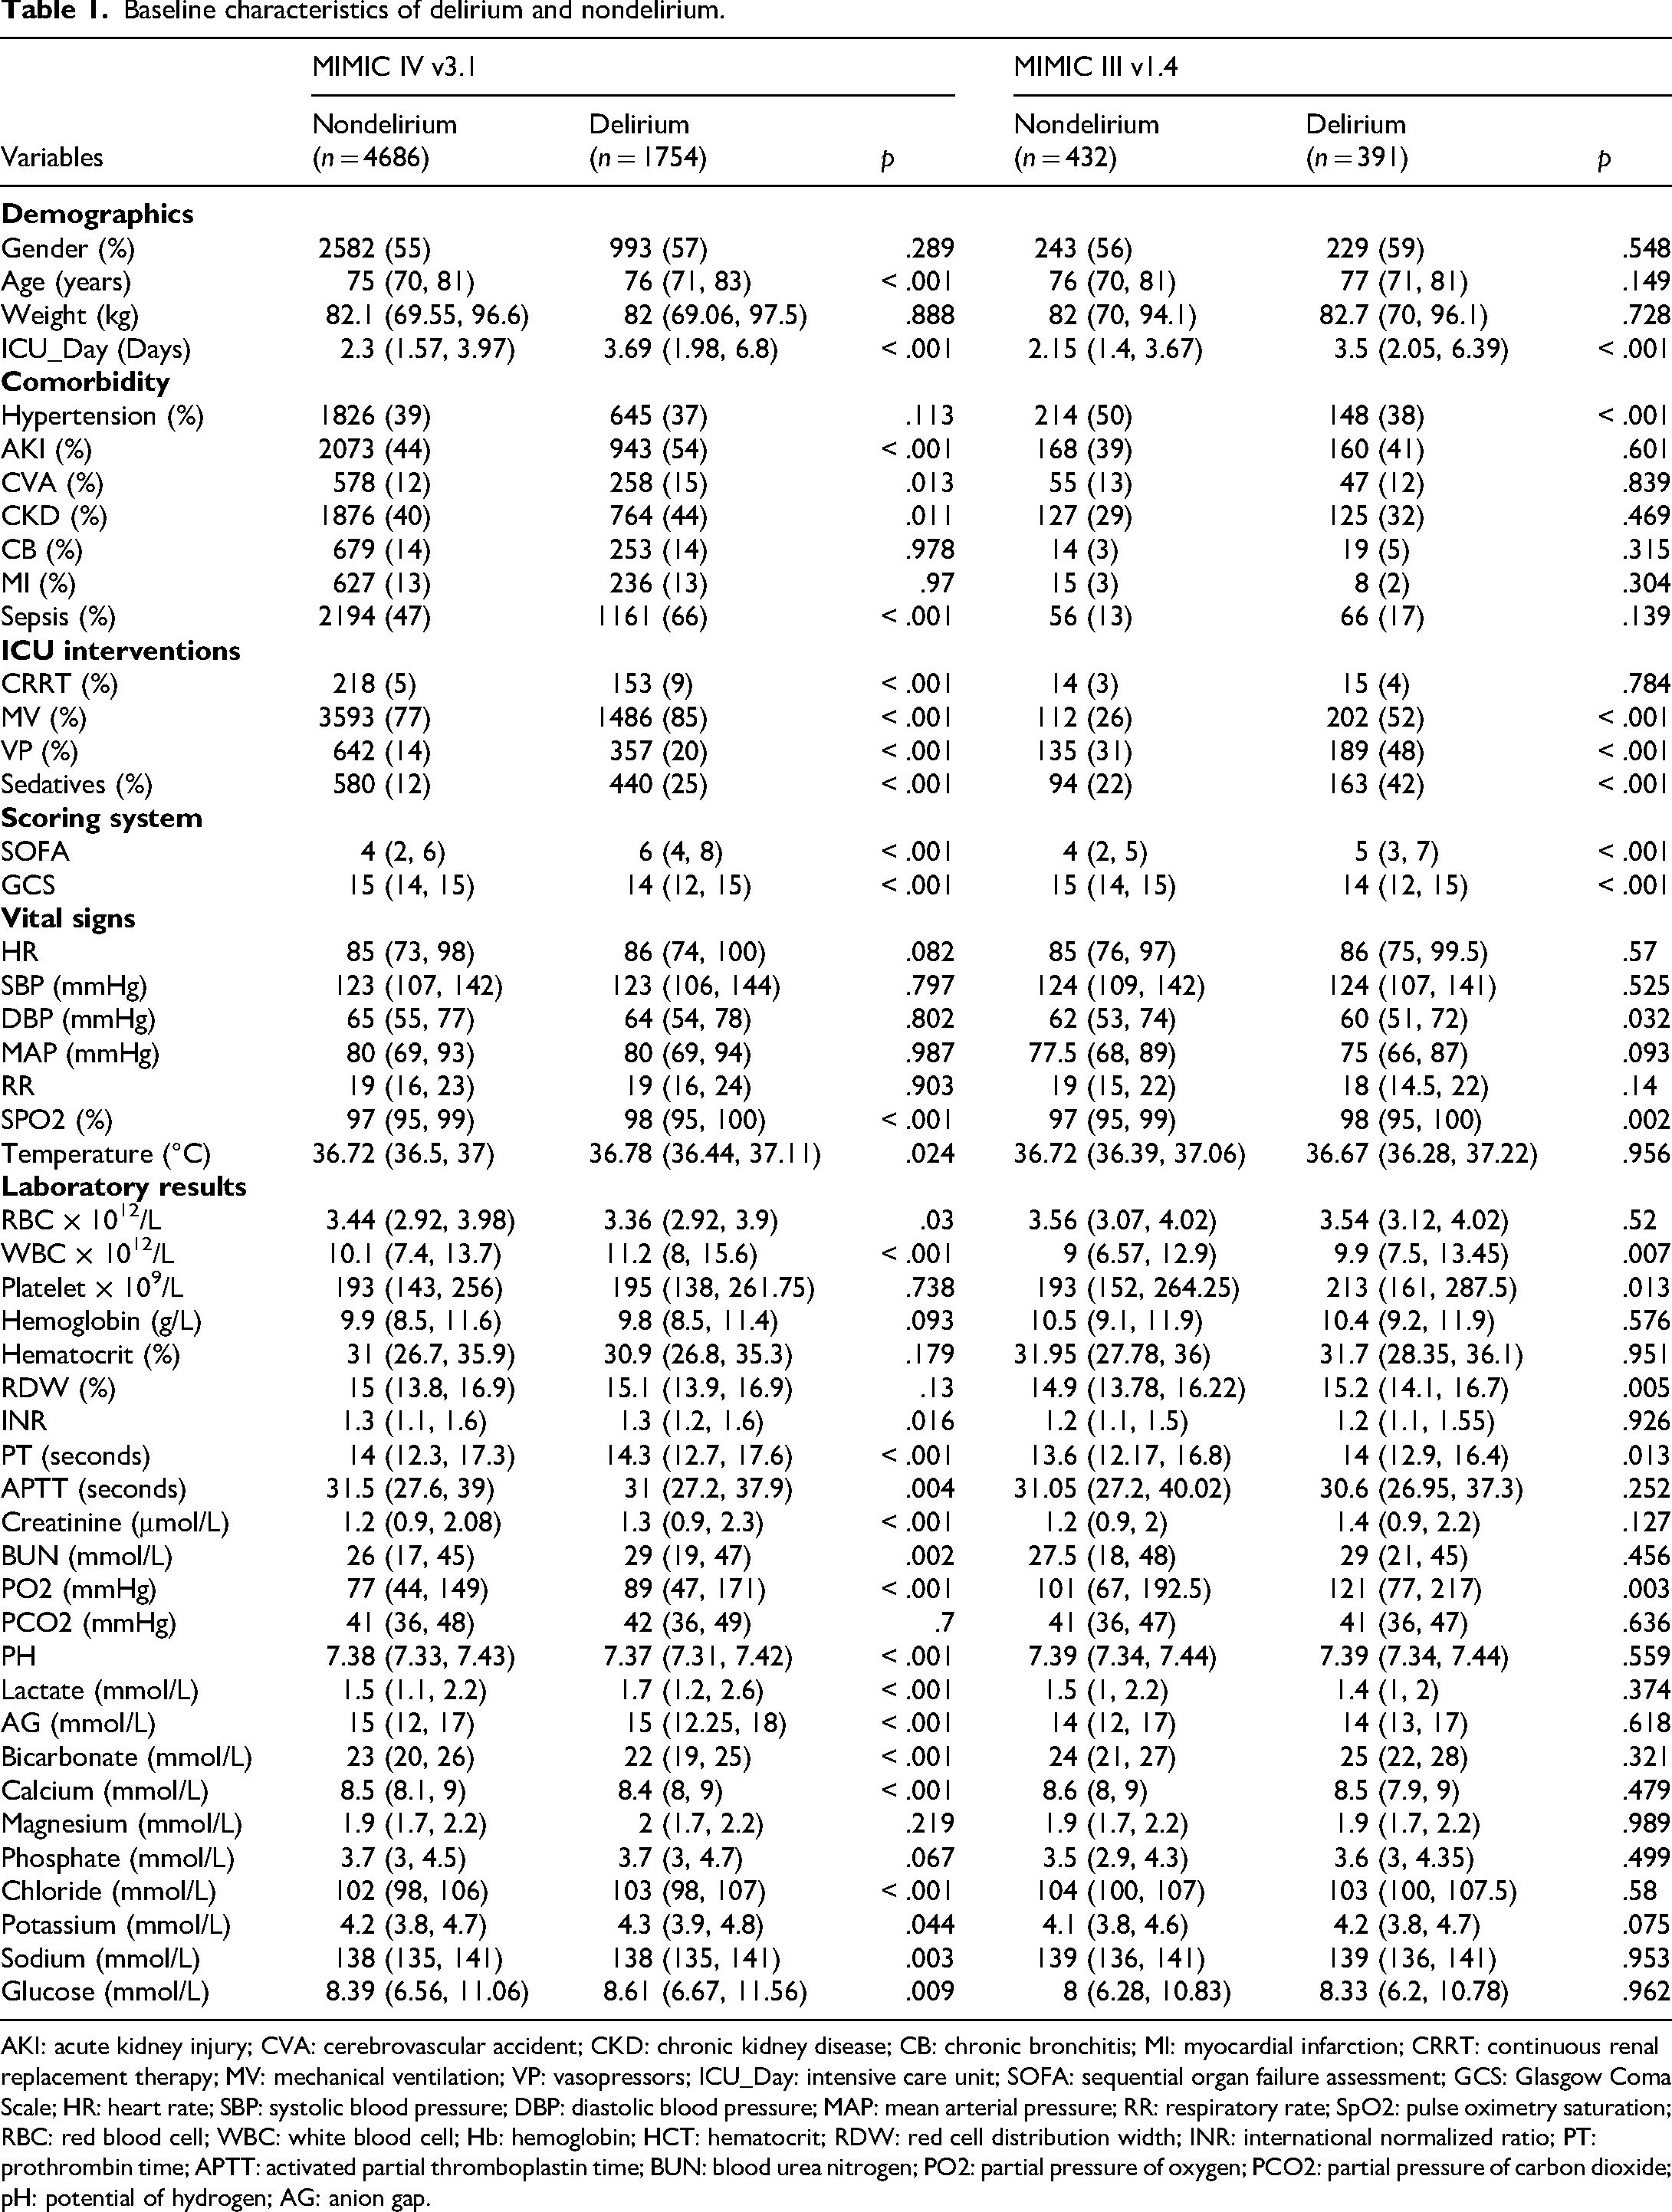
AKI: acute kidney injury; CVA: cerebrovascular accident; CKD: chronic kidney disease; CB: chronic bronchitis; MI: myocardial infarction; CRRT: continuous renal replacement therapy; MV: mechanical ventilation; VP: vasopressors; ICU_Day: intensive care unit; SOFA: sequential organ failure assessment; GCS: Glasgow Coma Scale; HR: heart rate; SBP: systolic blood pressure; DBP: diastolic blood pressure; MAP: mean arterial pressure; RR: respiratory rate; SpO2: pulse oximetry saturation; RBC: red blood cell; WBC: white blood cell; Hb: hemoglobin; HCT: hematocrit; RDW: red cell distribution width; INR: international normalized ratio; PT: prothrombin time; APTT: activated partial thromboplastin time; BUN: blood urea nitrogen; PO2: partial pressure of oxygen; PCO2: partial pressure of carbon dioxide; pH: potential of hydrogen; AG: anion gap.
To investigate variable correlations, we constructed a bar chart displaying each variable's association with the target metric (Figure 2(a)) and developed a heatmap illustrating correlations among the variables themselves (Figure 2(b)). Violin plots were generated to compare ICU length of stay between patients experiencing delirium and those without. This analysis demonstrated a significantly prolonged hospital stay in the delirium group compared to the nondelirium group (Figure 2(c) and (d)).
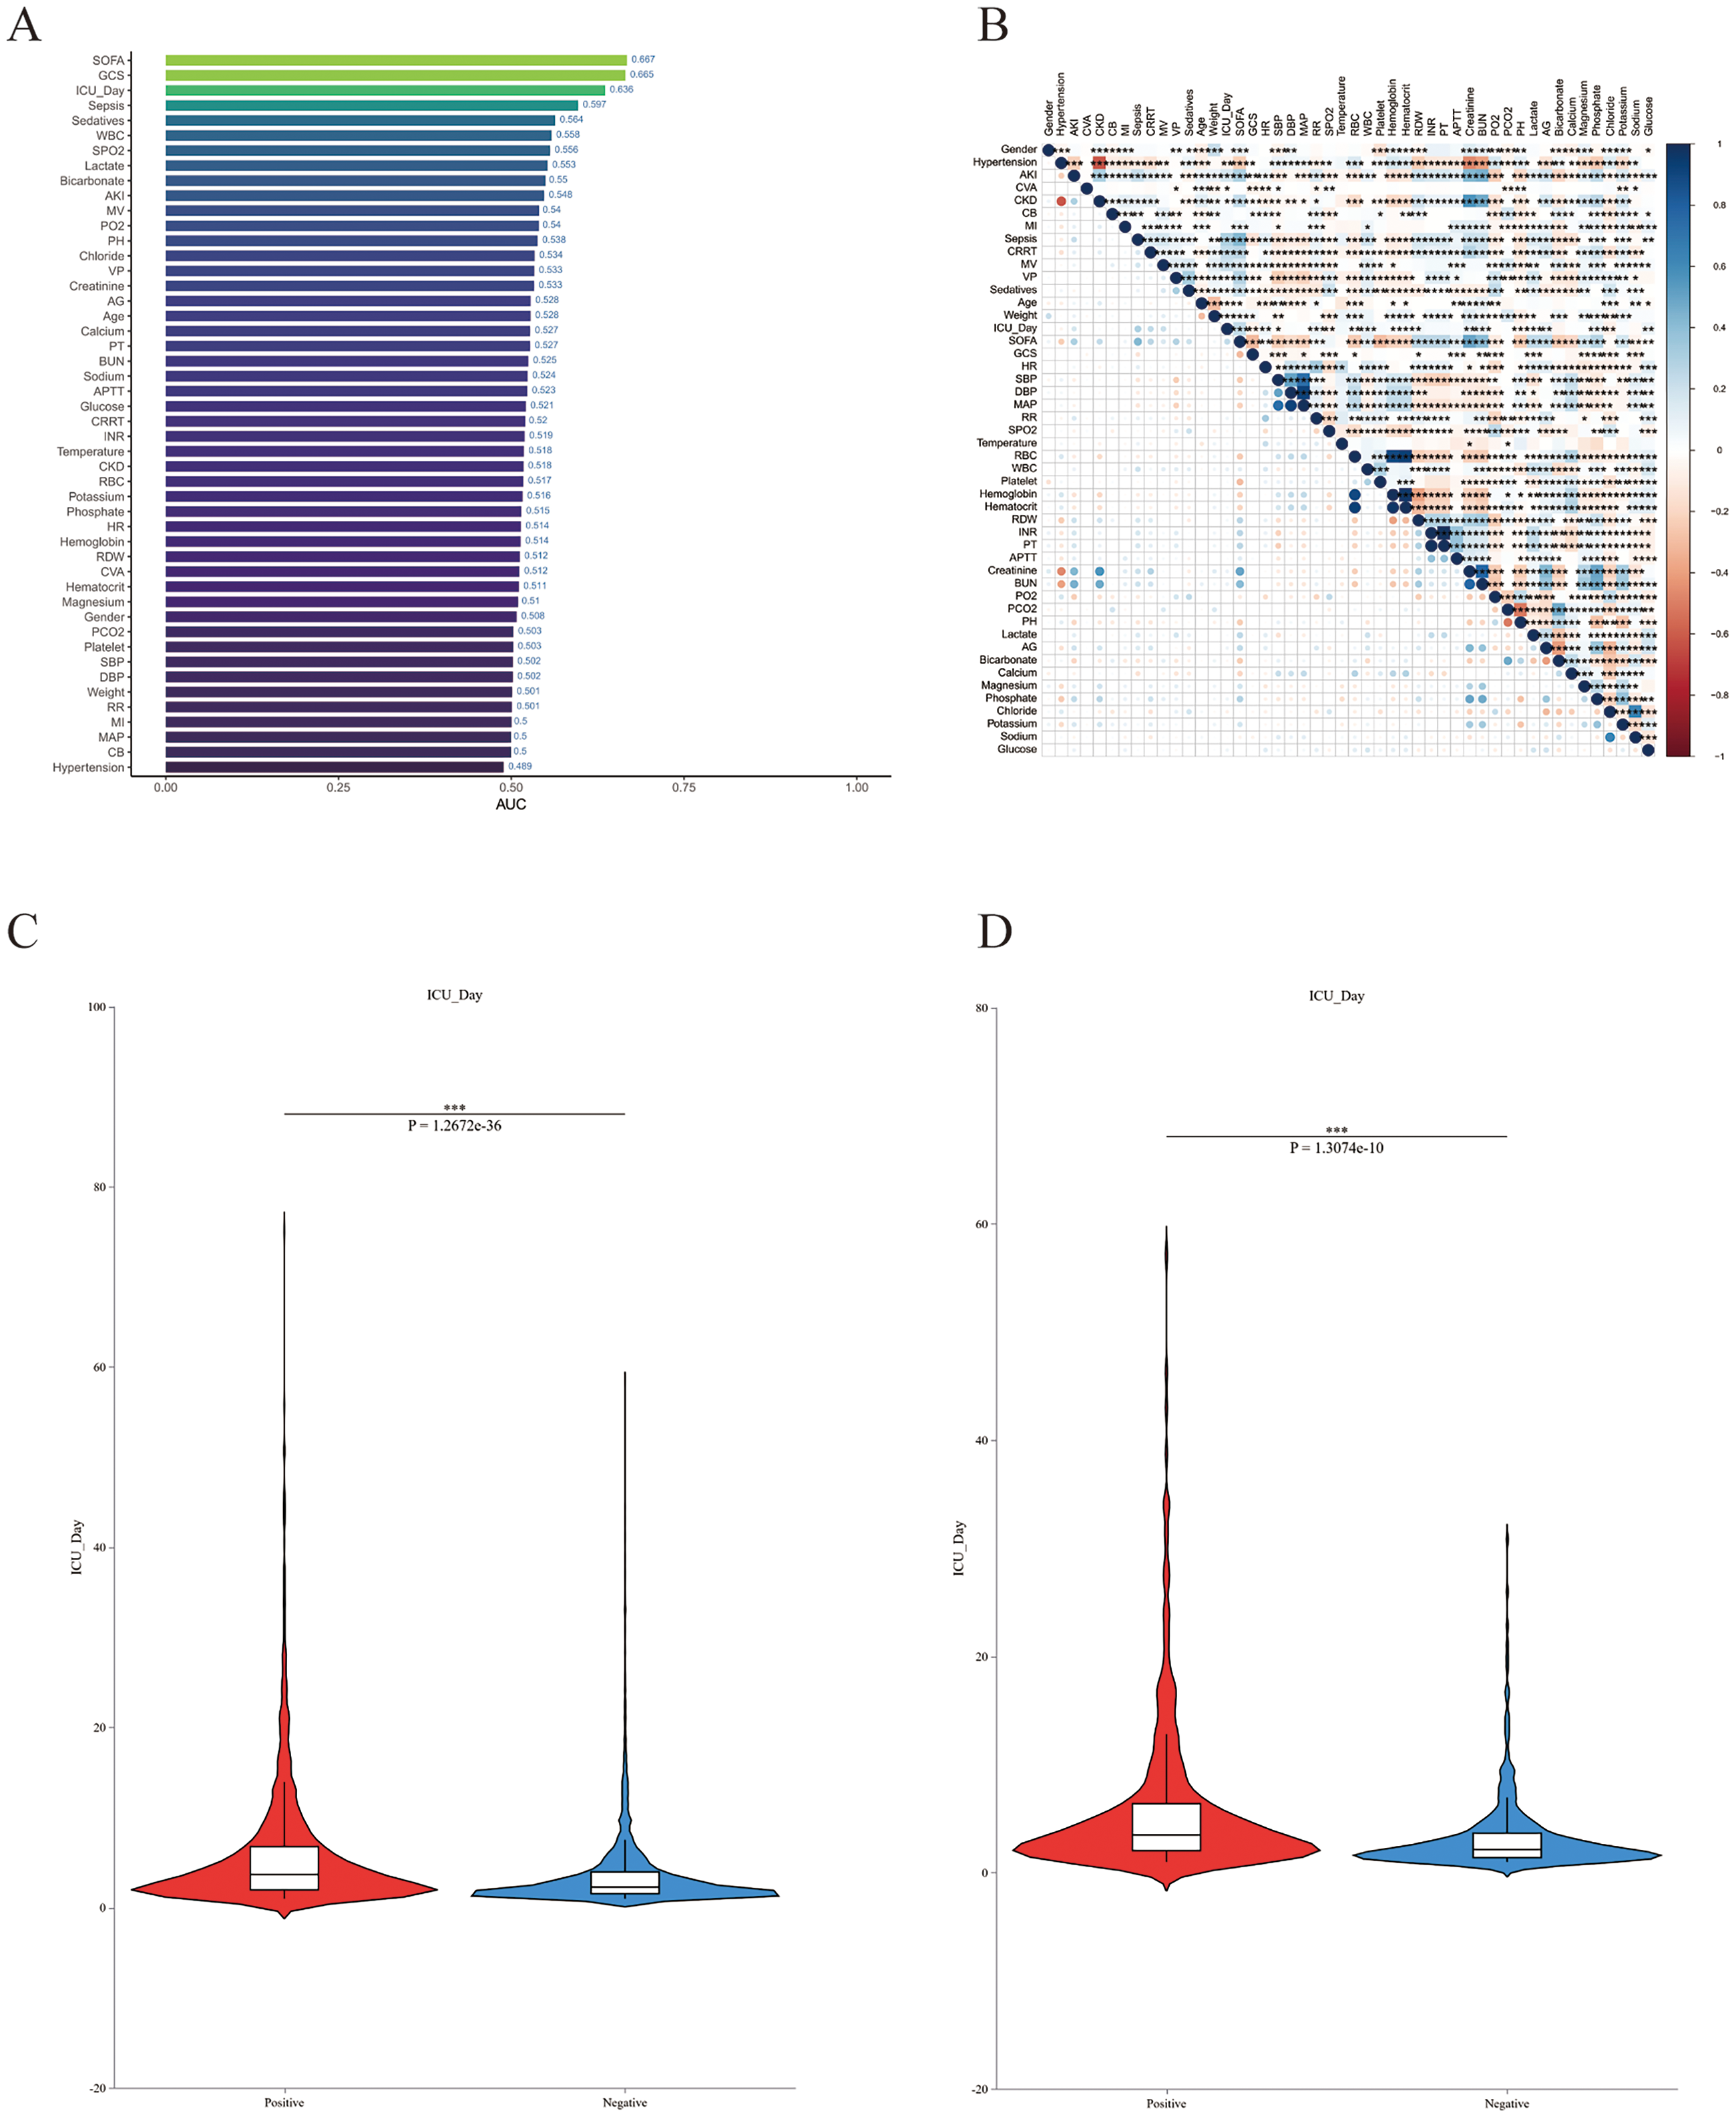
Variable association analysis. (a) Bar chart showing variable correlations. (b) Heatmap of variable correlations. (c, d) Box plots of ICU length of stay in delirium versus nondelirium groups.
Feature selection
To identify variables most strongly associated with delirium in elderly patients with T2DM, we employed Lasso regression and the Boruta algorithm for preliminary variable screening. Lasso regression was applied to screen relevant features in the training set, with the coefficients for each variable shown in Figure 3(a). The optimal lambda.1se (0.01240386) for Lasso regression was established via 20-fold cross-validation, resulting in the selection of 18 predictors with substantial prognostic value (Figure 3(b)). To further pinpoint critical features, we applied the Boruta algorithm, leveraging Random Forest methodology. This approach robustly separates strongly relevant predictors from weakly relevant ones, markedly enhancing prediction accuracy and yielded 34 variables with significant predictive impact (Figure 3(c) and (d)). Comparative assessment of LASSO and Boruta outputs revealed the feature subset jointly prioritized by both techniques. The final set of 14 core features used for model construction included: GCS, SOFA, PO₂, SPO₂, MAP, SBP, Creatinine, Platelet, INR, Sepsis, AKI, Sedatives, MV and ICU_Day (Figure 3(e)).

Feature prioritization using LASSO regression and the Boruta algorithm. (a) Coefficient paths of variables in LASSO regression. (b) Selection of optimal LASSO penalty parameter (lambda.1se) via 20-fold cross-validation. (c, d) Key variables identified by Boruta algorithm (34 features highlighted in red show significant importance scores). (E) Intersection analysis of feature selection methods: 14 core clinical features jointly selected by LASSO regression and Boruta algorithm.
Model performance on the internal and external validation sets
To minimize learning bias introduced by outcome-class imbalance, we applied SMOTE oversampling only to the training set before model development, rebalancing the two classes to an approximate 1:1 ratio. Using 14 prespecified core clinical variables identified in prior feature selection, we developed and compared nine machine-learning algorithms to predict incident delirium during ICU admission among older adults with T2DM: LR, SVM, GBM, NN, CatBoost, XGBoost, AdaBoost, LightGBM and KNN. Model performance was evaluated in both internal and external validation cohorts, with discrimination summarized by the area under the AUC (Figure 4(a) and (b)). Overall, GBM demonstrated the strongest discriminative performance, with an AUC of 0.793 in the internal validation cohort and 0.770 in the external validation cohort. DeLong tests comparing AUC across cohorts showed that, except for CatBoost, for which the difference between internal and external AUC was not statistically significant, all other algorithms exhibited significant AUC differences between the two validation datasets, with all p-values less than .001, indicating varying degrees of change in generalization on external data. Calibration analyses further supported the reliability of GBM probability estimates: in both internal and external validation, the calibration curve closely approximated the ideal reference line, suggesting good agreement between predicted probabilities and observed outcomes (Figure 4(c) and (d)). Decision-curve analysis indicated that, across a broad range of threshold probabilities, GBM yielded greater net benefit than competing models, supporting its potential utility for risk stratification and clinical decision-making (Figure 4(e) and (f)). Confusion-matrix results were consistent with these findings (Figure 4(g) and (h)). In the internal validation cohort, there were 412 true positives (21.3%), 937 true negatives (48.5%), 114 false positives (5.9%) and 468 false negatives (24.2%); in the external validation cohort, there were 285 true positives (34.6%), 301 true negatives (36.6%), 106 false positives (12.9%) and 131 false negatives (15.9%). Collectively, GBM identified most patients at high risk of delirium, with a comparatively lower false-negative proportion in internal validation.
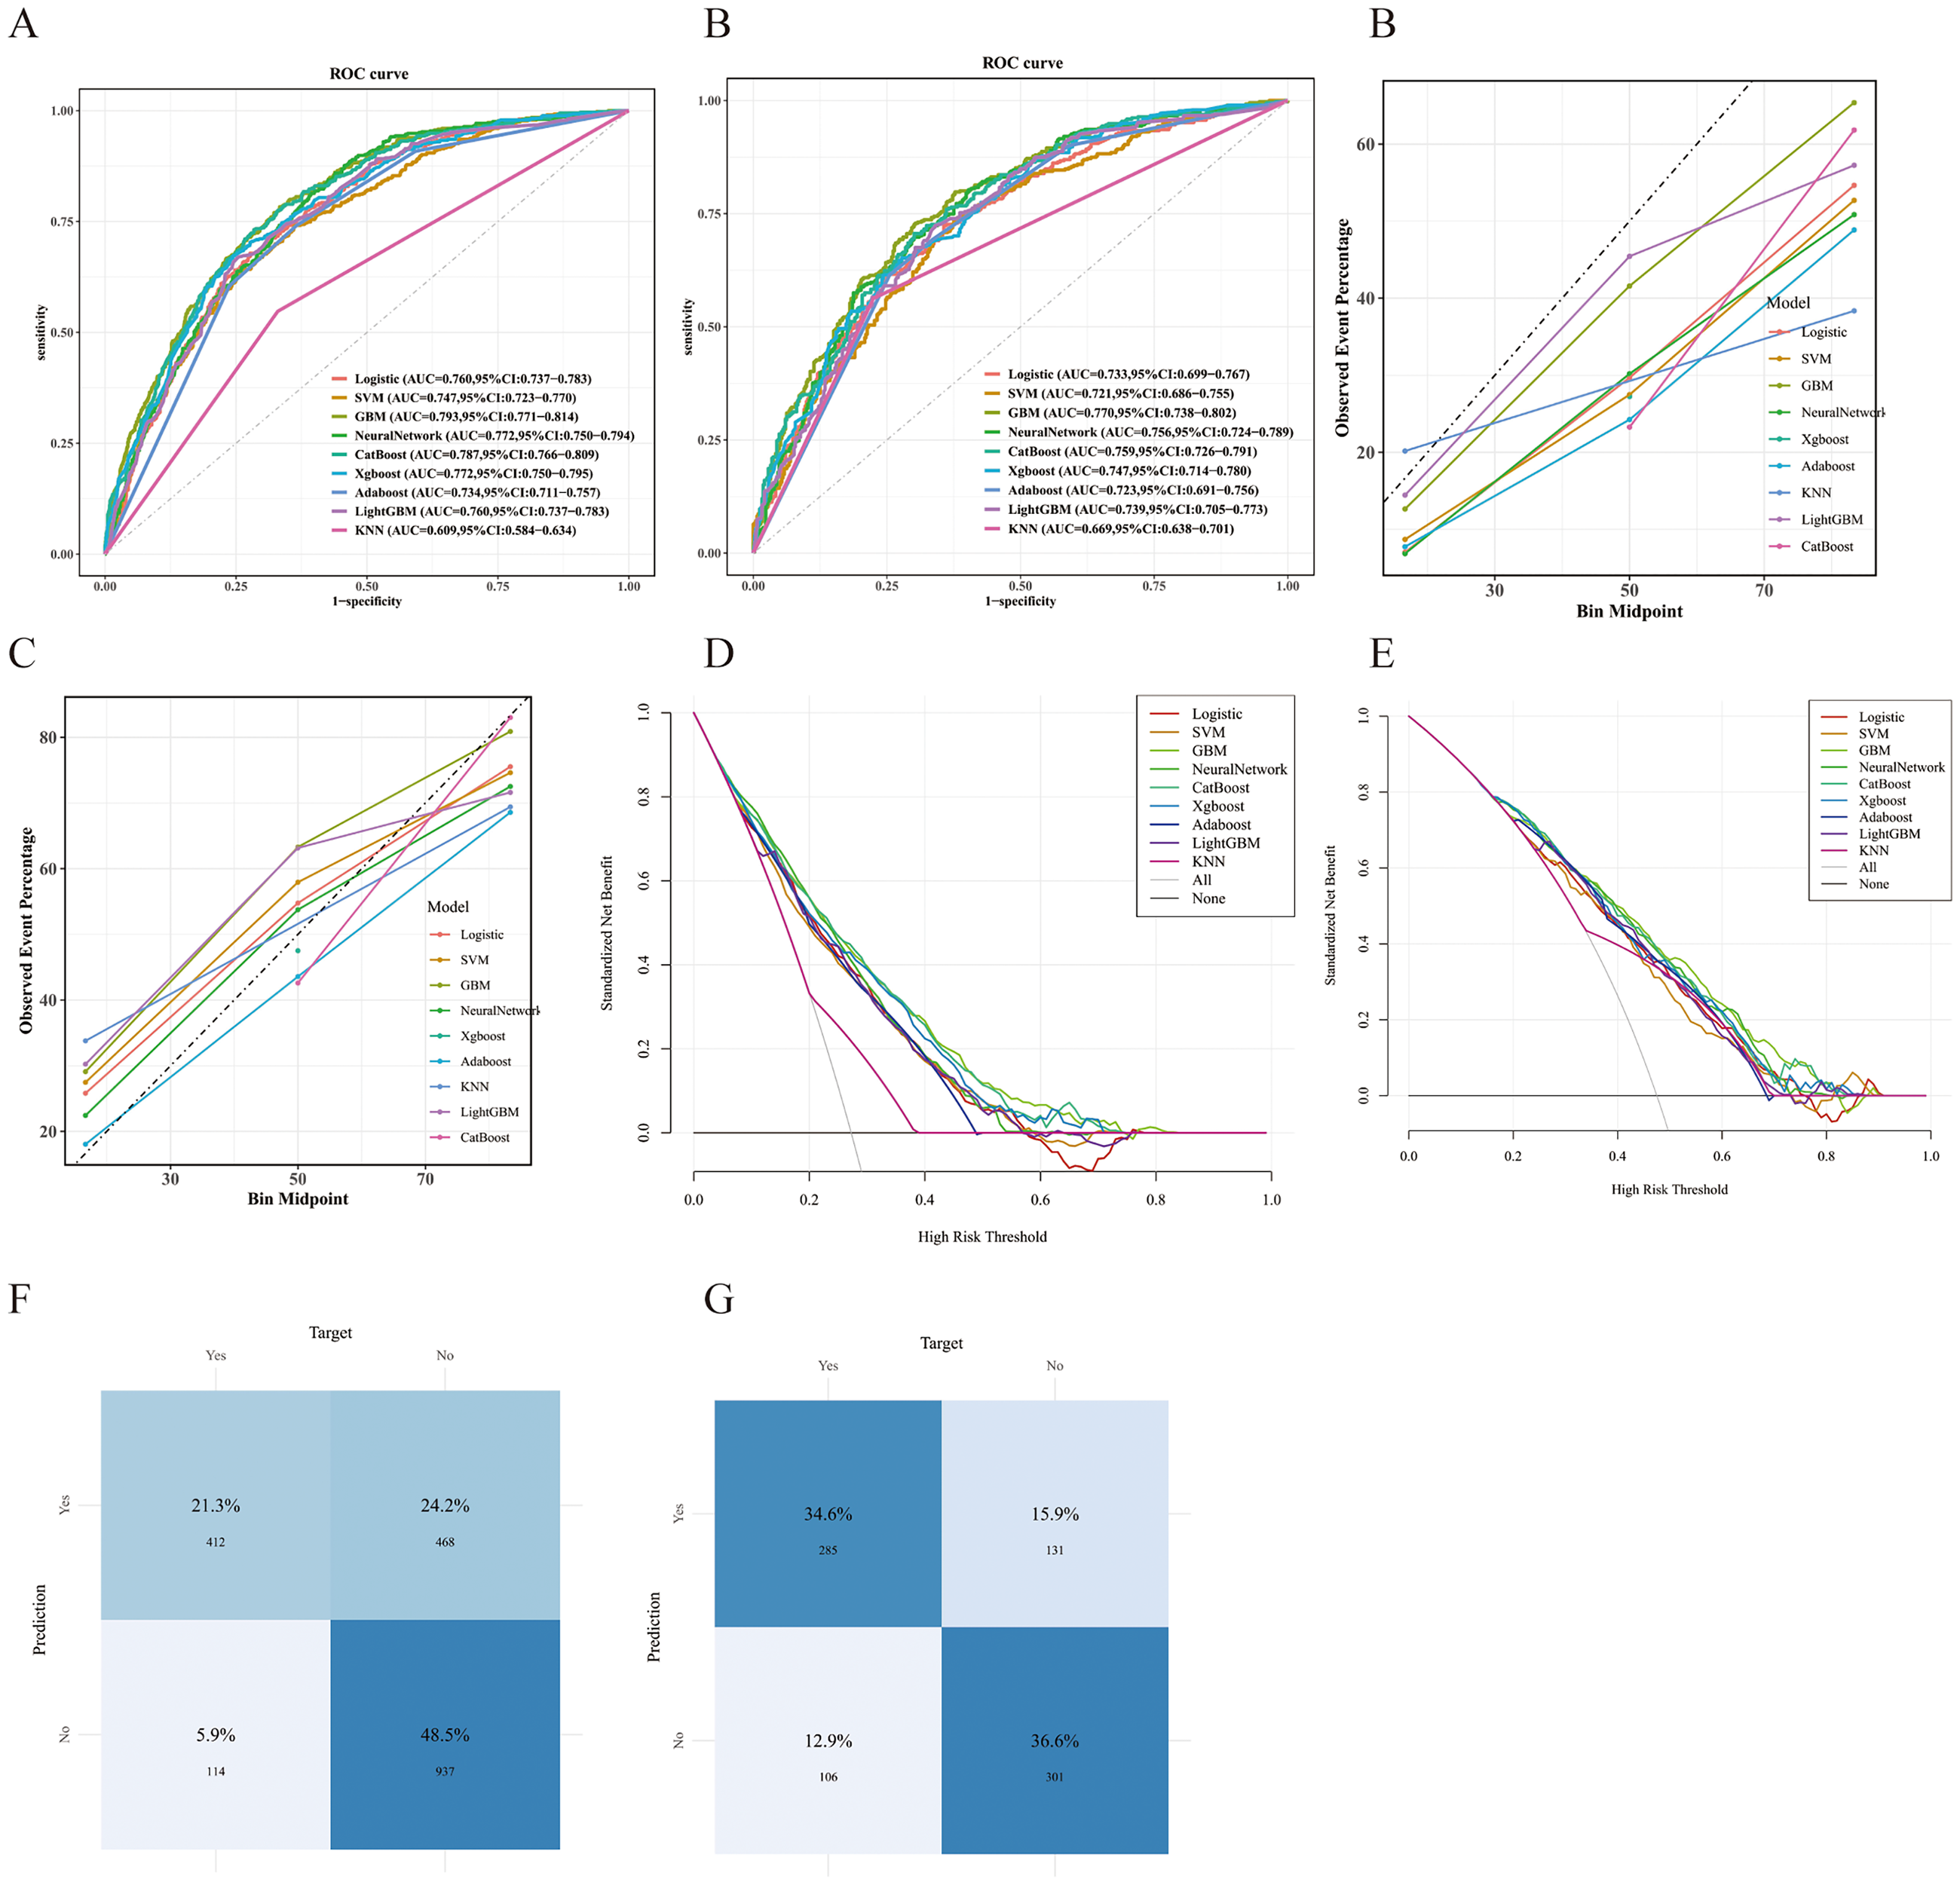
Performance comparison of nine predictive models. (a) ROC curves for the internal validation set; (b) ROC curves for the external validation set; (c, d) Calibration curves for internal and external validation sets; (e, f) DCA for internal and external validation sets; (g, h) Confusion matrices for internal and external validation sets.
Across multiple classification metrics, GBM maintained robust performance in both cohorts. In internal validation, accuracy was 0.699 (95% CI [0.678–0.719]), sensitivity 0.783 (0.746–0.816) and specificity 0.667 (0.642–0.691); the PPV was 0.468 (0.435–0.501), F1 score 0.586 (0.560–0.612), NPV 0.892 (0.871–0.909) and Cohen's kappa 0.372. In external validation, performance remained stable: accuracy 0.712 (0.680–0.742), sensitivity 0.729 (0.683–0.771) and specificity 0.697 (0.652–0.738); PPV 0.685 (0.639–0.728), F1 score 0.706 (0.674–0.737), NPV 0.740 (0.695–0.780) and kappa 0.424. Detailed results are presented in Table 2 and Supplemental Table S4. Taken together, across discrimination, calibration and clinical net benefit, these results support GBM as a candidate tool for delirium risk estimation and stratified management in older adults with T2DM admitted to the ICU.
Predictive performance analysis across all models.

LR: logistic regression; SVM: support vector machine; GBM: gradient boosting machine; NN: neural network; CatBoost: categorical boosting; XGBoost: extreme gradient boosting; AdaBoost: adaptive boosting; LightGBM: light gradient boosting machine; KNN: K-nearest neighbors.
Finally, within the same internal validation cohort, we compared the optimized GBM model with conventional clinical scoring systems (SOFA and GCS). GBM achieved a higher AUC than either score (Supplemental Figure S2), suggesting superior discrimination for delirium risk in this population.
Model interpretability analysis
This study aimed to systematically assess factors associated with delirium in older adults with T2DM and to quantify their relative importance. Feature importance was visualized using a SHAP beeswarm plot (Figure 5(a)), in which each point represents an individual and color (purple to yellow) denotes low to high feature values. Variables were ordered by mean absolute SHAP value, illustrating both the distribution and direction of their contributions to model output. Lower GCS scores, higher SOFA scores, longer ICU stay, sedative exposure and MV were associated with increased predicted delirium risk. In the GBM model, SHAP-based importance rankings (Figure 5(b)) were consistent with these findings, supporting their robustness across modeling frameworks. To improve interpretability at the individual level, SHAP waterfall plots for two representative patients (Figure 5(c) and (d)) summarized feature-specific contributions, with yellow indicating increased risk and purple indicating decreased risk.
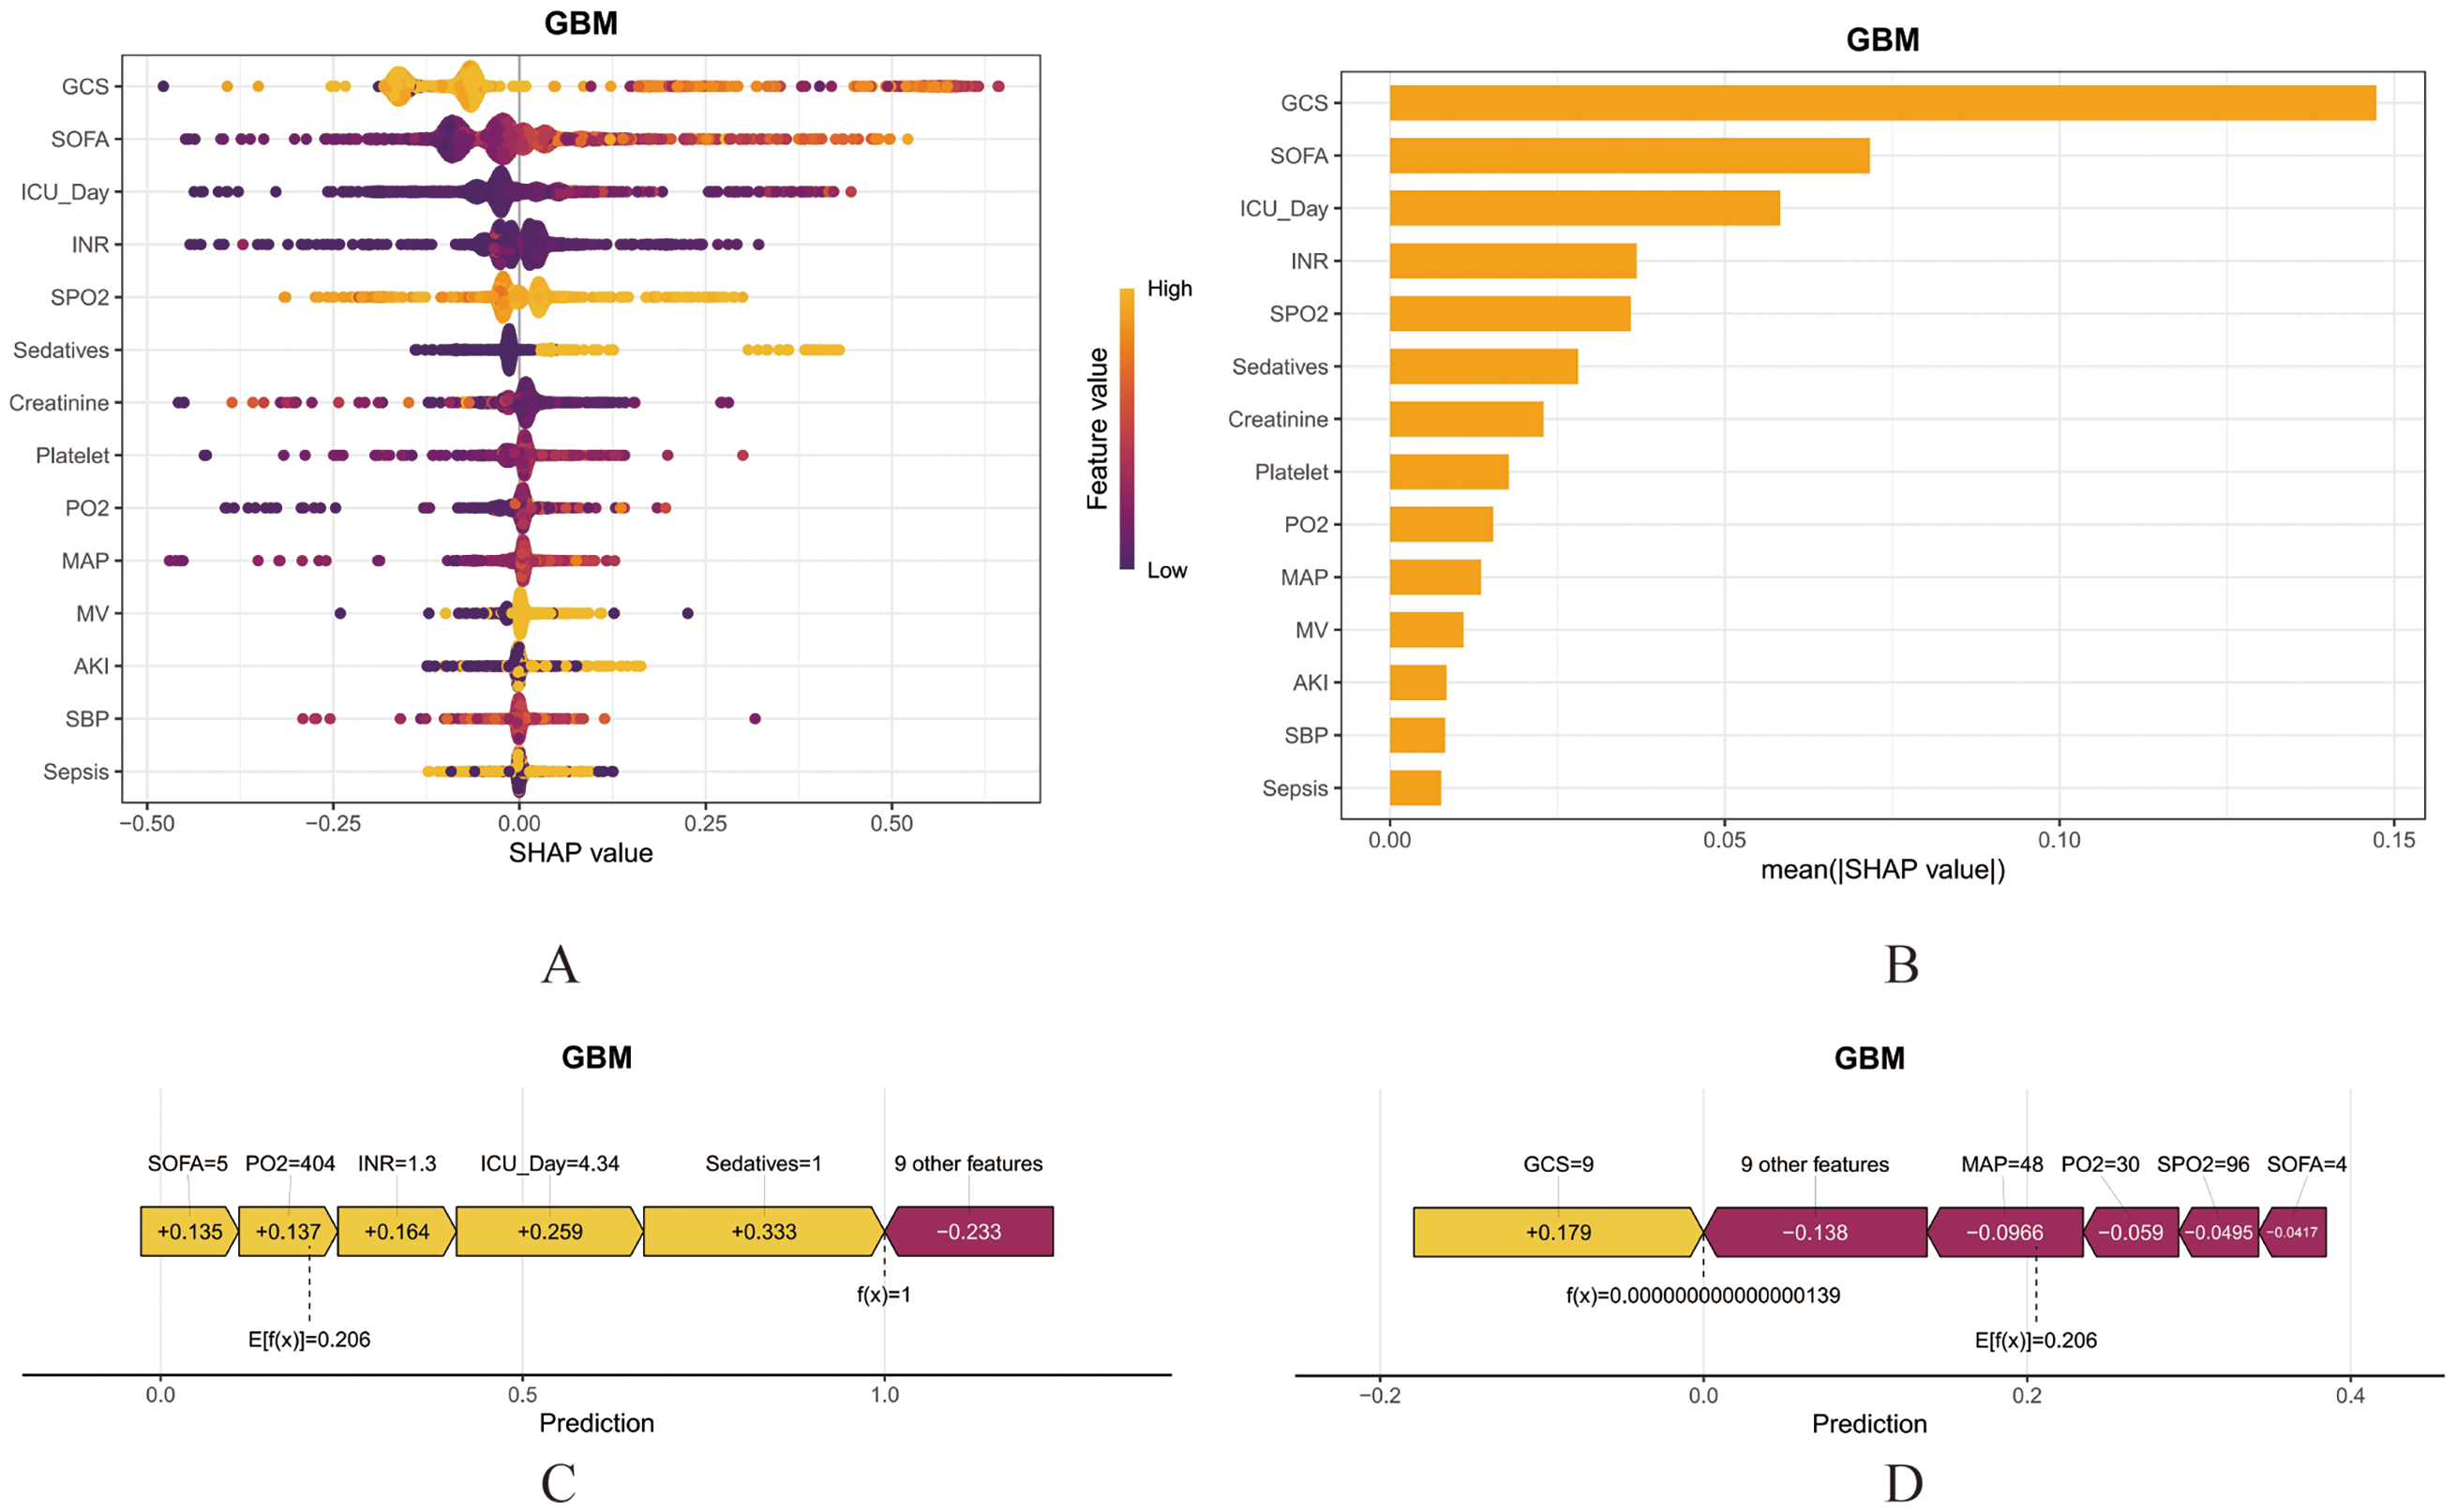
SHAP interpretability analysis of the GBM model. (a) SHAP beeswarm plot for GBM: Visualizing feature importance distributions; (b) Feature importance ranking by mean absolute SHAP values; (c, d) SHAP waterfall plots illustrating individualized feature attribution: (c) Representative clinical case of T2DM-related delirium, (d) Representative case of non-T2DM-related delirium.
To explore potential interactions, SHAP dependence plots were generated. Using SOFA as an example, these plots showed how SHAP values for GCS, ICU length of stay and sedative use varied across SOFA levels. Predicted delirium risk was lower when SOFA scores were 0–8 than at higher SOFA ranges (Supplemental Figure S3), suggesting effect modification by illness severity.
System deployment of online calculator
Using the best-performing model, we created an online clinical risk calculator that estimates ICU delirium risk in older patients with T2DM from routinely collected clinical variables (https://risk-model.shinyapps.io/deploy_a_website/). Clinicians can enter patient-specific data to generate an immediate, individualized risk estimate, which may aid early stratification and guide timely preventive and therapeutic optimization (Supplemental Figure S4). Illustrative input fields and example outputs from the web interface are shown in Supplemental Table S5.
Discussion
This study employed a retrospective cohort analysis to develop a predictive tool for delirium risk in elderly T2DM patients. Utilizing 48 clinical variables recorded within 24 h of ICU admission, we applied eight machine-learning algorithms to construct delirium risk prediction models, rigorously evaluating them through internal and external validation. The results demonstrated that the GBM algorithm exhibited optimal performance, showing favorable discrimination (AUC 0.794) and calibration. Its clinical decision curve analysis also indicated significant net benefit. External validation on an independent cohort further confirmed the model's robustness and predictive accuracy. To interpret the model's decision-making mechanism, we employed the SHAP method for feature attribution visualization. Furthermore, we developed an online web-based prediction calculator to facilitate clinical translation. This tool facilitates early identification of high-risk individuals while enhancing clinical management decisions, ultimately improving patient outcomes.
Delirium is the most common neuropsychiatric complication among elderly patients in the ICU. In elderly T2DM patients, chronic hyperglycemia may induce oxidative stress, neuroinflammation and cerebral microangiopathy, leading to neurological dysfunction and promoting neurodegeneration. This pathological process can reduce cognitive reserve, thereby increasing the risk of delirium onset. Delirium can lead to prolonged hospital stays, increased mortality and long-term reductions in quality of life among elderly patients.27–29 However, clinical recognition of delirium specifically associated with T2DM in elderly ICU patients remains suboptimal, potentially stemming from insufficient awareness of this complication among healthcare providers. Therefore, enhancing healthcare providers’ understanding of delirium and the early identification of delirium-related risk factors in elderly patients is crucial. Currently, the primary assessment methods for delirium in the ICU are CAM-ICU (sensitivity 78%, specificity 95%) and ICDSC (sensitivity 80%, specificity 95.9%).9,30 Clinical practice indicates that some nursing staff lack sufficient expertise in delirium, compounded by underdeveloped training systems, resulting in inadequate mastery of the operational standards for these assessment tools and consequently impacting the accuracy of the assessments.31–34 In contrast, our web-based calculator, developed using the optimal model, enables rapid early identification of T2DM-associated delirium in elderly patients and may facilitate timely preventive strategies. Recent pipeline-based and hybrid machine-learning frameworks that integrate automated feature engineering, ensemble learning and explainable modeling have been proposed to enhance robustness and transportability across heterogeneous datasets, highlighting the value of structured pipelines for clinical prediction tools.35–38 It is important to note that, although our initial validation showed promising performance, applicability across diverse clinical scenarios still requires independent validation in multicenter prospective cohorts using multisource external data to objectively assess generalizability and diagnostic accuracy, thereby strengthening the evidence base for clinical translation.
Multiple delirium risk assessment models for ICU patients have been developed in existing research. However, these models either cover excessively broad age ranges or focus solely on specific patient groups such as those with sepsis, AKI, or postoperative status, without adequately accounting for the unique clinical characteristics of elderly T2DM patients in the ICU.39–42 Ren et al., through multifactorial LR analysis, confirmed that diabetes mellitus is an independent risk factor for postoperative delirium, suggesting its potential to increase delirium risk in elderly patients. Based on this finding, the researchers constructed a predictive model. 43 Conversely, univariate and multifactorial LR analyses conducted by Liu et al. indicated that diabetes mellitus was not an independent risk factor for postoperative delirium in elderly patients. 44 However, these two study findings are not entirely contradictory. The discrepancy is likely attributable to heterogeneity in population characteristics across different regions and variations in statistical methodologies, reflecting the complex relationship between diabetes and postoperative delirium. We maintain that diabetes remains a significant clinical consideration. Even if not identified as an independent risk factor in all studies, diabetes may still indirectly increase susceptibility to delirium through various pathological mechanisms. Clinicians should maintain heightened vigilance regarding elderly diabetic patients in the ICU, viewing them as a potential high-risk group for delirium. To meet this clinical need, we developed a delirium risk prediction model specifically for elderly T2DM patients. This tool enables early delirium identification and facilitates targeted interventions within this vulnerable ICU cohort.
Feature selection is a critical step in building predictive models. This study first identified potential predictors through a systematic review of published literature on delirium predictors.41,45–47 To achieve precise feature screening and enhance model stability, this study employed a dual-stage strategy combining LASSO regression and the Boruta algorithm to identify key predictors. LASSO regression effectively mitigates the risk of model overfitting and eliminates interference from strongly collinear variables through its penalty mechanism. 48 The Boruta algorithm, by constructing shadow variables and iteratively evaluating feature importance, selects statistically significant predictors, proving particularly useful for identifying nonlinear relationships in high-dimensional data. 49 The synergistic feature screening of these two methods significantly enhances the model's clinical applicability while reducing overfitting risk. Previous research has established various ICU delirium prediction models. Notably, the predictive variables incorporated in earlier models (such as MV, sedative use, age, AKI, GCS, SOFA score, MAP at ICU admission and ICU length of stay) exhibit substantial overlap with those in the present study.42,43,50–52 However, these models targeted general-age populations and failed to adequately capture the unique characteristics of elderly patients with T2DM. Given the heightened susceptibility to delirium among elderly ICU patients,27,53 this study focuses on this specific group. Through rigorous testing, variables including GCS, SOFA, AKI, Sedatives, MV and ICU_Day were identified as key predictors. Machine-learning applications in healthcare are increasingly widespread. Compared to traditional linear regression models, machine-learning algorithms possess superior capabilities for modeling nonlinear relationships. They can effectively capture higher-order interaction effects between variables and support multivariate analysis of high-dimensional data through efficient computational frameworks, thereby enhancing disease prediction performance. 23 This study systematically compared the performance of eight machine-learning models, utilizing an optimization pipeline incorporating grid parameter search, 10-fold cross-validation and sample balancing techniques including undersampling, oversampling and SMOTE. The DeLong test, a nonparametric method, is commonly used to assess the statistical significance of the difference in AUC between two correlated ROC curves. However, in the external validation cohort, this test indicated that the AUC difference between the GBM and CatBoost models did not reach the threshold for statistical significance. This may be related to their shared algorithmic framework origins, similar data adaptability and minimal performance difference. Importantly, when the actual difference falls below the detection threshold, this test might not detect clinically meaningful AUC differences. Based on the comprehensive model evaluation results, GBM demonstrated superior performance across other evaluation dimensions and was therefore selected as the optimal model.
Current research shows that Jiang L et al. employed Lasso regression to screen for risk factors of delirium in elderly patients and constructed a nomogram prediction model. This model ultimately incorporated independent predictors including sepsis, SOFA score and MV, demonstrating good predictive performance in both the internal validation set (AUC = 0.762) and the external validation set (AUC = 0.756). Compared with the present study, however, the broad-spectrum applicability of its external validation has not been fully assessed and the model's generalization capability remains uncertain, limiting its clinical utility. 54 Li et al. developed a prediction model for postoperative delirium in elderly patients based on the XGBoost algorithm, which identified diabetes mellitus as a risk factor for postoperative delirium in elderly ICU patients. 55 Nevertheless, this model did not differentiate between Type 1 and Type 2 diabetes mellitus, potentially leading to an underestimation of its predictive efficacy in the T2DM population. Furthermore, the lack of a real-time updatable online calculator restricts its clinical translation value.
Interpretability in clinical contexts is a crucial requirement for machine-learning models used in medicine. Yet, achieving sufficient interpretability remains a persistent challenge. The inherent “black-box” characteristics of many algorithms impede their broader clinical adoption. This study employs the SHAP method, whose core strength lies in transforming model predictions into feature importance scores, thereby generating comprehensible clinical explanations. This method simultaneously provides both global and local interpretability. By enhancing visualization and transparency, it helps clinicians understand the decision logic of complex models for individual patients, subsequently providing clear rationale for clinical interventions. Compared to traditional weight-based explanation methods, SHAP demonstrates significant advantages in explanation consistency, computational efficiency and cross-model stability.56–58 Based on the feature ranking from SHAP beeswarm plots, key features significantly impacting ICU delirium occurrence in elderly T2DM patients can be intuitively identified. Existing studies confirm that reduced GCS score, elevated SOFA score, prolonged ICU length of stay and sedative use are common risk factors for delirium in elderly T2DM patients. Notably, SHAP dependence plots further reveal a complex non-linear relationship between SOFA score and delirium incidence. When the SOFA score is < 8 points, patient delirium incidence significantly decreases; this phenomenon aligns with findings from multiple previous delirium prediction model studies and is supported by existing literature. 59 In summary, SHAP analysis provides a new perspective for understanding model decision mechanisms: by quantifying the contribution of each feature variable to the decision, it effectively enhances model interpretability.
Consistent with most retrospective studies, this work has several unavoidable limitations. First, the retrospective design limits rigorous causal inference between candidate predictors and delirium. 60 Second, because of database constraints, several clinically relevant variables were unavailable, including educational attainment, alcohol use, C-reactive protein and B-type natriuretic peptide, which may introduce residual confounding and reduce the completeness of prediction. 61 Future work should therefore incorporate and standardize these variables in prospective, multicenter cohorts to improve mechanistic interpretability and clinical translatability. Third, although we validated the model in MIMIC-III, this analysis primarily represents a temporal external validation and does not constitute true geographic or institution-independent validation. Given potential similarities across critical-care databases in case mix, clinical workflows and coding practices, the model's transportability across settings remains to be established. Rigorous external validation in more heterogeneous and independent real-world cohorts, such as multicenter databases including eICU-CRD, is warranted to strengthen evidence for generalisability.62,63 Finally, the limited sample size and number of outcome events might have constrained the performance of more complex machine-learning models. Although we applied SMOTE in the training set to mitigate class imbalance, further evaluation, updating and recalibration in larger and more representative datasets are needed to enhance model stability and predictive performance.
Conclusion
This study developed and internally validated eight machine-learning models to predict delirium risk in older adults with T2DM. The GBM model showed the best overall performance in our dataset and may help identify patients at higher risk, thereby supporting clinical risk stratification and decision-making.
Supplemental Material
sj-pdf-1-sci-10.1177_00368504261436075 - Supplemental material for Development and validation of an online machine-learning tool for predicting delirium risk in older adults with type 2 diabetes: A retrospective cohort study based on the MIMIC-IV database
Supplemental material, sj-pdf-1-sci-10.1177_00368504261436075 for Development and validation of an online machine-learning tool for predicting delirium risk in older adults with type 2 diabetes: A retrospective cohort study based on the MIMIC-IV database by Lang Gao, Guangdong Wang, Xingyi Yang, Yuanshuo Ge, Shijun Tong, Xia Xiang, Chunyan Zhang and Yun Huang in Science Progress
Supplemental Material
sj-pdf-2-sci-10.1177_00368504261436075 - Supplemental material for Development and validation of an online machine-learning tool for predicting delirium risk in older adults with type 2 diabetes: A retrospective cohort study based on the MIMIC-IV database
Supplemental material, sj-pdf-2-sci-10.1177_00368504261436075 for Development and validation of an online machine-learning tool for predicting delirium risk in older adults with type 2 diabetes: A retrospective cohort study based on the MIMIC-IV database by Lang Gao, Guangdong Wang, Xingyi Yang, Yuanshuo Ge, Shijun Tong, Xia Xiang, Chunyan Zhang and Yun Huang in Science Progress
Supplemental Material
sj-pdf-3-sci-10.1177_00368504261436075 - Supplemental material for Development and validation of an online machine-learning tool for predicting delirium risk in older adults with type 2 diabetes: A retrospective cohort study based on the MIMIC-IV database
Supplemental material, sj-pdf-3-sci-10.1177_00368504261436075 for Development and validation of an online machine-learning tool for predicting delirium risk in older adults with type 2 diabetes: A retrospective cohort study based on the MIMIC-IV database by Lang Gao, Guangdong Wang, Xingyi Yang, Yuanshuo Ge, Shijun Tong, Xia Xiang, Chunyan Zhang and Yun Huang in Science Progress
Supplemental Material
sj-pdf-4-sci-10.1177_00368504261436075 - Supplemental material for Development and validation of an online machine-learning tool for predicting delirium risk in older adults with type 2 diabetes: A retrospective cohort study based on the MIMIC-IV database
Supplemental material, sj-pdf-4-sci-10.1177_00368504261436075 for Development and validation of an online machine-learning tool for predicting delirium risk in older adults with type 2 diabetes: A retrospective cohort study based on the MIMIC-IV database by Lang Gao, Guangdong Wang, Xingyi Yang, Yuanshuo Ge, Shijun Tong, Xia Xiang, Chunyan Zhang and Yun Huang in Science Progress
Supplemental Material
sj-docx-5-sci-10.1177_00368504261436075 - Supplemental material for Development and validation of an online machine-learning tool for predicting delirium risk in older adults with type 2 diabetes: A retrospective cohort study based on the MIMIC-IV database
Supplemental material, sj-docx-5-sci-10.1177_00368504261436075 for Development and validation of an online machine-learning tool for predicting delirium risk in older adults with type 2 diabetes: A retrospective cohort study based on the MIMIC-IV database by Lang Gao, Guangdong Wang, Xingyi Yang, Yuanshuo Ge, Shijun Tong, Xia Xiang, Chunyan Zhang and Yun Huang in Science Progress
Supplemental Material
sj-docx-6-sci-10.1177_00368504261436075 - Supplemental material for Development and validation of an online machine-learning tool for predicting delirium risk in older adults with type 2 diabetes: A retrospective cohort study based on the MIMIC-IV database
Supplemental material, sj-docx-6-sci-10.1177_00368504261436075 for Development and validation of an online machine-learning tool for predicting delirium risk in older adults with type 2 diabetes: A retrospective cohort study based on the MIMIC-IV database by Lang Gao, Guangdong Wang, Xingyi Yang, Yuanshuo Ge, Shijun Tong, Xia Xiang, Chunyan Zhang and Yun Huang in Science Progress
Supplemental Material
sj-docx-7-sci-10.1177_00368504261436075 - Supplemental material for Development and validation of an online machine-learning tool for predicting delirium risk in older adults with type 2 diabetes: A retrospective cohort study based on the MIMIC-IV database
Supplemental material, sj-docx-7-sci-10.1177_00368504261436075 for Development and validation of an online machine-learning tool for predicting delirium risk in older adults with type 2 diabetes: A retrospective cohort study based on the MIMIC-IV database by Lang Gao, Guangdong Wang, Xingyi Yang, Yuanshuo Ge, Shijun Tong, Xia Xiang, Chunyan Zhang and Yun Huang in Science Progress
Supplemental Material
sj-docx-8-sci-10.1177_00368504261436075 - Supplemental material for Development and validation of an online machine-learning tool for predicting delirium risk in older adults with type 2 diabetes: A retrospective cohort study based on the MIMIC-IV database
Supplemental material, sj-docx-8-sci-10.1177_00368504261436075 for Development and validation of an online machine-learning tool for predicting delirium risk in older adults with type 2 diabetes: A retrospective cohort study based on the MIMIC-IV database by Lang Gao, Guangdong Wang, Xingyi Yang, Yuanshuo Ge, Shijun Tong, Xia Xiang, Chunyan Zhang and Yun Huang in Science Progress
Supplemental Material
sj-docx-9-sci-10.1177_00368504261436075 - Supplemental material for Development and validation of an online machine-learning tool for predicting delirium risk in older adults with type 2 diabetes: A retrospective cohort study based on the MIMIC-IV database
Supplemental material, sj-docx-9-sci-10.1177_00368504261436075 for Development and validation of an online machine-learning tool for predicting delirium risk in older adults with type 2 diabetes: A retrospective cohort study based on the MIMIC-IV database by Lang Gao, Guangdong Wang, Xingyi Yang, Yuanshuo Ge, Shijun Tong, Xia Xiang, Chunyan Zhang and Yun Huang in Science Progress
Footnotes
Abbreviations
Acknowledgments
The authors gratefully acknowledge the MIMIC team for their invaluable contributions to this work.
Ethical considerations
This study involving human subjects was approved by the Institutional Review Boards of the Massachusetts Institute of Technology and Beth Israel Deaconess Medical Center. All research activities strictly complied with the legal regulations and ethical standards of both institutions. Participants provided written informed consent prior to enrollment. Additionally, written consent was obtained from all individuals for the use of potentially identifiable images or data in this manuscript, ensuring full compliance with ethical and legal standards for publication.
Consent to participate
Based on the MIMIC database usage guidelines and applicable research ethics standards, studies involving such publicly available deidentified datasets do not require informed consent.
Consent for publication
Not applicable.
Author contributions
LG conceived and carried out the study and drafted the initial manuscript; XYY, YSG and SJT designed the study methodology and performed the preliminary data analyses; GDW and YH critically revised the manuscript; XX and CYZ conducted supplementary data analyses. All authors made substantial contributions to this work and approved the final version of the manuscript.
Funding
The authors received no financial support for the research, authorship, and/or publication of this article.
Declaration of conflicting interests
The authors declared no potential conflicts of interest with respect to the research, authorship, and/or publication of this article.
Clinical trial number
Not applicable.
Data availability statement
All relevant data are included in the manuscript and its supporting information files. The data underlying the results of this study were derived from the MIMIC database. Access to the MIMIC database is publicly available but requires completion of a data use agreement and certification through the Collaborative Institutional Training Initiative program to ensure the ethical use of patient information. Researchers may apply for access at ![]() .
.
Supplemental material
Supplemental material for this article is available online.
References
Supplementary Material
Please find the following supplemental material available below.
For Open Access articles published under a Creative Commons License, all supplemental material carries the same license as the article it is associated with.
For non-Open Access articles published, all supplemental material carries a non-exclusive license, and permission requests for re-use of supplemental material or any part of supplemental material shall be sent directly to the copyright owner as specified in the copyright notice associated with the article.