
Abstract
Objective
To estimate the prevalence, temporal trends, and sociodemographic disparities of diagnosed diabetes and prediabetes among U.S. adults with low muscle mass using 2011–2018 National Health and Nutrition Examination Survey (NHANES) data.
Methods
This cross-sectional analysis leveraged nationally representative NHANES data (2011–2018). A total of 12,753 adults aged ≥18 years with complete appendicular skeletal muscle mass, body mass index, and glycemic status data were included. Crude and age-standardized prevalence rates were analyzed across sociodemographic strata. Multivariate logistic regression analysis was employed to assess the association between low muscle mass and diabetes and prediabetes.
Results
From 2011 to 2018, age-standardized low muscle mass prevalence increased from 10.3% (95% confidence interval (CI): 8.6–12.0) to 18.4% (16.1–20.7). Among adults with low muscle mass, 14.4% (12.2–16.6) had diabetes and 26.5% (23.5–29.6) had prediabetes. Striking age-related disparities emerged: adults aged 40–59 years exhibited a 3.1-fold higher diabetes prevalence (22.6% [19.1–26.5] vs. 7.4% [5.1–10.5] in those aged 18–39) and a 1.7-fold higher prediabetes prevalence (34.2% [29.4–39.2] vs. 20.0% [16.4–24.3]). Mexican Americans had 1.6 times higher diabetes prevalence than non-Hispanic Whites, while non-Hispanic Blacks showed 1.3 times higher prevalence than non-Hispanic Whites. Multivariate logistic regression revealed that low muscle mass was significantly associated with a higher risk of diabetes (odds ratio: 1.38, 95% CI: 1.07–1.78).
Conclusions
Low muscle mass is an independent predictor of diabetes risk. Over 40% of U.S. adults with low muscle mass exhibit dysglycemia, with rising prevalence and marked sociodemographic gradients. The prolonged diabetes duration in individuals with low muscle mass highlights accelerated metabolic deterioration.
This is a visual representation of the abstract.
Introduction
Sarcopenia, an age-related syndrome characterized by the progressive loss of skeletal muscle mass and strength, has emerged as a critical public health concern in aging populations. 1 Recognized as a distinct disease entity by the World Health Organization in 2016, sarcopenia holds significant clinical implications for predicting frailty, falls, and mortality. 2
Muscle mass and strength follow a dynamic trajectory throughout life, peaking in early adulthood (around age 40) and declining thereafter, with men generally exhibiting higher values than women. After age 50, leg muscle mass decreases by 1–2% annually, accompanied by a 1.5–5% annual reduction in muscle strength. 3 Global epidemiological studies highlight substantial variability in sarcopenia prevalence: 10.4% among community-dwelling older adults (≥60 years) in China, 4 13.8% in Japanese men (mean age 75.7 years) and 12.4% in Japanese women (mean age 74.4 years) when applying the European Working Group on Sarcopenia in Older People criteria, 5 and 4.6% in European men versus 7.9% in women (mean age 67 years). 6 The economic burden of sarcopenia is staggering, with complications driving substantial healthcare costs. 7 For instance, reducing sarcopenia prevalence by 10% in the USA could yield annual savings of $1.1 billion. 8 Concurrently, the diabetes epidemic continues to escalate, marked by rising age-standardized prevalence of diagnosed diabetes (6.15% to 11.0%) and prediabetes (29.5% to 48.3%) in recent decades. 9 Emerging evidence suggests that sarcopenia and dysglycemia share intertwined pathophysiological pathways beyond mere comorbidity.
The intersection of low muscle mass and glucose dysregulation has garnered increasing scientific attention. Skeletal muscle serves as the primary site for insulin-mediated glucose disposal, 10 and diminished muscle mass or quality exacerbates insulin resistance—a hallmark of type 2 diabetes. 11 Conversely, hyperglycemia-induced advanced glycation end products accelerate muscle protein degradation via ubiquitin-proteasome activation. 12 Shared risk factors such as physical inactivity, chronic inflammation, and mitochondrial dysfunction further amplify this bidirectional relationship. 13 Recent cohort studies demonstrate that individuals with low grip strength and reduced appendicular skeletal muscle mass index (ASM/height2) have significantly higher odds of diabetes (OR: 2.12, 95% confidence interval (CI): 1.18–3.79) compared to those with preserved muscle metrics. 14
Diabetes-related complications, such as peripheral neuropathy and microvascular disease, may impair mobility and balance.15,16 Concurrently, diminished muscle mass and strength directly undermine the physical capacity required for activities of daily living, leading to frailty, increased fall risk, functional decline, and ultimately compromised quality of life. 17 Therefore, elucidating the epidemiological link between low muscle mass and impaired glucose metabolism represents not merely a metabolic concern, but a crucial step in identifying high-risk populations for functional impairment and developing preventive strategies.
Leveraging nationally representative data from the National Health and Nutrition Examination Survey (NHANES, 2011–2018), this study aims to estimate the prevalence of diagnosed diabetes and prediabetes among U.S. adults with low muscle mass, analyze temporal trends and sociodemographic variations, and provide evidence for integrated screening and multidisciplinary care strategies.
Methods
Study population
We analyzed publicly available data from the 2011–2018 NHANES, a nationally representative cross-sectional survey monitoring the health status of the U.S. population. NHANES employs a complex, stratified multistage sampling design to collect sociodemographic and health-related data through in-person interviews and physical examinations. 18 The adult (≥18 years) sample sizes were 5864 (2011–2012), 6113 (2013–2014), 5992 (2015–2016), and 5856 (2017–2018). Response rates for interviewed samples declined from 72.6% (2011–2012) to 51.9% (2017–2018), with examined sample rates ranging from 69.5% to 48.8% across cycles. To enhance statistical power for diabetes and low muscle mass analyses, we pooled data from 2011 to 2018. Sampling weights were divided by 4 to account for the combined survey cycles. This study constitutes a secondary analysis of nationally representative NHANES data, with the final sample size determined by both strict adherence to inclusion criteria (complete ASM, body mass index (BMI), and diabetes status data) and the inherent stratified multistage probability sampling design of NHANES. This sampling design, precalculated by the National Center for Health Statistics, aims to ensure national representativeness and provide sufficient statistical power for population-based prevalence estimates and subgroup stratified analyses. After excluding 11,072 participants with missing muscle mass or diabetes variables, the final analytical sample included 12,753 adults. Additionally, when conducting the logistic regression analysis, we excluded participants with missing covariate data on education, marital status, poverty-to-income ratio (PIR), insurance status, cotinine levels, and drinking history (N = 2861), resulting in a total of 9892 individuals included in the regression. The flow chart is presented in Figure 1. This study was conducted in accordance with the ethical principles of the Declaration of Helsinki (as revised in 2024). Ethical clearance for the NHANES investigation was granted by the Institutional Review Board of the Disease Control and Prevention (CDC), National Center for Health Statistics (Protocol no. 2011-17, Continuation of Protocol no. 2011-17, Protocol no. 2018-01). Written informed consent was obtained from all subjects prior to their involvement in this national survey. The methodology and reporting of this study adhere to the principles set forth in the Strengthening the Reporting of Observational Studies in Epidemiology guidelines for observational research. 19
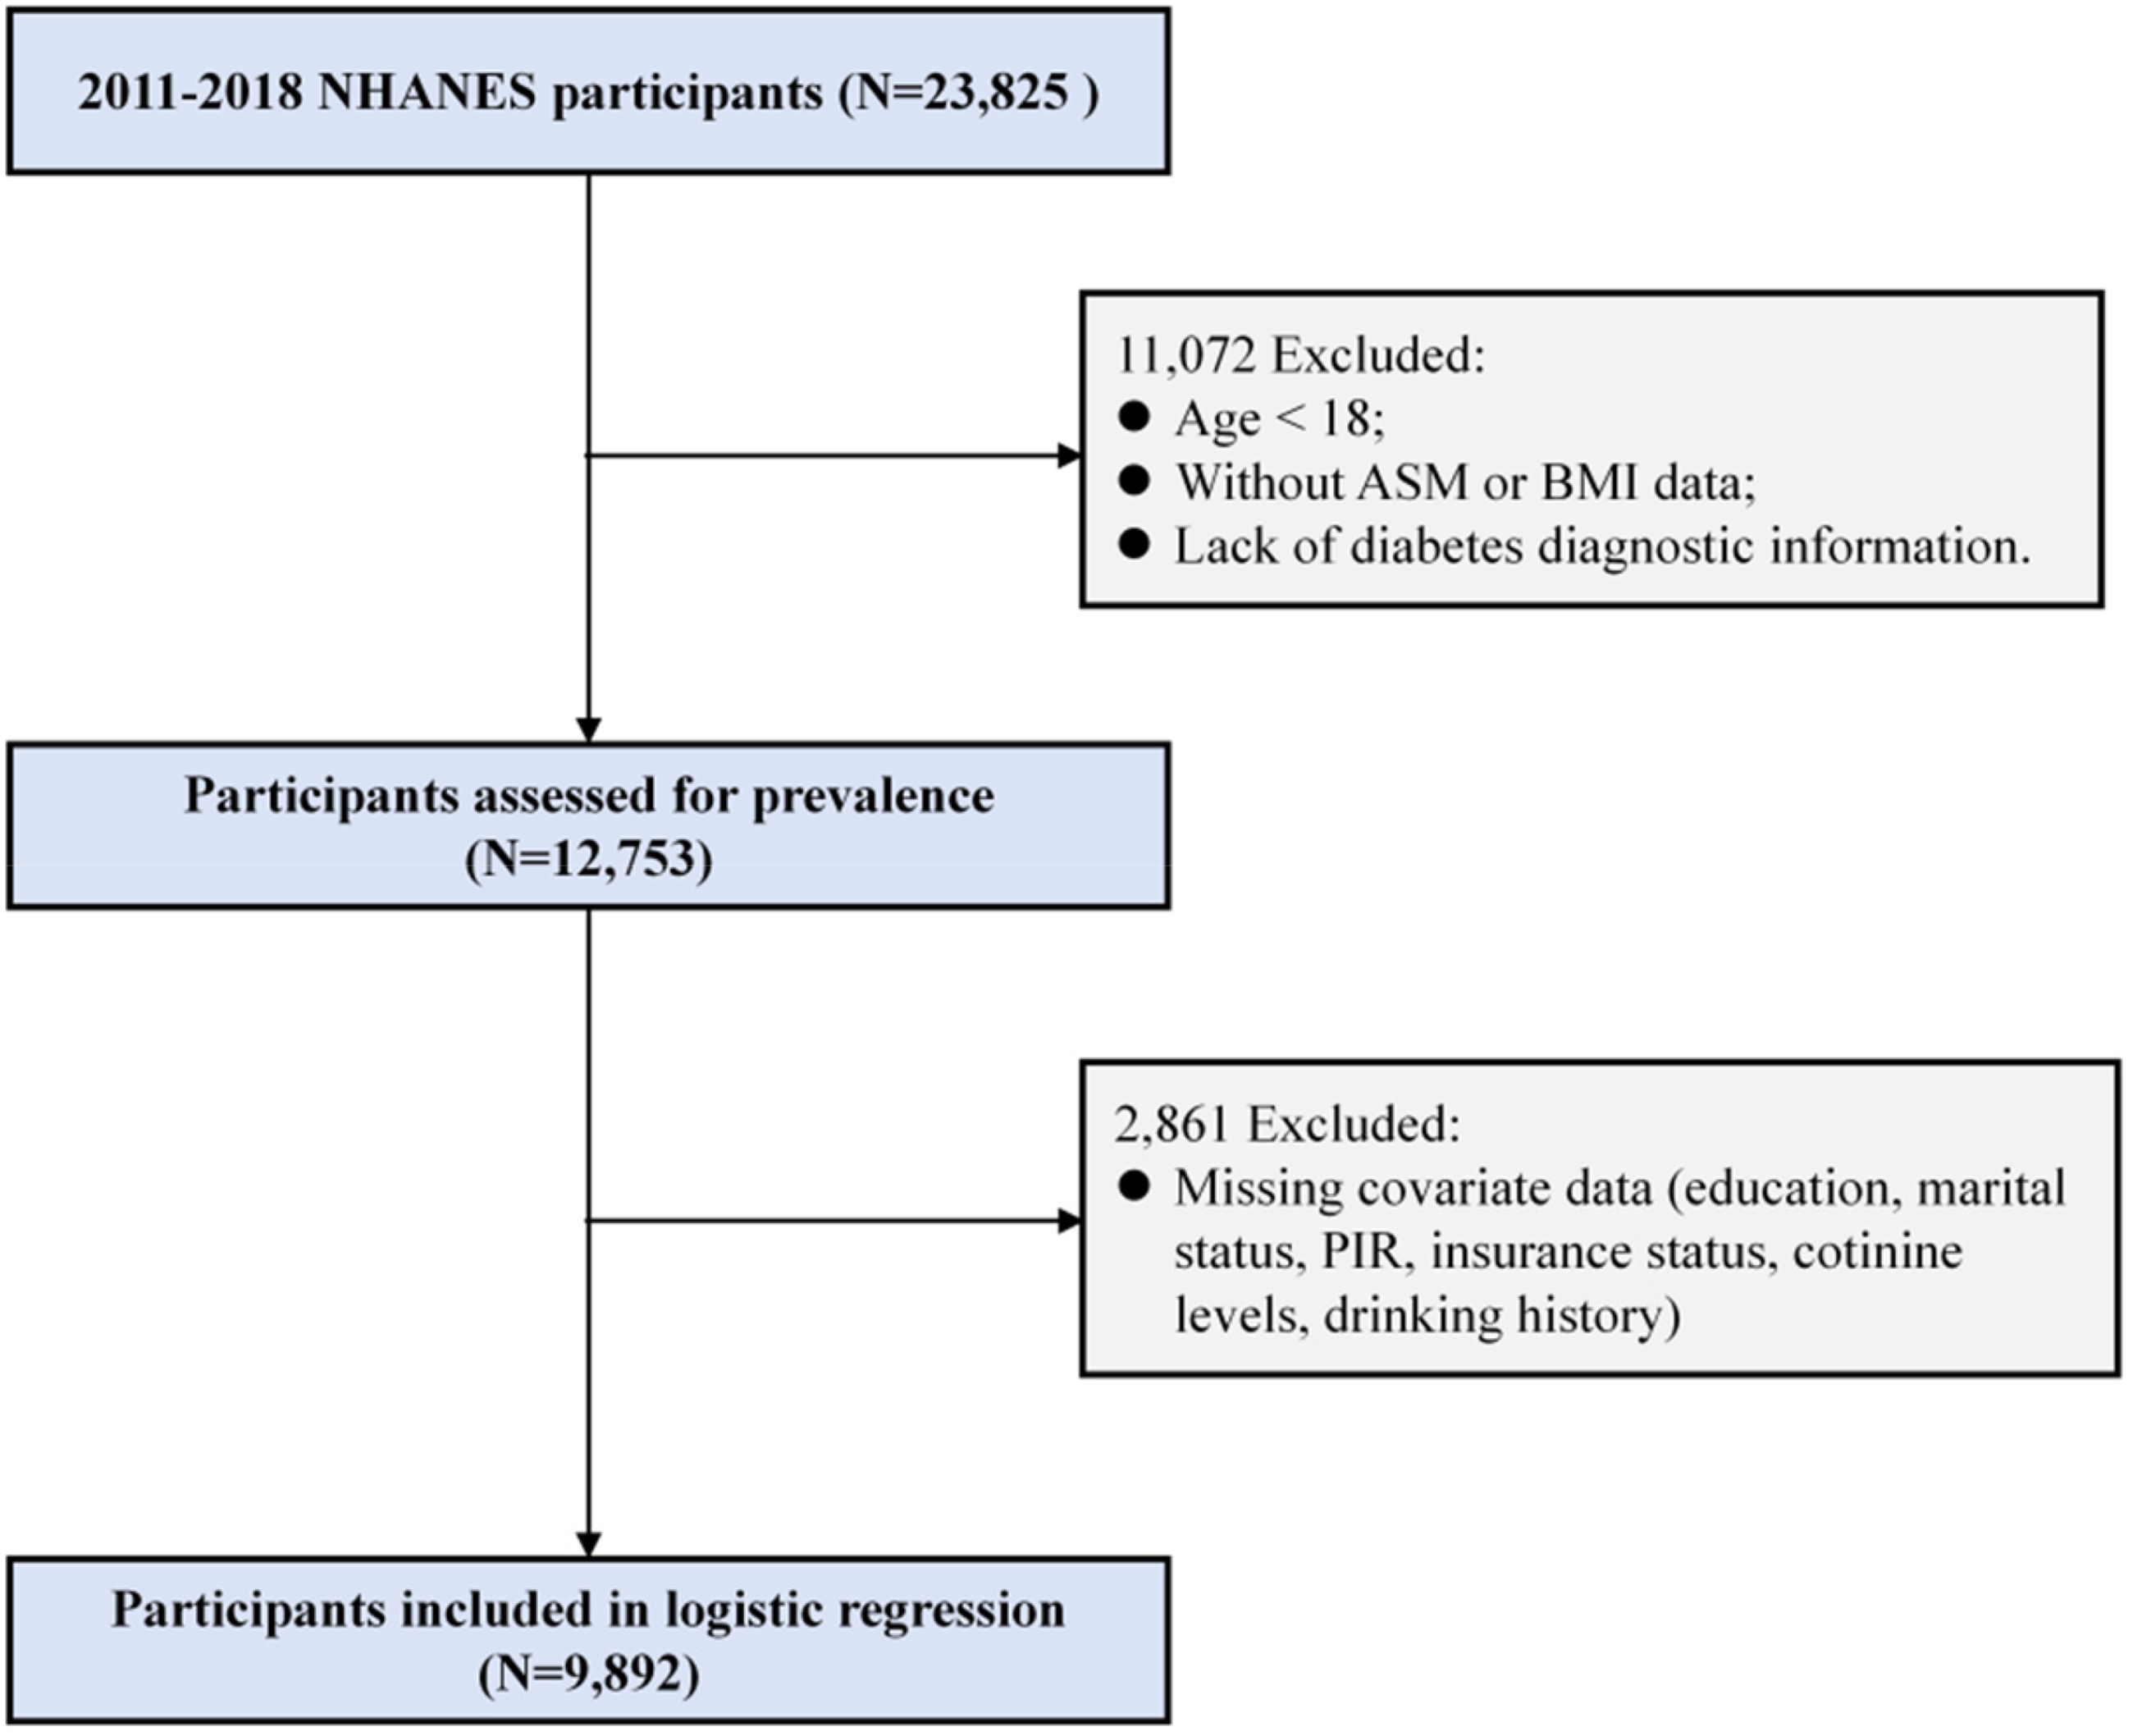
Inclusion flowchart.
Measurements
Diagnoses followed American Diabetes Association criteria. 20 Diabetes was defined as meeting at least one of the following: (1) self-reported physician diagnosis; (2) fasting plasma glucose (FPG) ≥7.0 mmol/L; or (3) hemoglobin A1c (HbA1c) ≥6.5%. Prediabetes was defined as self-reported diagnosis or laboratory values of FPG 6.1–6.9 mmol/L or HbA1c 5.7–6.4%.
ASM was derived from dual-energy X-ray absorptiometry (DXA) scans, quantified as the sum of lean mass in arms and legs (excluding bone mineral content). Scans were performed using Hologic QDR 4500A fan-beam densitometers (1999–2006) and Hologic Discovery A densitometers with Apex 3.2 software (2011–2018). 21 Low muscle mass was defined using the Foundation for the National Institutes of Health (criteria: ASM adjusted for BMI (ASM/BMI) < 0.789 for men and <0.512 for women. 22
Statistical analysis
Crude and age-standardized prevalence rates (adjusted to the 2000 U.S. standard population) of diabetes and prediabetes were calculated across sociodemographic strata: age, sex, race, education attainment, marital status, insurance type, and PIR (household income relative to federal poverty levels). BMI was categorized as underweight (<18.5 kg/m2), normal weight (18.5–24.9 kg/m2), overweight (25.0–29.9 kg/m2), and obese (≥30 kg/m2). Between-group differences were assessed via overlapping 95% CIs with age adjustment. 23 Data suppression followed National Center for Health Statistics guidelines for unstable estimates. 24 Subgroup analyses compared diabetes/prediabetes prevalence among adults with low muscle mass aged 18–39 versus 40–59 years. To control for type I errors arising from multiple comparisons, Holm-Šidák correction was applied to intergroup comparisons in this study.
To assess the independent association between low muscle mass and impaired glucose metabolism, we conducted multivariate logistic regression analyses. The outcome measures examined were confirmed diabetes (yes/no) and confirmed prediabetes (yes/no). The primary exposure variable was low muscle mass status (yes/no). We constructed sequential models to test the robustness of the association: a crude model (unadjusted); model 1 adjusted for age and sex; model 2 further adjusted for sociodemographic factors including race, educational attainment, marital status, insurance type, PIR, and BMI classification. To further control for key behavioral confounders, we developed model 3 using objectively measured indicators. This model included all covariates from model 2 and added serum cotinine levels and alcohol consumption history. All analyses accounted for the complex survey design of NHANES and utilized appropriate sampling weights. This study employed de-identified public data from the NHANES database. All participant information in the source data was anonymized to ensure no individual could be identified.
Results
Baseline characteristics
The analytical cohort comprised 12,753 adults from the NHANES database with complete data on ASM, BMI, and glycemic status. Among these participants, 1768 (13.9%) were diagnosed with low muscle mass. The overall sample was 51.7% male and 62.0% non-Hispanic White. Compared to individuals without low muscle mass, those with low muscle mass were older, more likely to be Mexican American, male, and less educated. Socioeconomic disparities were evident: adults with low muscle mass had lower household incomes and lower rates of private insurance coverage. Notably, obesity prevalence was significantly higher in the low muscle mass group (59.2% vs. 28.7%, P < 0.001). Detailed sociodemographic comparisons are presented in Table 1.
Characteristics of U.S. adults aged <65 years with and without low muscle mass, 2011–2018.
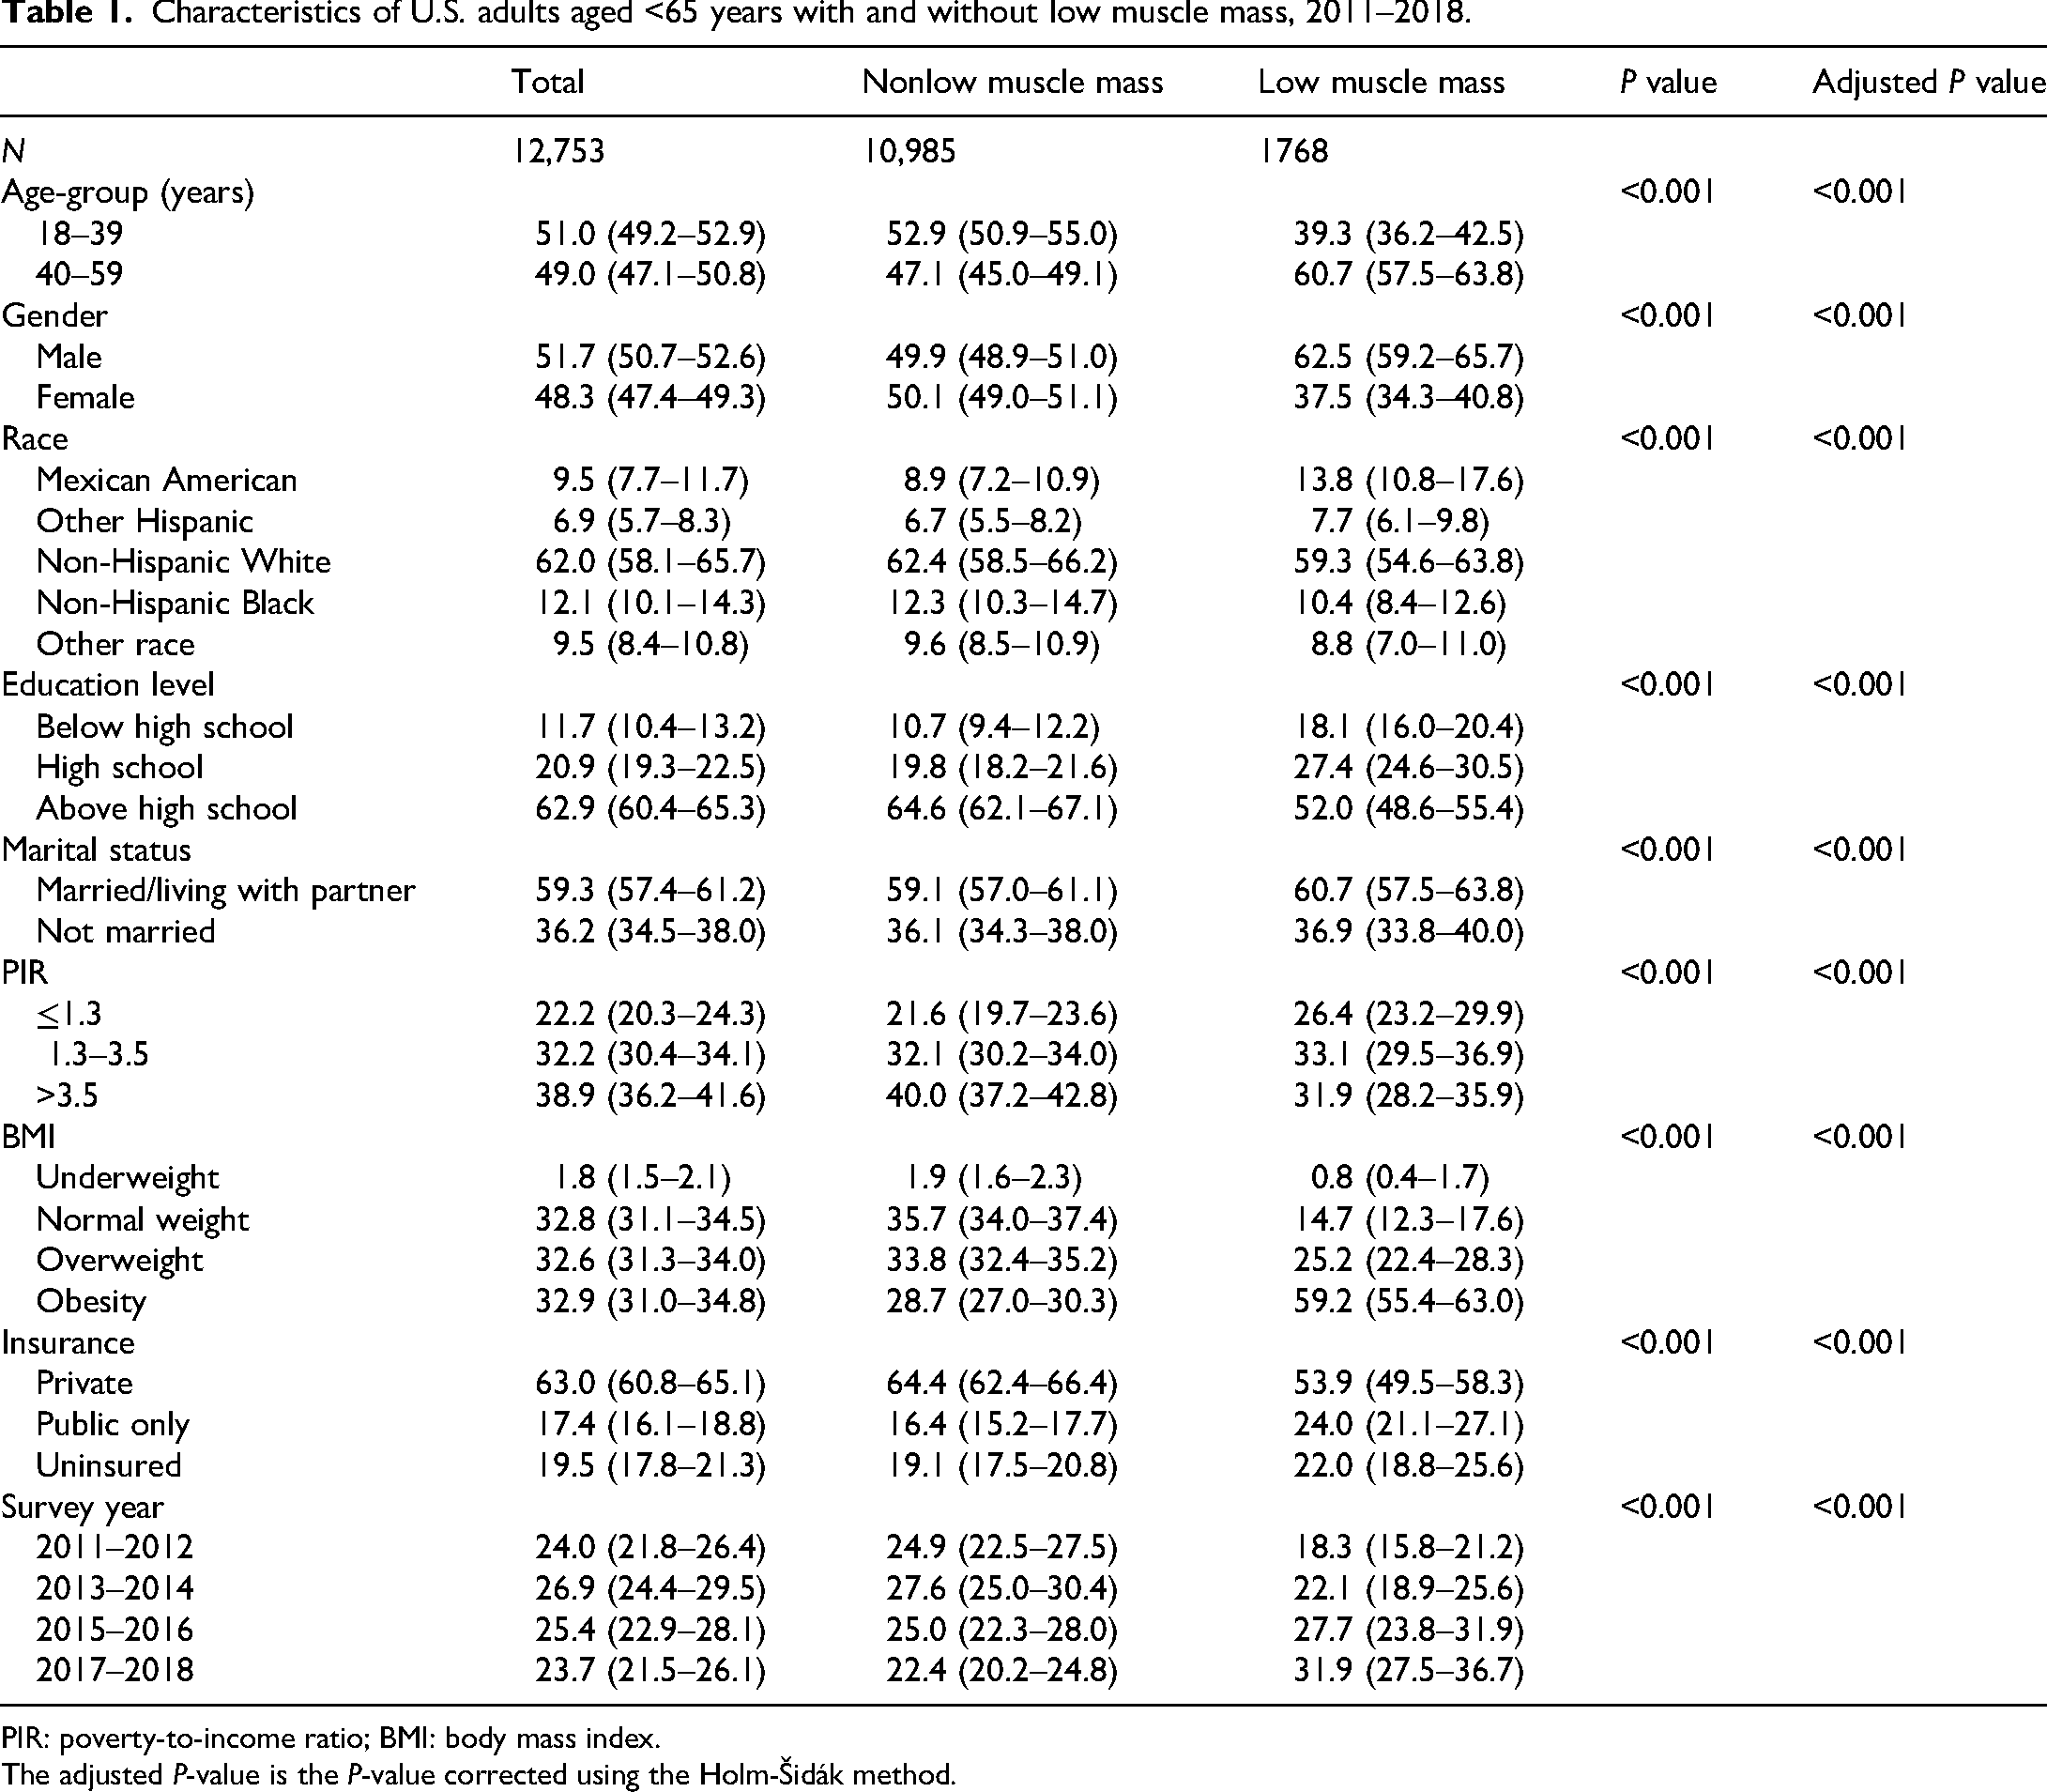
PIR: poverty-to-income ratio; BMI: body mass index.
The adjusted P-value is the P-value corrected using the Holm-Šidák method.
Prevalence of low muscle mass among U.S. adults
During 2011–2018, the crude prevalence of low muscle mass among U.S. adults aged ≥18 years was 13.8% (95% CI: 12.7–14.9). Unadjusted prevalence increased significantly across survey cycles: 10.5% (95% CI: 8.9–12.5) in 2011–2012, 11.3% (95% CI: 9.9–12.9) in 2013–2014, 15.0% (95% CI: 12.5–18.0) in 2015–2016, and 18.6% (95% CI: 15.8–21.7) in 2017–2018. After age standardization to the 2000 U.S. population, the overall prevalence of low muscle mass during 2011–2018 was 13.6% (95% CI: 12.6–14.6), with cycle-specific rates rising from 10.3% (8.6–12.0) in 2011–2012 to 18.4% (16.1–20.7) in 2017–2018. Both crude and age-standardized prevalence demonstrated a significant upward temporal trend over the study period (Figure 2).

Crude and age-standardized prevalence of low muscle mass among U.S. adults, 2011–2018. Crude: unadjusted prevalence of sarcopenia; Age-standardized: age-standardized prevalence of sarcopenia.
Diabetes prevalence among U.S. adults with low muscle mass by survey cycle
From 2011 to 2018, the age-standardized prevalence of diabetes among U.S. adults with low muscle mass was 14.4% (95% CI: 12.2–16.6), with a crude prevalence of 16.6% (14.3–19.2) (Table 2). Across survey cycles, age-standardized diabetes prevalence remained stable: 13.8% (9.9–17.8) in 2011–2012, 13.6% (9.8–17.5) in 2013–2014, 15.3% (11.6–19.0) in 2015–2016, and 14.4% (9.5–19.3) in 2017–2018 (Supplemental Table S1 and Figure 3).

Age-standardized prevalence of diabetes and prediabetes among U.S. adults with low muscle mass by survey cycle, 2011–2018.
Age-standardized prevalence of diabetes among U.S. adults with low muscle mass.
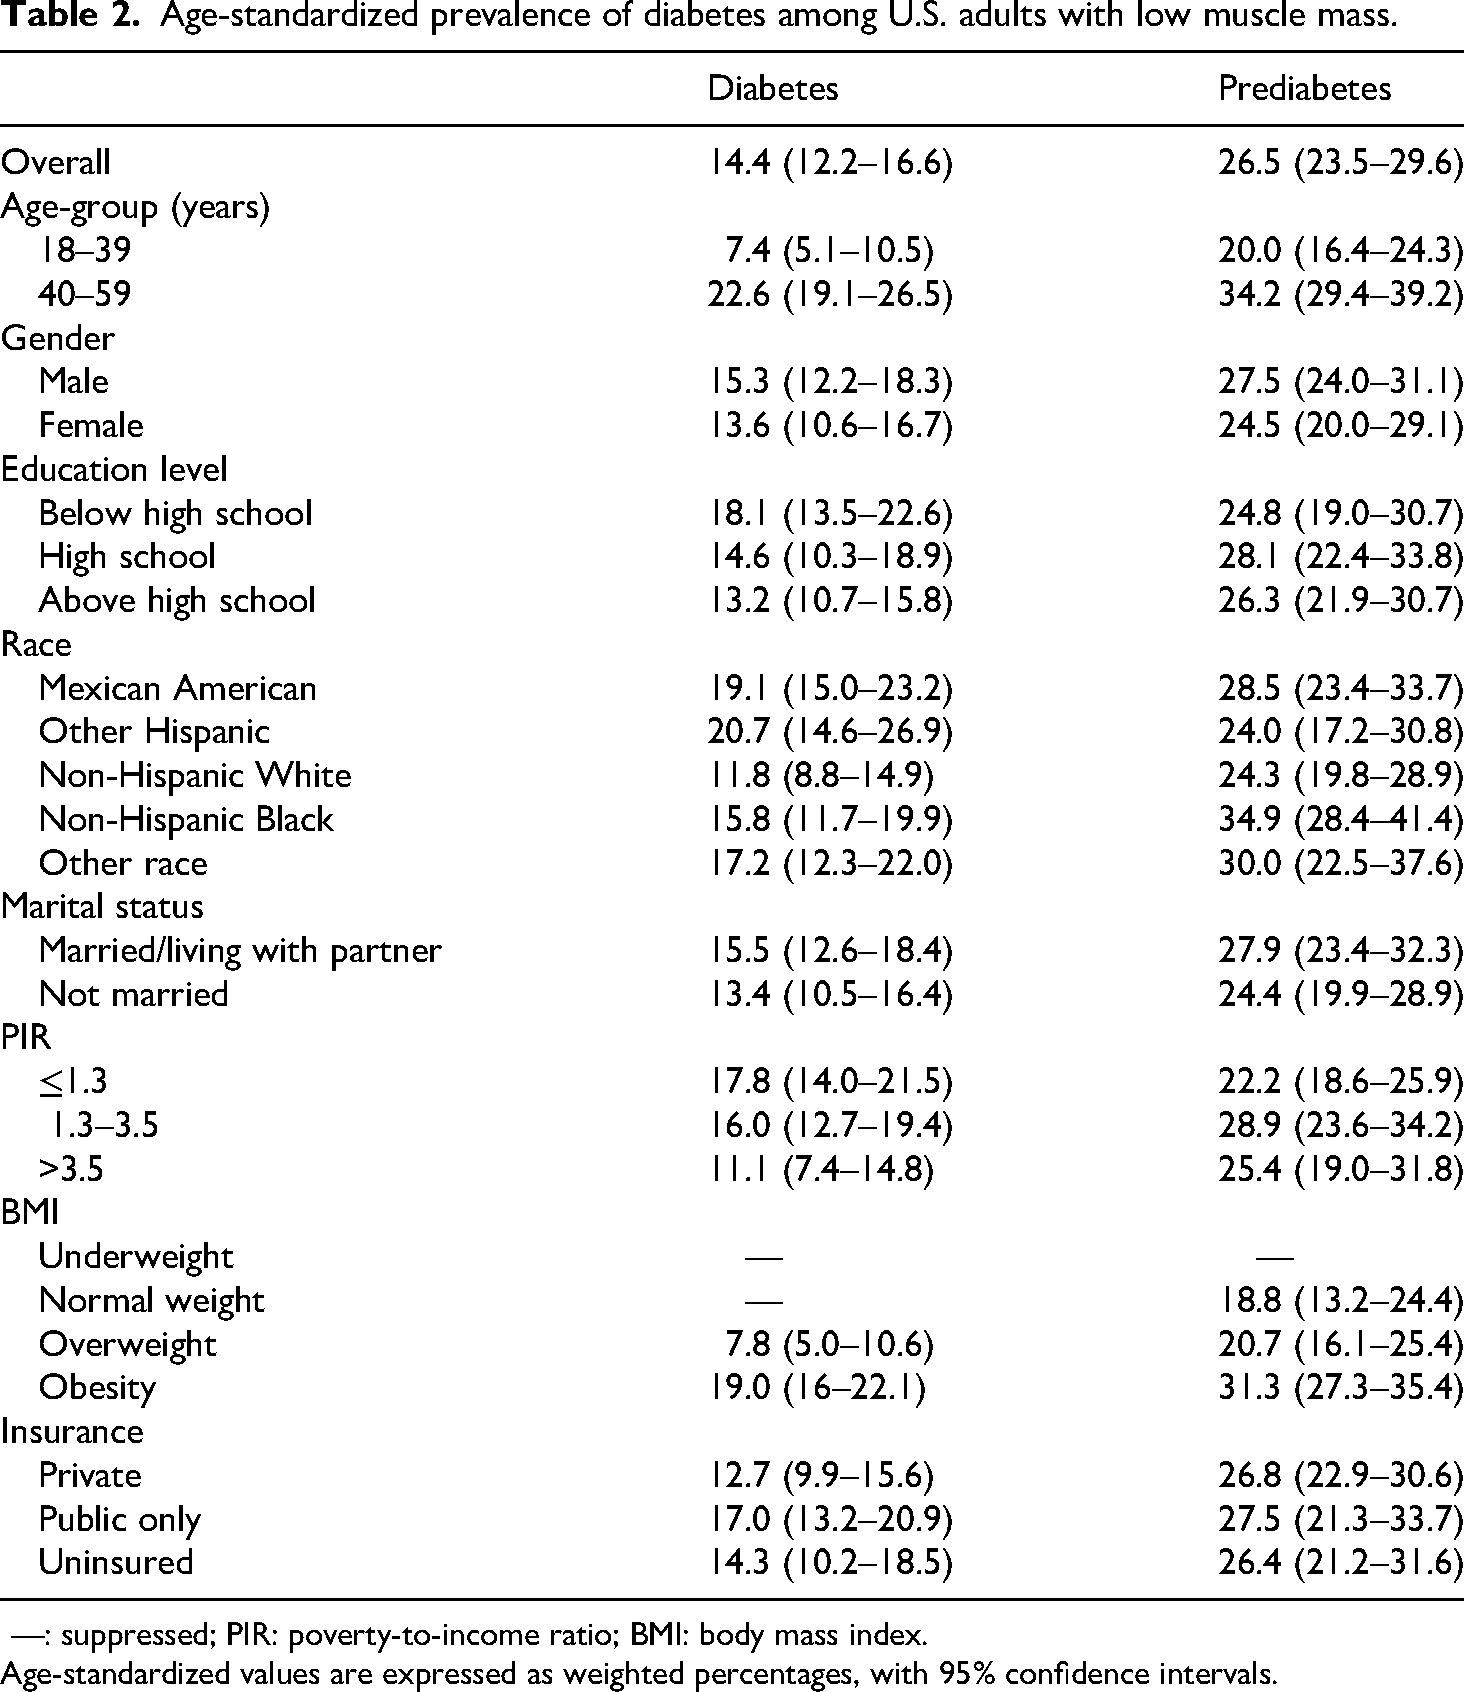
—: suppressed; PIR: poverty-to-income ratio; BMI: body mass index.
Age-standardized values are expressed as weighted percentages, with 95% confidence intervals.
Age-standardized diabetes prevalence increased with advancing age across all cycles, rising from 7.4% (5.1–10.5) in adults aged 18–39 years to 22.6% (19.1–26.5) in those aged 40–59 years. While men exhibited higher overall diabetes prevalence than women, temporal trends diverged: male prevalence increased from 13.1% (2011–2012) to 16.7% (2017–2018), whereas female prevalence decreased from 15.1% to 11.5% over the same period. Significant disparities persisted: individuals with less than high school education had higher prevalence than those with higher education, Mexican Americans and other Hispanics exceeded non-Hispanic Whites and Blacks, married/living-with-partner adults surpassed unmarried individuals, and low-income (PIR ≤1.3) populations had 1.6-fold higher odds than high-income (PIR >3.5) groups. Public insurance holders exhibited the highest prevalence compared to private insurance or uninsured individuals.
Prediabetes prevalence among U.S. adults with low muscle mass by survey cycle
The age-standardized prediabetes prevalence among adults with low muscle mass was 26.5% (95% CI: 23.5–29.6) during 2011–2018, with a crude prevalence of 28.6% (25.6–31.8) (Table 2). Cycle-specific rates showed minimal variation: 26.2% (20.3–32.0) in 2011–2012, 24.0% (18.7–29.3) in 2013–2014, 27.4% (21.8–33.0) in 2015–2016, and 27.6% (21.3–33.9) in 2017–2018 (Supplemental Table S2 and Figure 3).
Age-standardized prediabetes prevalence increased with age, from 20.0% (16.4–24.3) in 18–39-year-olds to 34.2% (29.4–39.2) in 40–59-year-olds. While men had higher overall prevalence than women, sex-specific trends fluctuated: male prevalence exceeded female rates in 2011–2012 (27.6% vs. 23.6%) and 2013–2014 (28.5% vs. 17.1%), but converged in later cycles (2015–2016: 26.4% vs. 27.7%; 2017–2018: 27.6% vs. 27.7%). Paradoxically, adults with high school or above education had higher prevalence than those with lower education. Non-Hispanic Blacks exhibited the highest prevalence (34.9%), surpassing Mexican Americans (28.5%) and non-Hispanic Whites (24.3%). Married/living-with-partner adults and higher-income individuals showed elevated rates compared to unmarried and low-income groups. Public insurance holders again had the highest prevalence compared with private insurance holders or uninsured adults.
Diabetes and prediabetes prevalence among U.S. adults with low muscle mass by age group
From 2011 to 2018, middle-aged adults (40–59 years) with low muscle mass exhibited significantly higher age-standardized prevalence of diabetes (22.6%, 95% CI: 19.1–26.5) and prediabetes (34.2%, 95% CI: 29.4–39.2) compared to younger adults (18–39 years), who demonstrated lower rates (diabetes: 7.4%, 95% CI: 5.1–10.5; prediabetes: 20.0%, 95% CI: 16.4–24.3) (Supplemental Tables S3 and S4 and Figure 4). Among younger adults (18–39 years), higher diabetes prevalence was observed in those with less than high school education, other Hispanic individuals, and married or cohabitating populations. In contrast, middle-aged adults (40–59 years) showed elevated diabetes prevalence among Mexican Americans and those relying solely on public health insurance. However, after adjusting the P-values, no significant differences in diabetes prevalence were observed across the subgroups. Prediabetes prevalence was highest in middle-aged adults with moderate income levels (PIR >1.3 and ≤3.5).

Prevalence of diabetes and prediabetes among U.S. adults with low muscle mass by age group, 2011–2018.
Correlation between low muscle mass and impaired glucose metabolism
In a multivariable logistic regression model adjusted for potential confounding variables, low muscle mass was found to be significantly associated with diabetes risk (OR: 1.38, 95% CI: 1.07–1.78) compared with individuals without low muscle mass. After adjusting for age and sex, low muscle mass was found to be significantly associated with the risk of prediabetes (OR: 1.30, 95% CI: 1.08–1.57); however, this association was not significant in the fully adjusted model (P > 0.05) (Table 3).
Correlation between low muscle mass and diabetes and prediabetes.

OR: odds ratio; CI: confidence interval; PIR: poverty-to-income ratio; BMI: body mass index.
Crude: Crude model:
Model 1 adjusted for age and sex; Model 2 adjusted for age, sex, race, educational attainment, marital status, insurance type, PIR, and BMI; Model 3 adjusted for age, sex, race, educational attainment, marital status, insurance type, PIR, BMI, cotinine levels, and drinking history.
Diabetes duration
Adults with low muscle mass and diabetes had a longer mean disease duration compared to individuals without low muscle mass (10.0 years, 95% CI: 7.6–12.3 vs. 8.3 years, 95% CI: 7.5–9.0), highlighting the association between muscle loss and accelerated metabolic dysfunction.
Discussion
This nationally representative study provides critical insights into the dual burden of low muscle mass and dysglycemia among U.S. adults. First, the age-standardized prevalence of low muscle mass increased markedly from 10.3% in 2011–2012 to 18.4% in 2017–2018, paralleling population aging and rising obesity rates. 25 Second, over 40% of adults with low muscle mass exhibited dysglycemia (14.4% diabetes, 26.5% prediabetes), with pronounced disparities across sociodemographic strata.
Notably, 59.2% of adults with low muscle mass in our cohort had obesity, indicating a “low muscle mass obesity” phenotype characterized by ectopic fat infiltration into muscle, which amplifies insulin resistance through lipotoxicity and chronic inflammation. 26 Studies suggest that intramyocellular lipid accumulation disrupts insulin signaling pathways (e.g. insulin receptor substrates 1 phosphorylation) more severely than systemic adiposity, 27 potentially explaining the heightened dysglycemic burden. The temporal stability of diabetes prevalence (13.6–15.3% across cycles) among adults with low muscle mass contrasts sharply with rising low muscle mass rates, implying that current diabetes management strategies may inadequately address muscular health in this population.
Our findings reinforce the bidirectional pathophysiological link between low muscle mass and diabetes. The prolonged diabetes duration (10.0 years) in sarcopenic individuals may exacerbate muscle loss via hyperglycemia-induced proteolysis and mitochondrial dysfunction, 28 while diminished muscle mass further impairs glucose disposal, creating a vicious cycle. Emerging evidence implicates myokines (e.g. irisin, myostatin) as mediators of this crosstalk: sarcopenic individuals exhibit reduced circulating irisin levels, impairing adipose tissue browning and glucose uptake. 29 Additionally, the chronic low-grade inflammation in sarcopenia—marked by elevated interleukin-6 and tumor necrosis factor-α—may further suppress insulin receptor sensitivity. 30 These mechanisms collectively form a self-perpetuating loop, necessitating interventions targeting both muscle preservation and glycemic control.
Higher diabetes prevalence among older (40–59 years), socioeconomically disadvantaged, and Hispanic subgroups underscores structural health determinants—limited access to nutrient-dense foods, physical activity resources, and preventive care—that synergistically drive muscle wasting and insulin resistance. 28 The elevated type 2 diabetes prevalence in middle-aged males compared to females 31 aligns with our findings. Prior studies report higher diabetes rates among Hispanic adults over 20 versus non-Hispanic Whites, 32 though heterogeneity exists within Hispanic subgroups. Specifically, Puerto Rican and Mexican Americans drive elevated aggregate diabetes prevalence, while Cuban, Central, and South American subgroups exhibit rates comparable to non-Hispanic Whites. 32 Our study corroborates this pattern, with Mexican American and low-income (PIR ≤1.3) adults with low muscle mass demonstrating 1.6-fold higher diabetes odds than non-Hispanic White and high-income counterparts, reflecting broader healthcare inequity patterns.
The observed trend of higher prediabetes prevalence among educated and affluent adults with low muscle mass, while not statistically significant after multiple comparison correction, warrants consideration. It suggests that socioeconomic advantages may not uniformly protect against metabolic risk in the context of low muscle mass, pointing to potential complex underlying mechanisms. First, greater healthcare access does not uniformly equate to better outcomes, as costly care often fails to improve health in U.S. Medicare populations. 33 While healthcare access improves outcomes to a point, complementary focus on social determinants remains critical. 34 Second, compensatory risk behaviors—such as sedentary occupations, 35 high refined-carbohydrate intake (even with “health-conscious” diets), and chronic stress-induced cortisol elevation 36 —may attenuate socioeconomic health advantages.
Beyond these behavioral pathways, physiological and iatrogenic factors may further contribute to the observed paradox. High-socioeconomic status (SES) sarcopenic individuals may exhibit visceral adiposity-driven metabolic obesity rather than generalized adiposity, a fat distribution pattern strongly linked to insulin resistance. 37 Iatrogenic effects of medical interventions, including widespread statin use (for cardiovascular prevention) and cyclical weight-loss behaviors, may also disproportionately affect educated populations, inadvertently exacerbating muscle loss and dysglycemia. 38 These findings suggest that traditional SES-based health disparity frameworks may overlook hidden metabolic risks in high-income, high-education groups, warranting future research on physical activity patterns, adiposity phenotypes, and medication use in these populations.
Multivariate logistic regression analysis revealed that low muscle mass independently increased the risk of diabetes by 38%, further confirming its role as an independent risk factor. Upon full adjustment, the attenuation of this association with prediabetes suggests that during the early stages of impaired glucose metabolism, this link may be more strongly mediated by shared sociodemographic and anthropometric factors; alternatively, as impaired glucose tolerance progresses to overt diabetes, the metabolic consequences of low muscle mass become more pronounced.
The rising low muscle mass prevalence alongside temporally stable diabetes rates signals failure of current prevention strategies. Traditional diabetes care prioritizes glycemic control while neglecting muscular health metrics (e.g. low muscle mass screening in diabetes clinics). Integrated dual interventions—such as protein supplementation combined with resistance training—could disrupt the low muscle mass–dysglycemia cascade. Policy-level expansion of Medicare coverage for DXA scans and community resistance-training programs may reduce disparities.
Strengths and limitations
This study benefits from nationally representative NHANES data and rigorous age standardization, enhancing generalizability. However, limitations warrant consideration. First, NHANES excludes institutionalized populations; absence of DXA data for frail or elderly individuals unable to attend mobile examination center exams may underestimate low muscle mass rates. Second, grip strength assessment across varying NHANES cycles precluded its inclusion. Third, owing to the cross-sectional design of NHANES, we cannot establish a causal relationship between low muscle mass and glucose abnormalities (diabetes/prediabetes). Future prospective cohort studies are required to validate the longitudinal association between low muscle mass and diabetes risk, and to elucidate its potential causal pathways and directionality. Despite these limitations, the use of nationally representative data spanning 2011–2018 ensures strong generalizability to noninstitutionalized U.S. adults. Sampling weights and age standardization minimized demographic bias. Concurrent analysis of diabetes and prediabetes enabled comprehensive dysglycemia burden assessment, addressing a critical gap in low muscle mass comorbidity profiles. Sociodemographic stratification revealed health disparities often masked in aggregate analyses, informing targeted interventions.
Conclusion
This study reveals that low muscle mass is a significant, independent risk factor for diabetes in the U.S. adult population. To translate this into practice, we propose specific steps: first, integrating opportunistic screening for low muscle mass (e.g. via bioelectrical impedance analysis) into annual wellness visits for high-risk individuals; second, prioritizing low muscle mass screening in patients with diabetes in primary care and embedding muscle health assessments into prediabetes and obesity management protocols in specialty clinics; and third, supporting policy initiatives to expand Medicare coverage for low muscle mass diagnostics in high-risk groups and to include resistance training and nutrition guidance in public health programs for metabolic disease prevention.
Supplemental Material
sj-docx-1-sci-10.1177_00368504261430046 - Supplemental material for Prevalence of diagnosed diabetes and prediabetes among U.S. adults with low muscle mass: A cross-sectional study, 2011–2018
Supplemental material, sj-docx-1-sci-10.1177_00368504261430046 for Prevalence of diagnosed diabetes and prediabetes among U.S. adults with low muscle mass: A cross-sectional study, 2011–2018 by Mengjie Zhao, Jing Cao, Zirong Li, Linli Chen, Wantong Zhang and Qiuyan Li in Science Progress
Supplemental Material
sj-doc-2-sci-10.1177_00368504261430046 - Supplemental material for Prevalence of diagnosed diabetes and prediabetes among U.S. adults with low muscle mass: A cross-sectional study, 2011–2018
Supplemental material, sj-doc-2-sci-10.1177_00368504261430046 for Prevalence of diagnosed diabetes and prediabetes among U.S. adults with low muscle mass: A cross-sectional study, 2011–2018 by Mengjie Zhao, Jing Cao, Zirong Li, Linli Chen, Wantong Zhang and Qiuyan Li in Science Progress
Supplemental Material
sj-pdf-3-sci-10.1177_00368504261430046 - Supplemental material for Prevalence of diagnosed diabetes and prediabetes among U.S. adults with low muscle mass: A cross-sectional study, 2011–2018
Supplemental material, sj-pdf-3-sci-10.1177_00368504261430046 for Prevalence of diagnosed diabetes and prediabetes among U.S. adults with low muscle mass: A cross-sectional study, 2011–2018 by Mengjie Zhao, Jing Cao, Zirong Li, Linli Chen, Wantong Zhang and Qiuyan Li in Science Progress
Footnotes
Acknowledgments
We extend our thanks to the NHANES team for their significant role in data collection.
Ethical considerations and consent to participate
The NHANES study protocol received approval from the Institutional Review Board at the CDC's National Center for Health Statistics. All participants provided written informed consent before taking part in the NHANES program.
Author contributions
Mengjie Zhao: methodology, writing—original draft, and writing—review and editing. Jing Cao: resources, investigation, and data curation. Zirong Li: software, supervision, and validation. Linli Chen: formal analysis, visualization, methodology, and writing—review and editing. Wantong Zhang: writing—review and editing. Qiuyan Li: project administration and conceptualization.
Funding
The authors disclosed receipt of the following financial support for the research, authorship, and/or publication of this article: This work was supported by the Special Research Fund of the National Clinical Research Center for Cardiovascular Diseases of Traditional Chinese Medicine (CMC2022003); the Beijing Science and Technology New Star Project—Zhang Wantong (20230484370); and the Fundamental Research Funds for Central-level Non-profit Research Institutes (ZZ15-XY-PT-08).
Declaration of conflicting interests
The authors declared no potential conflicts of interest with respect to the research, authorship, and/or publication of this article.
Data availability
Supplemental material
Supplemental material for this article is available online.
References
Supplementary Material
Please find the following supplemental material available below.
For Open Access articles published under a Creative Commons License, all supplemental material carries the same license as the article it is associated with.
For non-Open Access articles published, all supplemental material carries a non-exclusive license, and permission requests for re-use of supplemental material or any part of supplemental material shall be sent directly to the copyright owner as specified in the copyright notice associated with the article.