
Abstract
Objective
Adolescence is a critical window for optimizing peak bone mass. This study evaluated the independent association between dietary fiber intake and total body bone mineral density (BMD) in a representative sample of U.S. adolescents.
Methods
This cross-sectional study analyzed 2476 participants (aged 12–19 years) from the National Health and Nutrition Examination Survey 2011–2018. Dietary fiber intake was calculated as the average of two 24-h recalls. Total BMD was measured using dual-energy X-ray absorptiometry. Multivariable linear regression, generalized additive models, and stratified analyses were utilized, adjusting for sociodemographics, body mass index (BMI), physical activity, renal function markers (creatinine, blood urea nitrogen), and dietary variables (calcium, vitamin C, and energy intake).
Results
Dietary fiber intake was positively associated with total BMD in the fully adjusted model (β = 0.001 g/cm2, 95% CI: 0.001–0.002; p = 0.029). Compared to the lowest tertile (T1), the highest tertile (T3) exhibited significantly higher BMD (β = 0.016 g/cm2, 95% CI: 0.001–0.031; p = 0.038; p for trend = 0.039). Generalized additive models confirmed a stable linear relationship (effective degrees of freedom = 1.0, p for nonlinearity = 0.158). Significant interactions were identified for gender, age, race, and BMI (p for interaction < 0.05), with the association being most pronounced among Non-Hispanic White participants and those in the medium-BMI tertile. Conversely, no significant interactions were observed for poverty–income ratio and physical activity (p for interaction > 0.05).
Conclusions
Higher dietary fiber intake is independently associated with increased total body BMD in U.S. adolescents. Optimizing fiber consumption may be a strategic approach for enhancing bone mass accrual, particularly among those with a healthy body weight.
Introduction
Osteoporosis, a systemic skeletal disorder characterized by reduced bone mass and microarchitectural deterioration, represents a major global health challenge due to heightened bone fragility and fracture risk.1–3 The accrual of peak bone mass during adolescence—a “golden window” for skeletal development—is a primary determinant of bone health in later life.4,5 Optimizing nutritional intake during this period is therefore a cornerstone of primary prevention strategies against osteoporosis. 6
While the skeletal benefits of calcium and vitamin D are well-established, there is burgeoning interest in the role of dietary fiber in bone metabolism.7–9 Long perceived as biologically inert, dietary fiber is now recognized for its systemic metabolic influence, primarily mediated via the gut–bone axis. 10 Colonic fermentation of fiber yields short-chain fatty acids (SCFAs), which acidify the intestinal lumen, thereby enhancing mineral solubility and facilitating passive absorption.11–13 Moreover, SCFAs have been shown to modulate systemic inflammation and immune cell function, potentially suppressing osteoclast-mediated bone resorption. 14
Nevertheless, epidemiological evidence characterizing the fiber–bone mineral density (BMD) nexus during adolescence remains sparse.15,16 Most previous studies have focused on adult populations, leaving a knowledge gap regarding this relationship during the critical phase of rapid skeletal modeling.17,18 Additionally, existing research has not consistently accounted for potential confounders such as renal function or the potential effect modification by obesity and physical activity level. Utilizing data from National Health and Nutrition Examination Survey (NHANES) 2011–2018, this study investigated the association between dietary fiber intake and total body BMD in U.S. adolescents. We hypothesized that higher fiber intake would be independently and linearly associated with increased BMD.
Methods
Study design and population
This cross-sectional study utilized data from four consecutive cycles of the NHANES 2011–2018. Reporting adheres to the STROBE guidelines (Supplementary Material). 19 The participant selection process is illustrated in Figure 1, resulting in a final analytical sample of 2476 adolescents. To evaluate potential selection bias, baseline characteristics were compared between the included participants and those excluded (Supplementary Table 1). The study was conducted in accordance with the Helsinki Declaration of 1975 (as revised in 2024). 20 The NHANES protocols were approved by the National Center for Health Statistics (NCHS) Research Ethics Review Board, with written informed consent obtained from all participants or their legal guardians. All data were de-identified to ensure anonymity.

Flowchart of participant selection and exclusion criteria from the National Health and Nutrition Examination Survey (NHANES) 2011–2018 cycles.
Exposure and outcome variables
The primary exposure was mean daily dietary fiber intake (g/day), calculated as the average of two 24-h dietary recall interviews. Consistent with nutritional epidemiology practices, fiber intake was analyzed both as a continuous variable to maximize statistical power and in tertiles (T1–T3) to evaluate potential threshold effects and enhance interpretability. The primary outcome was total body BMD (g/cm2), assessed via dual-energy X-ray absorptiometry (DXA, Hologic QDR-4500A) by certified technicians using standardized protocols.
Covariates
To control for potential confounding, multivariable models were adjusted for age, gender, race/ethnicity, education level, and the family poverty–income ratio (PIR). The PIR was categorized into three levels: low (≤1.3), middle (>1.3–3.5), and high (>3.5). Given the absence of Tanner stage data across the 2011–2018 NHANES cycles, age-stratified analysis (12–15 and 16–19 years) and multivariable adjustment for age served as proxies for maturation status. Anthropometric status was represented by body mass index (BMI); for stratified analyses, BMI was categorized into tertiles (low, medium, and high). Physical activity was categorized into a four-level variable (none, low, moderate, and high) to ensure consistency across the study period. Clinical laboratory markers included serum calcium and renal function indicators (creatinine and blood urea nitrogen). Dietary covariates comprised total energy, vitamin C, and calcium intake.
Statistical analysis
All analyses were performed using R (version 4.2.2) and EmpowerStats (version 4.2), accounting for NHANES complex survey design and weights (WTDR2D) to ensure nationally representative estimates. The independent association between fiber intake and total BMD was evaluated using three multivariable linear regression models: Model 1 (unadjusted), Model 2 (adjusted for age, gender, and race), and Model 3 (fully adjusted for all aforementioned covariates). To explore potential nonlinearity, we employed generalized additive models (GAM) with weighted smoothing curve fits and calculated the effective degrees of freedom (edf). Subgroup analyses, defined a priori based on established biological modifiers, were conducted for gender, age, race/ethnicity, PIR, BMI tertiles, and physical activity. A two-sided p-value < 0.05 was considered statistically significant.
Results
Baseline characteristics
The characteristics of the 2476 participants (mean age 15.70 ± 0.08 years; 52.06% male) are summarized in Table 1. Demographic and clinical characteristics varied significantly across dietary fiber tertiles, including gender, race, blood urea nitrogen, creatinine, and the intake of energy, vitamin C, and calcium (all p < 0.05). Specifically, participants in the highest tertile (T3) were predominantly male and exhibited higher total energy and mineral consumption. Importantly, comparisons between the analytical sample and excluded individuals revealed no significant disparities in primary exposure (fiber intake, p = 0.253) or outcome (total BMD, p = 0.087), confirming the representativeness of the study population.
Baseline characteristics of the study participants according to tertiles of dietary fiber intake (NHANES 2011–2018).
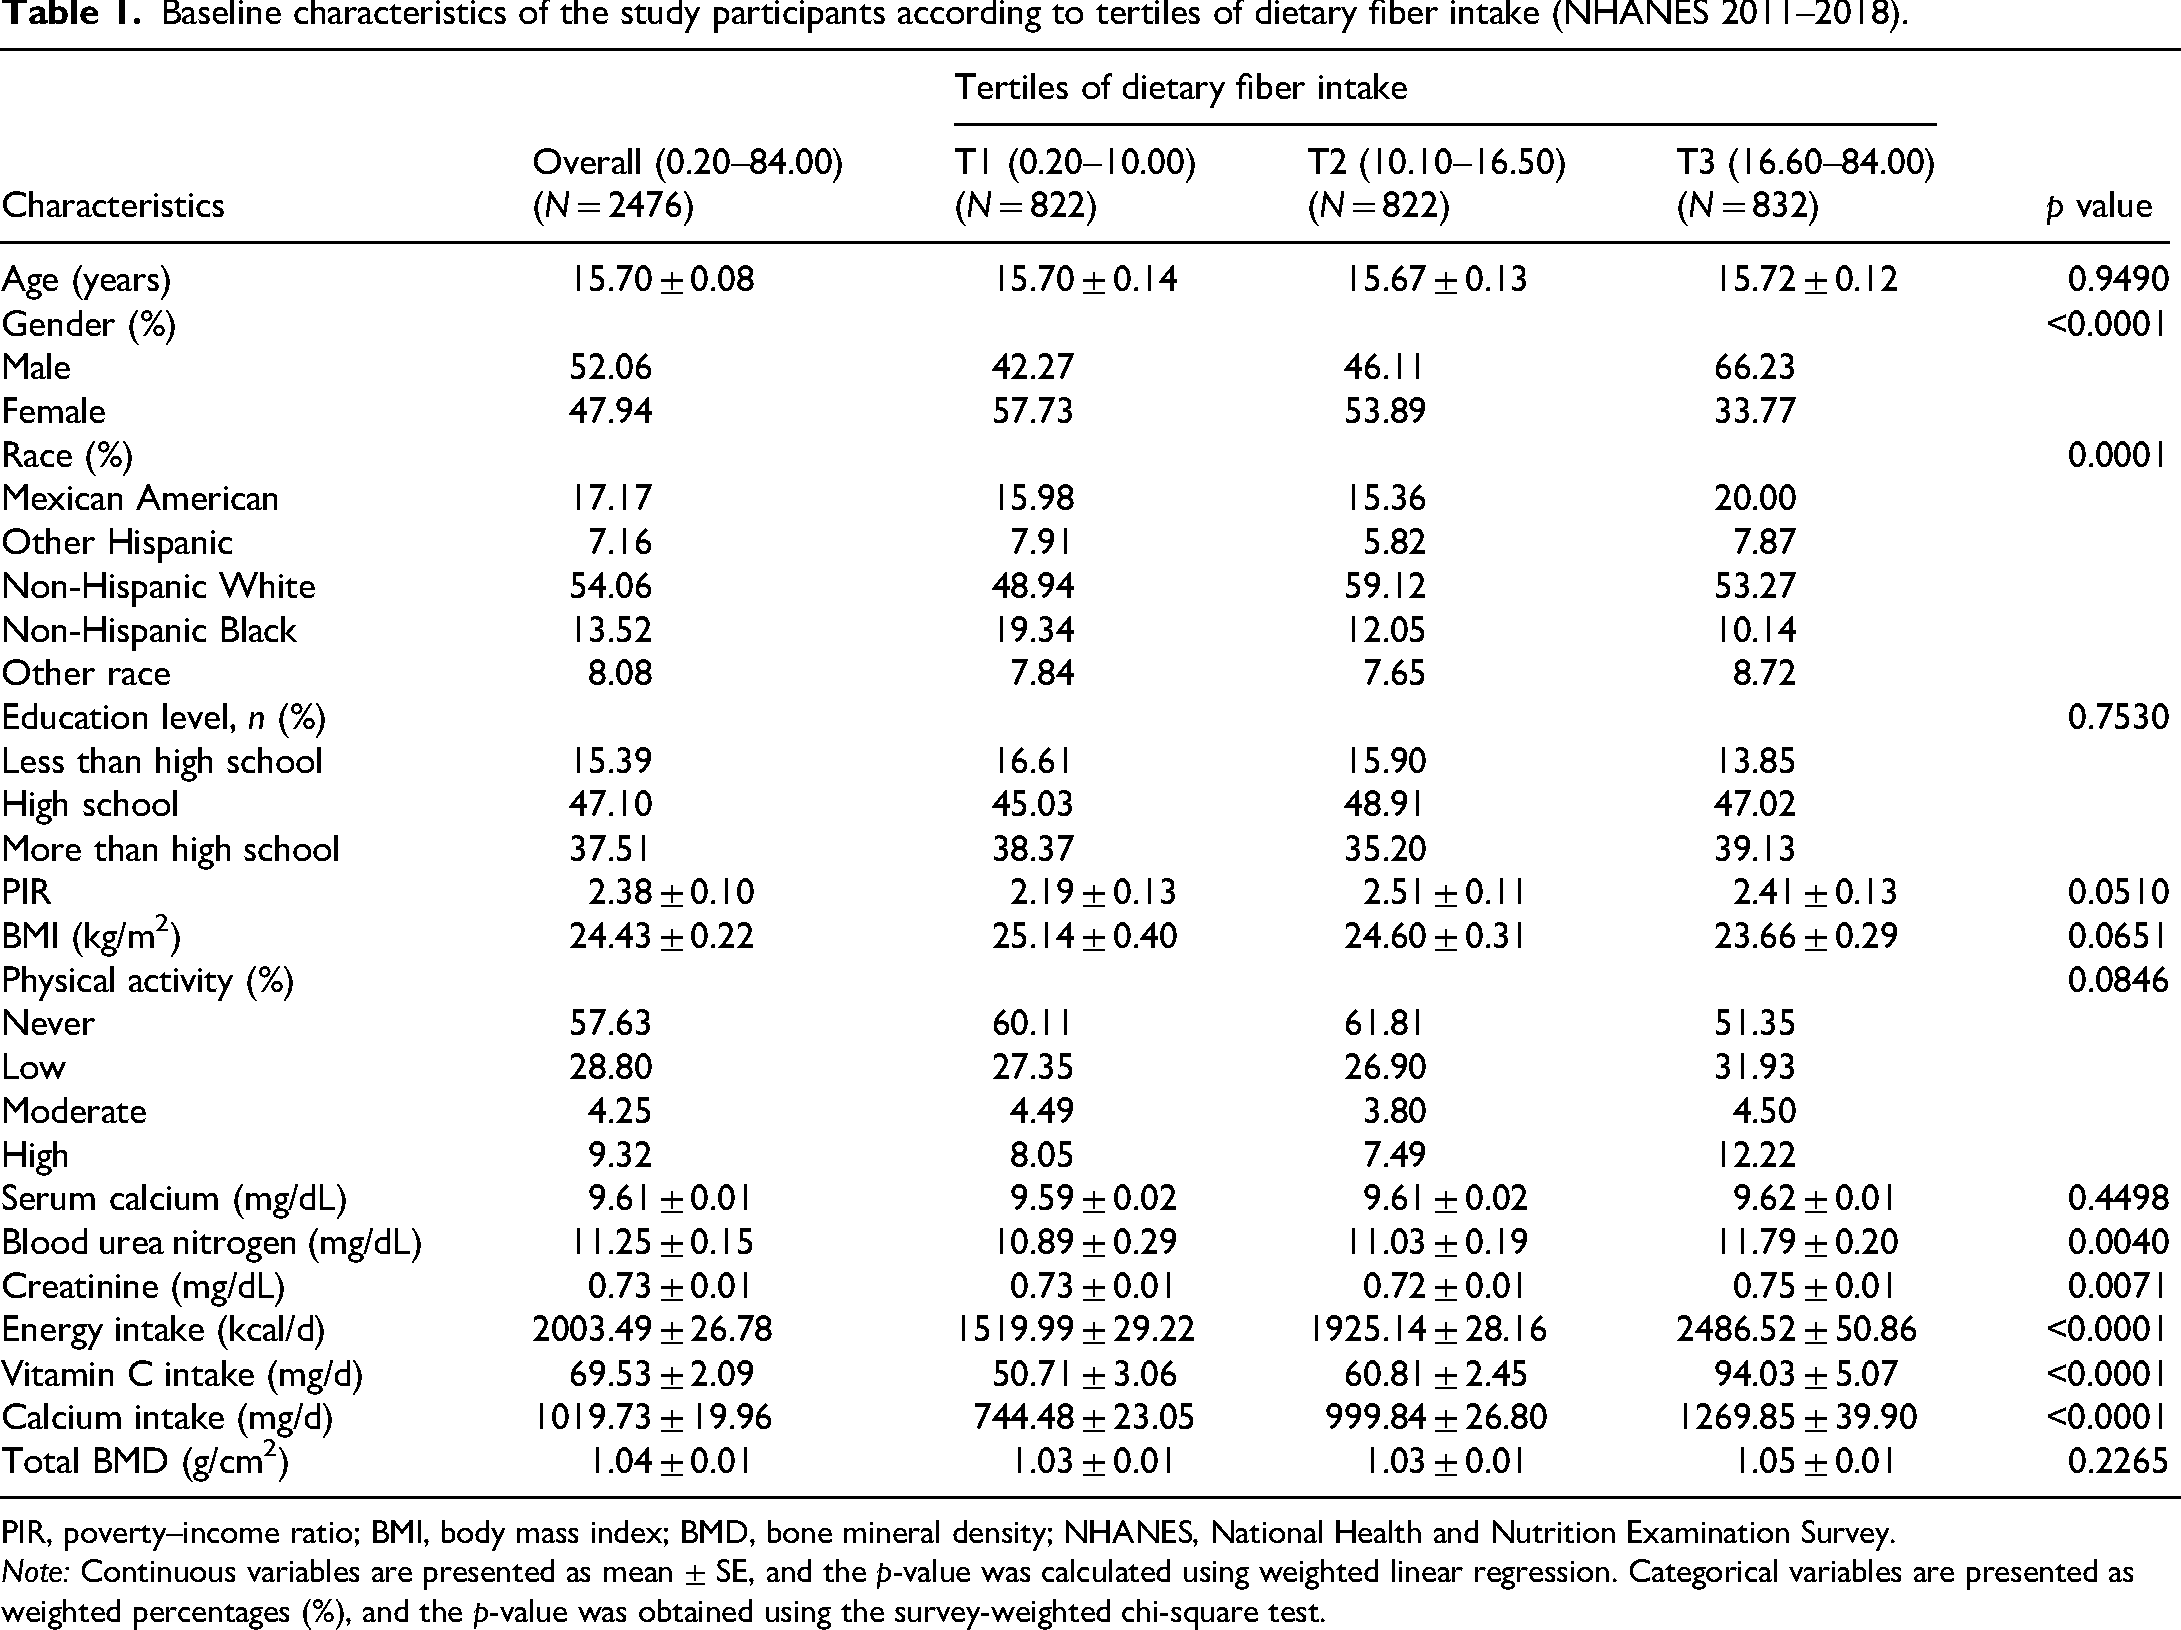
PIR, poverty–income ratio; BMI, body mass index; BMD, bone mineral density; NHANES, National Health and Nutrition Examination Survey.
Note: Continuous variables are presented as mean ± SE, and the p-value was calculated using weighted linear regression. Categorical variables are presented as weighted percentages (%), and the p-value was obtained using the survey-weighted chi-square test.
Association of dietary fiber intake with total BMD
As presented in Table 2, multivariable linear regression (Model 3) revealed that dietary fiber intake was significantly and positively associated with total BMD when treated as a continuous variable (β = 0.001, 95% CI: 0.001–0.002; p = 0.029). Notably, this association persisted after rigorous adjustment for dietary calcium intake, suggesting that the observed association is not fully explained by dietary calcium intake alone. In the tertile-based analysis, participants in the highest tertile (T3, 16.60–84.00 g/d) exhibited significantly higher total BMD than those in the lowest (T1, 0.20–10.00 g/d) (β = 0.016, 95% CI: 0.001–0.031; p = 0.038). The linear trend across tertiles was also statistically significant (p for trend = 0.039).
Weighted multivariable linear regression analysis of the association between dietary fiber intake and total body BMD.

Model 1: No covariates were adjusted. Model 2: Adjusted for age, gender, and race. Model 3: Adjusted for age, gender, race, education level, PIR, BMI, physical activity, serum calcium, blood urea nitrogen, creatinine, energy intake, vitamin C intake, and calcium intake.
β, regression coefficient; CI, confidence interval; BMD, bone mineral density; PIR, poverty–income ratio; BMI, body mass index.
Smoothing curve fitting and subgroup analysis
The GAM smoothing spline confirmed a stable linear relationship between fiber intake and total BMD (Figure 2). With an edf of 1.0 and a nonsignificant test for nonlinearity (p = 0.158), a linear dose–response model was deemed appropriate. Stratified analyses (Figure 3) demonstrated that the positive association between dietary fiber and total BMD was largely consistent across most strata. However, significant interactions were identified for gender (p for interaction = 0.001), age (p for interaction = 0.006), race (p for interaction = 0.027), and BMI (p for interaction = 0.044). Specifically, the association reached statistical significance within the Non-Hispanic White subgroup and the medium-BMI tertile (p = 0.038). In contrast, no significant interactions were observed for PIR and physical activity (p for interaction > 0.05), suggesting that the skeletal benefits of fiber are stable across diverse socioeconomic and lifestyle backgrounds.
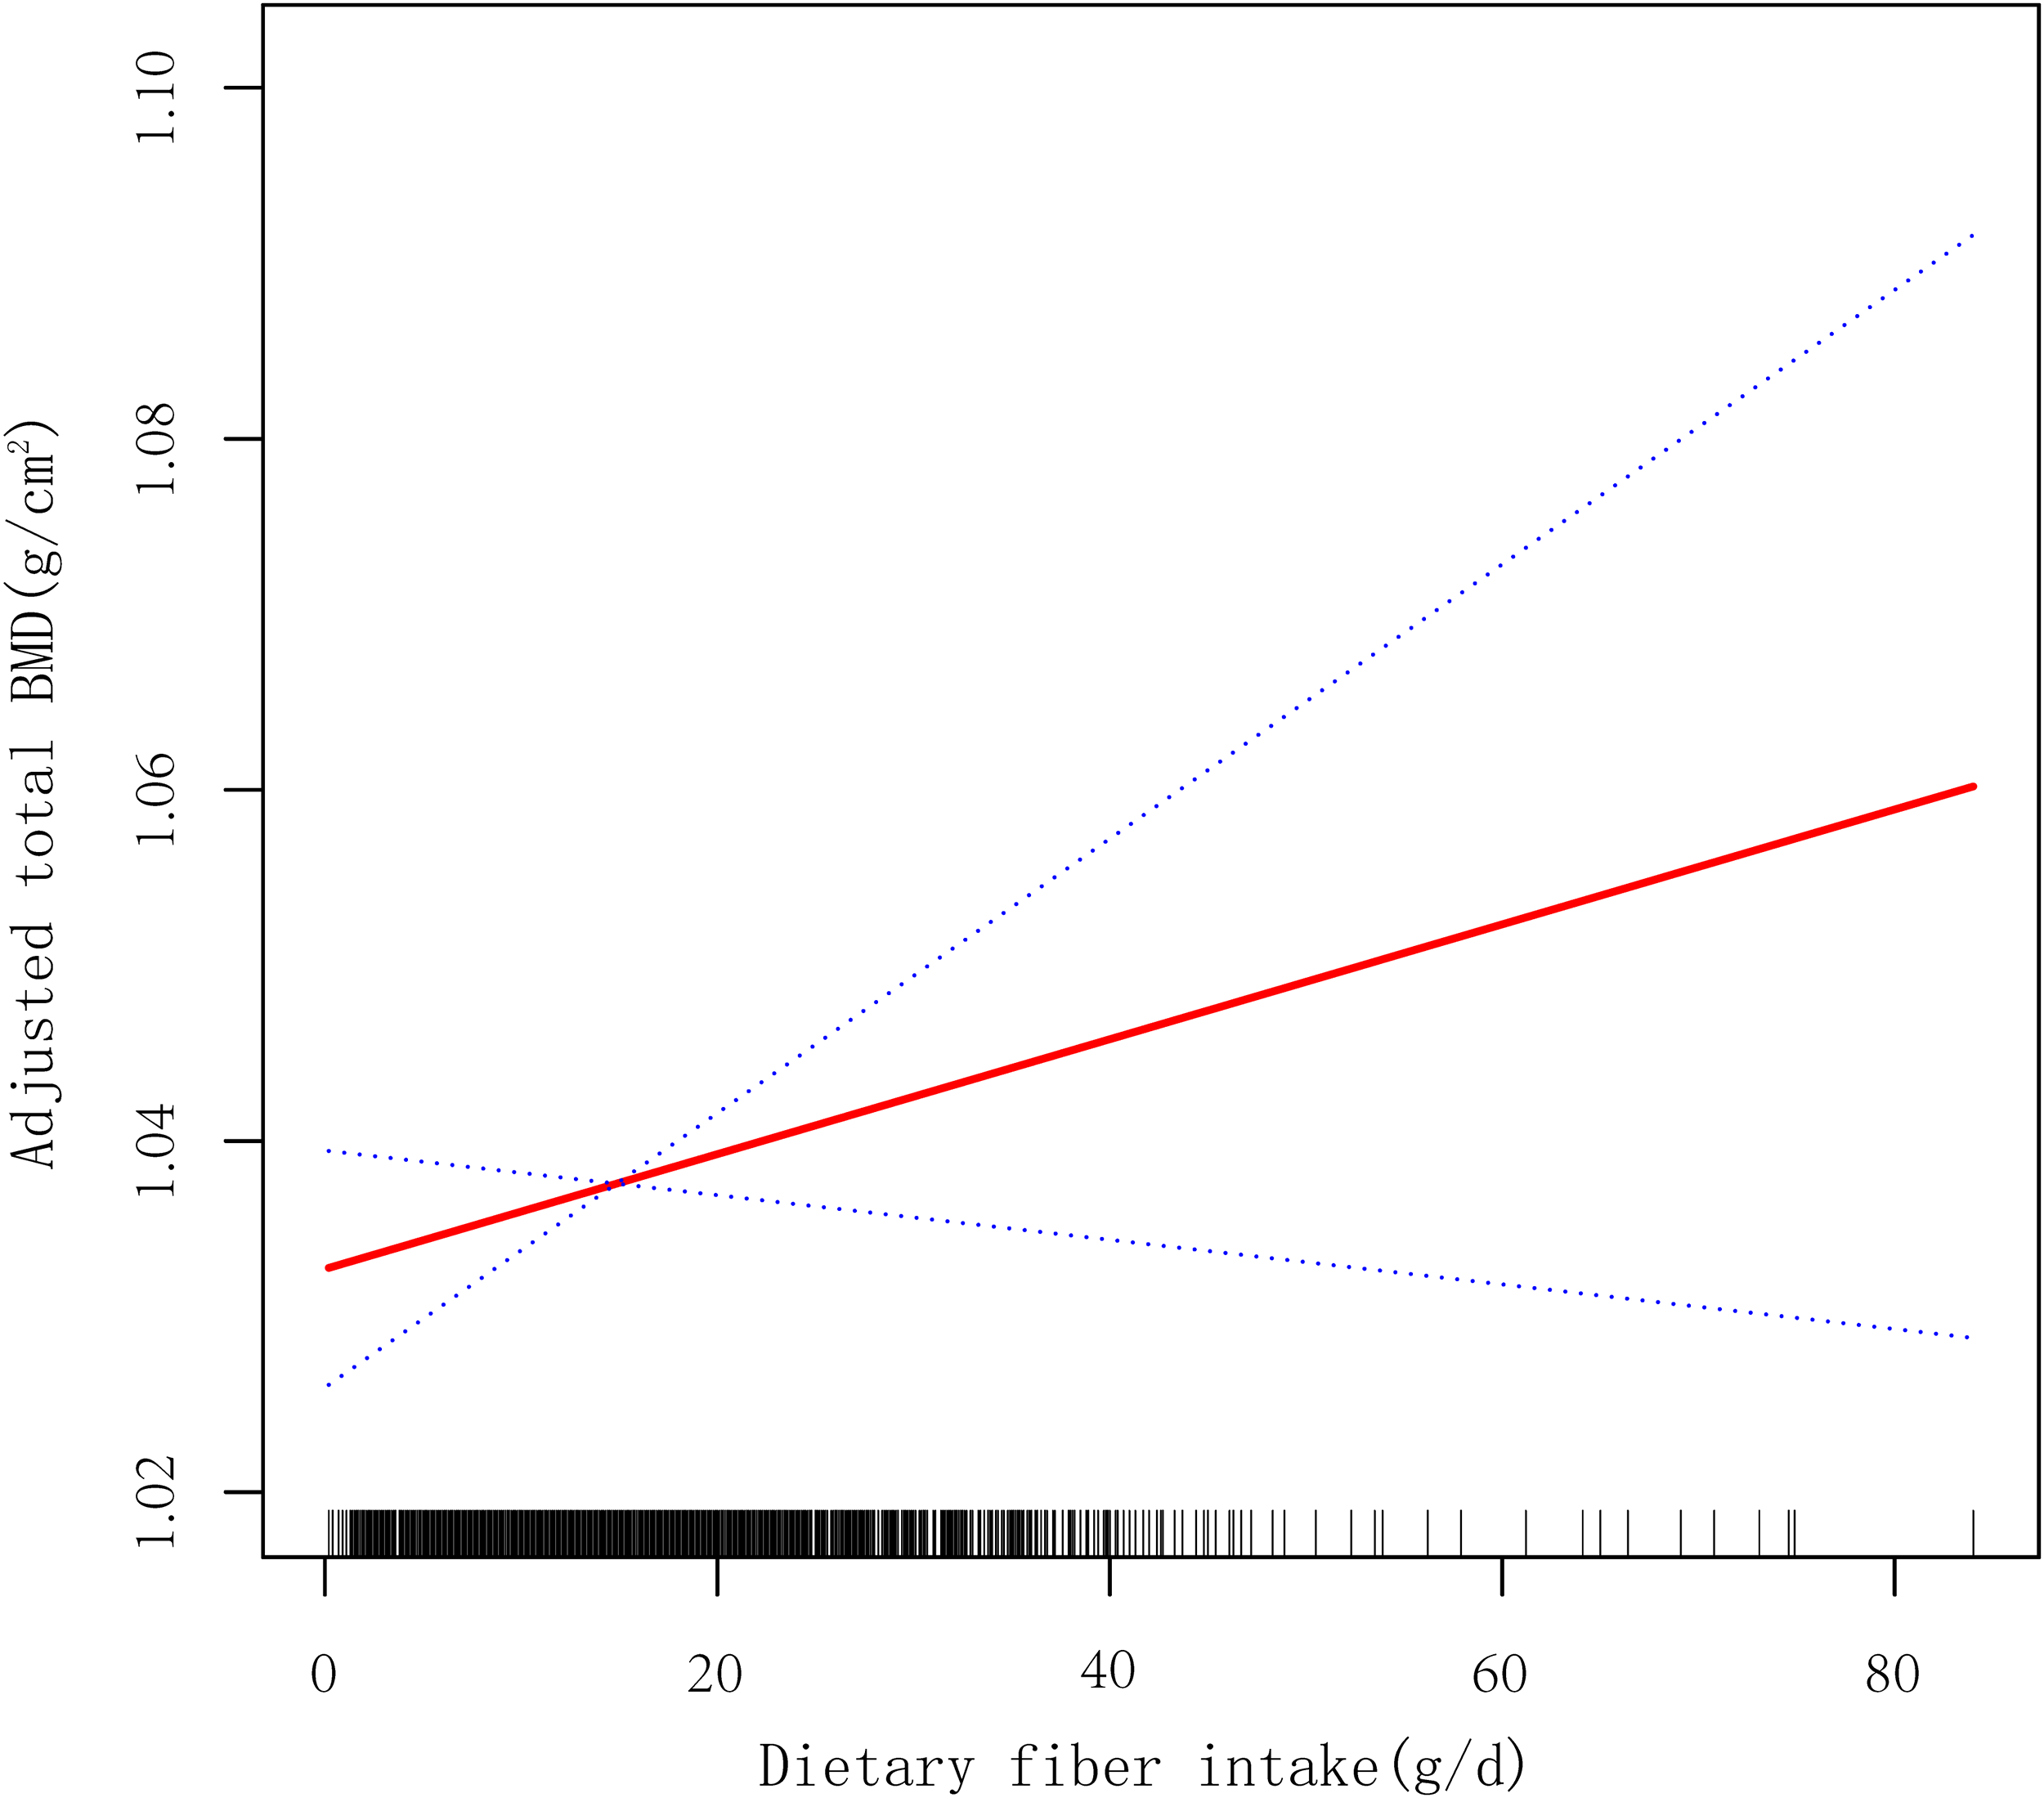
Generalized additive model (GAM) illustrating the dose–response relationship between dietary fiber intake and total body BMD. The solid red line represents the smoothed estimate, and the blue dashed lines indicate the 95% confidence intervals. The effective degrees of freedom (edf) was 1.0, and the test for nonlinearity was not statistically significant (p = 0.158), supporting a linear association.

Forest plot depicting the association between dietary fiber intake (per 1 g/day increase) and total body BMD. Subgroups included gender, age, race/ethnicity, education level, poverty–income ratio (PIR) (low, middle, and high), body mass index (BMI) (tertiles) and physical activity. β coefficients and 95% confidence intervals were derived from fully adjusted multivariable linear regression models (Model 3). Interaction tests (p for interaction) were performed to evaluate potential effect modification across demographic and clinical strata.
Discussion
To our knowledge, this study is the first to systematically evaluate the association between dietary fiber intake and total body BMD in a nationally representative sample of U.S. adolescents. Our findings indicate that higher dietary fiber intake is independently and significantly associated with greater total BMD. This association exhibited a stable linear dose–response relationship (edf = 1.0, p for nonlinearity = 0.158) and remained consistent across diverse demographic strata, suggesting that adequate dietary fiber consumption may be a pivotal determinant of optimal bone mass accrual during the “golden window” of adolescence.
Our results support the “gut–bone axis” hypothesis, suggesting that dietary fiber serves as a crucial metabolic modulator of bone health.21–24 The biological plausibility is robust: dietary fiber undergoes colonic fermentation by commensal microbiota to produce SCFAs, primarily butyrate and propionate.25,26 These metabolites are hypothesized to orchestrate bone homeostasis through several interconnected pathways. First, SCFAs facilitate physicochemical modulation of the intestinal environment; by acidifying the intestinal lumen, they significantly enhance the solubility and paracellular passive absorption of essential minerals, particularly calcium, which is vital for the rapid skeletal modeling characteristic of adolescence. Second, SCFAs play a pivotal role in immune-mediated bone preservation. 27 By promoting the expression of tight junction proteins, SCFAs fortify the intestinal mucosal barrier, thereby preventing the translocation of pro-inflammatory endotoxins into the systemic circulation.28,29 This mitigation of systemic inflammation reduces the serum levels of cytokines such as TNF-α and IL-6, which are known to upregulate the RANKL/OPG ratio, a master switch that triggers osteoclast-mediated bone resorption.30–32 Third, SCFAs exert direct metabolic and epigenetic regulation on bone turnover. Acting as ligands for G protein-coupled receptors (GPR41 and GPR43), SCFAs promote the differentiation of regulatory T (Treg) cells and the secretion of anti-inflammatory IL-10, which directly antagonizes osteoclastogenesis.33,34 Furthermore, butyrate acts as a histone deacetylase inhibitor, potentially downregulating the expression of genes essential for osteoclast maturation and activity.35,36 Collectively, these integrated mechanisms suggest that adequate fiber intake optimizes the systemic anabolic environment for bone mass accrual during this critical developmental window.
A salient finding in our subgroup analysis was the significant interaction between fiber intake and BMI (p for interaction = 0.044), with the positive association being uniquely pronounced in the medium-BMI tertile. This phenomenon may be explained by the “optimal metabolic window” hypothesis. In adolescents with medium BMI, physiological processes—including mineral metabolism and the systemic inflammatory milieu—are typically in homeostatic balance, allowing fiber-derived SCFAs to exert their maximum osteoprotective influence. Conversely, in the lowest-BMI group, the lack of significant association might stem from overall nutritional insufficiency or inadequate mechanical loading, where bone formation is primarily limited by energy or protein deficit rather than fiber intake. In the highest-BMI group, chronic low-grade inflammation and altered adipokine profiles (e.g. elevated leptin) associated with excessive adiposity may interfere with gut–bone signaling, potentially masking the beneficial effects of fiber.
Furthermore, the significant interactions observed for gender, age, and race (p for interaction < 0.05) suggest that the fiber–BMD nexus is sensitive to the distinct physiological and hormonal milieus of developing adolescents. Conversely, the lack of significant interaction for PIR and physical activity suggests that the observed skeletal benefits of dietary fiber may be broadly applicable across different socioeconomic and lifestyle backgrounds, reinforcing the potential of fiber-rich diets as a universal public health strategy for bone health.
In response to the necessity of rigorous confounding control, our study adjusted for blood urea nitrogen and creatinine. 37 Since the kidneys are central to phosphate homeostasis and vitamin D activation, adjusting for these markers ensures that the observed fiber-BMD association is independent of variations in the renal–skeletal axis. Moreover, the utilization of a refined four-level physical activity variable, alongside adjustments for total dietary calcium and energy intake, further substantiates the independent nature of our findings. 38
This study possesses several strengths, including the use of a large, nationally representative NHANES sample and the employment of DXA—the gold standard for BMD assessment. Additionally, the rigorous comparison between included and excluded participants confirms that the analytical sample remained representative of the broader population regarding primary exposure and outcome metrics.
Limitations of this study warrant consideration. First, the cross-sectional design precludes causal inference. Second, although mean values from two 24-h recalls were used, recall bias and day-to-day dietary variability remain inherent to self-reported data. Third, our physical activity assessment lacked the granularity to isolate high-impact weight-bearing loading, which is specifically osteogenic compared to general aerobic activities. Similarly, while age serves as a validated proxy for maturation in NHANES cohorts, it may not fully capture individual variations in pubertal timing (e.g. Tanner stages). Finally, the absence of direct gut microbiota or circulating SCFA measurements limits our ability to definitively confirm the underlying microbial pathways. Future longitudinal studies and clinical trials are required to validate these associations and elucidate the specific mediators involved.
Conclusion
In this nationally representative cross-sectional study, higher dietary fiber intake is independently associated with increased total body BMD among U.S. adolescents. This association is particularly pronounced in individuals with medium BMI and Non-Hispanic White participants. While the observational nature of this study precludes definitive causal inference, our findings suggest that adequate dietary fiber intake may be a key nutritional factor correlating with optimal skeletal health during the “golden window” of adolescence. Further longitudinal studies and randomized controlled trials are warranted to validate these associations and to elucidate the potential microbial and metabolic pathways through which dietary fiber supports bone mass accrual.
Supplemental Material
sj-docx-1-sci-10.1177_00368504261426436 - Supplemental material for Association between dietary fiber intake and total bone mineral density in adolescents: A cross-sectional analysis of the NHANES 2011–2018
Supplemental material, sj-docx-1-sci-10.1177_00368504261426436 for Association between dietary fiber intake and total bone mineral density in adolescents: A cross-sectional analysis of the NHANES 2011–2018 by Penghui Lv, Jincheng Bai, Lu Li, Chenglong Zhang, Shuaiwei Wei and Jianjun Chang in Science Progress
Supplemental Material
sj-pdf-2-sci-10.1177_00368504261426436 - Supplemental material for Association between dietary fiber intake and total bone mineral density in adolescents: A cross-sectional analysis of the NHANES 2011–2018
Supplemental material, sj-pdf-2-sci-10.1177_00368504261426436 for Association between dietary fiber intake and total bone mineral density in adolescents: A cross-sectional analysis of the NHANES 2011–2018 by Penghui Lv, Jincheng Bai, Lu Li, Chenglong Zhang, Shuaiwei Wei and Jianjun Chang in Science Progress
Footnotes
Acknowledgements
The authors thank the NHANES participants and staff for their contribution to the data. The authors also confirm that the final manuscript has been thoroughly reviewed and refined for linguistic clarity and technical accuracy by the research team to ensure professional academic standards.
Ethics approval and consent for participation
This study was conducted in accordance with the Declaration of Helsinki (as revised in 2024). The NHANES protocols were approved by the NCHS Research Ethics Review Board. All participants or their legal guardians provided written informed consent before participation. All patient data were de-identified by the NCHS prior to public release to ensure anonymity. According to the NCHS guidelines, secondary analysis of the de-identified NHANES data does not require additional institutional review board (IRB) approval.
Author contributions
Conceptualization: Penghui Lv and Chenglong Zhang. Methodology: Penghui Lv, Jincheng Bai, and Jianjun Chang. Software: Chenglong Zhang and Lu Li. Visualization: Jianjun Chang. Writing—original draft: Penghui Lv, Jincheng Bai, Chenglong Zhang, Shuaiwei Wei, and Lu Li. Writing—review & editing: Shuaiwei Wei and Jianjun Chang. Supervision: Jianjun Chang.
Funding
The author(s) disclosed receipt of the following financial support for the research, authorship, and/or publication of this article: This study was supported by the Natural Science Foundation of Shanxi Province, China (202403021221251).
Declaration of conflicting interests
The author(s) declared no potential conflicts of interest with respect to the research, authorship, and/or publication of this article.
Data availability
Supplemental material
Supplemental material for this article is available online.
References
Supplementary Material
Please find the following supplemental material available below.
For Open Access articles published under a Creative Commons License, all supplemental material carries the same license as the article it is associated with.
For non-Open Access articles published, all supplemental material carries a non-exclusive license, and permission requests for re-use of supplemental material or any part of supplemental material shall be sent directly to the copyright owner as specified in the copyright notice associated with the article.