
Abstract
Accurate positioning of water and fertilizer monitoring points in the soil of potted plants contributes to improving the level of precision agriculture management. This study proposes an automated extraction method for water and fertilizer detection points in blueberry potted plants in a greenhouse scenario. Based on the improved DeeplabV3+, a lightweight soil region segmentation network (LSRS-Net) is proposed. Firstly, the original DeeplabV3 + backbone was replaced by the lightweight MobileNetV2 to reduce computational complexity. Then, the Densely connected Atrous Spatial Pyramid Pooling (DenseASPP) module enhances multi-scale context feature fusion by embedding a Feature Pyramid Network (FPN) between the encoder and decoder to achieve cross-layer semantic fusion. In addition, the optimization algorithm based on Euclidean distance has improved the coordinates of the detection points. The experimental results show that, compared with the original model, the Mean Pixel Accuracy (MPA) and Mean Intersection over Union (MIoU) of the LSRS-Net model have increased by 2.98% and 3.84%, respectively, and the processing speed has reached 25.24 ms per frame. The extraction validity rate (EVR) exceeds 98.33%, which meets the requirements for fast and stable application in greenhouse cultivation and provides a viable solution for intelligent water and fertilizer management in agriculture.
Introduction
High-quality fruit cultivation in greenhouses using pots as containers has become a widely accepted practice. Precise monitoring of soil parameters (e.g. moisture content, nutrient levels, and pH) constitutes a fundamental requirement for optimizing crop growth conditions in greenhouse cultivation, directly determining irrigation-fertilization efficiency and yield quality. 1 However, conventional soil monitoring systems depend on fixed multisensor networks, which necessitate the deployment of numerous sensor nodes across different regions of the greenhouse and their connection to the main control unit via complex electric wire. This point-to-point wiring mode not only has a high hardware cost but also is prone to problems such as line entanglement and interface oxidation in high-density planting or complex terrain areas. Especially in a greenhouse environment with high temperature and humidity, sensors are prone to moisture damage or electromagnetic interference, leading to data distortion. Frequent maintenance further increases operating costs.2,3 Nowadays, an increasing number of agricultural robots are being developed and deployed in applications such as precise spraying, automatic weeding, and fruit and vegetable harvesting, thereby promoting the progress of intelligent agricultural management. However, at present, there are still few specialized studies on methods for locating water and fertilizer monitoring points of potted plants. 4
Accurately extracting the coordinates of detection points within potted plants is a key step for monitoring water and nutrient status in potted crops. In recent years, with the rapid development of deep learning, algorithms based on semantic segmentation have shown remarkable potential in object detection tasks within the agricultural domain. In agricultural scenes, fully convolutional neural networks (FCNs), 5 YOLO, 6 and Deeplab 7 series models have been widely used in tasks such as crop plant segmentation, fruit picking, disease and pest identification, and field road extraction. Among numerous object detection models, the YOLO model has been widely applied in precise fruit harvesting due to its excellent real-time processing speed and high recognition accuracy.8,9 Jia et al.10 expanded the receptive field of the green fruit feature map and input the rhombic structure of the regression box into the detection model to achieve rapid recognition of green fruits, effectively solving problems such as fruit overlap and low detection accuracy caused by easy occlusion during the harvesting process. However, the YOLO model primarily focuses on object detection, 11 and its inadequate segmentation accuracy results in significant limitations in applications involving instance segmentation.
To overcome the deficiency of object detection in fine segmentation, the DeeplabV3 + segmentation model has become a better alternative solution. 12 The DeeplabV3 + network comprises an encoder and a decoder: the encoder extracts features via the backbone network and fuses multiscale contextual information using Atrous Spatial Pyramid Pooling (ASPP), while the decoder upsamples the features output by the encoder, integrates shallow features to recover spatial details, and ultimately achieves precise boundary segmentation.13,14 However, the DeeplabV3 + model has large parameters, which makes it require relatively high computing resources during runtime. Even when deployed on mobile operation robot systems with limited computing power, it struggles to meet the requirements of practical production applications. Furthermore, when handling segmentation tasks with complex backgrounds, the DeeplabV3 + model tends to suffer from the loss of local features due to illumination variations and interfering objects with similar colors, leading to degraded accuracy at the edges of segmented targets. This limitation is particularly evident in potted blueberry scenarios. At different growth stages, the branch density, leaf biomass, and spatial distribution of plants exhibit significant temporal variations, leading to notable differences in the proportion of soil surface obscured by vegetation. Meanwhile, variations in imaging height alter the field of view, directly affecting the visible area and shape of the exposed soil regions in images. Therefore, these spatiotemporal factors must be fully considered to ensure segmentation accuracy. However, existing algorithms pay limited attention to such conditions and struggle to address them effectively, highlighting the urgent need for high-precision segmentation methods tailored to potted environments.
In addition, most existing work has focused on the segmentation of crops and planting scenarios, with relatively few studies addressing instance segmentation of potted soil regions. Concurrently, robotic manipulators require precise positioning within segmented soil areas, which requires extracting the optimal target point from irregular geometric shapes. At present, in the fruit pose detection task of picking robots, the stereo matching method based on centroid features to determine the grasping center is the mainstream solution. 15 Taking images of target fruits such as apples and citrus fruits as input, the target area after image segmentation generally presents a regular geometric shape of a circle or an ellipse. Therefore, the centroid coordinates of the area can be directly mapped to the picking points.16,17 However, under dynamic inspection conditions, soil regions often exhibit irregular geometries due to multiple interfering factors such as trunk occlusion, main stem, and foliar debris. In such cases, conventional centroid-based localization methods frequently misplace sensors into main stem, resulting in damage to plant tissues. Achieving instance-aware segmentation of potted soil regions and accurately extracting detection points thus remains a critical technical challenge for high-precision agricultural robotics.
To achieve low-cost and automated monitoring of water and fertilizer in potted plants, this study takes greenhouse blueberry cultivation as an example and proposes a method for locating monitoring points of soil water and fertilizer in potted plants. The main contributions of this work are as follows:
A LSRS-Net based on the DeeplabV3 + network is proposed to meet the requirements of rapid and high-precision positioning of potted plant monitoring points for inspection robots. Specifically, the original backbone is replaced with the lightweight MobileNetV2, a DenseASPP module is introduced to enhance multi-scale contextual feature fusion, and a FPN is embedded to achieve cross-layer semantic integration and reduce interference. These improvements significantly enhance the accuracy and robustness of soil monitoring region localization in potted plants. A safe monitoring point identification algorithm was developed. By combining the maximum inscribed circle method with numerical optimization analysis, the optimal detection point is successfully determined, thereby preventing potential plant damage caused by the insertion of pin-type sensors. The characteristics of soil detection regions in potted blueberries with different plant ages and camera heights were analyzed. Experimental optimization of the detection algorithm improved the success rate of nondestructive detection, providing valuable references for similar soil localization tasks in comparable scenarios.
Materials and methods
The positioning process of blueberry potted plant detection points
In the greenhouse cultivation environment, the traditional water and fertilizer monitoring system adopts a point-to-point monitoring mode for each potted plant. The cumbersome wiring and connection lead to high hardware costs, and the low intelligence level of facility environment management makes it difficult to meet the development needs of agricultural modernization, which restricts the high-level advancement of facility agriculture.
To better address this issue, this study proposes a method for extracting the coordinates of detection points, which integrates deep learning and numerical optimization analysis based on Euclidean. The overall workflow of this algorithm is shown in Figure 1, which includes constructing a potted soil dataset, improving the design of the DeeplabV3 + segmentation network, and applying numerical optimization functions to solve the coordinates of the detection points. By combining data acquisition enhancement, a segmentation model based on the LSRS model, and a closed-loop design for extracting coordinate position information, this method addresses challenges such as the interference of segmentation accuracy caused by leaves blocking soil areas in complex backgrounds, thereby providing precise position information for the inspection robot detection tasks.
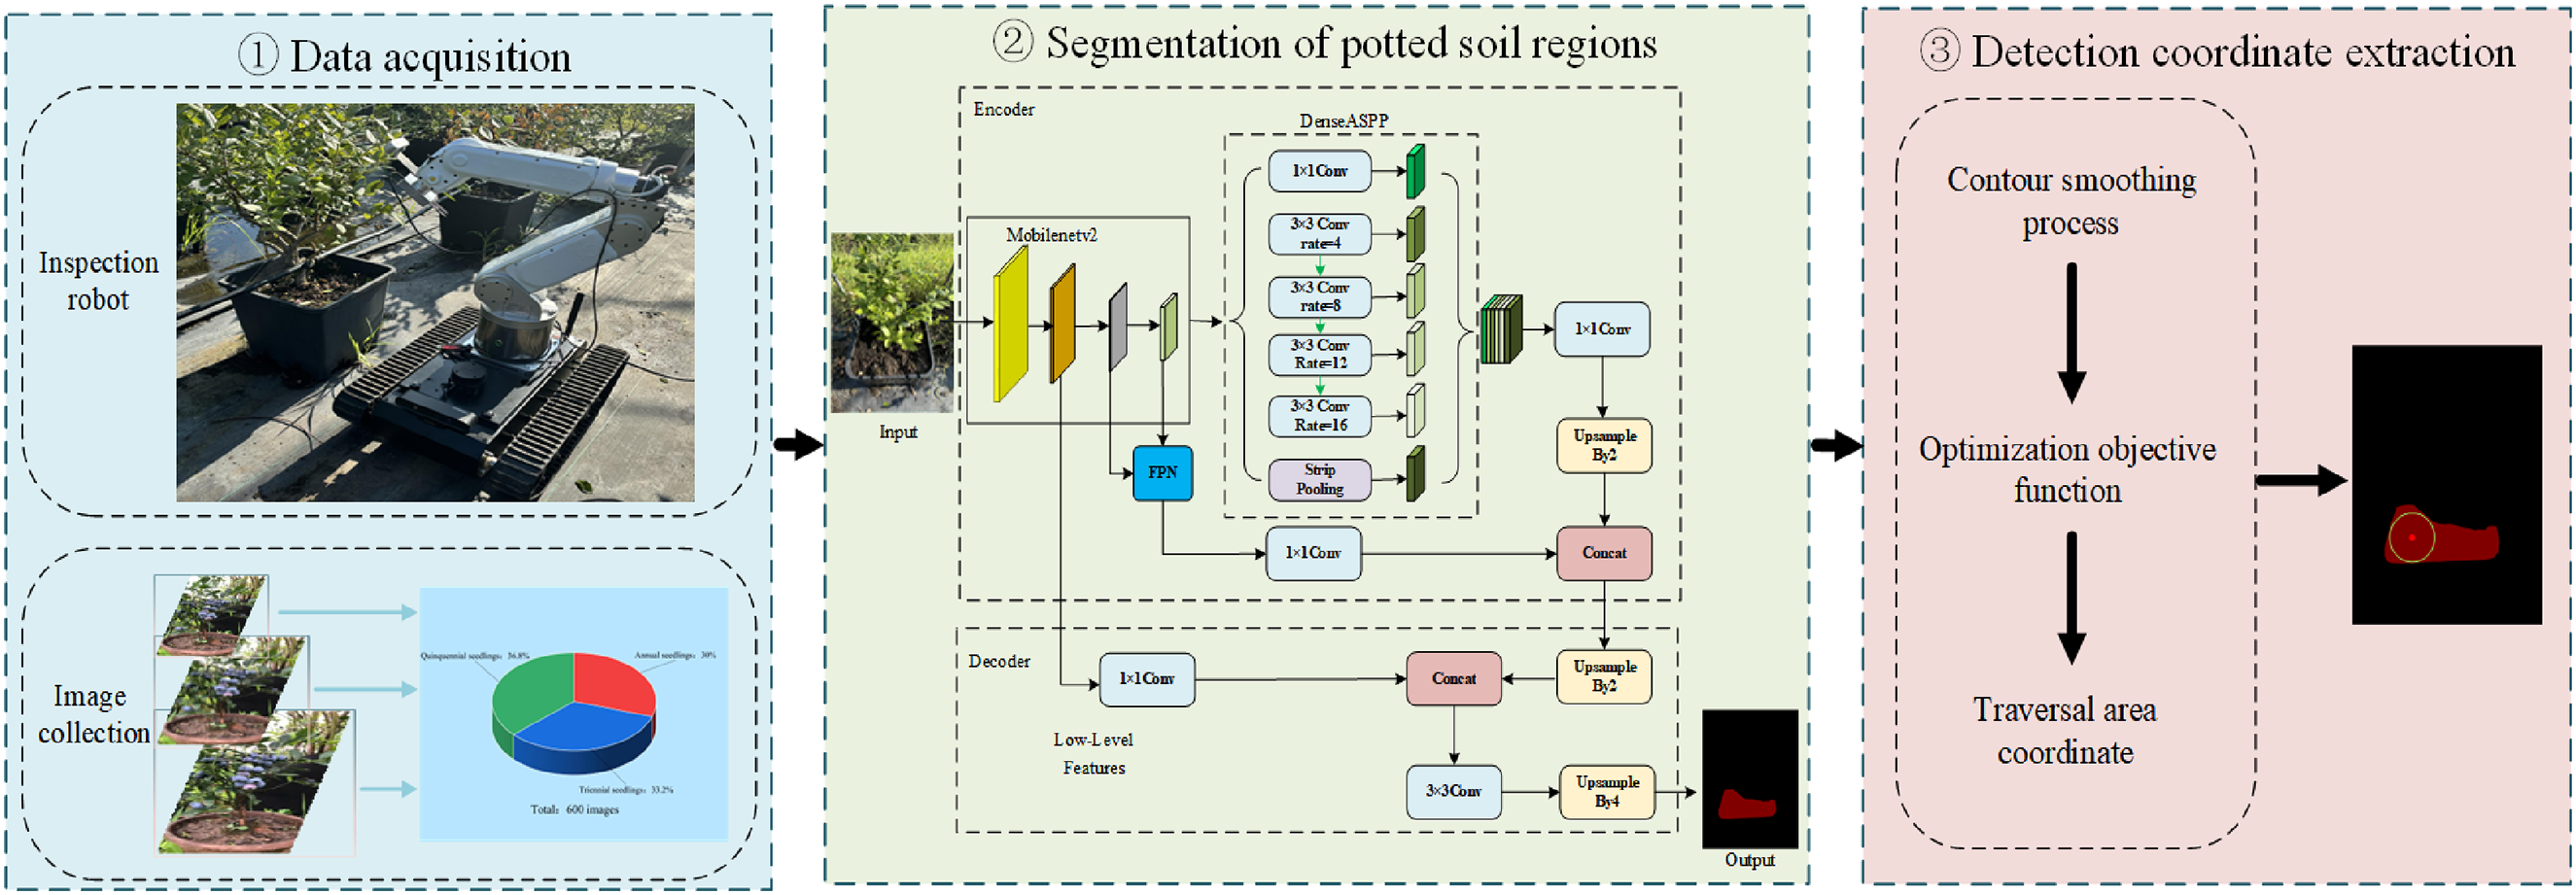
Localization process for blueberry potted plant detection points.
As shallow-rooted plants, blueberries have root systems predominantly distributed within the top 5 to 20 cm of the soil profile. This growth characteristic imposes strict requirements on the soil environment. 18 Specifically, the soil pH is typically maintained between 4.6 and 5.8. Furthermore, to prevent root hypoxia, the soil must possess excellent drainage properties. As shown in Figure 2, soil samples were collected from five potted blueberry plants in the greenhouse, followed by the measurement of relevant soil parameters using specialized equipment.
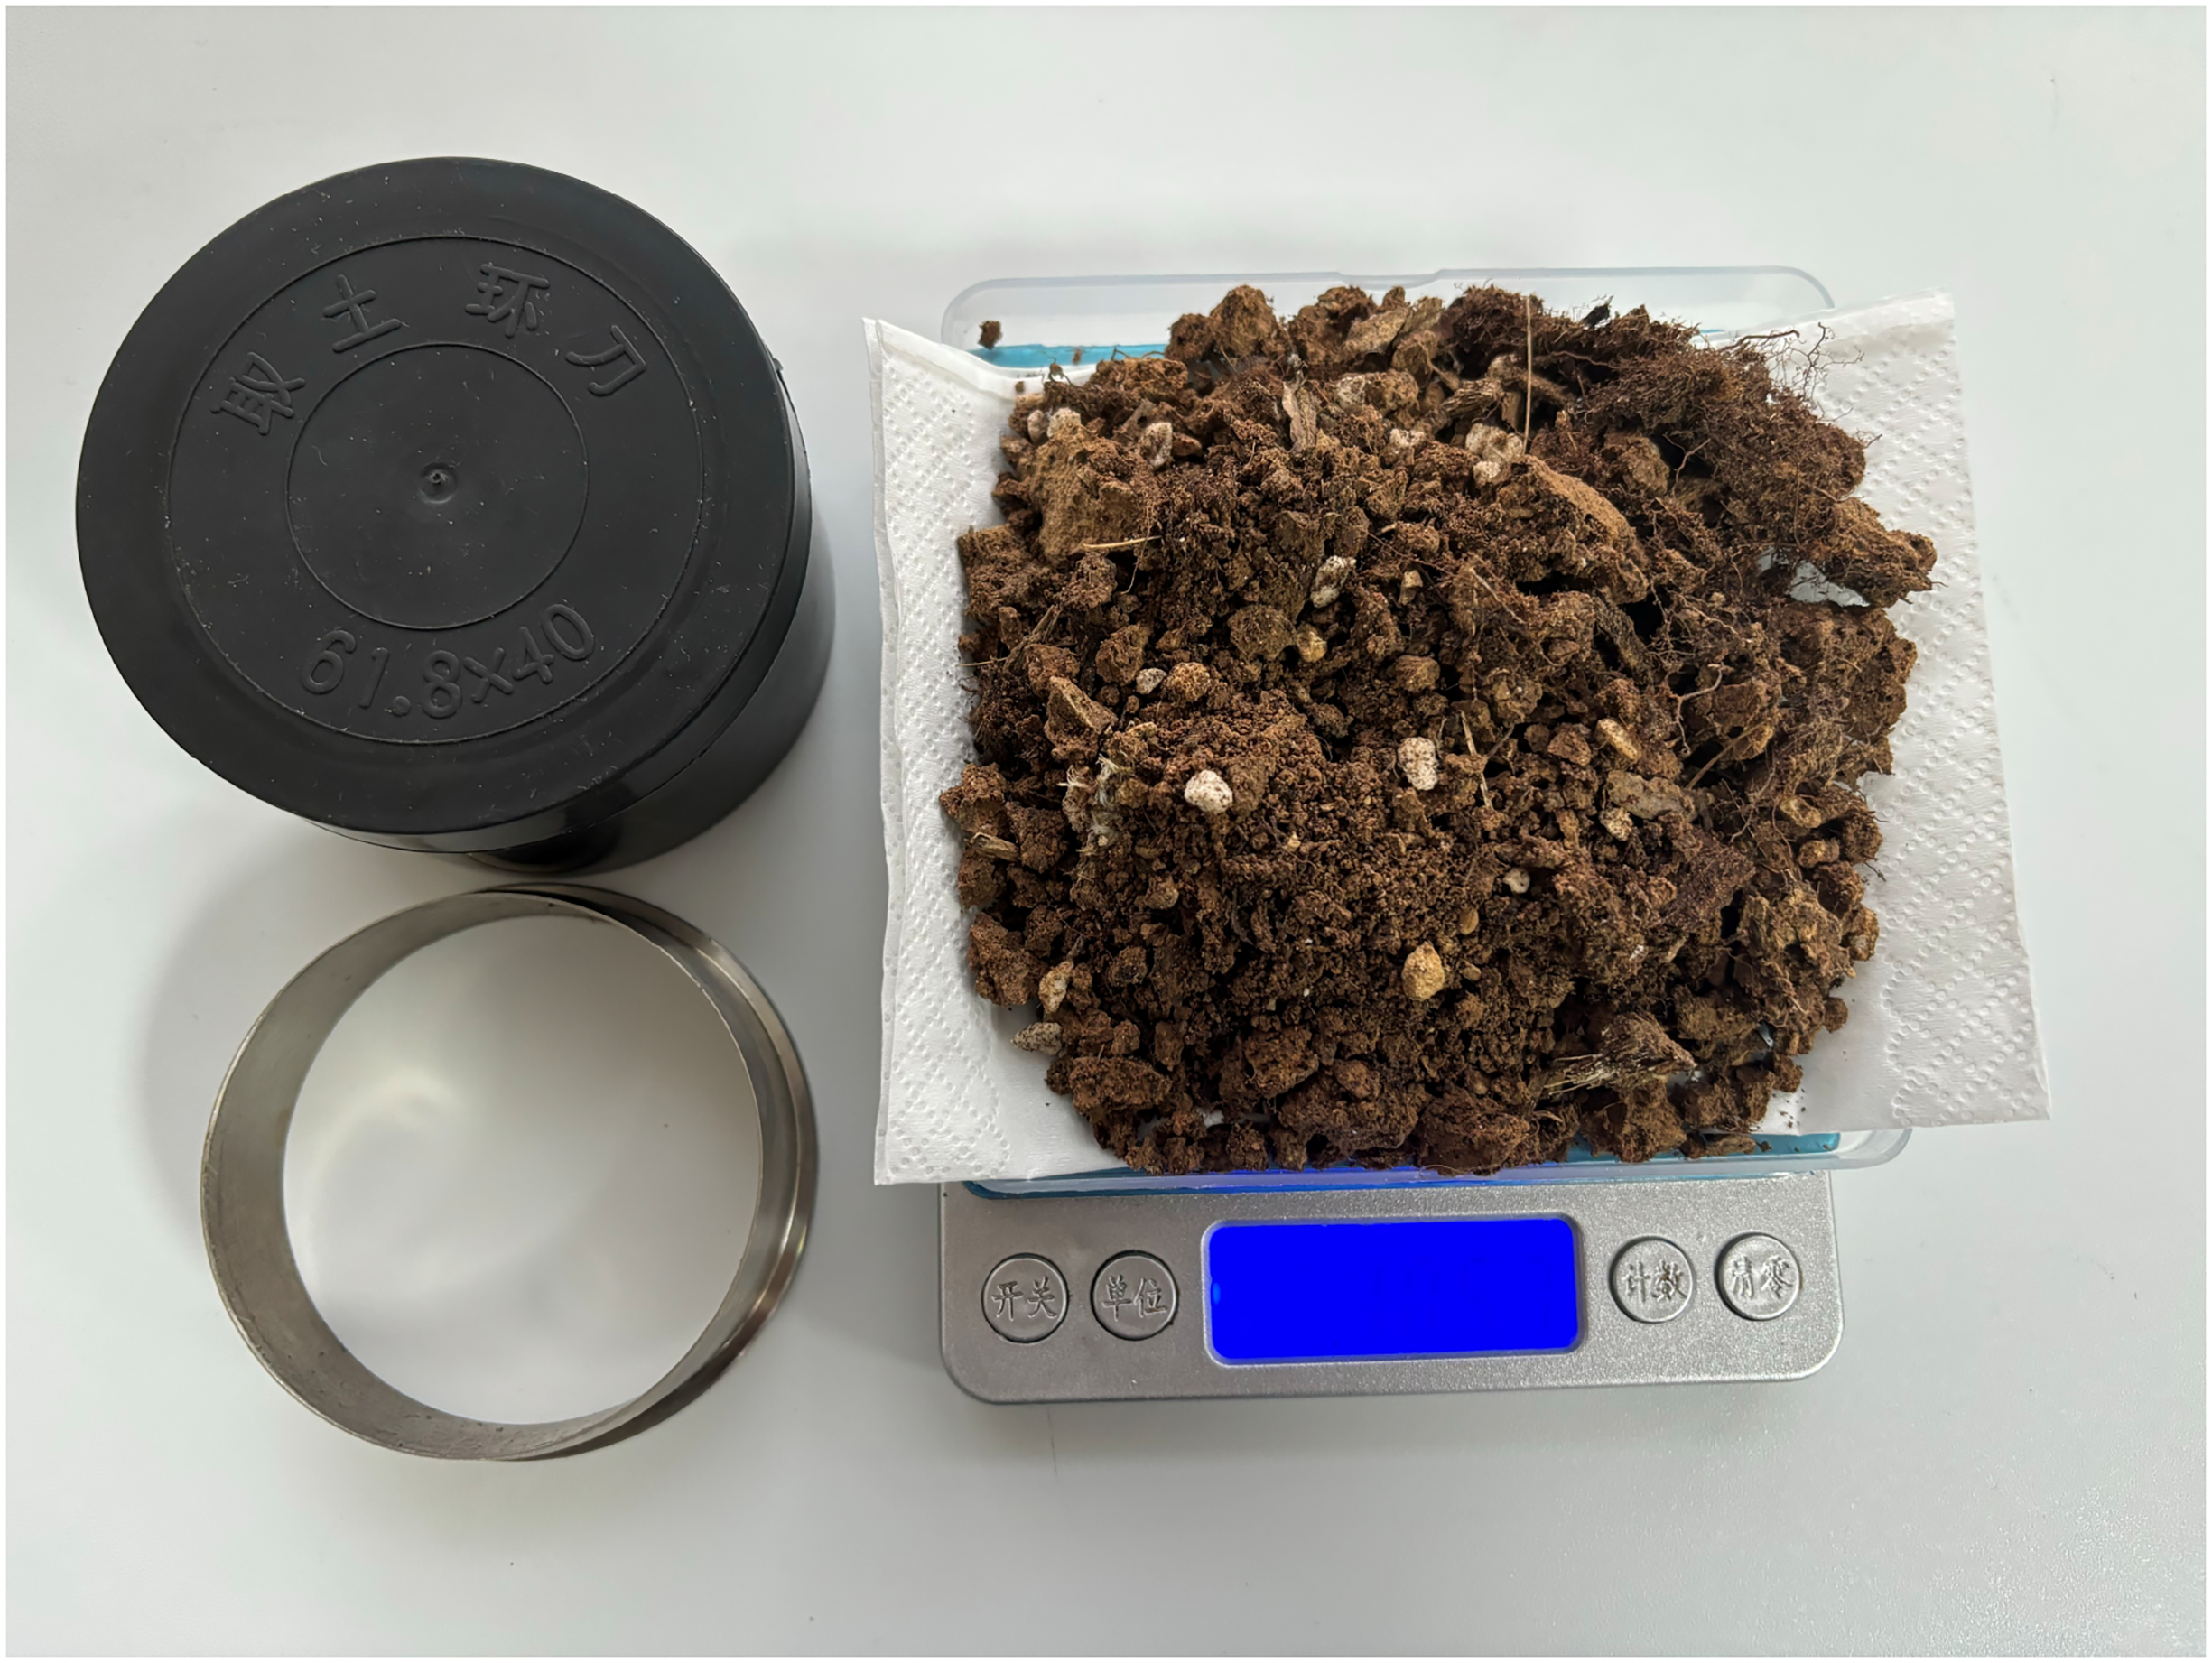
Potted blueberry soil samples.
In this study, the cultivation substrate was prepared by mixing bio-fertilizer with garden soil in specific proportions to ensure optimal fertility. The key physical parameters of the soil used for the potted blueberries are presented in Table 1.
Physical property parameters of blueberry potted soil.

Dataset construction
To enhance dataset diversity, an Intel RealSense Depth Camera D435 was used to collect images of multiple species, including blueberries, bamboo, and azaleas, covering several representative growth stages for each. To simulate the operational range of inspection robots, the vertical shooting height was maintained between 10 and 20 cm, resulting in the acquisition of 1126 images. The original pixel resolution of these images is 1280 × 800 pixels. Additionally, 312 supplementary images were retrieved from Wikipedia. Consequently, the constructed dataset comprises a total of 1438 images. Representative samples from the dataset are illustrated in Figure 3.

Partial blueberry potted plant dataset.
After completing data collection, the original images were annotated using the LabelMe tool. Subsequently, the original dataset was divided into a training set of 1295 images and a test set of 143 images at a 9:1 ratio. 19 To enhance model generalization capability, a stratified k-fold cross-validation approach (k = 5) was employed, 20 where the initially partitioned 1295 images were equally split into 5 subsets. For each experiment, four of the five subsets were selected for data enhancement, with techniques including brightness adjustment, noise injection, flipping, cropping, and occlusion. 21 The augmented dataset served as the training set for that experiment, while the remaining subset functioned as the validation set. This process was repeated 5 times in sequence to achieve five rounds of data augmentation, with the effects of dataset augmentation illustrated in Figure 4. After data augmentation, the training set capacity increased to 6216 images, yielding a total sample size of 6618 images. The composition of each dataset partition is presented in Table 2.

Effects of image data augmentation.
The division and processing of the dataset.

Lightweight soil region segmentation network
In an indoor cultivation environment, the pot edge and the soil show a significant similarity in color, thus presenting a challenge in segmentation. Additionally, during nighttime operations of the inspection robot, the low-illumination environment tends to induce feature distortion in soil regions. This gives rise to two key issues: difficulty in differentiating between pot and target soil regions, and inadequate segmentation accuracy due to insufficient illumination, 22 which constrains the localization accuracy of detection points.
To address these challenges, we propose LSRS-Net with three innovative features based on the DeeplabV3 + network, as illustrated in Figure 5. First, the backbone network of the original model was replaced with MobileNetV2, with the aim of reducing the model parameter count to enable network lightweighting. 23 Second, the DenseASPP supplants the conventional ASPP module, where densely cascaded atrous convolutions enable hierarchical feature reuse. 24 Third, the FPN has been added to the encoder-decoder interface to mitigate structural degradation during cross-stage feature propagation.25,26

Architecture of the LSRS network.
Optimization of the backbone network
The background environment of facility cultivation is complex, but the shape of the pot is relatively fixed. While the Xception backbone network, employed by default in the DeeplabV3 + model, achieves high-precision feature extraction via stacked depthwise separable convolutions, its complex multi-branch architecture and dense channel expansion mechanism markedly increase parameter counts and computational complexity, making it difficult to meet the rigid requirements of inspection robots for real-time performance and low power consumption. 27 To solve this problem, we adopt the MobileNetV2 lightweight architecture as the backbone network, as shown in Figure 5. Its inverted residual blocks employ an expansion-compression topological design, performing lightweight depthwise separable convolution operations in low-dimensional space. Linear bottleneck layers are then utilized to circumvent nonlinear information loss during dimensionality reduction, 28 thereby retaining the discriminative capability of deep semantic features while compressing the model size. In comparison to Xception, MobileNetV2 reduces redundancy in intermediate feature dimensions. While preserving sensitivity to textural features during potted soil region segmentation, it substantially enhances inference speed and markedly optimizes the energy efficiency ratio in edge computing scenarios.
Multi-scale feature fusion mechanism
In complex visual tasks, single-scale feature representations often struggle to balance detail discrimination and semantic capabilities due to the lack of cross-level context associations. 29 Therefore, the LSRS-Net incorporates a hierarchical feature enhancement framework, as illustrated in Figure 6. To address the issue of partial feature information loss that may be caused by directly inrolling down-sampled features into the decoder in the original DeeplabV3 + model, this study introduces a bidirectional feature pyramid structure in the 1/8f and 1/16f down-sampling levels of the backbone network MobileNetV2. This structure first performs a 2× up-sampling operation on the 1/16f feature layer of MobileNetV2 to obtain a new 1/8f feature layer. Then, the 1/8f feature layers of the original backbone network MobileNetV2 are added and fused to achieve feature complementarity. 30 To further preserve the details of the low-level space, the feature map of the 1/4f down-sampling stage is retained and used as the auxiliary input of the decoder. In addition, by conducting cross-scale interaction between the feature layer obtained from DenseASPP and the 1/8f features that have undergone primary FPN fusion, a hierarchical feature fusion expression is constructed. 31

Feature pyramid network architecture.
DenseASPP network architecture
The ASPP module within the DeeplabV3 + model achieves multi-receptive field feature fusion via parallel multiscale atrous convolutions. However, in complex scenarios, its discrete dilation rate design and isolated branch architecture tend to induce insufficient feature scale coverage, restricted receptive fields, and exacerbated convolution sampling sparsity under large dilation rates. 32 This leads to semantic information loss and diminished context modeling capability. To address this issue, this study has optimized and reconstructed the ASPP module based on the DenseASPP network architecture. As illustrated in Figure 7, a continuous and dense cross-scale feature pyramid is constructed by cascading densely connected multiscale atrous convolution layers. Within DenseASPP, each layer not only inherits feature maps from all preceding layers but also achieves exponential expansion of the receptive field via progressive dilation rate superposition. Simultaneously, it enhances the interaction and complementarity of multiscale features through a dense connection mechanism. 33 In comparison to conventional ASPP, DenseASPP can generate multiscale features with broader coverage and higher sampling density. This effectively enhances the model's robustness to extreme scale variations and complex background interference.
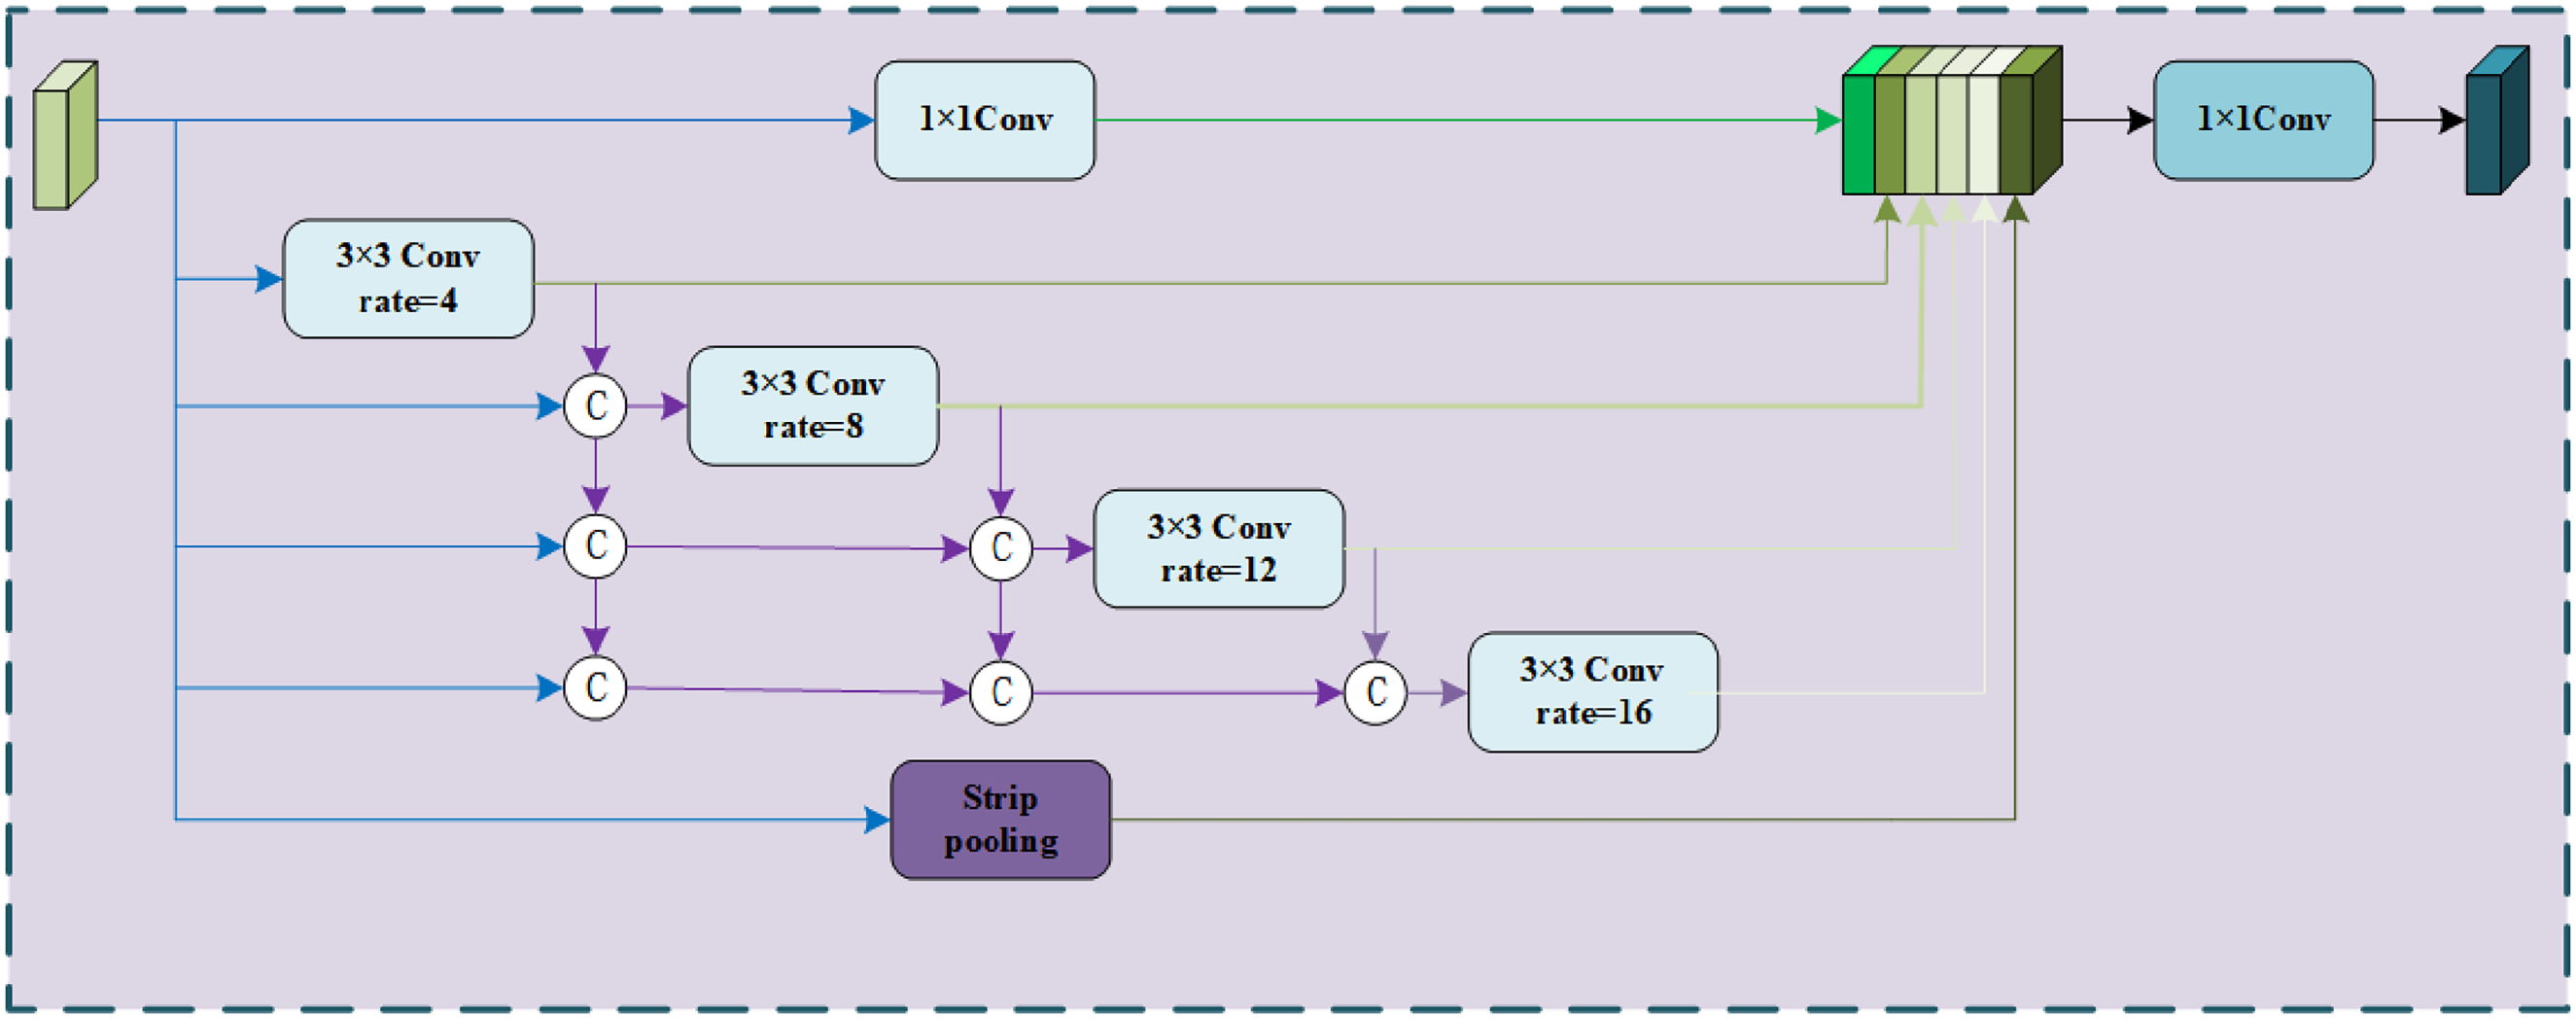
Densely connected atrous spatial pyramid pooling architecture.
Algorithm for extracting detection point coordinates
The mask segmented by LSRS-Net must undergo additional processing to determine the accurate sensor insertion point. Notably, the mask contours of potted soil regions frequently present irregular morphologies arising from plant trunk distribution, branch-induced occlusion, and diverse camera viewpoints. During the insertion procedure, the pin-type sensor must avoid the plant's main stem to minimize the risk of damage. Because blueberry plants are predominantly situated in the central soil area of the pot, detection points derived from the traditional centroid method are consequently prone to deviation toward the stem. 34 If points extracted via the centroid method are employed as detection points, their proximity to the stem narrows the workspace when the robot uses its robotic arm to detect soil water and fertilizer information. This increases operational difficulty and collision risks during the inspection process.
Therefore, for irregular soil regions, to obtain the detection point farthest from the boundary within the mask, this study has proposed a numerical optimization algorithm based on Euclidean distance. This algorithm employs the edge point set of the mask contour as a constraint, defines the shortest Euclidean distance from the candidate point to the mask boundary as the optimization objective, and solves for the center position of the largest inscribed circle by maximizing this distance. This ensures that the detection position is as far as possible from the plant and the edge of the pot. The algorithm workflow is illustrated in Figure 8, with its implementation steps as follows:
The soil region in potted plant images is segmented using the LSRS network, yielding mask images with a black background and a red soil region. The contours of these mask images are then smoothed. An optimization objective function is designed, where the shortest Euclidean distance from the candidate point to the mask boundary is defined as the optimization objective. This distance is maximized, and the center of the inscribed circle with this distance as its radius is taken as the candidate detection point. The purpose of this step is to ensure that the detection point is distant from the pot edge and the main stems of plant branches, thereby reducing the collision probability between the pot edge, plant branch main stems, and the robotic arm during detection. Its definition formula is as shown in equation (1).


Flowchart of the detection coordinate extraction algorithm.
Where, 
Where, All coordinate points within the candidate region are traversed. Once all pixels’
Results
Performance analysis of the LSRS network
Evaluation metrics for the algorithm
A comprehensive evaluation of semantic segmentation models necessitates the establishment of a quantitative metric system encompassing two dimensions: segmentation accuracy and computational efficiency. In terms of segmentation accuracy, the primary evaluation metrics include the MIoU and MPA. Computational efficiency is closely related to the size of the trained model and the number of parameters, which characterizes the spatial complexity of the model architecture. This metric system enables a systematic assessment of the model's practical value and limitations through the synergistic measurement of accuracy and efficiency. The main calculation formulas are presented in equations (3) and (4).
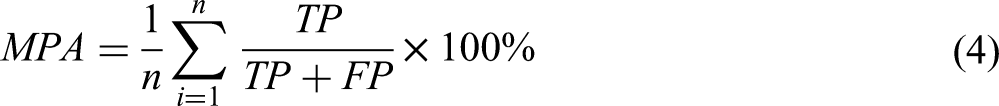
Where TP represents the number of instances in which the model correctly classifies image pixels as positive classes, FN denotes the number of instances in which the model incorrectly classifies image pixels as positive classes, FP denotes the number of instances in which the model correctly classifies image pixels as background, and TN denotes the number of instances in which the model incorrectly classifies image pixels as background. Additionally, n denotes the total number of classes, including the background.
Ablation experiment
To validate the performance of the LSRS network, ablation experiments were conducted on the dataset in this study. Following 100 training epochs, various performance evaluation metrics of the models are documented in Table 3. Herein, Model A employs the original DeeplabV3 + architecture with Xception as the backbone network; test set results indicate that its MPA and MIoU metrics are 91.83% and 86.81% respectively. Model B replaces the backbone network with MobileNetV2, and while maintaining MIoU and MPA close to those of the original DeeplabV3+, its parameter count is reduced from 26.47 to 17.56 M, representing a 33.66% decrease and significantly lowering the computational load. Model C incorporates the FPN multiscale feature enhancement strategy based on Model B. Although the MPA slightly decreases, the MIoU increases to 89.48%. Based on Model B, Model D reconstructed the DenseASPP network architecture from the original ASPP module. Enhanced interaction and complementarity of multi-scale features via the dense connection mechanism elevate MPA to 93.31%. Ultimately, the LSRS network has combined MobileNetV2, FPN multi-scale feature enhancement strategy, and DenseASPP network architecture. Both MPA and MIoU metrics reach new peaks at 94.81% and 90.65%. Relative to the DeeplabV3+, these metrics increased by 2.98% and 3.84%. The final parameter count is reduced by 7.52 M relative to the original DeeplabV3+, with a decrease of 28.41%. The experimental results demonstrate that the LSRS Net proposed in this paper meets the core requirements of real-time processing of detection robot devices and low-power detection of potted water and fertilizer, while maintaining high-precision segmentation performance.
Comparison of segmentation performance between different improved models.

Comparative experiments on segmentation models
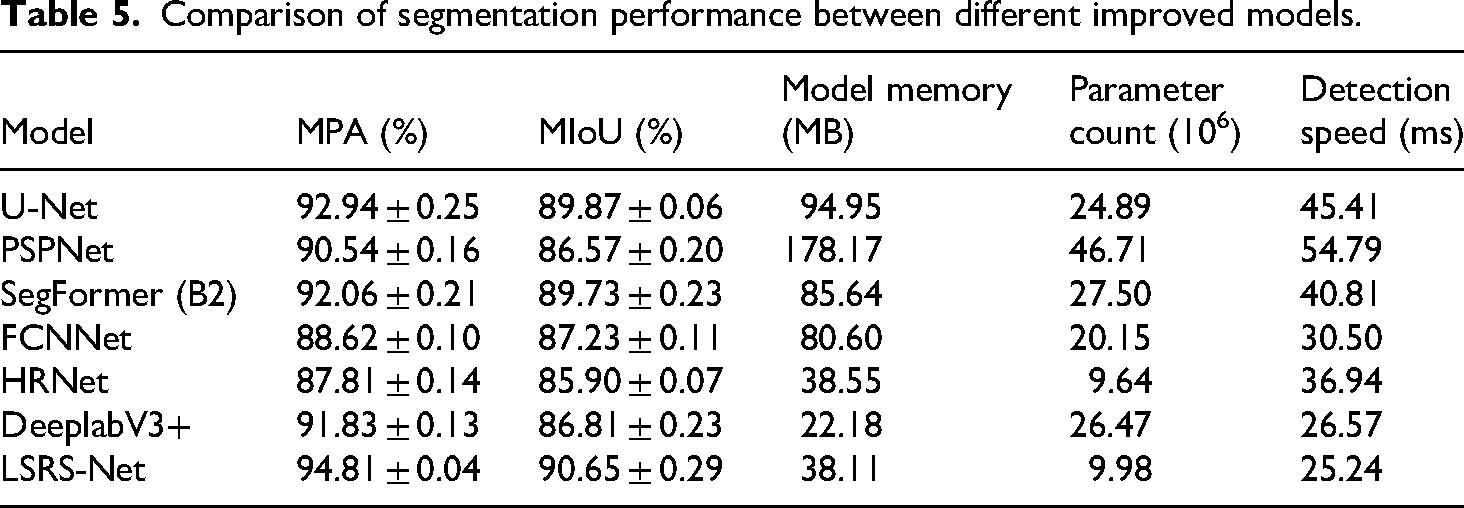
To validate the advantages of the LSRS-Net in detecting soil information for agricultural water and fertilizer inspection robots, six semantic segmentation models, U-Net, PSPNet, SegFormer(B2), FCNNet, HRNet, and the original DeeplabV3+, were selected for a lateral performance comparison with the LSRS-Net. The segmentation results of the comparative experiments are illustrated in Figure 9.

Performance comparison of different segmentation network.
Unlike the above-mentioned classic segmentation models, the LSRS-Net exhibited overall superior performance in segmentation experiments. Its additional multiscale feature fusion mechanism reconstructs the geometric structure of boundaries by fusing high-semantic deep features with high-resolution shallow features layer by layer, overcoming the inability of its feature extraction mechanism to distinguish between soil textures and shadow interference. Meanwhile, the DenseASPP architecture maintains high accuracy when handling images with complex backgrounds, even those containing objects whose color is similar to soil. Through dense connections, it enables channel interaction between feature maps with different expansion rates, effectively enhancing segmentation precision and accuracy.
The loss curves of the LSRS-Net and mainstream segmentation networks during training are illustrated in Figure 10. It can be observed that the loss values of the seven models in the experiment dropped rapidly below 0.4 within the first 20 epochs. As the number of iterations increased, the loss value eventually oscillated continuously within the range [0.15, 0.38], indicating that the models converged to a local optimum. The LSRS-Net exhibited a steep drop in loss value to 0.16 within the first 10 epochs, followed by a smooth downward trend in subsequent training, ultimately stabilizing at approximately 0.15.

Loss curves of each model during the experiment.
Experimental analysis of coordinate extraction algorithm
Evaluation metrics for the algorithm
Operational safety is the paramount consideration for robots working in confined spaces. 35 To enhance the safety of manipulator operations, it is common practice in the industry to define appropriate safety thresholds to mitigate collision risks. For instance, in warehouse automation, establishing safety buffer zones between robotic arms and human operators has significantly improved system reliability. 36 To evaluate the safety performance of the coordinate extraction algorithm in the inspection robot's operational scenario, this study proposes an evaluation metric centered on a Safety Index (SI). By analyzing the geometric relationship between the detection point and the collision boundary, the SI comprehensively quantifies the algorithm's reliability and safety margin, directly indicating the potential operational safety buffer for the robot.
The pin-type sensor comprises four stainless steel probes, arranged with a length of 56 mm and a width of 35 mm. To prevent the edge probes from interfering with pots during soil sampling, the definition of the Safety Index needs to be introduced, as illustrated in Figure 11. The safety threshold is dependent on the sensor type. It quantifies the safety level of the detection point by comparing the shortest distance r from the point to the mask boundary (i.e. the radius of the inscribed circle) with h. When r ≥ h, the detected point is within the safe area, and the sensor at the end of the robotic arm can perform the insertion operation. When r < h, the detected point falls into the collision risk area, and the robotic arm does not perform the insertion operation. With a single value, SI intuitively reflects the adaptability of the algorithm in complex scenarios, and its definition formula is as shown in equation (5).

Diagram of detection point coordinate extraction algorithm.
Where r denotes the maximum inscribed circle radius extracted by the proposed algorithm; h represents the preset safety threshold, which is related to the end sensor of the robot arm.
Furthermore, in experiments on the coordinate extraction algorithm, the EVR is introduced as a metric for evaluating the algorithm's performance, with its defining formula given in equation (6).
Where q denotes the number of images for which detection coordinates are successfully extracted by the algorithm; Q denotes the total number of images utilized in the experiment.
Experimental results of coordinate extraction
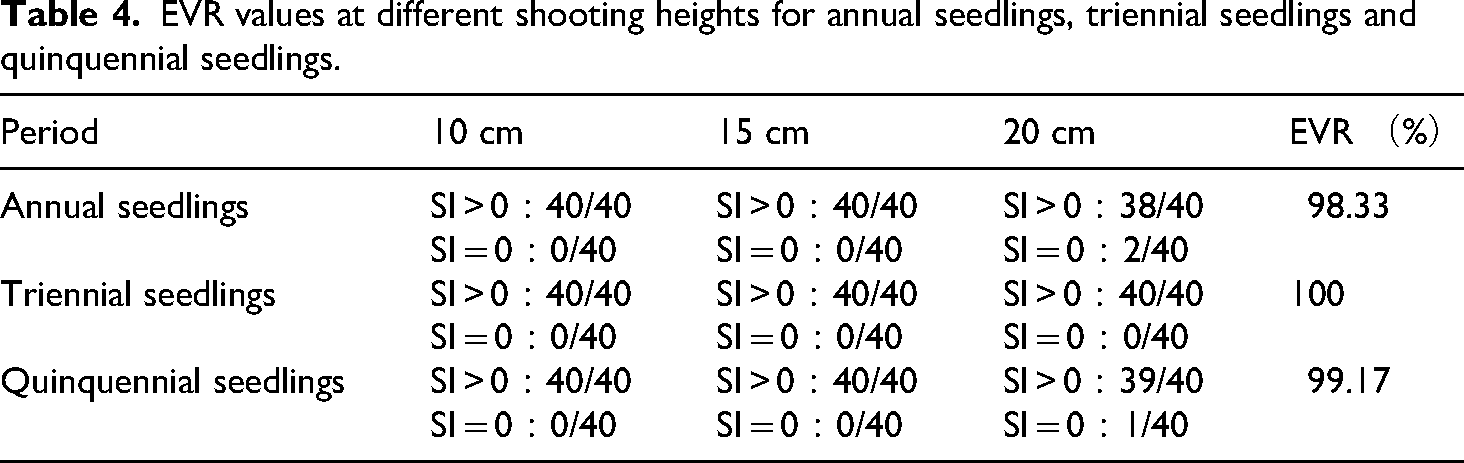
Based on the coordinate extraction algorithm of the detection points, 360 images of blueberry plants were re-collected as the experimental objects. This set of images covers different growth stages and shooting heights of blueberries, as illustrated in Figure 12; the coordinate extraction experiment was performed using the proposed algorithm, with the results documented in Table 4.

Experiment on the detection point coordinate extraction algorithm.
EVR values at different shooting heights for annual seedlings, triennial seedlings and quinquennial seedlings.
Discussion
This study addresses the core demand for precise positioning of water and fertilizer detection points in blueberry potted plants in a greenhouse environment and proposes an LSRS-Net coordinate extraction method based on DeeplabV3 + . The LSRS-Net is compared with the aforementioned mainstream semantic segmentation models in terms of performance. The performance evaluation metrics of the models on the dataset are presented in Table 5. Experimental results indicate that upon convergence, the LSRS-Net achieves precision values of MPA = 94.81% and MIoU = 90.65% in the pot's soil segmentation task, representing increases of 2.98% and 3.84% compared to the DeeplabV3 + model. Although three metrics of U-Net are relatively close to those of the LSRS-Net, its performance in terms of memory usage, total parameter count, and inference speed is inferior, resulting in suboptimal comprehensive performance. Meanwhile, the inference speed of the LSRS-Net increases to 39.62 FPS, representing a 5.26% improvement over the DeeplabV3 + and satisfying the high frame rate processing requirements of mobile inspection devices. Experimental data shows that LSRS Net significantly improves the segmentation efficiency of pot's soil areas in facility agriculture scenarios while maintaining high segmentation accuracy, providing reliable technical support for intelligent and precise water and fertilizer monitoring in agriculture.
Comparison of segmentation performance between different improved models.
As observed in Table 4, the extraction validity rate of the proposed detection point coordinate extraction algorithm exceeds 98.33%. Across the three experimental groups involving different plant growth stages, extraction failures occurred at a shooting height of 20 cm. This is because when shooting from a higher position, the camera is nearly in a top-down orientation, and plant branches obscure most of the soil area outside the pot, resulting in a concave, narrow strip-shaped masked soil region after network segmentation. When the extraction algorithm is applied to determine the center of the maximum inscribed circle within the mask, the radius of this circle is close to the preset safety threshold h due to interference from plant branches, causing the extracted detection point coordinates to be close to the center of the plant's main stem with an SI value of 0.
By analyzing the experimental results, this study offers direct practical guidance for greenhouse owners. Specifically, the proposed LSRS-Net segmentation network and coordinate localization algorithm can accurately determine the sensor insertion coordinates for the inspection robot when collecting water and nutrient information from potted blueberry plants, thereby meeting the operational requirements for controlling the robot's manipulator. Precise monitoring and localization facilitate the acquisition of reliable data on blueberry water and nutrient status, which can subsequently inform irrigation and fertilization decisions. Furthermore, this method is compatible with existing inspection robots. Greenhouse owners can directly deploy the algorithm into the robot system and, following necessary calibration, achieve efficient plant monitoring.
Conclusions
Experimental results demonstrate that the improved LSRS-Net model effectively meets the requirements for both accuracy and efficiency in segmenting the soil region within pots for inspection robots. Through k-fold cross-validation, the model achieved a MPA of 94.81% and a MIoU of 90.65%. Its real-time processing performance reached 39.62 FPS, which is 5.26% higher than that of DeeplabV3+, while the model size was compressed to 38.11 MB. The proposed detection point coordinate extraction algorithm achieved a positioning accuracy of over 98.33%. It successfully located water and nutrient detection points with a high success rate even when dealing with irregular soil regions, which experimentally verifies its effectiveness. This algorithm provides technical support for the precise coordinate positioning of inspection robots.
Significant variations in plant branching and growth conditions across different growth stages were also considered in the experimental phase of this study. We tested different plant heights to compare segmentation performance. However, since the inspection robot operates continuously in the greenhouse, the model's performance under complex lighting conditions requires further validation. Additionally, the varying luxuriance of blueberry foliage across different seasons may also affect the localization performance of the coordinate extraction algorithm.
In future work, we will focus on investigating the impact of complex lighting on the model by varying light conditions and simulating weather changes to verify its robustness across different environments. Furthermore, we will apply the proposed method to monitoring systems for other plant varieties and continue refining the model to enhance its generality and applicability, aiming for broader implementation.
Concurrently, factors including seasonal variations and different shapes of pots can significantly affect the robustness of the coordinate extraction algorithm. Future experiments will be conducted under diverse conditions to further optimize the algorithm, making it more reliable across various environments. These technological innovations are expected to advance the paradigm of water and nutrient monitoring in greenhouse plants, thereby enhancing the precision management level, monitoring efficiency, and resource utilization effectiveness in greenhouse cultivation.
Footnotes
Ethics statement
This article does not contain any studies with human or animal participants.
Author contributions
Conceptualization: Yi Lu; data curation: Yang Yi and Chenlong Fan; formal analysis: Yi Lu and Jiayu Chen; funding acquisition: Bin Wu and Ying Liu; investigation: Kezheng Sun; methodology: Bin Wu and Ying Liu; project administration: Yi Lu and Bin Wu; resources: Di Jiang; software: Yi Lu and Jiayu Chen; supervision: Bin Wu, Ying Liu, and Di Jiang; validation: Jiayu Chen and Kezheng Sun; visualization: Kezheng Sun, Di Jiang, and Mengmeng Qiao; writing—original draft preparation: Yi Lu and Jiayu Chen; writing—review and editing: Yi Lu, Jiayu Chen, and Bin Wu; all authors have read and agreed to the published version of the manuscript.
Funding
This research was financially supported by the Jiangsu Province Modern Agricultural Machinery Equipment and Technology Demonstration and Promotion Project (Grant No. NJ2023-16).
Declaration of conflicting interests
The authors declared no potential conflicts of interest with respect to the research, authorship, and/or publication of this article.
Data availability statement
The datasets generated during and analyzed during the current study are available from the corresponding author on reasonable request.