
Abstract
As a key core component of wind turbine generators, the rolling bearings in the gearbox directly affect the overall performance and reliability of the wind turbine generators. Accurate prediction and timely diagnosis can effectively improve the efficiency of the wind turbine generators. This paper takes the rolling bearing operation data as the research object and proposes a bearing fault classification research method based on the combination of variational mode decomposition (VMD) optimization and convolutional neural network-bidirectional gated recurrent unit (CNN-BiGRU)-Attention model. Firstly, to address the sensitivity of intrinsic mode function (IMF) components in the VMD decomposition process, an improved RIEM algorithm is adopted to optimize the hyperparameters of the VMD algorithm. This process aims to adaptively adjust the penalty factor and decomposition layers of the VMD algorithm and find the optimal IMF component to determine the most suitable IMF component in the signal data. Secondly, to fully explore the complex characteristics of fault signals, composite multi-scale slope entropy is used to extract features from the optimized input data. By conducting multidimensional analysis on the local and global characteristics of the signal at different time scales, efficient representation of fault features is achieved. Finally, based on MATLAB, a simulation experiment platform is established. This paper conducts research on the classification of rolling bearing faults through the CNN-BiGRU-Attention model. The results show that the model established in this paper has significant effects and stable performance. The research in this paper provides new technical ideas for fault diagnosis of rolling bearings in wind turbine generator gear.
Keywords
Introduction
In recent years, with the application and development of renewable energy power generation, wind energy has occupied an important role in new energy power generation. And according to the Global Wind Energy Council (GWEC) released the Global Wind Power Industry Report 2024, the global new installed capacity of 116.6 GW of wind power in 2023, an increase of 50% over 2022, and the total installed capacity of wind power reached 1.021 GW, an increase of 13% year-on-year. The top five global markets for new installations in that year were China, the United States, Brazil, Germany, and India, with the top five markets together accounting for 80% of global new installations. Figure 1 shows the global installed wind power capacity in recent years with new capacity and major market shares in 2023, where Figure 1(a) shows the global installed wind power capacity in 2019–2023, and Figure 1(b) shows the new capacity and major market shares in 2023.

Global installed wind power capacity in recent years with capacity additions in 2023 and key market shares figure.
At the same time wind turbine gear box rolling bearing as is an important component of the gear box, due to the rolling bearing health status directly related to the safe and stable operation of wind power equipment, so timely detection of critical rolling bearing in the failure to ensure the safe and stable operation of the machinery is of great significance.1,2
However, the harsh working environment makes the gearbox bearings face a higher risk of damage, once the failure occurs for a long period of time, thus affecting the safety of the wind turbine with a long downtime. 3
Prolonged malfunction can compromise the safety of wind turbines and result in extended downtime. Generally speaking, bearing failures can be categorized by location as follows: failures on the inner ring, rolling element failures, outer ring failures, and cage failures. By failure type, bearing failures can be classified as fatigue, wear, corrosion, fracture, adhesion, deformation, cage damage, and so on.4,5
(1) Fatigue Wear. During rotation, friction occurs between the rolling elements and the inner and outer rings of a bearing. Over time, this leads to wear on the surfaces of the inner and outer rings as well as the rolling elements. Furthermore, the ingress of foreign matter and inadequate lubrication can both contribute to bearing wear.
(2) Spalling. Due to complex operating conditions, bearings may be subjected to stresses that induce internal cracks. Furthermore, the ingress of foreign matter can cause excessive compression on the outer ring, leading to wear that enlarges the internal clearance. This results in uneven stress distribution within the bearing, ultimately causing spalling on the bearing surface.
(3) Corrosion. Environmental factors may also impact bearings. When bearing surfaces react with external acidic or alkaline substances, corrosion occurs, leading to surface roughening. Prolonged operation can subsequently cause fatigue spalling and even failure.
(4) Cracking and Fracture. Numerous factors may cause cracks and fractures in wind turbine generators, such as improper heat treatment during production, collisions during installation, or prolonged bearing operation, all of which can lead to the development of cracks and fractures in the bearings.
(5) Welding. In areas where bearing grease has low viscosity and where high temperatures are likely to occur during bearing operation, insufficient lubrication can cause the bearing surfaces to stick. Prolonged operation under such conditions leads to repeated sticking, resulting in surface peeling and damage—a phenomenon known as sticking.
(6) Cage Damage. The function of the cage is to ensure the rolling elements are evenly distributed within the bearing, maintaining a fixed operating trajectory for the rolling elements to prevent friction, collision, and other phenomena between them. During prolonged bearing operation, the cage continuously endures impact stresses in the load-bearing zone, leading to fatigue spalling and wear.
Therefore, it is of high practical significance to explore the fault classification and identification of wind turbine gearbox bearings. Effective fault diagnosis methods are important to reduce maintenance costs and accident rates. Traditional machine learning methods are commonly used for bearing fault diagnosis, such as support vector machines (SVMs), 6 and artificial neural network work. 7 However, bearing signal data contains rich information features in the input features with a considerable degree of redundancy, while machine learning methods usually have only a shallow structure, making it difficult to extract information from high-dimensional data. In recent years, deep learning methods that can extract complex features from data have replaced machine learning methods.
At present, in order to deal with the above challenges, extensive research has been carried out by scholars all over the world. The research mainly includes the following steps: (1) the above signal processing method represents the decomposition of vibration signal data into different frequency bands; (2) after that, each frequency band data is used to extract the fault feature inputs through the method of feature extraction; and (3) the input signals are used to carry out the fault classification work through the deep learning system. Scholars at home and abroad have conducted a lot of research on this problem and proposed many methods, which provide a direction for the writing of this article. For the problem of bearing vibration signal data decomposition, in which the fault transient components in the non-smooth signal, and can not be well obtained by the time-domain or frequency-domain methods. Therefore, time–frequency domain analysis is more widely used than a single time or frequency domain algorithm. Existing methods include Wigner distribution, empirical mode decomposition, empiricalion mode decomposition (EMD), short-time Fourier transform, and wavelet transform (WT) 8 and their corresponding improved algorithms. The literature of Li et al. 9 proposes a bearing fault signal feature extraction algorithm based on optimization and improvement of variational modal decomposition (VMD) for the problem that it is not easy to extract the weak features of early fault information of rolling bearings, and at the same time verifies the effectiveness of the model by combining with the SVM algorithm. The VMD algorithm improves the EMD algorithm for its own defects such as modal aliasing and endpoint effect, so as to have a better anti-noise effect and decomposition accuracy. The literature of Ma et al. 10 proposes a novel method for extracting early stage fault features in rolling bearings based on an improved VMD and Teager energy operator (MVMD-TEO).
While the vibration signal, as the data carrier of the bearing at work, contains rich bearing state data features, there is a large amount of invalid information in the signal due to the influence of the signal acquisition method, the bearing working environment and other factors, and this interfering information affects the judgment ability of the model, which causes difficulties in the subsequent fault diagnosis. Therefore, it is necessary to study suitable algorithms to extract the sensitive features reflecting the health status of motor bearings quantitative physical indicators from the complex raw signals, which is a crucial step in fault diagnosis. Common motor bearing fault feature extraction methods are as follows: time domain, frequency domain, time–frequency domain, and entropy-based feature extraction methods.
In recent years, scholars have carried out in-depth research on signal fault feature extraction methods from different perspectives. The literature of Cui et al. 11 proposes to perform unsupervised learning to understand data attributes for sensitivity analysis to extract important features and avoid overfitting. The literature of Zhu-ting et al. 12 proposes the use of gray correlation analysis to effectively diagnose gearbox wear, chipping and other faults. The literature of Liu et al. 13 proposes a two-dimensional time–frequency domain feature extraction method based on multiscale fuzzy entropy. This method was used to statistically analyze fault information in signal components, thereby improving fault recognition accuracy. Finally, the feature-extracted signals are fed into a deep learning classifier to complete the fault classification work. Among them, the common fault classifiers contain the following: decision tree, SVM and BP neural network 14 and so on. Although good classification results can be achieved in traditional fault classifiers, it is often necessary to manually adjust the parameters and classifier inputs, which at this time restricts the parameter extraction ability of the feature inputs with the accuracy of fault classification. With the redundancy of input feature data, a single traditional fault classifier is difficult to realize the fault classification of wind turbine bearing data at this stage. Scholars use intelligent optimization algorithms such as particle swarm optimization (PSO) algorithm, genetic algorithm, and gray wolf optimization algorithm to optimize the hyperparameters of the classification model. It ensures that the fault classifier realizes higher classification accuracy. The literature of Gao et al. 15 uses VMD for denoising the interference and then uses the improved gray wolf optimization (IGWO) algorithm to optimize the SVM model parameters, which ultimately achieves a high classification accuracy. The literature of Dong et al. 16 achieved optimization of convolutional neural network (CNN) parameters by PSO algorithm, which enabled the classification model to achieve higher classification accuracy.
In summary, the vibration signal, as a data carrier when the bearing is working, contains rich characteristics of the bearing state data, but affected by the signal acquisition method, the bearing working environment and other factors, there is a large amount of invalid information in the signal, and this interfering information affects the judgment ability of the model and causes difficulties in the subsequent fault diagnosis. Therefore, suitable algorithms need to be investigated to extract the sensitive features reflecting the health status of motor bearings quantitative physical indicators from the complex raw signals, which is a crucial step in fault diagnosis. At the same time, due to the complexity of the operational geography of wind turbine gearbox bearings, and for data decomposition methods are not easy to decompose different components of overlapping signal data affecting the subsequent fault classification task. In practice, a specific method only applicable to a single operating condition cannot accomplish the fault classification task. Therefore, in order to enable the proposed method to cope with the fault feature extraction of various signals and to mitigate the influence of human experience and subjectivity, the optimal parameters need to be optimally selected. Improving the speed and accuracy of the fault feature extraction method also facilitates the subsequent diagnostic process.
On this basis, the article proposes a method for classifying wind turbine gearbox axlebox bearing faults by combining the improved frost and ice optimization algorithm (RIME) for selecting appropriate IMF components for the VMD, the composite multiscale slope entropy feature extraction and the CNN–bidirectional gated recurrent unit (BiGRU)–Attention model. The innovations of this study are as follows: (1) in this article, the rolling bearing fault diagnosis of onshore wind turbine gearboxes is taken as the research background, and the impact of rolling bearing faults on the stability of wind turbine operation and work efficiency is discussed. The methods of fault detection and classification in this context are also studied in depth. This provides an important foundation for subsequent predictive maintenance and fault management strategies for wind turbines. (2) The article lies in the fact that by first using the improved RIME algorithm to select hyperparameters for the VMD algorithm, the selection accuracy of the IMFs (intrinsic modal components) components is significantly improved. It ensures that the extracted signal components in the subsequent analysis are more reliable and provide high-quality input for feature extraction. (3) The introduction of composite multiscale slope entropy (CMSSE) as a feature extraction method makes it possible to capture the complex dynamic features in the input data. As a result, the feature extraction method not only improves the expression ability of the features, but also enhances the model’s ability to detect and categorize different failure modes, thus improving the accuracy of bearing fault diagnosis. (4) Performance of CNN–BiGRU–Attention model in rolling bearing fault classification. The advantages of the proposed model in fault diagnosis are further verified through the comparative analysis with the traditional method, combining different algorithms of CNN, BiGRU, and Attention support, this classification algorithm can improve the robustness and prediction accuracy of the model.
The structure of this article is shown as follows: the “Methods” section describes the frost and ice optimization algorithm, the VMD data decomposition algorithm, the CMSSE model, the CNN algorithm, the BiGRU algorithm, and the Attention algorithm. The “Combined diagnostic model” section describes the improved RIME algorithm, IGRIME optimization of VMD model, CMSSE, and CNN–BiGRU–Attention model. The “Results and analysis” section describes the decomposition processing operation of bearing vibration signal data, signal data feature extraction method, and bearing fault classification and identification by feature parameters under CNN–BiGRU–Attention algorithm, and analyzes and compares the classification results. The “Conclusions” section draws the conclusion of this article. Figure 2 shows the structure sketch of the experimental process of this article.
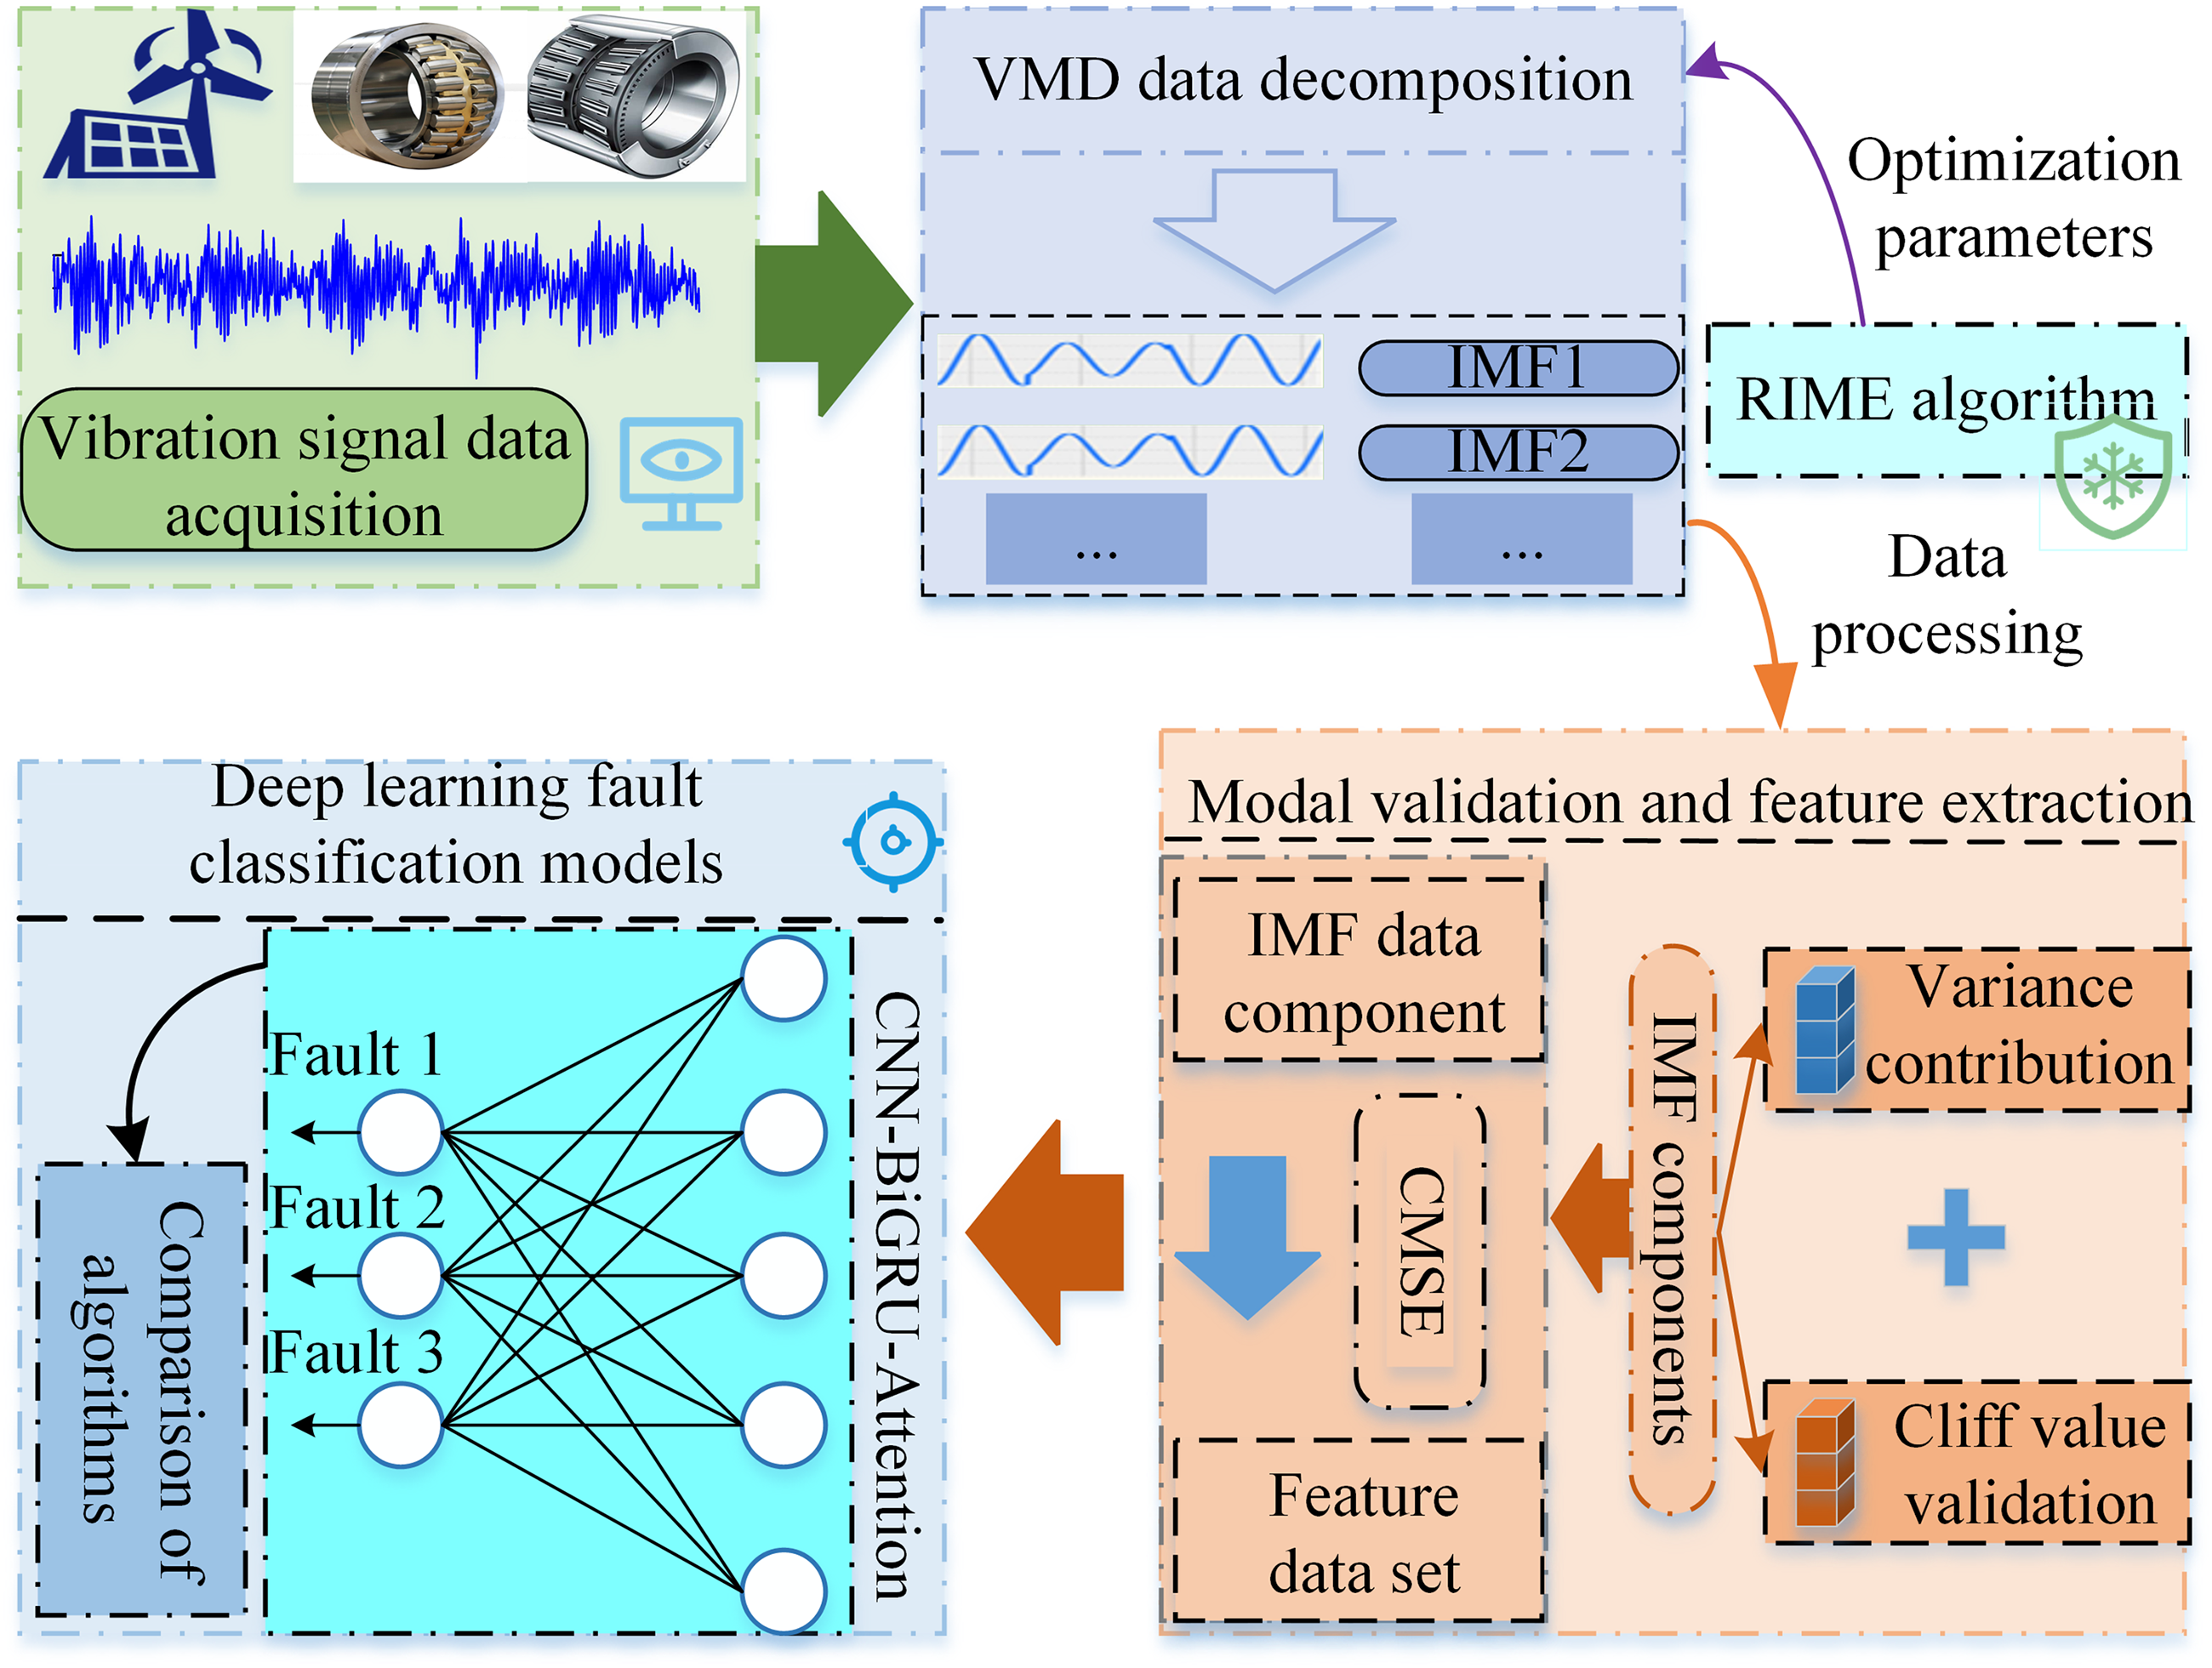
A sketch of the structural layout of the article.
Methods
Frost and ice optimization algorithm
For the rolling bearing fault signal usually need to use the data decomposition algorithm for signal decomposition and reconstruction operation, and for the data decomposition algorithm of the hyper-parameters are often set artificially, prone to over-decomposition and under-decomposition phenomenon. Compared with the traditional method, the frost and ice optimization algorithm has faster convergence speed, stronger global optimization ability, and strong adaptive ability, which can automatically adjust the decomposition parameters for different bearing states, thus helping the VMD algorithm to accurately extract suitable intrinsic mode functions (IMFs) components.
Su et al.
17
proposed the RIME algorithm in 2023 through the freezing fog phenomenon, the main core of the algorithm lies in the soft frost search and hard frost puncture mechanism, which is utilized to simulate the motion of frost and ice particles, enabling stepwise exploration in the search space. The specific steps are as follows:
Initialize the spatial location matrix Soft frost search strategy. According to the five motion characteristics of the frost ice particles, the condensation process of the frost–ice particles was simply simulated as shown in Figure 3, and at the same time, the position of the frost–ice particles was calculated as shown in the following equaiton: The RIME algorithm proposes a hard freezing puncture mechanism based on the freezing puncture phenomenon, which improves the ability of the algorithm to jump out of the local optimum. The inter-particle displacement of freezing fog is shown in the following equaiton:


Schematic diagram of frost–ice particle condensation in the case of a soft frost search.
VMD data decomposition algorithm
The wind power bearing fault signal is characterized by non-stationarity and multi-component coupling, and the traditional method is prone to the problem of modal aliasing. Meanwhile, the VMD algorithm has better decomposition ability and signal reconstruction ability for the transient shock signal of bearings, and the decomposed IMFs components can reconstruct the original signal more accurately through the optimization mechanism. 18 Meanwhile, the rolling bearings in this article contain a variety of faults, so the VMD algorithm adopts the global optimum to estimate the IMFs, which can better adapt to the frequency variations caused by different types of faults.
The VMD algorithm effectively reduces the effect of noise by decomposing the signal into multiple IMF signal components. The algorithm is to decompose the input vibration signal data into k sub-data signals and, at the same time, ensure that it has a minimum estimated bandwidth and. Define each IMF as an amplitude and frequency modulation function, denoted as follows:


CMSSE theory
Wind turbine gearbox rolling bearing signals contain noise data, and if the use of traditional entropy for feature extraction is often subject to noise interference, and only in a single scale to calculate the entropy value, the traditional entropy value cannot capture different time scales under the fault characteristics. At the same time, for the nonlinearity and non-stationarity of the bearing vibration signal data as well as the failure process leads to significant changes in the slope of the signal. Therefore, CMSSE is selected for fault extraction of input features, which can better capture dynamic features with better robustness in time scale and handling transient changes compared to other entropy methods. 19
Entropy is often used to quantify uncertainty or complexity, and in the case of time series, entropy can be used to measure the randomness of the data. Multiscale analysis constructs series at different scales by “coarse-graining” the original time series and calculates the entropy value at each scale. 20
Therefore, this article combines the entropy value analysis algorithm with the multiscale theory to analyze the fault characteristic frequency information of vibration signals at multiple scales, so as to extract more useful feature information. At the same time, the traditional multiscale coarse-grained approach does not consider the correlation of adjacent elements, ignoring the effective feature information between adjacent elements in the time series, and when the scale factor is too large, it is easy to lose the useful information of the original time series. In view of this limitation, the traditional multiscale entropy algorithm is further improved by introducing the composite multiscale method, which reduces the deviation of the entropy calculation by means of fine composite, in order to further improve the effect of feature information extraction of the vibration signals of the motor bearing. The CMSSE combines multiscale analysis with slope entropy to measure the complexity by quantifying the dynamic features of the time series on different time scales.
CNN algorithm
CNN is widely used for its ability to automatically extract fault features from raw data. CNN performs well in handling data with spatial structure, and is able to efficiently extract local features and weak impact features.21,22 In the case of rolling bearing signals, complex fault modes may present specific patterns at different locations in the time series, and CNNs are able to automatically learn these key features through convolutional operations, thus significantly improving the accuracy of fault classification. CNNs can reduce the computational complexity of the model by gradually extracting the low-dimensional representations of the high-dimensional features through its hierarchical feature-learning structure. Traditional algorithms (e.g. SVMs or decision trees) often perform poorly when dealing with high-dimensional features and are prone to overfitting.
CNN captures local patterns and correlations in the input data through convolutional and pooling layers. These features are learned after multiple layers and finally, the final result is output by the fully connected layer, where Figure 4 shows the schematic diagram of the CNN model.

Diagram of convolutional neural network (CNN) algorithm.
BiGRU algorithm
Wind turbine vibration signal data has strong timing dependence (e.g. periodic shocks and fault frequency variations), BiGRU can effectively filter and process these noises through the gating mechanism, focusing on the extraction of effective features. Meanwhile, the bi-directional nature of BiGRU allows the model to process the input data from two directions, which enables a more comprehensive understanding of the signal patterns and is suitable for non-stationary vibration signals in time-varying operating conditions. 23 Thus, in fault detection, important features may appear at different stages of the signal, and the bidirectional processing ensures that the model captures this critical information and improves classification accuracy.
Attention model
In rolling bearing signals, fault features may have different importance to the fault state at different moments in time. The Attention mechanism can automatically identify and focus on the most relevant parts of the signal, automatically assign weights with suppression of extraneous noise, and focus on the fault-critical time periods to help the model make better use of the key features when classifying, rather than treating all input data equally. The Attention mechanism is able to generate stronger feature representations by calculating the weighted sum of each input feature, resulting in a richer feature representation.24,25 Therefore, the Attention mechanism is suitable for the analysis of wind turbine vibration signals containing strong noise, which can enhance the diagnostic ability of the model.
The Attention mechanism module obtains the weighted feature vector by calculating the weight of each dimension in the high-dimensional feature vector passed by the BiGRU module and using that weight to weight the features passed by the BiGRU layer.
Combined diagnostic model
As mentioned earlier, the RIME algorithm, despite its ability to be adaptive and robust when it comes to nonlinear and complex data, lacks sufficient exploration of the threshold combination space, which causes the algorithm to fall into a local optimum and fails to obtain satisfactory segmentation results. In this article, we propose an improved RIME algorithm, called IGRIME, which combines the interaction mechanism and Gaussian diffusion strategy. The interaction mechanism facilitates the exchange of information between two randomly selected individuals in the aggregate and the current individual. This helps the current individual to evolve in a more optimal direction, thus increasing the likelihood that the population will find the best solution. In addition, the Gaussian diffusion strategy further enhances the exploration of the population in the search space, preventing it from getting stuck in local optima and enhancing the optimization of the individuals in the algorithm. Therefore, in this article, we choose to use the IGRIME algorithm for the hyperparameter optimization problem of the VMD data decomposition algorithm. Meanwhile, for the bearing fault vibration signal usually in the time domain often mixed with strong noise, which leads to the characteristics of weak faults difficult to identify, in the frequency domain exhibits the phenomenon that its fault eigenfrequency is easy to be masked by high-frequency noise that may be meshed by gears. Therefore, the decomposition effect of the traditional single VMD algorithm is not applicable to non-smooth wind power signals. In this article, IGRIME is used to optimize the hyperparameters of the VMD algorithm to avoid over-decomposition or under-decomposition and to improve the extraction accuracy of the fault frequency. And the entropy-based feature extraction algorithm calculates the slope statistical characteristics of the signal on a multi-time scale, which is more sensitive to the impact characteristics of weak faults and easy to distinguish different bearing fault modes. Thus, this article chooses the composite multi-time scale slope entropy for feature extraction, and finally, due to the spatio-temporal coupling characteristics of wind power bearing fault signals, it is difficult for a single deep learning model to learn comprehensively, and this article chooses to classify the faults in CNN–BiGRU–Attention model to solve the problems of weak early faults, complex signals, and large noise interference of wind power bearings, and to improve the diagnostic reliability, and the above combined model will be discussed in this section.
Improvement of the RIME algorithm
The IGRIME algorithm combines an interaction mechanism and a Gaussian diffusion strategy, focusing on enhancing communication between different individuals in the population through the interaction mechanism 26 and the Gaussian diffusion strategy. This promotes the evolution of the current individuals in a more optimal direction, thus increasing the likelihood that the population will find the best solution.
The interaction mechanism enhances communication between individuals in a population. The mechanism involves randomly selecting two individuals from the population and facilitating the exchange of information with the current individual. This interaction helps to steer the current individuals towards a more optimal evolutionary direction, thereby increasing the likelihood that the population will find the best solution.
Gaussian diffusion strategy is used to extend the search space exploration so as to avoid being trapped in local optima. Under the Gaussian step, three new individuals are generated by randomly perturbing the current individual and greedily selecting the best individual to replace the current one. Introducing this strategy enhances the exploitation of individuals in the algorithm.
Within the IGRIME model, the interaction probability (
In the Gaussian diffusion mechanism, the diffusion radius (
The preset population size (
In this study, the initial population is updated by an interaction mechanism that randomly selects two individuals and facilitates the exchange of information with the current individual, by helping the individuals to learn more information and improving their expressive abilities. Subsequently, we use the steps in the RIME algorithm to evolve the individuals and select the best individual position by a greedy selection mechanism. Finally, we enhance the search space exploration using a Gaussian diffusion strategy, which improves the likelihood of finding an optimal solution. The flowchart of IGRIME is shown in Figure 5.
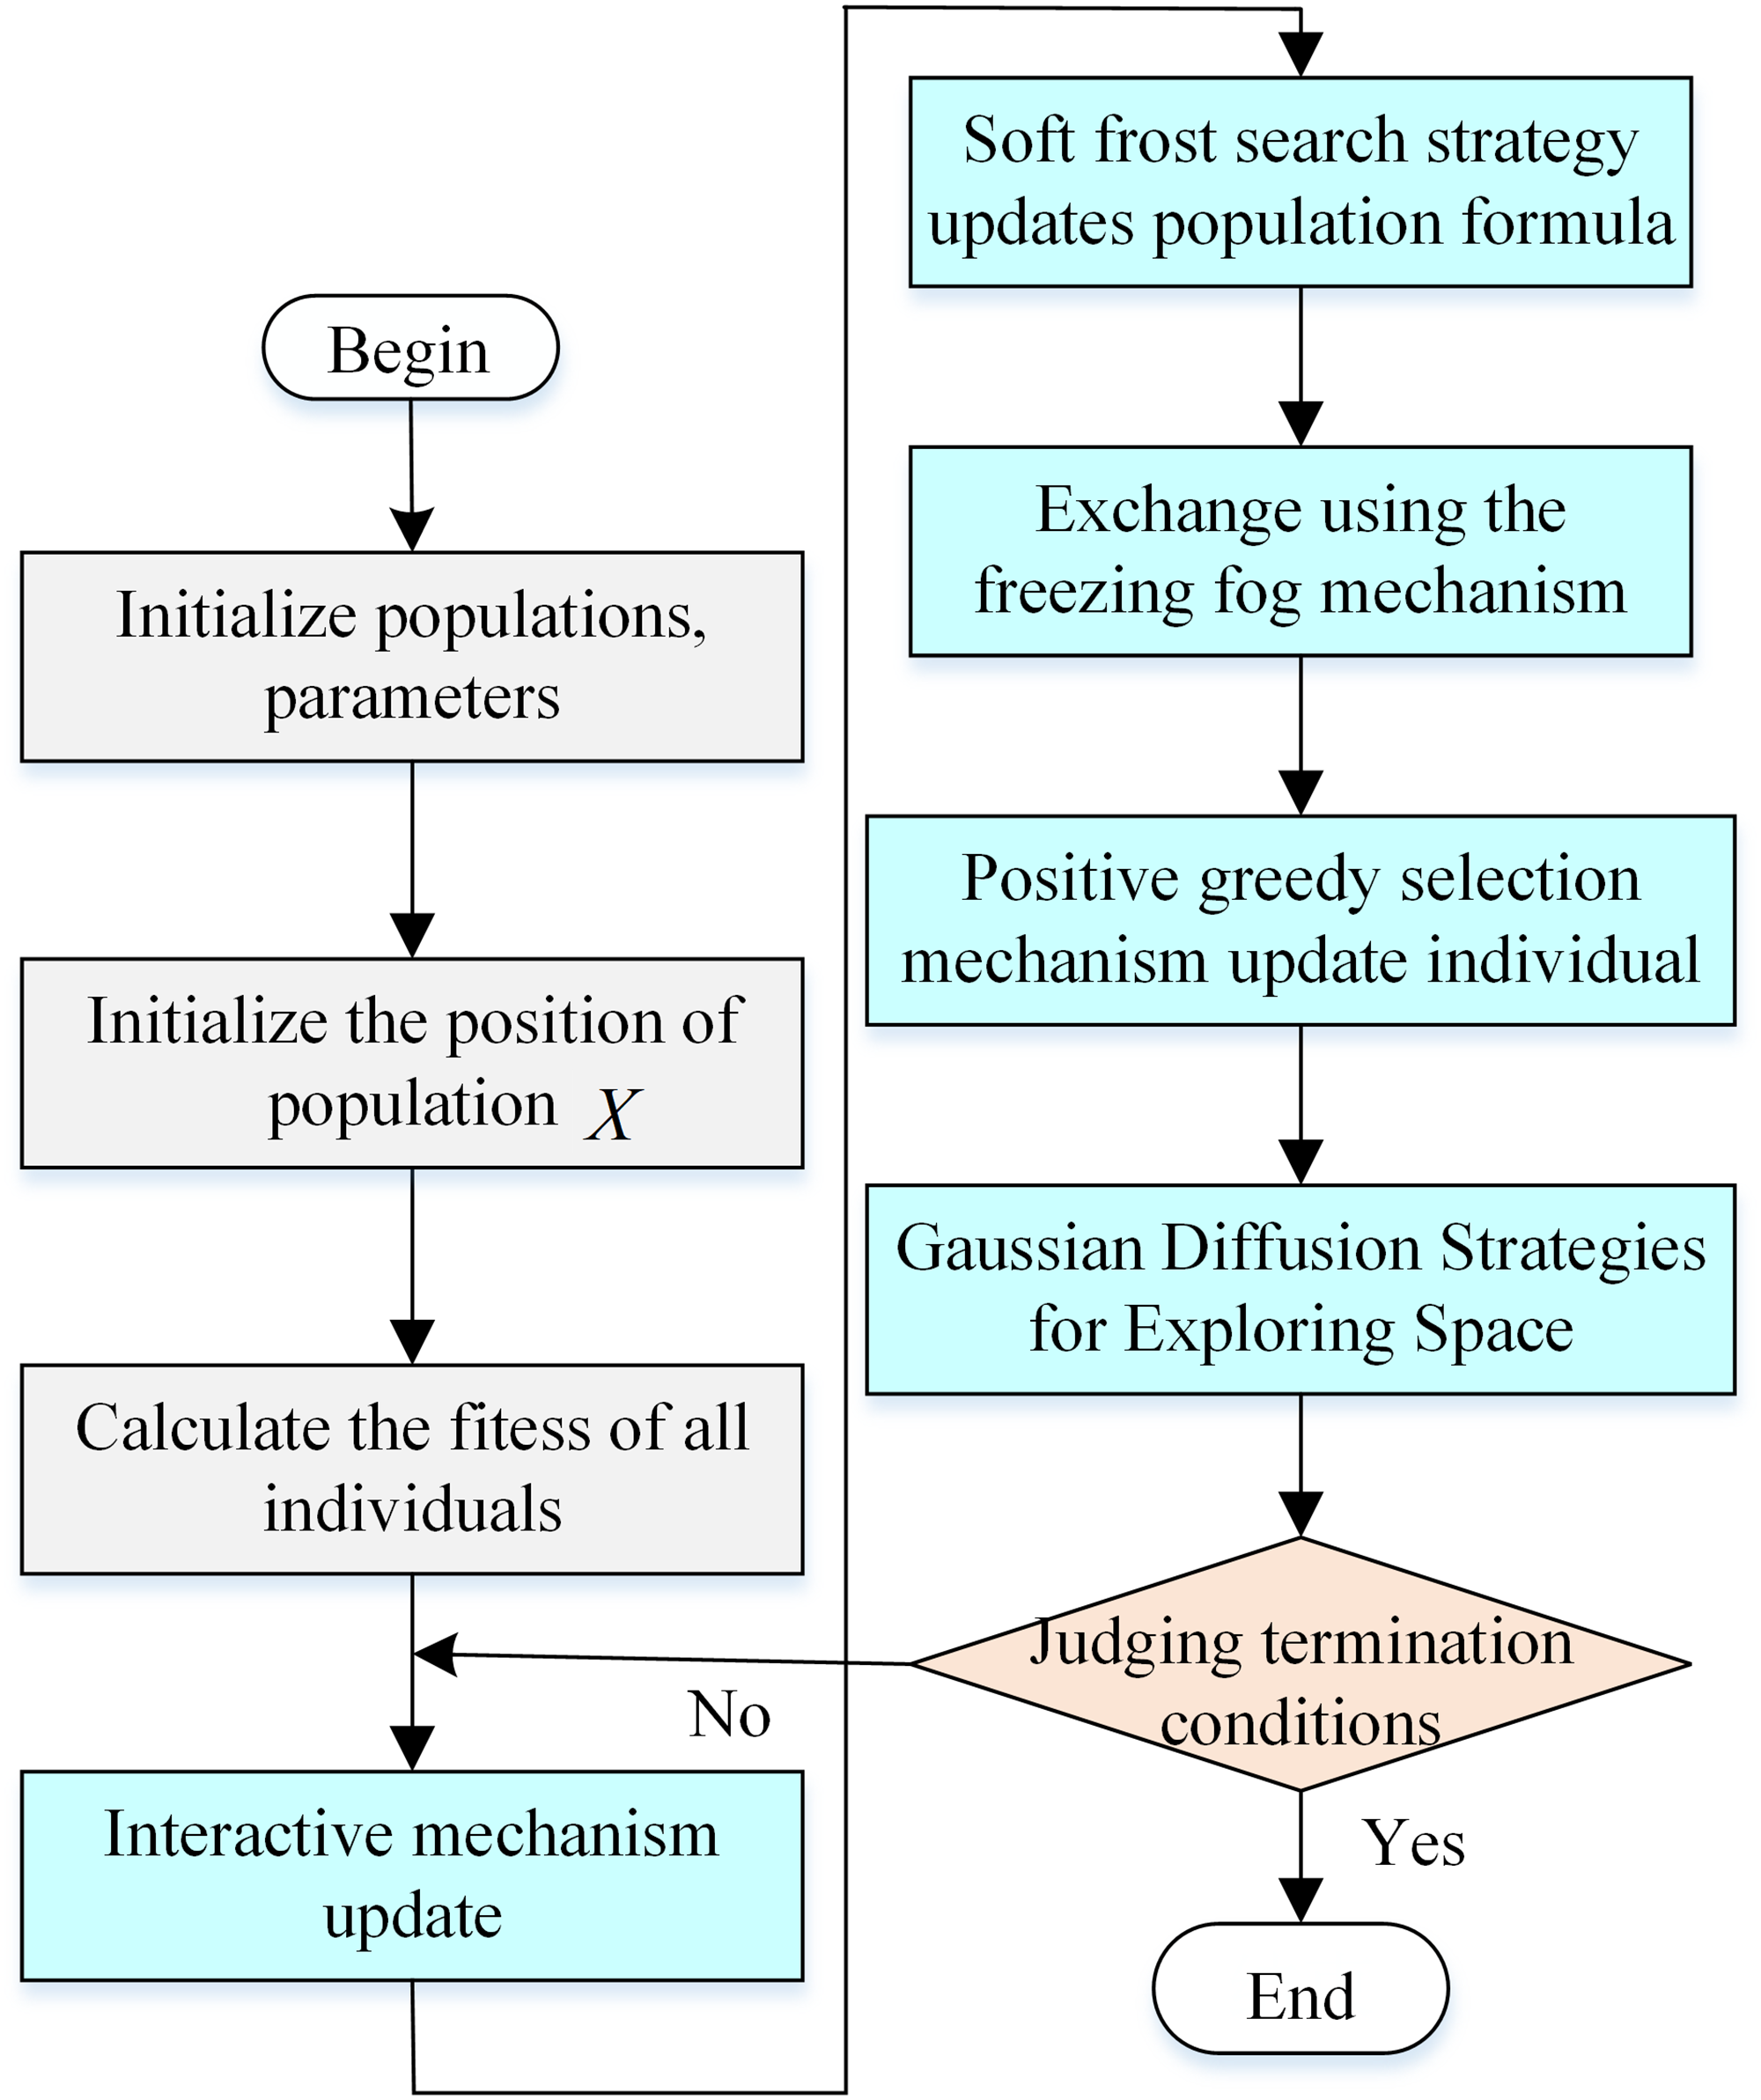
Flowchart of IGRIME algorithm.
Hyperparameter optimization of VMD algorithm by IGRIME algorithm
VMD data decomposition method to extract rich feature information from the original vibration signal data, need to select the best combination of parameters, the number of modes and the penalty parameter should be selected in the appropriate interval, too large or too small will lead to insufficient extraction of the feature signals, using the frost ice optimization algorithm for parameter optimization.
Meanwhile, when the IGRIME algorithm optimizes the VMD hyperparameters, it is necessary to choose a suitable fitness function. The selection of the fitness function chosen in this article is shown below:
Minimum information entropy: It is used to characterize the degree of uncertainty of the system events. Due to the periodic shocks, the fault information of the IMF containing pairs obtained from the decomposition shows that the higher the ordering, the smaller the entropy value will be the formula is as follows: Minimum arrangement entropy: In order to be able to accurately find the best combination of and in the VMD data decomposition method, if the optimization function is selected normalized arrangement entropy, the arrangement entropy value can effectively reflect the complexity of the time series, the arrangement entropy is normalized, and the degree of regularity of the time series can be better reflected after processing. The regularity of arrangement entropy is proportional to the time series.


In this article, we combine two methods to search for the optimal number of decomposition layers and penalty factors for each IMF component using the composite indicator arrangement entropy/mutual information entropy as the fitness function. The flowchart is shown in Figure 6:

IGRIME–VMD flowchart.
Set the initial parameters of IGRIME and VMD parameter values to initialize the population size. Initialize populations and generate fog locations. Perform VMD decomposition. Calculate the optimal fitness and returns to Step 3 if the iteration stop condition is not reached.
The flowchart is shown in Figure 6.
Performance analysis of CMSSE
In order to study the stability and applicability of the CMSSE value algorithm and to analyze its feature extraction performance on different data signals, the noise (Gaussian white noise) is selected for the CMSSE performance test experiment. The changes of multiscale slope entropy (MSSE) and CMSSE values of the test signals are analyzed under different data lengths to test the relevant properties of the CMSSE value algorithm.
The CMSSE model integrates multiscale analysis with slope change statistics. Its core parameters typically include the scaling factor, slope quantization threshold, and segment length. The scaling factor (
In order to further study the performance of the CMSSE value analysis method, the data length of Gaussian white noise is set to 512, 1024, 1536, 2048, 2560, and 3072, respectively, and the rest of the parameters are set the same way, the entropy analysis of the noise data is carried out, and the analysis results are shown in Figure 7.

Multiscale slope entropy versus composite multiscale slope entropy values in Gaussian white noise.
As can be seen from Figure 7, Figure 7(a) is the mean entropy curve of MSSE under Gaussian white noise, and Figure 7(b) is the mean entropy curve of CMSSE under Gaussian white noise, and the fluctuation of the entropy curve of MSSE is larger between (0.4, 0.9), and the distribution of entropy value is not stable enough, while the entropy curve of CMSSE tends to be stabilized with the increase of the length of the Gaussian white noise data and the fluctuation range is from 0.6 to 0.8 and the fluctuation interval gradually decreases, which indicates that CMSSE has a better stability in feature extraction. fluctuation range is from 0.6 to 0.8, and the fluctuation interval gradually decreases, which indicates that CMSSE has better feature extraction stability.
CNN–BiGRU–Attention fault classification models
The structure of the CNN–BiGRU–Attention fault classification model proposed in this article is shown in Figure 8. The model mainly consists of five parts: input layer, CNN layer, BiGRU layer, Attention mechanism layer, and output layer.

Schematic diagram of CNN–BiGRU–Attention model.
The first part of CNN–BiGRU–Attention is CNN which is used to mine signal data features and eliminate unstable factors to improve the accuracy of fault diagnosis; the second part is BiGRU, which is based on the fact that GRU can capture the dependency relationship between long and short periods of time series and has fast convergence and high prediction accuracy, and extracts the feature vectors in the forward and backward directions to further improve the accuracy of feature extraction; the third part is the Atention mechanism, which assigns different weights to the feature vectors after BiGRU processing by calculation to highlight the key features; finally, the fully connected layer outputs the final prediction. The third part is the Atention mechanism, which assigns different weights to the BiGRU processed feature vectors by calculation to highlight the key features; finally, the final prediction results are output by the fully connected layer. Figure 8 shows the schematic diagram of CNN–BiGRU–Attention model:
Fault classification portfolio modeling based on IGRIME-VMD+CMSSE
A fault classification group combined modeling method based on IGRIME-VMD+CMSSE is proposed in the above discussion in the“Methods” and “CNN algorithm” sections. The Western Reserve University bearing data is used as the original input data set, and the features are selected using the RIME-VMD and CMSSE models, and then the CNN–BiGRU–Attention model algorithm is used for the fault classification, the flowchart is shown in Figure 9, and the specific implementation process is described below.
Perform the input Western Reserve University rolling bearing data set. Optimize the selection of VMD hyperparameters using the IGRIME algorithm to obtain a suitable combination of hyperparameters. Import the hyperparameter combinations obtained from Step 2 into the VMD algorithm for the data decomposition of the bearing signal data. The obtained IMF components are subjected to data selection. Feature selection of the feature data set using CMSSE to get the input data set. Import the feature data set into the CNN–BiGRU–Attention fault classification algorithm for fault diagnosis and analyze it in comparison with other algorithms.

Flowchart of fault classification for combinatorial modeling.
Results and analysis
Raw feature data set
The data selected for this article was obtained from rolling bearing data from Case Western Reserve University, USA. The diameter of the selected rolling bearing contains three different sizes of 0.007, 0.014, and 0.021 inches, and the rotational speed is 1797 r/min. The sampling condition is 12 kHz, in which there are a total of three kinds of fault states of the inner ring, the rolling body, and the outer ring, as well as the vibration signals in the normal state. There are 10 different data categories, and the driver data of each data is selected, then the following settings will be made: the sliding window w is 1000, the number of fault sample points s of each data is 2048, and the sample size of each fault type m is 10. Finally, all the data sliding windows are set up, and then synthesized into a data variable. And each state contains 120 samples, 90 samples for the drive end and 30 samples for the fan segment. There are 10 states in total, and the troubleshooting data is a matrix of 1200*9 columns, and then each row of data is labeled. 1–10 represent different types of faults, which are normal state, inner-ring faults, rolling-body faults, and outer-ring faults at 0.007 inches, inner-ring faults, rolling-body faults, and outer-ring faults at 0.014 inches, inner-ring faults, rolling-body faults, and outer-ring faults at 0.021 inches, and inner-ring faults, rolling-body faults, and outer ring failure. Table 1 shows the detailed experimental conditions.
Detailed experimental conditions of rolling bearing signals.

The time-domain waveforms of the bearing in different states are shown in Figure 10. From the figure, it can be seen that when the bearing is damaged, the vibration signal of each part is different from the vibration signal of the bearing in the healthy state, compared with the healthy state, the amplitude of the time-domain signal of the inner and outer rings is obviously increased when the failure occurs, but from this we can’t make the judgment of the type of failure. Figure 10(a) is the time domain diagram of the bearing in normal state, Figure 10(b) is the time domain diagram of the inner ring under failure, Figure 10(c) is the time domain diagram of the outer ring under failure, and Figure 10(d) is the time domain diagram of the rolling element under failure.
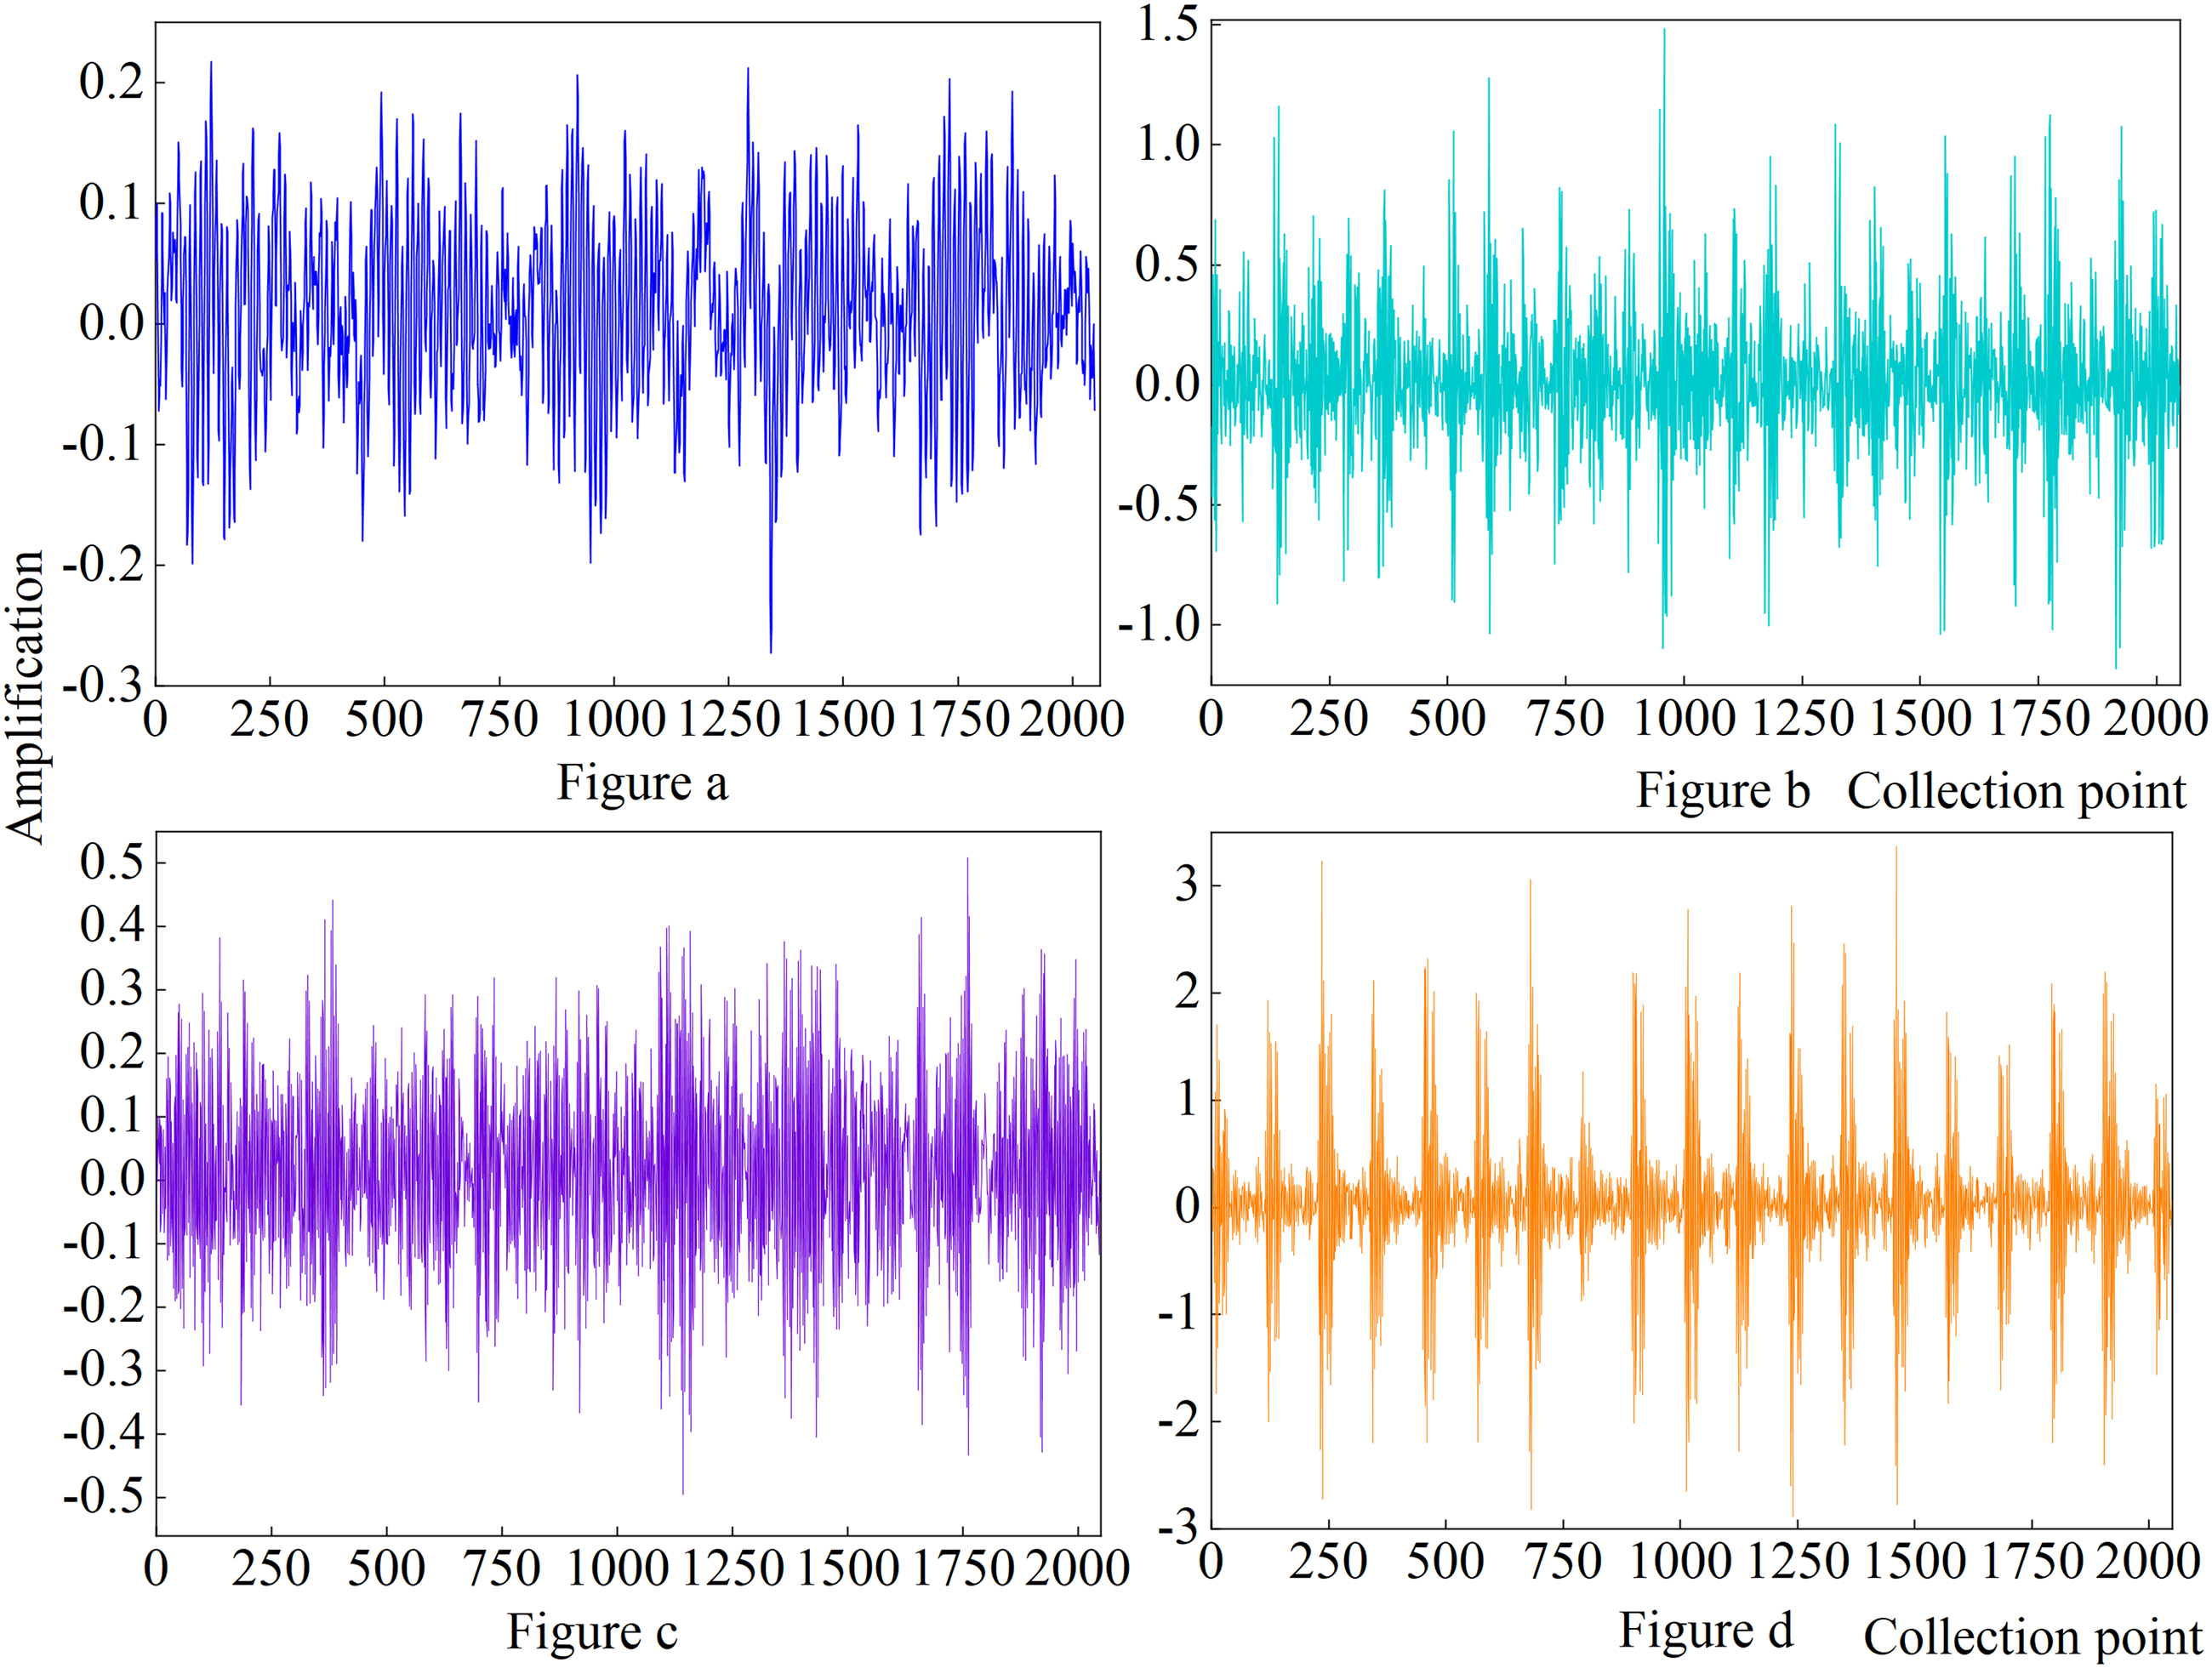
Time domain diagrams of rolling bearings in different states.
Hyperparameter optimization results
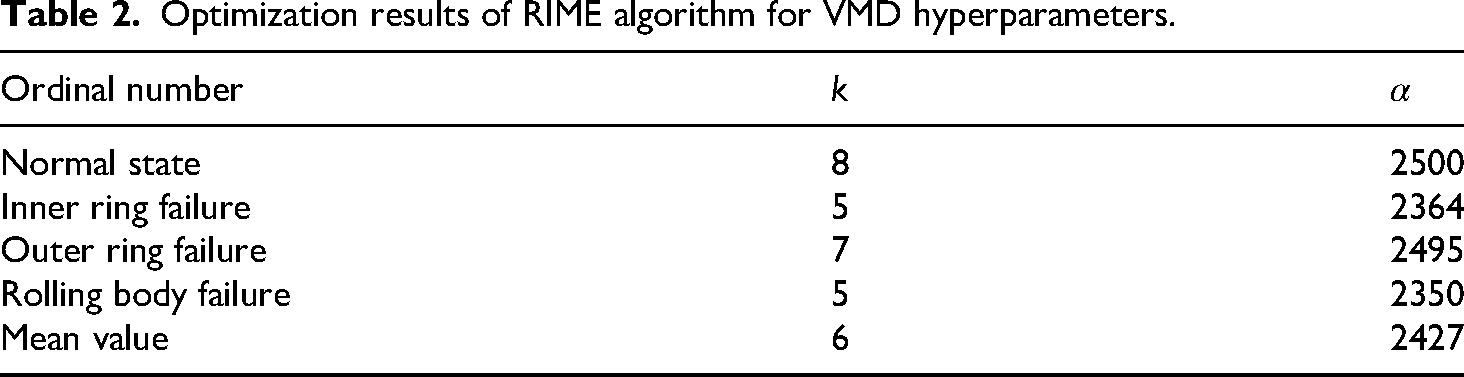
After RIME optimization VMD can find the best combination of modal number
In this case, the normal state of the rolling bearing of the wind turbine and the vibration signals of the outer ring, inner ring, and rolling body failure are processed, respectively, and the results of multiple optimization are obtained and the average value is taken as the final result. In the parameter optimization, the optimization results obtained by optimizing the number of parameter modal decompositions of VMD and the quadratic penalty factor are shown in Table 2.
Optimization results of RIME algorithm for VMD hyperparameters.
In order to more comprehensively assess the superiority of the IGRIME algorithm for the hyperparameter optimization of the VMD data classification model, as well as to improve the credibility and applicability of the model, this article adopts the HHO, PSO, and CPO algorithms to optimize the VMD model, and the data set is the same data set. The results of the hyperparameter optimization are shown in Figure 11, which shows that the IGRIME algorithm has a more stable convergence curve and faster convergence speed, and it identifies the global optimal threshold of the VMD data decomposition algorithm after 12 iterations, while the PSO algorithm follows, reaching the global optimal threshold after about 13 iterations, and it is easier to fall into the local optimal situation in the iteration process, local optimization. The HHO and CPO algorithms have a higher number of iterations than the IGRIME algorithm in the optimization parameters, which also reflects the superiority of the IGRIME–VMD model in the identification of hyperparameters.

Time domain diagrams of rolling bearings in different states.
The decomposition of the inner ring fault signal at a diameter of 0.021 inches and a rotational speed of 1797 was performed by VMD. The parameter [

Decomposition of rolling bearing signal variational modal decomposition (VMD) data.
Feature extraction
Vibration signal data is often mixed with other complex redundant information, rolling bearing fault characteristics are still submerged in these complex information. If the vibration signal is used directly for fault diagnosis, the detection effect of the model will be seriously affected. Therefore, before fault diagnosis, this article needs to carry out feature extraction on the bearing vibration signal data, so as to eliminate the redundant information in the signal data, and obtain the state feature quantity that can reflect the corresponding fault.
The bearing fault signal is decomposed by VMD into six IMFs, each of which contains a different amount of fault information, and a suitable evaluation index needs to be chosen to select the IMF that contains the most fault information. In this article, we choose the combination of cliff, Pearson correlation coefficient, and envelope entropy to select the IMF components.
Cliff value can be used to indicate the sharpness of the signal waveform number, the vibration signal of the fan bearing in the healthy state and the fault state of the cliff value is different, the vibration signal of the faulty fan bearing will be enhanced because of its shock component, the cliff value will increase, indicating that the eigenmode ecological function contains the more abundant fault information. The definition of crag is as follows:
Pearson’s correlation coefficient is used to express the fan bearing data signal measure of overall waveform similarity, focusing on the global waveform match. The correlation coefficient method is a common way to calculate the degree of linear correlation between two variables 


Envelope entropy can generally be used to quantify the complexity and regularity of the signal waveform, and the vibration data signals of fan bearings have significant differences in the envelope entropy values under different states. For example, in the normal state, its envelope entropy value is low; while in the fault state, due to the introduction of periodic shock components, manifested as a significant increase in the envelope entropy value change. Therefore, it can be seen that the larger the envelope entropy value tends to be, indicating that the fault characteristics corresponding to the IMF component are more complex and contain richer fault information. The following is about the operation process of envelope entropy:
The Hilbert transform is applied to the IMF component to obtain the instantaneous amplitude envelope:
Normalize the envelope signal 
Calculation of envelope entropy:
In this article, we choose to adopt the cliff value, correlation coefficient, and envelope entropy composite score for IMF component selection, whose core advantage is to solve the essential defects existing in the traditional single index through the multi-dimensional joint assessment and nonlinear coupling mechanism.
Where the fusion formula is as follows:
To address the issue of weight allocation in the composite score, the PCA weighting method was selected for parameter selection. The procedure is outlined below:
Construct the indicator matrix: PCA dimensionality reduction: Extract principal components and calculate the variance contribution rate for each original indicator. Weight allocation: Normalize the absolute values of the first principal component loadings to obtain weights.
Following PCA dimensionality reduction analysis, the resulting weight allocations are
The composite scores for each modal component are shown in Table 3.
Cliff values of each modal component of VMD.

VMD: variational modal decomposition; IMF: intrinsic mode function.
According to Table 3, the IMF components with the top three composite scores are selected as the subsequent inputs for the study data of feature extraction and fault diagnosis. In order to further find the stability study of CMSSE feature extraction, the rolling bearing data from Case Western Reserve University, USA, as mentioned above, is selected for entropy analysis verification. In order to further verify the superiority of the feature extraction performance based on CMSSE entropy algorithm, CMSSE feature extraction is performed on the motor bearing data under load condition, and the effect before and after feature extraction is plotted for comparison, and the results are shown in Figures 13 and 14.

Rolling bearing signal failure data.

Rolling bearing signal composite multiscale slope entropy (CMSSE) feature extraction data.
As can be seen from Figures 13 and 14, the data of each fault category are mixed together without obvious feature differentiation, which will inevitably affect the final classification effect if it is directly categorized, whereas after the CMSSE value calculation, the 10 states are effectively differentiated and distributed according to the fault categories. This indicates that the CMSSE method well extracts the feature information from the raw data and can comprehensively characterize the actual fault information of dynamic bearing bearings.
Troubleshooting and comparative verification
The selected feature vectors were employed for model performance prediction testing within the CNN–BiGRU–Attention framework. The input to the pattern recognition model comprised the feature vectors of normal-state signals combined with those of fault signals from different locations obtained through segment analysis. Each of the four fault types—bearing health status, inner ring fault, outer ring fault, and rolling element fault—provided 120 data sets, totaling 1200 data sets. Ten experimental runs were conducted simultaneously, with the classification accuracy of the model calculated as the average.
The CNN–BiGRU–Attention model employed here comprises an input layer, CNN layer, BiGRU layer, Attention layer, and output layer. This architecture consists of convolutional layers, BiGRU layers, and attention mechanism layers. Convolutional layers extract local features from hoist bearing vibration signals, enabling the model to effectively capture local correlations within the signal. The BiGRU layer leverages bidirectional properties to integrate global information within the time series, enabling dynamic data modeling. Combined with the attention mechanism, the model focuses on signal segments most critical for fault diagnosis, thereby comprehensively enhancing the accuracy of hoist bearing fault diagnosis. This integration endows the CNN–BiGRU–Attention model with superior feature learning capabilities and more precise fault identification when processing complex bearing data. Digital labels 1–10 denote distinct fault state types, as illustrated in Figure 15.

Classification prediction results of the combined model and ablation experiments.
As shown in Figure 15, the CNN–BiGRU–Attention model demonstrates heightened sensitivity to variations in actual data. With 270 fault instances and 30 normal states, it achieved 295 correct identifications, yielding an overall classification accuracy of 98.33%. It exhibits high accuracy for each individual state. The horizontal axis represents the predicted labels, while the vertical axis denotes the actual labels, encompassing both normal conditions and nine distinct fault states. The green regions along the diagonal represent the classification accuracy zones for each state category, with numerical values indicating the number of correctly identified category groups. The adjacent areas, indicated by orange data points, denote misclassified regions. Consequently, the proposed method can accurately distinguish bearings with varying degrees of damage.
As can be seen in Figure 15, the CNN–BiGRU–Attention model is more sensitive to the changes of the actual data, in which the number of faults is 270, the number of normal states is 30, and the number of correct identifications is 295, and the overall classification accuracy reaches 98.33%, with a high accuracy rate for each individual state. The horizontal coordinate of the figure is the predicted label and the vertical coordinate is the real label, which includes the normal condition state and nine different fault states. The green area on the diagonal represents the area of classification accuracy for each category of states, and the numbers represent the number of category groups that are recognized accurately. The regions on both sides are the regions of classification errors, which are shown by orange data. Thus, the method in this article can accurately identify different damage levels of bearings.
An ablation study was conducted on the CNN–BiGRU–Attention model, maintaining consistent hyperparameter settings (learning rate 0.01, training epochs 150) and data set partitioning to ensure comparability. This study progressively removed key modules (CNN, BiGRU, and Attention) to construct three comparative models: CNN–Attention (removing BiGRU), BiGRU–Attention (removing CNN), and CNN–BiGRU (removing Attention). Classification accuracy served as the performance metric. As shown in Figure 15, the test accuracy of the CNN–BiGRU, CNN–Attention, and BiGRU–Attention models achieved test set accuracies of 96.7%, 95.6%, and 96.3%, respectively. It is evident that the proposed CNN–BiGRU–Attention model outperforms the CNN–BiGRU, CNN–Attention, and BiGRU–Attention algorithms by 1.3%, 2.7%, and 2% in classification accuracy. This demonstrates that the CNN–BiGRU–Attention approach achieves superior classification performance in addressing fault classification and prediction. It highlights the irreplaceable role of CNNs in local feature extraction and validates the effectiveness of BiGRU in modeling temporal dependencies with enhanced capture capabilities. Visualization reveals that the Attention mechanism, through feature-weighted fusion, effectively enhances the model’s ability to distinguish multi-source fault features. The model achieves optimal fault diagnosis performance when the three modules work synergistically, validating the rationality of the architecture design proposed in this article.
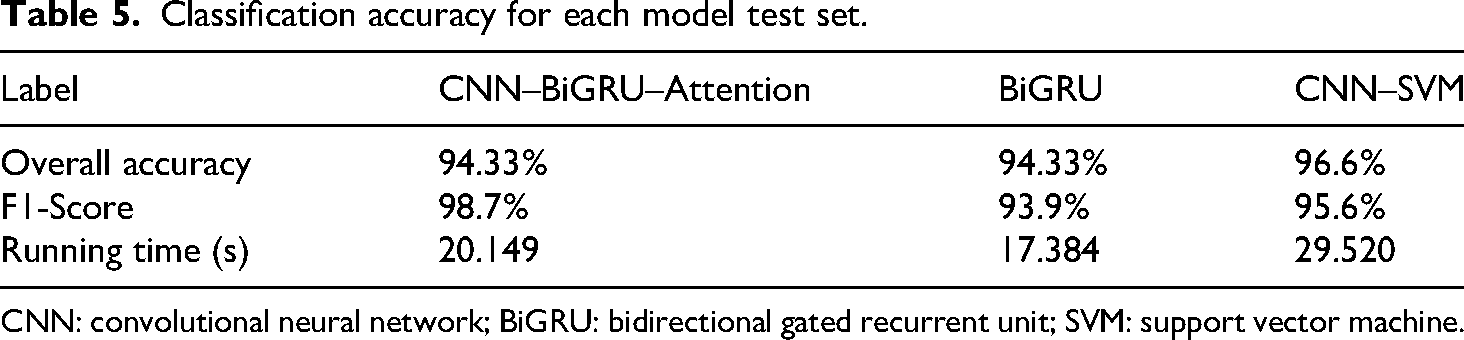
The diagnostic recognition performance of the optimized algorithm was compared with that of the BiGRU, CNN–BiGRU, and CNN–SVM models, which underwent the same data processing as described earlier. To more intuitively evaluate the methods’ performance, the classification accuracy rates of each model on the test set are shown in Table 4. It can be seen that while each method achieves high accuracy, they still exhibit certain gaps compared to the proposed model in identifying some specific states, failing to precisely recognize every category. Among them, the standalone BiGRU model demonstrates the poorest classification performance. This is attributed to its lack of CNN’s local feature extraction capability, leading to the loss of subtle fault characteristics. The CNN–BiGRU–Attention model achieved classification accuracies 4%, 0.58%, and 1.73% higher than the BiGRU, CNN–BiGRU, and CNN–SVM models, respectively, demonstrating exceptional predictive precision. This stable, accurate, and effective classification approach provides a reliable foundation for fault diagnosis classification in wind turbine bearings.
Classification accuracy for each model test set.

CNN: convolutional neural network; BiGRU: bidirectional gated recurrent unit; SVM: support vector machine.
Conduct experimental comparisons between prediction time and F1-score simultaneously.
On the one hand, prediction time demonstrates the model’s ability to reflect algorithmic responsiveness. On the other hand, the F1-score effectively addresses class imbalance by balancing precision and recall. This ensures the model’s sensitivity and reliability towards minority class faults, avoiding evaluation bias caused by reliance on a single metric. Consequently, it provides a more scientific basis for algorithm selection and optimization.
As shown in Table 5, the overall accuracy of the CNN–BiGRU–Attention model reached 98.33% in comparative experiments. When contrasted with the model proposed in this article, it can be observed that the overall accuracy of the combined diagnostic classification model outperforms both the BiGRU and CNN–SVM models. Table 5 demonstrates that when each algorithm was run 10 times, the BiGRU algorithm achieved a runtime of 17.384 seconds within the BiGRU and CNN–SVM models, while the CNN–SVM algorithm recorded a runtime of 29.520 seconds. Concurrently, among the three algorithms, the CNN–BiGRU–Attention model delivered superior prediction performance, attaining 98.33%. The proposed model in this article achieved a runtime of 20.149 seconds, which is comparable to the benchmark models. Consequently, it is concluded that the CNN–BiGRU–Attention algorithm demonstrates the most favorable overall performance among the algorithms examined.
Classification accuracy for each model test set.
CNN: convolutional neural network; BiGRU: bidirectional gated recurrent unit; SVM: support vector machine.
The original data without feature extraction by IGRIME-VMD and CMSSE algorithms, with a data volume of
Classification accuracy of each model test set on raw data.

SVM: support vector machine; BiGRU: bidirectional gated recurrent unit; CNN: convolutional neural network.
The above results fully demonstrate the necessity of using IGRIME-VMD data decomposition and CMSSE feature extraction, the superiority of the CNN–BiGRU–Attention model for classification and identification prediction, and the effectiveness of fault prediction of wind turbine gearbox bearings in real-world WTG problems.
This article employs the CWRU bearing data set for experimental illustration, with subsequent generalization capability testing to be conducted using the Southeast University gearbox bearing data set. Details regarding the CWRU bearing data set were outlined in the preceding section, with comparative experiments conducted using the Case Western Reserve University bearing data set as an exemplar. Within this experimental framework, the data set simulates five bearing operational states across two working conditions. It models and captures vibration data from various gear operational states under different conditions, including: fracture damage, healthy, tooth loss, root cracks, and gear surface wear. Table 7 details the experimental conditions for the Southeast University gearbox bearing signals. To validate its practicality and better compare diagnostic outcomes across different methods, a combination model with superior diagnostic performance was selected. A confusion matrix was plotted for diagnostic results when each fault category in the training set comprised 100 samples. The results are shown in Figure 16. The figure displays the classification prediction results of the CNN–BiGRU–Attention model.
Detailed experimental conditions for gearbox bearing signals at Southeast University.

As can be seen from Figure 16, the fault diagnosis method proposed in this article demonstrates excellent diagnostic performance during the preparatory work of feature extraction. Notably, the CNN–BiGRU–Attention approach still achieves a very high fault recognition rate when combined with the pre-extraction of CMSSE features. This indicates that the diagnostic prediction method employed is highly effective, capable of reliably safeguarding the model’s diagnostic performance.

Classification prediction results for gearbox bearing data models at Southeast University.
Conclusions
In this article, on the basis of previous research, in order to solve the problem that a single algorithm cannot accurately complete the fault classification prediction of wind turbine gearbox bearings, a combined modeling method based on the vibration signal data of wind turbines is proposed, which organically combines the IGRIME-VMD, CMSSE, and CNN–BiGRU–Attention, to achieve the classification of faults of the vibration signal data of rolling bearings. The following conclusions are mainly obtained:
Optimize the hyperparameters of the VMD signal data decomposition algorithm with the IGRIME optimization algorithm, and take the bearing data signal of Western Reserve University as an experimental sample, so as to complete the data decomposition operation using the VMD algorithm, which lays down an experimental foundation for data extraction of the subsequent data. This article briefly describes the basic working principle of CMSSE feature extraction algorithm, and also proposes a CMSSE mathematical model for the limitations of multiscale slope entropy on this basis. Taking Gaussian white noise as the test sample, performance test experiments are carried out so as to verify the advantages of CMSSE feature extraction, and bearing fault data signal feature extraction experiments are added to verify the advantages of this feature extraction algorithm. Thus, the effective extraction of bearing fault signal data is realized, which lays the foundation for subsequent fault diagnosis. This article introduces the CNN–BiGRU–Attention deep learning fault classification model. Through comparative validation with other classification models, it demonstrates the superiority of this approach, providing a novel method for fault diagnosis classification in wind turbine gearbox bearings. Through validation using multiple classification algorithms, the CNN–BiGRU–Attention model demonstrated classification accuracy improvements of 1.3%, 2.7%, and 2% over CNN–BiGRU, CNN–Attention, and BiGRU–Attention algorithms, respectively. This establishes a novel approach for fault classification and prediction in wind turbine gearbox bearings. By comparing the prediction results of the fault classification identification model in the original data and after data preprocessing, the accuracy of the prediction model after data preprocessing is obviously improved. This further demonstrates the necessity of data preprocessing when performing data prediction.
The next step of the work plan is to establish the data fusion of CMS vibration signals and SCADA time domain data in the wind turbine gearbox bearing fault diagnosis work, so as to mine the intrinsic connection of the wind power data as much as possible, thus improving the accuracy of fault diagnosis. Of course, with the continuous development of wind power technology and deep learning technology, the model can still be updated in the algorithm and hyper-parameter optimization to improve the model accuracy. Therefore, the optimization and improvement of the fault diagnosis classification model is also particularly necessary.
Footnotes
Author note
All claims expressed in this article are solely those of the authors and do not necessarily represent those of their affiliated organizations, or those of the publisher, the editors and the reviewers. Any product that may be evaluated in this article, or claim that may be made by its manufacturer, is not guaranteed or endorsed by the publisher.
Acknowledgments
The authors gratefully acknowledge the support they received from the National Natural Science Foundation of China (grant numbers 62363022, 61663021, 71763025, and 61861025); Natural Science Foundation of Gansu Province (grant number 23JRRA886); Gansu Provincial Department of Education: Industrial Support Plan Project (grant number 2023CYZC-35).
Ethical considerations
The present study was conducted in compliance with the principles of the Declaration of Helsinki. Access to the MIMIC-IV database was granted with the approval of the Institutional Review Boards of the Massachusetts Institute of Technology and Beth Israel Deaconess Medical Center. As the database is de-identified and publicly accessible, the need for Institutional Ethical Approval and indi vidual informed consent was waived.
Author contributions
MT: methodology, conceptualization, validation, resources, data curation, writing–review and editing, supervision, project administration, and funding acquisition. ZT: methodology, conceptualization, software, validation, investigation, writing–original draft, and writing–review and editing. CW: methodology, investigation, writing–review and editing, and visualization. HW: conceptualization, writing–review and editing, and visualization. KZ: formal analysis, writing–review and editing, and visualization. CR: investigation and writing–review and editing. DS: visualization.
Funding
The authors disclosed receipt of the following financial support for the research, authorship, and/or publication of this article: This research was funded by the National Natural Science Foundation of China (grant numbers 62363022, 61663021, 71763025, and 61861025); Natural Science Foundation of Gansu Province (grant number 23JRRA886); Gansu Provincial Department of Education: Industrial Support Plan Project (grant number 2023CYZC-35).
Declaration of conflicting interests
The authors declared no potential conflicts of interest for the research, authorship, and/or publication of this article.
dci
This article has not been published or presented elsewhere in part or in its entirety and is not under consideration by any other journal. We have read and understood your journal’s policies, and we believe that neither the article nor the study violates any of these.
Copyright statement
The authors declare that the research was conducted in the absence of any commercial or financial relationships that could be construed as a potential conflict of interest.