
Abstract
Laser welding plays a critical role in advanced manufacturing, particularly in battery pack assembly for electric vehicles, where weld quality directly impacts performance and safety. However, current inspection methods rely on manual visual, electrical, and physical checks, resulting in inconsistent outcomes and limited detection of latent defects undetectable by traditional techniques. This study proposed a two-stage deep learning-based quality inspection framework designed to remain effective even when defect data were scarce. In the first stage, a convolutional neural network-based autoencoder was trained exclusively on normal data and augmented with a novel loss function that captured distributional features. In the second stage, multi-class defect classification was performed using the encoder and bottleneck layers of the first stage as a shared backbone, enabling robust performance in data-constrained environments. Data augmentation techniques were further applied to improve the generalization capability. A high-quality dataset collected from an actual industrial setting was used to validate the proposed approach. Experimental results showed that the proposed two-stage framework achieved 100% accuracy and an F1-score of 1.0 in defect detection and classification, outperforming the conventional rule-based system (99.31% accuracy and 0.995 F1-score) and demonstrating perfect consistency across all test samples. The proposed framework offers a scalable and intelligent solution for automated inspection in industrial laser welding applications.
Introduction
Laser welding is a high-energy processing technology that can join metals precisely and quickly using high-power laser beams and plays a key role in various advanced manufacturing fields such as the automotive, aerospace, and semiconductor industries.1–3 With the rapid increase in demand for electric vehicles and energy storage devices, laser welding is gaining attention as an important process in battery pack manufacturing.4–6 Welded areas that handle electrical connections between battery cells directly affect the electrical performance and safety of products, and even minor defects can lead to serious problems such as increased electrical resistance, local overheating, and fires.7–9 Therefore, precise inspection and a thorough quality control of the welding quality are becoming increasingly important. Modern manufacturing systems require integrated optimization of both process parameters and quality inspection. 10 However, most laser welding processes rely on manual work and visual inspection by skilled workers for quality inspection that causes problems such as reduced consistency in inspection results, increased inspection time and costs, and the possibility of missing minor defects.11–13 This acts as a limitation in ensuring quality in modern manufacturing environments that mass-produce high-reliability products such as batteries.
To solve this problem, various attempts have been made to automate the quality inspection. Existing automated quality inspection systems rely primarily on standardized rule-based methods or supervised learning techniques that require large amounts of labeled defect data.14–16 However, these approaches require high costs for system construction and data collection and have a limited ability to generalize to various defect types and changing manufacturing conditions.17,18 Moreover, in actual industrial sites, defect data are often insufficient, and severe data imbalances hinder building reliable learning models.19,20 These limitations significantly hinder the practicality and scalability of quality inspections using plasma signals in laser welding.
This study proposed a two-stage quality inspection model that simultaneously solved the problems of insufficient defect data and the difficulty in classifying different defect types. The proposed model comprised two main stages, each of which had a different purpose and function. The first stage was designed as an unsupervised learning structure using a convolutional neural network (CNN)-based autoencoder that could be trained using only normal data.21–23 In this process, a new loss function was developed that reflected the distribution characteristics of normal data in addition to a simple reconstruction error, thereby improving the accuracy of defective weld detection. This effectively reduced the labeling costs while enabling a precise distinction between normal and defective welds, even in environments where obtaining defect data was difficult. The second stage used the data detected as defective from the first stage as input and performed a detailed defect classification by defect type. At this time, the encoder and bottleneck structures learned in the first stage were reused as the backbone for the second stage, achieving high classification performance even in limited defect data environments.
The main contributions of this study are as follows.
We proposed a CNN-based autoencoder defective weld detection structure that could be trained with only normal data, along with a new loss function that reflected the distribution information of normal data, thereby improving the defective weld detection performance. We secured robust defect classification performance even in environments with insufficient defect data by reusing the encoder and bottleneck structures learned in Stage 1 as the backbone for Stage 2. We compared and analyzed various data augmentation techniques to identify the most effective method for the second-stage defect classification model, thereby improving the diversity of the training data and the generalization ability of the model. We built a high-quality dataset based on plasma signals collected from actual laser welding processes and presented a quality inspection framework applicable to welding sites that relied on existing methods, simultaneously improving inspection efficiency and reliability.
Background and dataset construction
Conventional weld quality inspection
Existing approaches for inspecting weld defects in battery packs can be broadly classified into three types: electrical, physical, and visual inspections. Electrical inspection is performed by monitoring various parameters of the battery pack during repeated charge–discharge cycles, including but not limited to the time-dependent voltage, current, state of charge, state of health, and charge/discharge duration. In addition, the internal battery monitoring system measures the voltage and temperature distributions of individual cells to evaluate the electrical connection status and detect potential weld or contact defects. 24 This method is essential for measuring battery performance. However, even in situations where the connection is not stable owing to weld defects, the performance may be judged as normal through physical contact alone; therefore, defects may not be detected. This can lead to weld detachment or intermittent contact failures when products are shipped or during actual vehicle operations, resulting in a decrease in the reliability of weld quality inspection. To compensate for these limitations, physical inspection is used that generally applies a tensile load to welded specimens or uses extremely thin metal wires to physically check the connection status between the materials.25,26 This method can most directly identify weld defects; however, although the inspection of each weld surface requires only a few seconds, the total inspection time becomes relatively long for battery packs consisting of dozens of welded cells. In addition, the mechanical contact or tensile loading during the inspection process may cause partial weld detachment or a reduction in the mechanical strength of the weld area.
Vision-based inspection is a method that detects defects in a non-contact manner by analyzing the appearance of weld areas using cameras and has the advantages of shortened inspection time and non-destructive diagnosis.27–29 However, because this is limited to surface-based analysis, the detection performance may be limited for defects hidden at the bottom of or inside the surface. 30 Although several studies have been conducted to automate the existing inspection methods, they often rely on the judgment of skilled workers in the field, creating limitations in ensuring inspection reliability and efficiency.
Recent machine learning and deep learning approaches have been proposed to automate weld inspection. Supervised learning methods14–16 achieve high accuracy when sufficient labeled data are available but struggle with the extreme class imbalance typical in manufacturing environments. Deep learning approaches include CNN-based visual inspection,29,31,32 LSTM/RNN-based temporal analysis,33,34 and autoencoder-based anomaly detection.21–23 However, CNNs require large labeled datasets for each defect type, RNNs face gradient issues with long sequences, and existing autoencoders lack mechanisms for stable threshold setting due to inconsistent reconstruction errors. Transfer learning methods32,35,36 reduce data requirements but remain computationally intensive. Our two-stage approach fundamentally differs by combining unsupervised learning (Stage 1) with minimal supervised learning (Stage 2) through efficient feature reuse. The variance-regularized (VR) loss in Stage 1 ensures stable anomaly detection without requiring defect samples, while Stage 2 achieves robust classification by reusing Stage 1's learned representations.
Dataset construction
In this study, experimental data were collected using the equipment configuration shown in Figure 1 to build an inspection dataset for weld quality analysis. Figure 1(a) shows a welding system that integrates a fiber laser with a center wavelength of 1030 nm and a plasma sensor. Data collection was performed at a laser travel speed of 100 mm/s and a weld length of 30 mm. Figure 1(b) shows the precise fixation of two metal specimens using a custom fixture installed at the bottom of the laser welder. The specimens were configured to replicate the actual lead tab joining structure of battery cells, in which the tab and collector are joined in an overlapping form. Specifically, a nickel-plated Cu plate (0.3 mm thick) was used as the top tab material, and an unplated Cu plate (0.3 mm thick) was used as the bottom collector material. The overlap length and a perpendicular welding direction relative to the overlap were also matched to the actual manufacturing conditions to reproduce the mechanical characteristics of real weld joints. The welding conditions were set with optimal parameters derived through preliminary experiments and were applied consistently in all the experiments in this study. In typical manufacturing environments, laser welding defects occur at extremely low frequencies; hence, limitations exist in securing sufficient defect data. Therefore, this study built an experimental environment similar to the actual battery pack manufacturing conditions and collected data by artificially setting major defect causes to increase the defect occurrence rate. Although the defects were intentionally induced, they were generated based on realistic causes—such as equipment aging and external process variations—under the guidance of welding and manufacturing experts. This approach enabled the acquisition of a sufficient number of defective samples while maintaining the representativeness of actual weld defects.

Integrated laser welding system used for data acquisition. (a) Laser welding system with head, stages, fixture, and plasma sensor. (b) Arrangement of two metal plates fixed in place by a custom fixture under the laser welding machine.
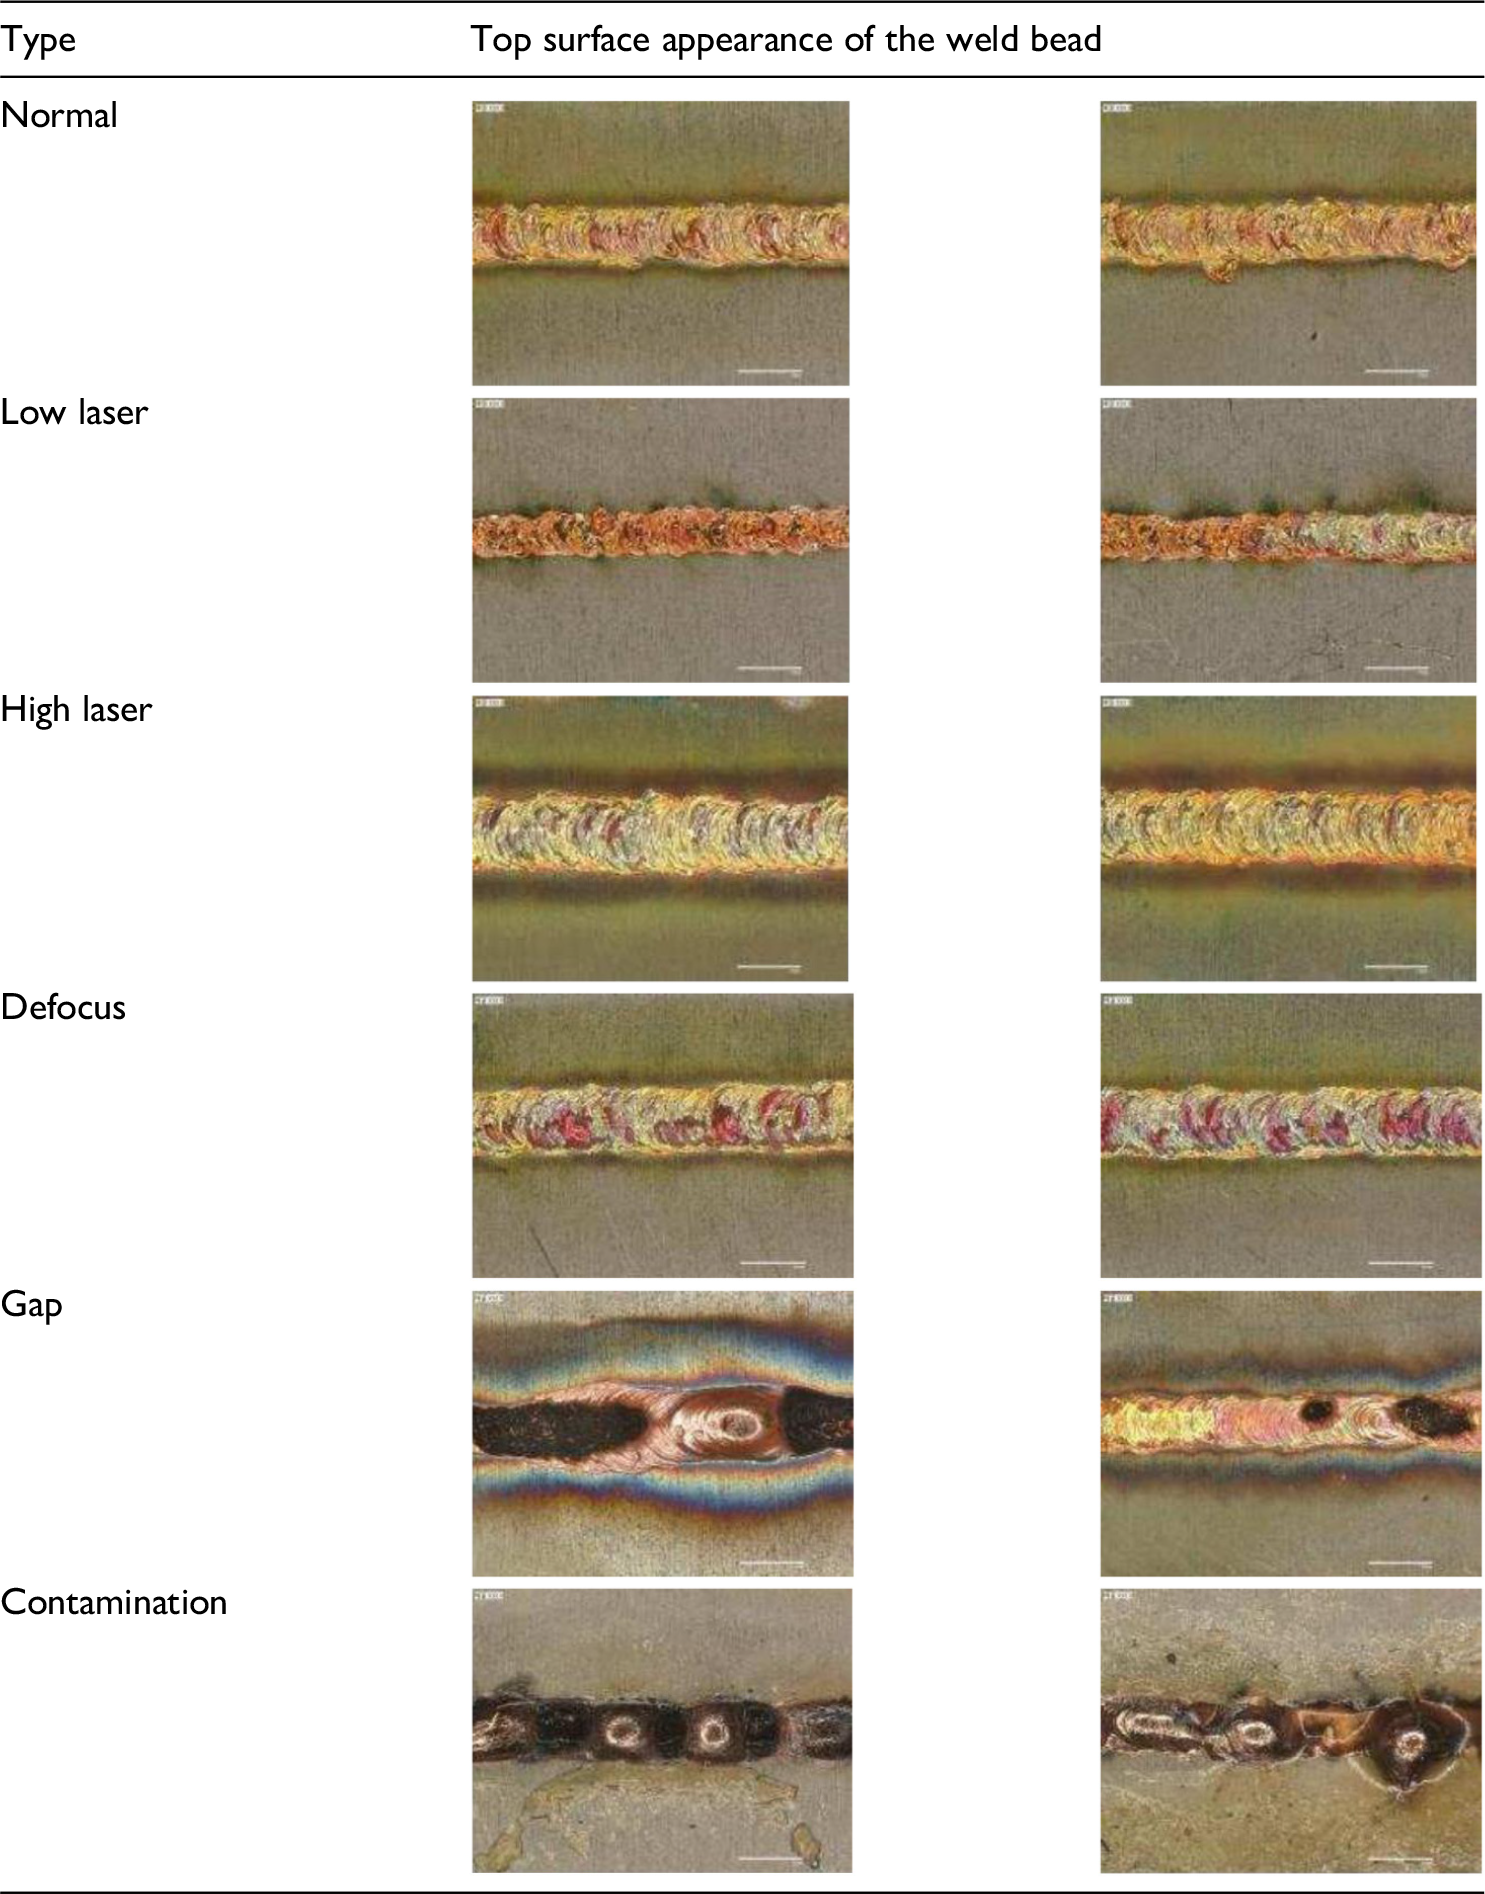
Previous studies have mainly classified defects by type such as weld cracks, porosity, and incomplete fusion according to the welding defect results.31,32 In contrast, this study conducted a type classification based on the causes of defects, reflecting the demands of actual manufacturing sites. The collected data consisted of normal conditions and the following five defect conditions: low laser, high laser, defocus, gap, and contamination. Low laser, high laser, and defocus correspond to internal factors that frequently occur owing to equipment aging or lack of maintenance in repetitive welding processes. Gap and contamination are defect factors owing to external environmental changes. These conditions are defined as follows:
Normal condition: Welding performed at the optimal laser power of 2000 W derived through preliminary experiments Low laser: Welding performed at 1500 W that is lower than the reference power High laser: Welding performed at 2500 W that is higher than the reference power Defocus: Welding performed with 2000 W power while moving the laser focus by approximately 3 mm Gap: Welding performed with 2000 W power after inserting a 300-μm thin metal plate between two materials to create a gap Contamination: Welding performed with 2000 W power after contaminating the metal surface by applying welding flux commonly used in manufacturing environments.
Table 1 presents the images of the joint surfaces captured using an optical microscope. Each image visually shows that the welding results appear differently according to the set defect factors, and the differences in joining characteristics according to the defect types can be confirmed.
Comparison of welding results by defect type.
Autonomous weld quality inspection
Overall system architecture
The structure proposed in this study consisted of two stages, as shown in Figure 2, and each stage performed a different task. This two-stage structure had the following major advantages. The first stage can be trained using only normal data, which eliminates the need for manually labeling defective samples that are costly and difficult to collect in real manufacturing processes, thereby significantly reducing labeling costs. The second stage involved a detailed classification by defect type, enabling specific quality control measures at actual manufacturing sites.
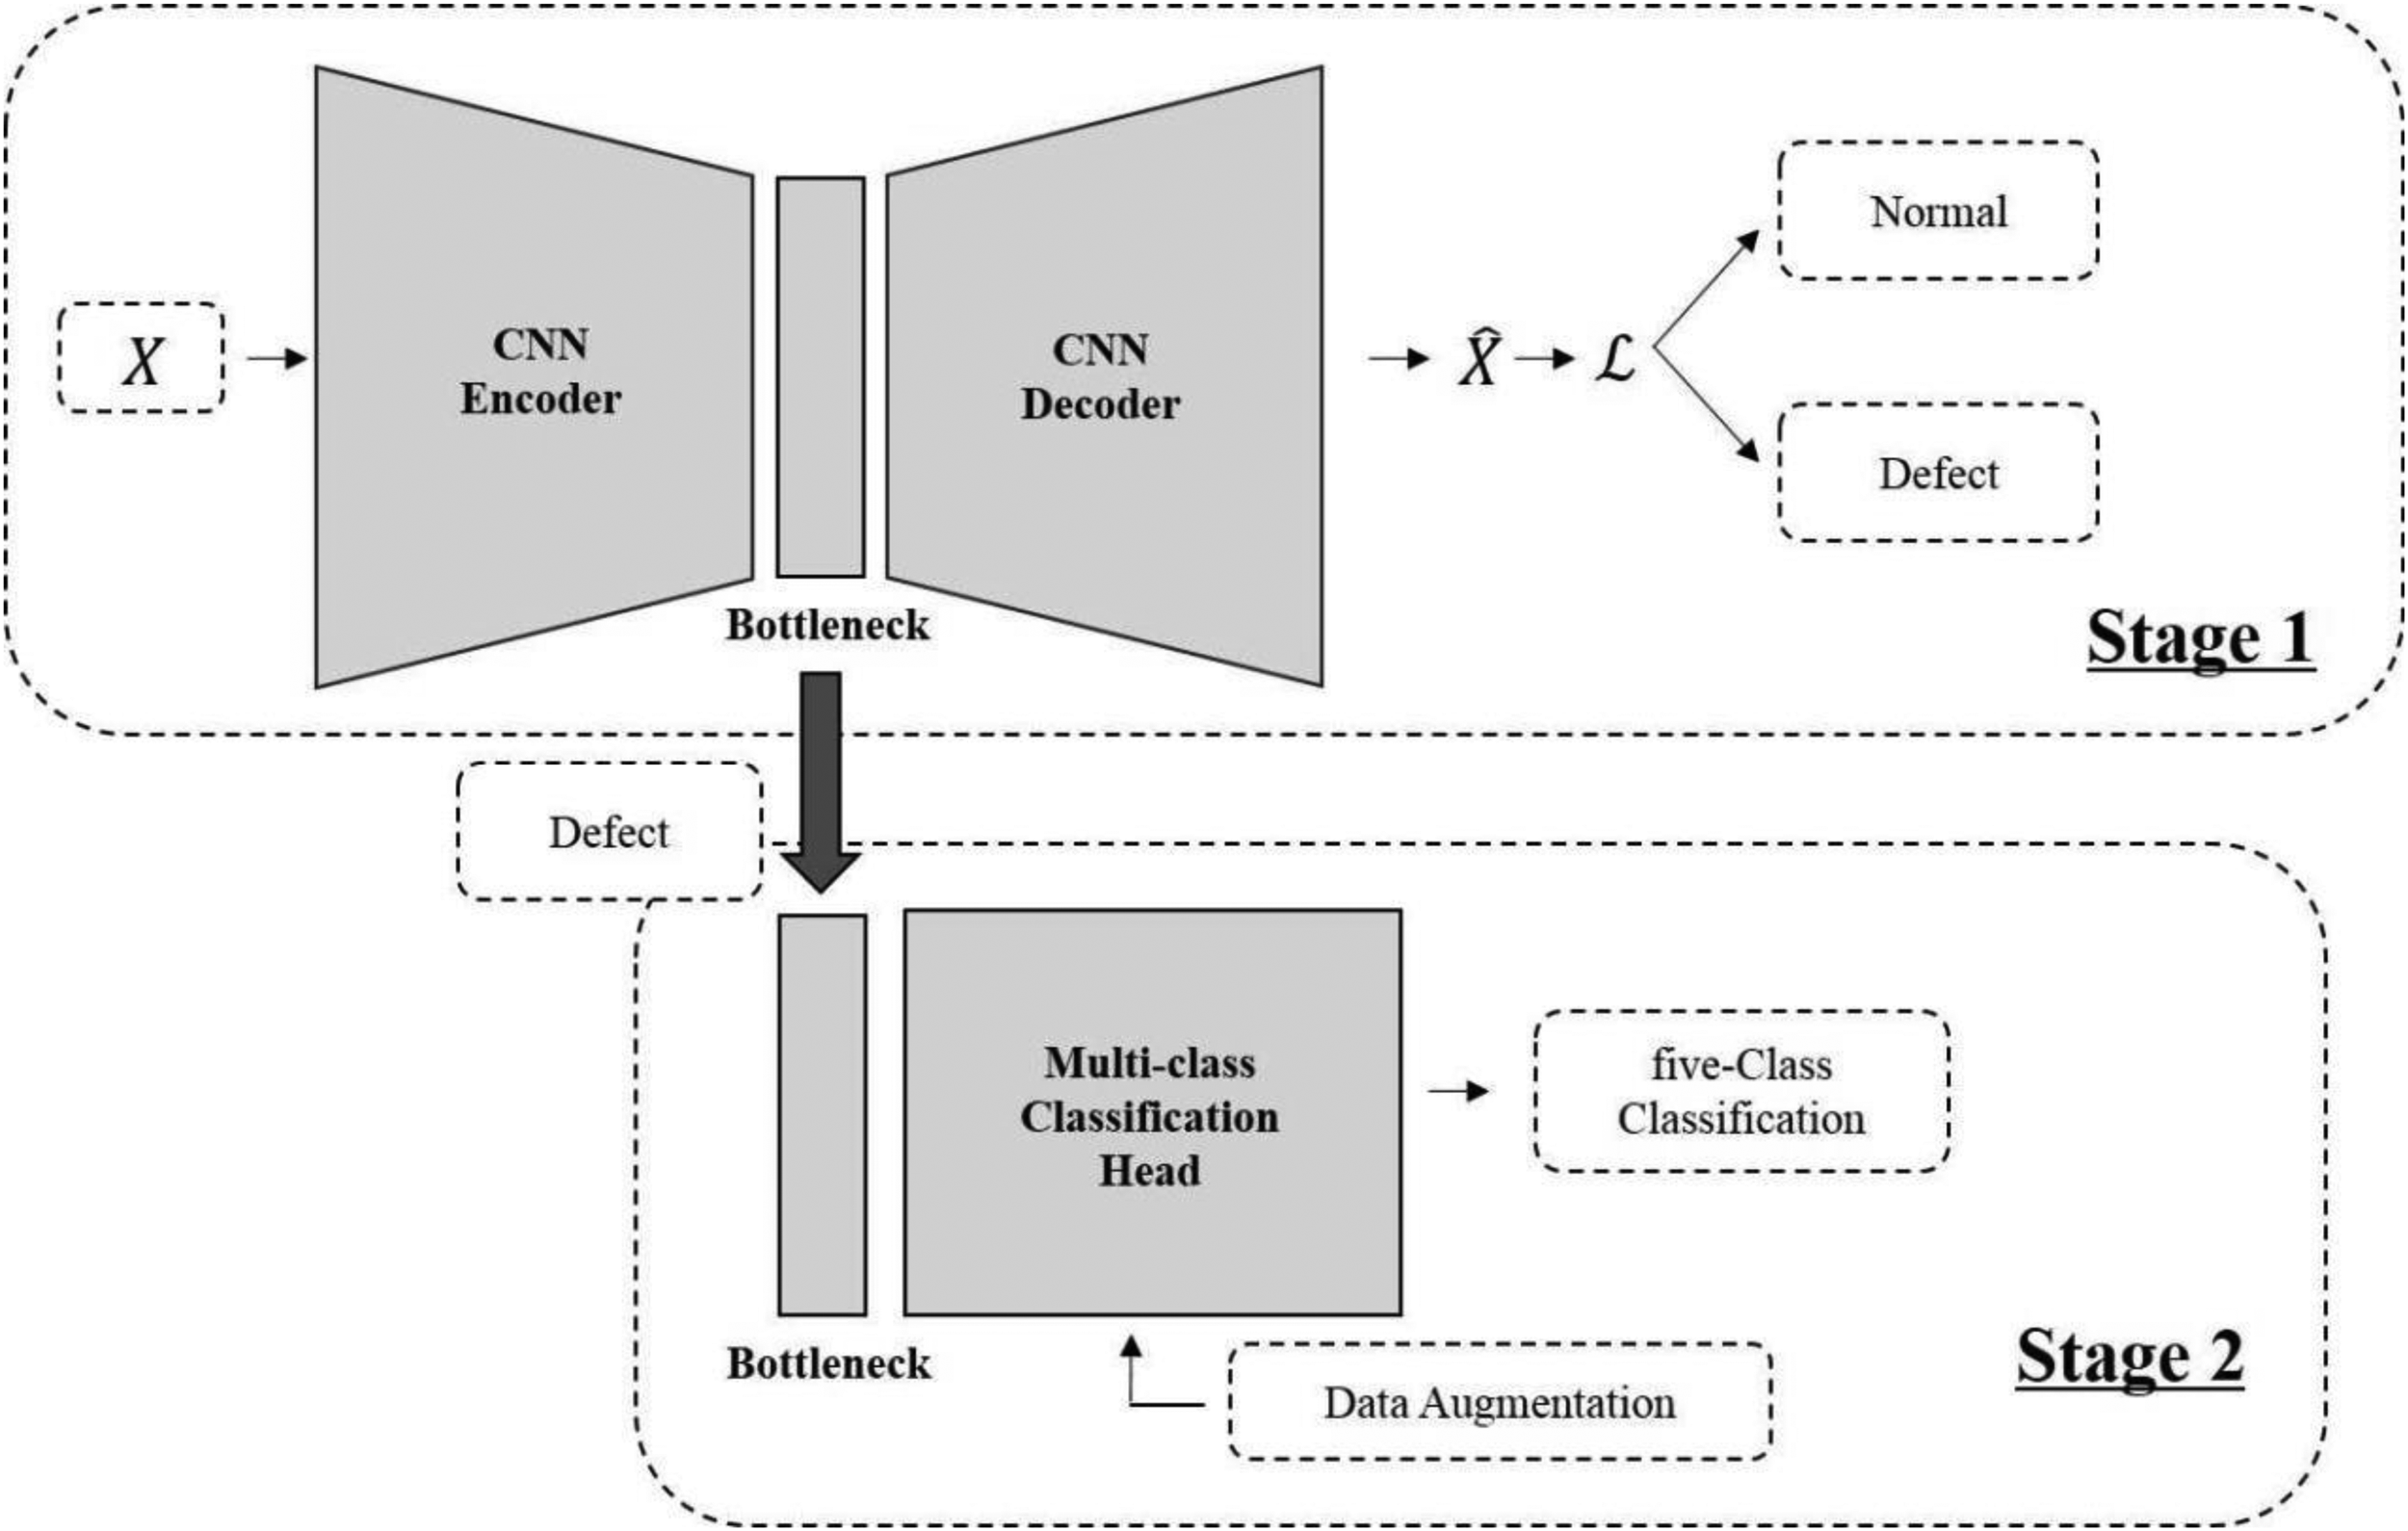
System architecture.
The first stage was designed with an autoencoder structure consisting of an encoder, bottleneck, and decoder and applied a CNN-based model to effectively process time-series data. The autoencoder was trained using only normal data and was designed to effectively distinguish between normal and defective welds, even in environments where collecting defect data was difficult. The second stage used the data classified as defective from the first stage as input and performed a detailed defect type classification. At this time, it effectively used the already learned feature representations by reusing the encoder and bottleneck structures learned in the first stage as a backbone. In particular, the encoder of the first stage learned the general characteristics of the laser welding process through normal data; thus, by using this information in the second stage, high-level classification performance could be achieved even with limited defect data. The multiclass classification model of the second stage learned various defect types that could occur during the laser welding process, and the input defect data were classified using a performance-verified multiclass classifier head. Additionally, the model was designed to achieve a high classification performance even in situations with limited training samples, by applying data augmentation techniques.
Stage 1: Binary classification
The first stage of the proposed framework classified normal and defective welds by learning only the normal data. For this purpose, a one-dimensional CNN-based autoencoder model that could process time-series data and output reconstruction errors was used. We selected 1D CNN over RNN and Transformer architectures because it efficiently captures local temporal patterns with stable training on limited data and manageable computational cost for our 22,501-point sequences. The structure of the model used in this study is presented in Table 2.
Autoencoder model architecture.
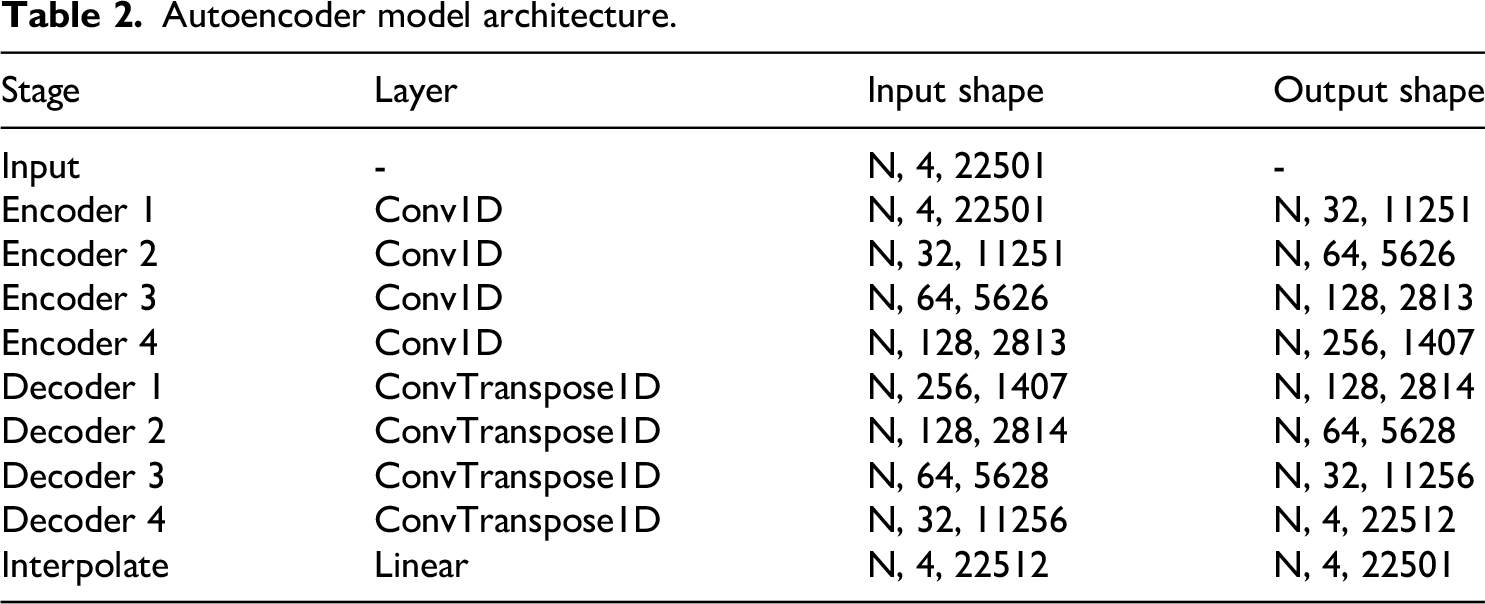
The autoencoder used in the experiment was trained as follows. First, when normal data were input into the model, the encoder increased the number of channels and decreased the sequence length while compressing the important features of the data into the bottleneck. The decoder upsampled the compressed bottleneck data to restore them to their original size. Finally, linear interpolation was used to adjust the output size to be the same as that of the input data. The reconstruction loss was calculated by comparing the input data with the restored data, and the model was trained to accurately restore the input data. The trained autoencoder exhibited a low reconstruction error when normal data were input, and during defective weld detection, a reconstruction error above a set threshold was classified as defective.
The defective weld detection performance of the autoencoder was determined by the accuracy of the model in restoring the input data. Because the autoencoder learns a compact latent representation that captures the intrinsic distribution of normal data, it reconstructs normal samples with minimal error. However, defective samples that lie outside this learned distribution cannot be accurately reconstructed, leading to higher reconstruction errors. This discrepancy between the normal and defective reconstruction errors improves the separability of the two classes, resulting in enhanced classification performance. The lower the reconstruction error for normal data, the greater was the difference in the reconstruction error with defective data, leading to improved classification performance. This study proposed a VR loss that minimized the variance of the reconstruction error to improve the generalization performance of the defective weld detection model. The VR loss was designed to individually calculate the reconstruction error of each data sample during training and then minimize the variance of errors within the batch. When the variance of the reconstruction error for normal data was large, the threshold setting became difficult, and the defective weld detection performance deteriorated. Therefore, a more stable defective weld detection was possible by maintaining the consistency of the reconstruction error within the batch. Unlike L1/L2 regularization that prevents overfitting through weight constraints or Kullback-Leibler divergence that shapes latent distributions in variational autoencoders, VR loss directly minimizes reconstruction error variance. This ensures normal samples consistently produce similar low errors, enabling clear separation from defects and reliable threshold-based detection. The final loss was calculated using the weighted sum of the VR and mean square error (MSE) losses. First, the MSE loss was calculated, as shown in equation (1), from the difference between the original data input to the model and the reconstructed output data.
Here, N represents the batch size, C represents the number of channels, L represents the sequence length, x represents the original data, and 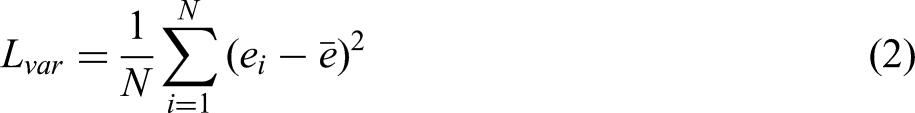
Here, 

The MSE and VR losses were weighted and summed, as shown in equation (5), to be used as the final loss.
Here,
Stage 2: Defect type classification
The second stage of the proposed framework used the data classified as defective from the first stage as input and classified the defect types. The model in this stage consisted of a backbone encoder that extracted features and a classifier head that performed multiclass classification. The backbone used the encoder of the autoencoder learned in the first stage as it is and was used as a pretrained feature extractor. In particular, the encoder pretrained with plasma signal data effectively contained the general characteristics of the corresponding domain, enabling its use in subsequent stages for efficient fine-tuning. This transfer learning strategy induced fast convergence and enabled robust feature learning while preventing overfitting, even with limited defect data. In the second stage, when defective data were input into the model, the encoder extracted high-dimensional features and the classifier head discriminated the detailed defect types in a multiclass classification manner based on these features. In this study, the most effective structure was selected through comparative experiments of CNN, multilayer perceptron (MLP), transformer, and support vector classifier (SVC) as multiclass classification heads. The specific structures of the CNN, MLP, and Transformer heads used in the experiments are presented in Tables 3 to 5, respectively.
CNN head.

MLP head.

Transformer head.
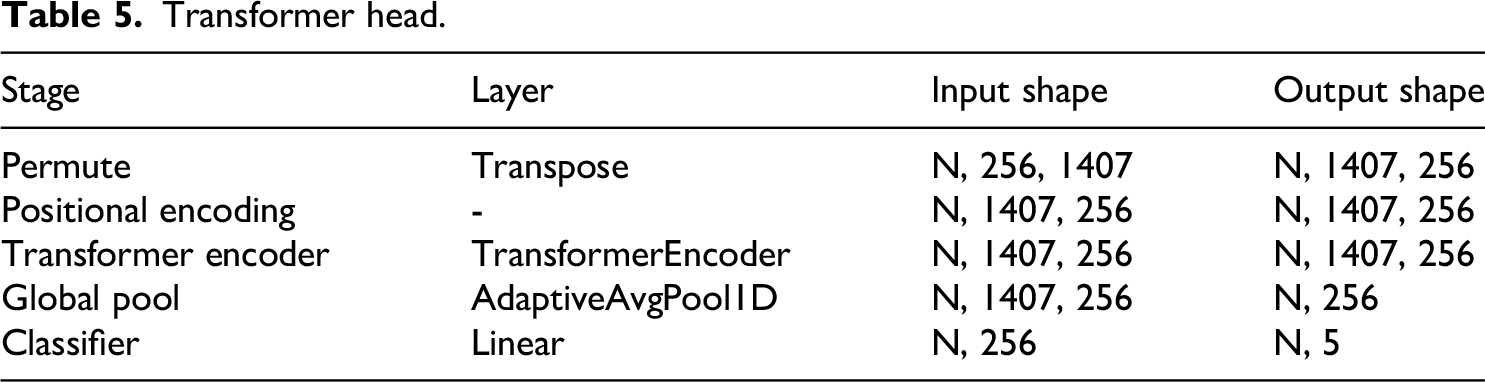
A CNN head effectively captures local patterns using spatial locality and reduces the dimensions through global pooling. An MLP head directly uses global information by flattening the entire feature map. However, a risk of overfitting may occur because of the large number of parameters. A Transformer head leverages self-attention mechanisms to capture long-range dependencies but requires substantial data and computational resources for effective training. An SVC head is a traditional machine learning technique that uses nonlinear kernels and exhibits stable performance even in limited data environments.
Because defective samples in the plasma signal dataset were extremely few in number compared with normal samples and difficult to collect, an approach that could achieve a high classification performance with minimal training data was required. Therefore, this study trained the model by applying various data augmentation techniques and comparatively analyzed the effectiveness of each technique. To ensure that the proposed model performs reliably even under real manufacturing constraints, the generalization capability was evaluated in data-scarce scenarios and tested against varying noise levels and defect distributions, demonstrating its robustness in practical factory environments. Five augmentation techniques were used and compared. The core principles and main effects of each technique are summarized in Table 6.
Augmentation methods.

Experimental results
Experimental objectives and overview
The experiments in this study aim to validate the effectiveness of the proposed two-stage deep learning-based autonomous weld quality inspection system in battery pack manufacturing processes. First, we experimentally validated the effectiveness of the proposed two-stage classification system by demonstrating its superior defect detection and classification performance compared with conventional rule-based methods. This system consisted of a first stage that performed autoencoder-based defective weld detection using only normal data and a second stage that performed multiclass classification by defect type. In this study, we evaluated whether this system could effectively inspect the weld quality. In particular, we verified whether the VR loss proposed in the first stage improved the consistency of the reconstruction error and defective weld detection performance compared with the conventional MSE loss. In the second stage, we comparatively analyzed the performances of various classifier heads such as CNN, MLP, Transformer, and SVC. Additionally, we analyzed the performance changes according to the training data ratios to evaluate the model performance in limited data environments. Finally, we verified the effectiveness of the data augmentation techniques under realistic constraints where the defect data were insufficient, and derived the most effective method by comparing the five augmentation techniques.
The experiments in this study were conducted in an environment with an Intel Core i9 CPU, NVIDIA GeForce RTX 3090 GPU, a 64 GB RAM, and Windows 11 operating system. The dataset used in the experiments consisted of plasma signal data collected from the laser welding processes comprising 46 normal samples and 100 defective samples. The defective data were divided into five classes: low laser, high laser, defocus, gap, and contamination, with each class containing 20 samples. Data on the plasma signals were recorded for 0.45 s at a sampling frequency of 50 kHz, resulting in 22,501 data points per sample.
Defective weld detection performance
The conventional method uses a classification model provided by the Precitec LWM 4.0 plasma sensor manufacturer. This system monitors laser welding processes in real time and automatically detects weld quality defects through optical sensor-based analysis. This system monitors the laser welding process in real time by analyzing optical emission signals, reflected light intensity, and plasma plume characteristics acquired from the integrated optical sensor. The monitored parameters include plasma brightness, fluctuation amplitude, and temporal stability, which are directly related to weld penetration and joint quality. The system can automatically detect defects such as insufficient penetration, excessive power input, defocus, gap formation, and surface contamination through these signal variations. It is an industrial system that records defects to provide traceability and production stability. The results of classifying the normal and defective data using the conventional method are presented in Table 7.
Performance of the existing defective weld detection method.

In this study, unlike conventional methods, we applied a defective weld detection approach using the reconstruction error of an autoencoder. In laser welding processes, most data are collected normally. Whereas normal data are naturally obtained owing to the characteristics of industrial systems, collecting defective data requires significant additional cost and time. The reconstruction error-based defective weld detection method can be trained using only normal data, thereby effectively alleviating the data imbalance problem between normal and defective data. In the first stage of the proposed framework, normal and defective data were classified using this approach; the results are presented in Table 8.
Performance of the proposed defective weld detection method.

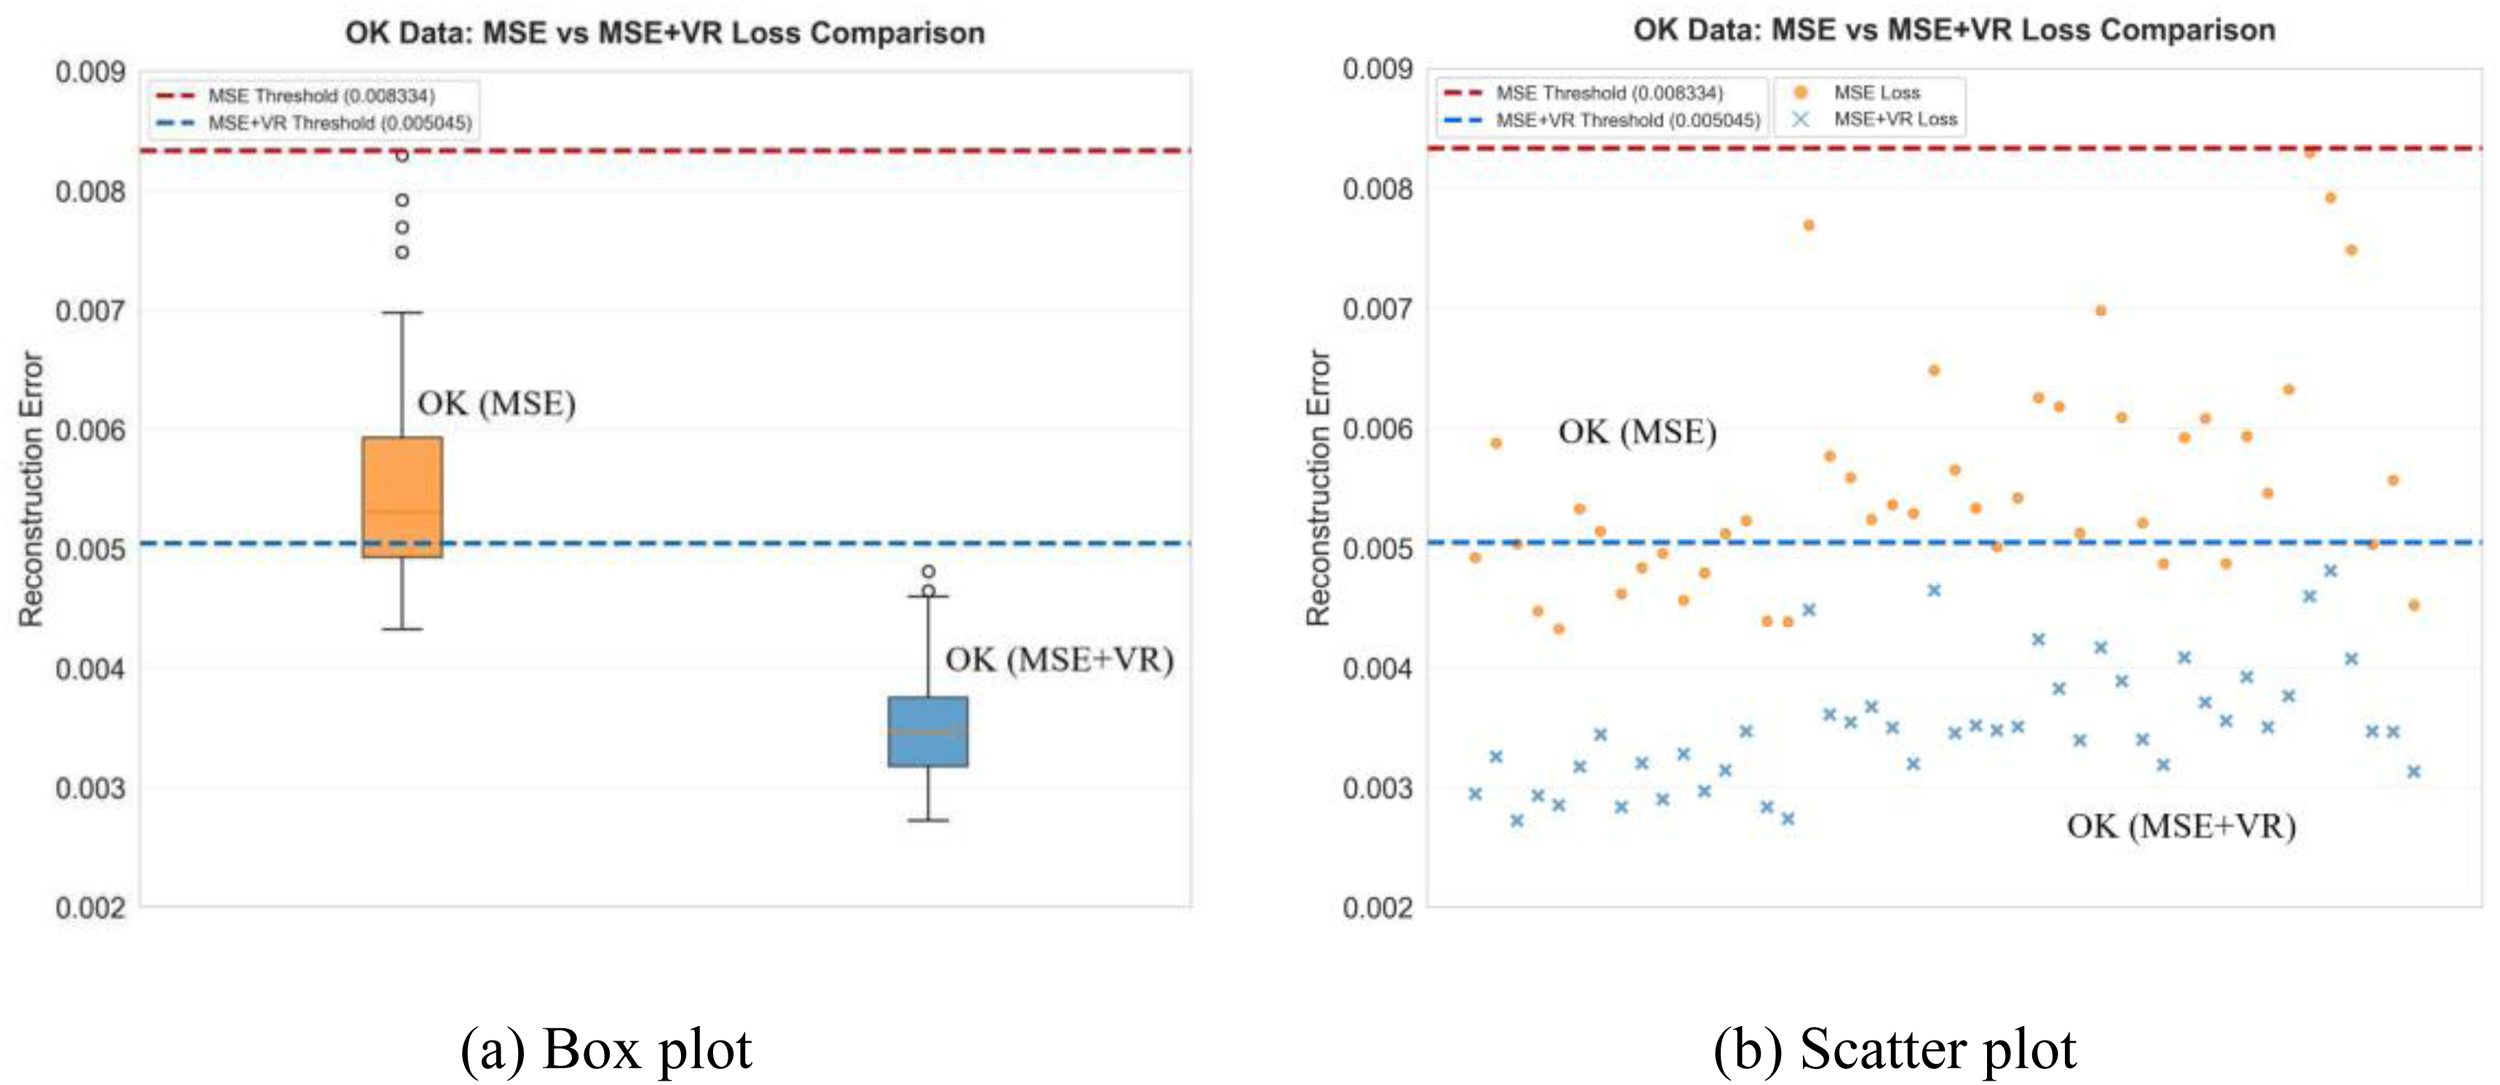
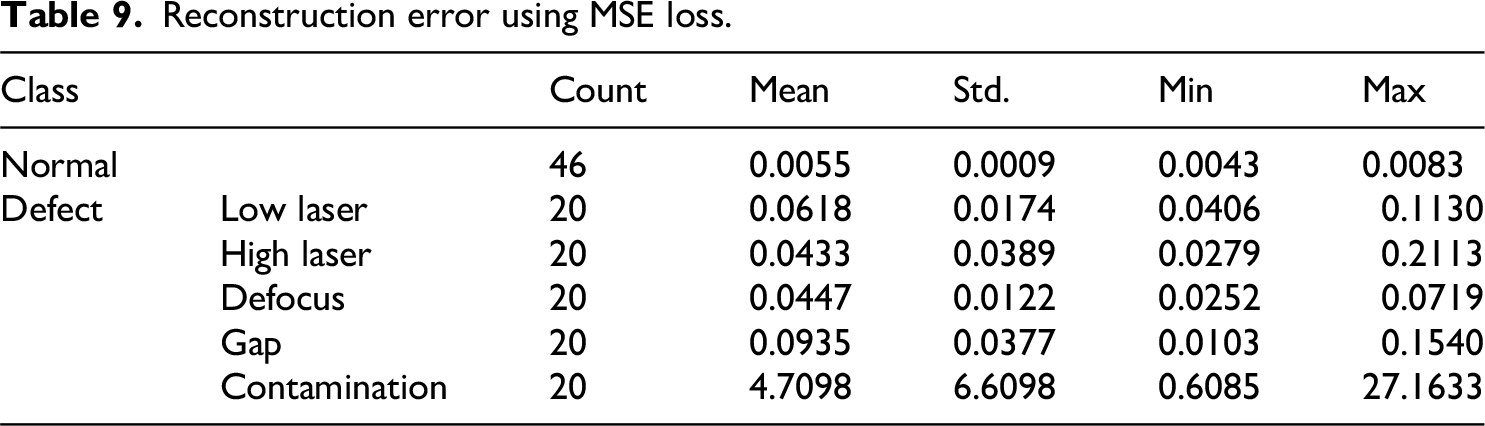
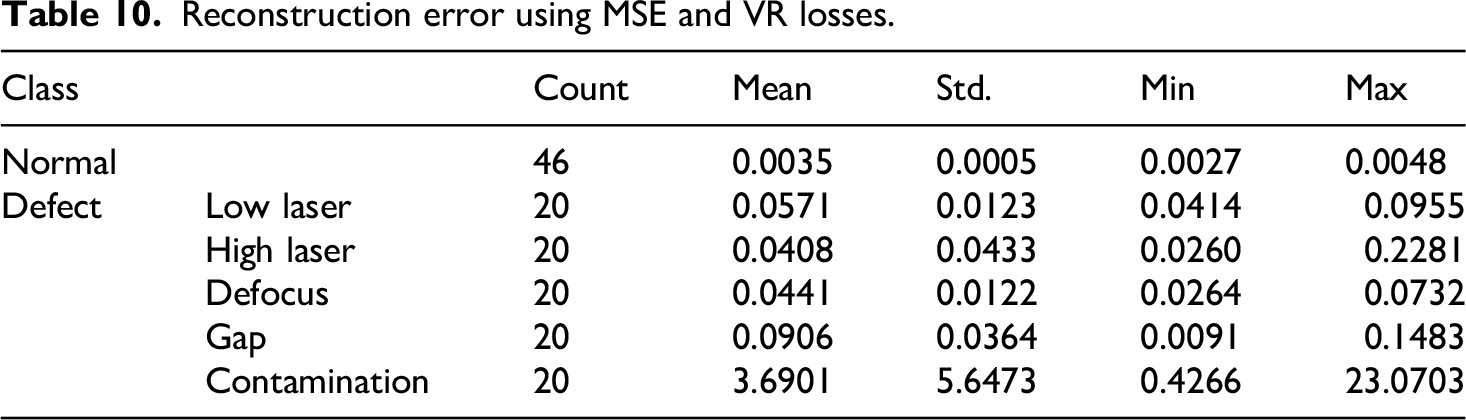
The proposed autoencoder-based defective weld detection method successfully classified all data. Additionally, the results of training using only the MSE loss and those of training combining the MSE and VR losses were visualized in the form of box plots and scatter plots, as shown in Figures 3 and 4, respectively. The proposed method shows a lower reconstruction error for normal data compared to using the MSE loss alone and can train the model to process all data uniformly without bias toward specific data, simultaneously improving the overall stability and reliability (Figure 5). Tables 9 and 10 present the results of comparing the statistics of the reconstruction error by class for the MSE loss-only and MSE + VR loss models. By applying two loss functions for defective weld detection of the plasma signal data generated during the laser welding processes, consistent distinguishable patterns by class were observed in both models. Normal samples showed the lowest average reconstruction error values in both cases, whereas contamination defects showed significantly higher values of 4.7098 and 3.6901, respectively, compared with the other defect types. This indicated that flux-related defects had the greatest impact on the plasma signal patterns in laser welding. Other defect types showed average reconstruction errors in the range of 0.04–0.1. The model with the proposed VR loss exhibited performance improvements in several aspects. The standard deviation of the reconstruction error for the normal samples decreased by 44.4%, from 0.0009 to 0.0005, improving the reconstruction consistency and supporting the learning stability of the model for normal patterns. Additionally, the minimum and maximum error values for the normal samples decreased by 37.2% and 42.2%, respectively, and the error variation range also decreased by 47.5% from 0.0040 to 0.0021, indicating a tendency for the reconstruction errors of the normal samples to concentrate in a narrower range. This improvement in the error distribution concentration enabled a more stable threshold setting for defective weld detection and could lead to an improved system reliability in actual manufacturing environments.

Box plot of reconstruction errors.

Scatter plot of reconstruction errors.
Reconstruction error comparison of normal samples.
Reconstruction error using MSE loss.
Reconstruction error using MSE and VR losses.
To determine the optimal loss weights, we conducted experiments on normal samples while keeping ωₘₛₑ fixed at 1.0. Since accurate reconstruction is fundamental to anomaly detection, we maintained the MSE weight constant and systematically varied ω var from 0.0 to 1.0. As shown in Table 11, the configuration ω var = 0.5 achieved the best performance across all metrics, with the lowest mean (0.0035), standard deviation (0.0005), minimum (0.0027), and maximum (0.0048). This represents the optimal operating point where variance regularization effectively reduces error variance without interfering with reconstruction quality. Notably, weights above 0.5 cause both mean and standard deviation to increase simultaneously, indicating that excessive regularization degrades reconstruction capability.
Reconstruction error statistics with varying VR loss weights.

Defect type classification performance
The defect data detected in the first stage were used in the second stage for defect type classification. The experiments applied CNN-, MLP-, Transformer-, and SVC-based models using the encoder learned in the first stage as a backbone. Baseline models without encoder backbones (MLP and Transformer) were also evaluated for comparison. The classification performance results obtained using 25% and 5% of the total defective data for training and the remainder for testing, respectively, are presented in Table 12.
Defect classification performance.

Table 12 presents the performances of the defect classification models according to the different training data ratios. In this study, “Encoder” indicated that the encoder from the first stage was used as a backbone, and each model consisted of the corresponding backbone and head networks (CNN, MLP, Transformer, SVC) for multi-class classification. “Baseline (MLP)” and “Baseline (Transformer)” used models without a backbone network. The effectiveness of the CNN encoder backbone is clearly demonstrated through Transformer-based model comparisons. The standalone Transformer baseline achieved 78.67% accuracy with 25% training data, while Encoder + Transformer reached 93.33%. This performance gap confirms that CNN-based feature extraction outperforms Transformer-based feature extraction for our time-series plasma signals. Furthermore, the CNN encoder captures defect-relevant patterns more effectively than the Transformer can learn independently. In the experiments using 25% of the total data as the training data, the CNN and MLP models with encoder backbones accurately classified all the test data. The Transformer and SVC models showed lower performance than the CNN and MLP models equipped with the Encoder but still outperformed the baseline models without encoder backbones. These results confirm the effectiveness and excellent generalization performance of the CNN encoder backbone across different classifier architectures for plasma signal classification in laser welding.
Considering the realistic constraints of defective data collection in laser welding datasets, we aimed to accurately classify as many defects as possible using a small amount of training data. When using only 5% of the total data as the training data, the “Encoder + CNN” model recorded a 45.26% accuracy and 35.36% F1-score owing to feature learning limitations from limited training data. The “Encoder + MLP” model showed a performance of 38.95% and 27.49%, respectively. In contrast, the SVC model that showed a relatively low performance in the 25% training data environment, achieved an effective performance with a 64.21% Accuracy and 58.88% F1-score under limited data conditions. As a result of a comprehensive analysis of performance changes according to the training data ratios, the “Encoder + CNN” model was evaluated as the best in terms of overall performance stability according to data availability. In particular, it achieved perfect classification performance in environments with sufficient training data. Although the absolute performance was low in limited data environments, it showed a relatively superior performance compared with other models. Table 13 presents the results of using 5% of defective data for the “Encoder + CNN” model training.
Confusion matrix for training with 5% of the data.

When using only 5% of the total defective data for training, classes with clearly distinguishable characteristics such as high laser and contamination were accurately classified. However, the low laser, defocus, and gap classes were typically incorrectly classified. To solve these problems, this study compared and analyzed various data augmentation techniques to present effective methods for improving the classification performance. First, various augmentation techniques were applied to 5% of the defective data, and clustering analysis using t-distributed stochastic neighbor embedding was performed based on the augmented data. Table 14 presents the Silhouette score and adjusted Rand index (ARI) according to each augmentation technique.
Clustering evaluation of augmentation techniques.

The Silhouette score and ARI are metrics for evaluating the clustering quality of data. In this study, they were used to compare the separability of clusters using the augmentation techniques. Silhouette score is a metric that comprehensively evaluates intra-cluster cohesion and inter-cluster separation, with values between −1 and 1, where closer to 1 indicates higher clustering quality. ARI is a metric that quantitatively measures the agreement between actual labels and clustering results, with values between 0 and 1, where closer to 1 indicates that the cluster structure better reflects the actual class distribution. As presented in Table 14, time warping exhibited the best performance among various data augmentation techniques. This technique recorded a Silhouette score of 0.9651 and an ARI score of 1.0000, demonstrating an excellent class separation performance. This suggested that time warping effectively preserved the unique temporal patterns of each defect class while improving the data diversity through temporal axis transformation. However, the noise injection technique recorded a Silhouette score of −0.0980 that hindered the cluster quality. This showed that random noise could blur the boundaries between classes, causing degradation in the classification performance.
The “Encoder + CNN” model was trained using the data generated by augmenting 5% of defective data, and the performance was evaluated with the remaining 95% data. Table 15 presents the accuracy and F1-score for each augmentation technique. For classification performance comparison, the “Encoder + CNN” model, as presented in Table 12 that provides the training result before augmentation, was set as the baseline.
Classification performance with data augmented using various techniques.

The models trained based on the augmented data showed an overall performance improvement compared with the baseline. In particular, when the time warping technique was applied, both the accuracy and F1-score achieved 100%. This was consistent with the previous clustering analysis results, suggesting that the time warping technique was extremely effective in preserving interclass characteristics. Additionally, the magnitude warping and frequency domain techniques recorded accuracies of 94.74% and 95.79%, respectively, confirming that various augmentation techniques contributed to improving the plasma signal defect classification performance in laser welding.
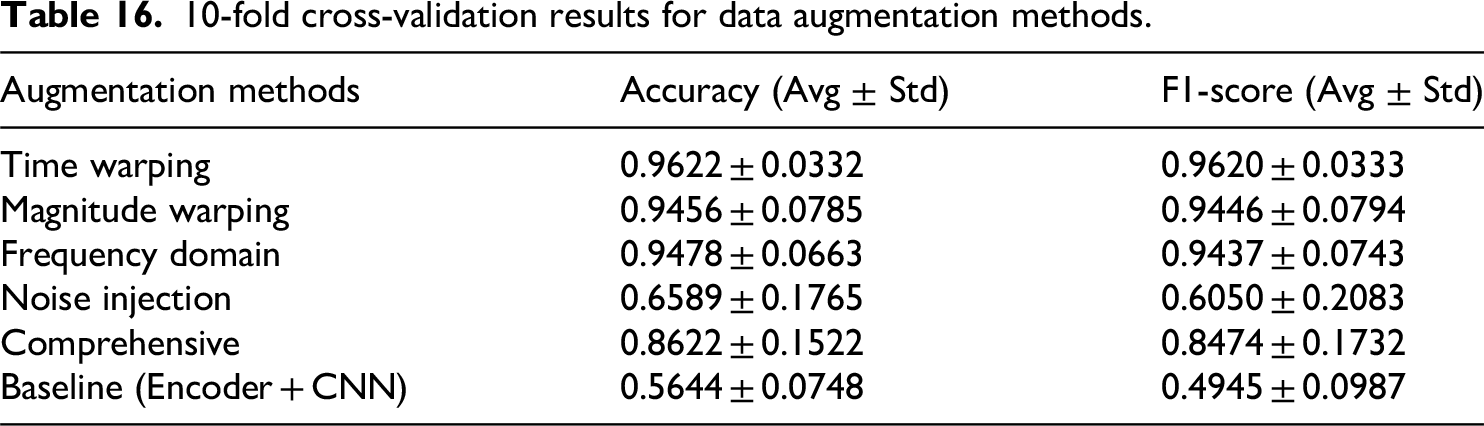
To validate the robustness of our results, we performed 10-fold cross-validation on the augmentation methods using 5% defect data. As shown in Table 16, time warping achieved the highest accuracy (96.22 ± 3.32%) with low variance, confirming stable performance across different data splits. Magnitude warping (94.56 ± 7.85%) and frequency domain (94.78 ± 6.63%) also demonstrated consistent improvements over the baseline (56.44 ± 7.48%). The low standard deviations indicate that these augmentation techniques provide robust performance that generalizes well, mitigating overfitting concerns in limited data scenarios.
10-fold cross-validation results for data augmentation methods.
Conclusions
This study proposed a two-stage deep learning-based model for laser welding quality inspection, a core process in battery pack manufacturing. The proposed model comprised an unsupervised defective weld detection structure based on an autoencoder that could be trained with only normal data and a multiclass classifier that classified the detected defective data by defect type. We improved the defective weld detection performance by introducing a new loss function that reflected the distribution characteristics of normal data and achieved a high classification accuracy even in limited defective data environments by reusing the encoder and bottleneck structures learned in Stage 1 as the backbone for the Stage 2 classifier. Additionally, we secured diverse training data and effectively enhanced the generalization performance of the model by comparing and analyzing various data augmentation techniques to derive the optimal method and applying it to classifier training.
In this study, high-quality data for plasma signal quality inspection in laser welding processes were directly collected and constructed from actual manufacturing sites, and models were trained and validated based on these data. Through this, we presented a quality inspection framework applicable to actual industrial sites and experimentally demonstrated that the inspection efficiency and reliability could be simultaneously improved compared with existing inspection methods.
The proposed model showed high accuracy and consistent performance compared with existing rule-based methods, and its applicability to real-time quality management systems was confirmed. This study demonstrates the effectiveness of AI-based defect detection and classification systems in manufacturing sites and is expected to contribute to the development of smart quality inspection systems in various industrial fields in the future. In addition, the model maintained stable performance even under fluctuating plasma signals and environmental noise, demonstrating robustness against material variability and variations in welding conditions commonly encountered in industrial environments. Its lightweight computational structure further enables real-time deployment without additional hardware modification, indicating strong potential for practical implementation in smart manufacturing systems.
Although the proposed model achieved excellent performance, it was trained and validated using a relatively limited dataset. Future studies will aim to expand the dataset to include more diverse welding conditions and defect categories. Furthermore, the integration of multimodal sensor data such as optical, acoustic, and thermal signals will be explored to further enhance generalization and reliability. Implementing real-time adaptive learning algorithms will also be considered to enable continuous self-improvement of inspection performance in dynamic production environments.
Footnotes
Ethics statement
This study did not involve human participants or animals. All experimental procedures were performed on industrial process data collected from a manufacturing system. Therefore, ethical approval was not required.
Author contributions
All authors contribute to the conceptualization of the study and the preparation of the manuscript. Seungmin Lee is responsible for statistical analysis and research design. Wooyoung Chung is responsible for the design of the welding process and funding acquisition. Beomseong Kim and Heesung Lee are responsible for data acquisition, research design, analysis and interpretation of data, and funding acquisition.
Funding
The authors disclosed receipt of the following financial support for the research, authorship, and/or publication of this article: This work was supported by the Technology Innovation Program (RS-2024–00507851, Development and Implementation of an AI-Based Autonomous Manufacturing System for Flexible Production of Hybrid Electric Vehicle Batteries) funded by the Ministry of Trade Industry & Energy (MOTIE, Korea).
Declaration of conflicting interests
The authors declared no potential conflicts of interest with respect to the research, authorship, and/or publication of this article.
Data availability
The data that support the findings of this study are available from the corresponding author upon reasonable request. The raw plasma signal data contain proprietary information from the industrial partner and cannot be publicly shared due to confidentiality agreements.