
Abstract
There are several factors that influence the mechanisms underlying human injuries in vehicle-to-pedestrian crashes (VTPCs). Traditional multibody system (MBS) models can simulate the entire VTPC process; however, they cannot fully and accurately assess the degree of injury to each part of the head. Therefore, a finite element (FE) model of the head with a complete brain structure is developed based on the 50th-percentile Chinese male data. First, the complete kinematic response of pedestrians in a VTPC is simulated using the MBS model, and the head kinematic response parameters that are most related to pedestrian injury are explored. An FE of the head model is subsequently established based on computed tomography (CT) and magnetic resonance imaging (MRI) data from a 50th-percentile Chinese male. Head-injury-related parameters are input into the head FE model, and orthogonal experiments are designed to analyze the head-to-windshield impact. The results show that impact velocity, position, and angle strongly affect the biological injury parameters of the head. These findings reveal the mechanisms of head injuries in pedestrians in VTPCs and the biomechanical dynamic response characteristics of the main parts of the head.
Introduction
The number of pedestrian injuries and fatalities resulting from road crashes is quite high worldwide. In China, vehicle-to-pedestrian crashes (VTPCs) have recently become the main cause of pedestrian injuries. 1 In the USA, over 8000 pedestrian fatalities and an estimated 140,000 nonfatal crash-related emergency department visits were recorded in 2022. 2 Head injuries are the most common type of injury in VTPCs. Traumatic brain injury is one of the main causes of disability and mortality worldwide. 3 Therefore, to reduce the degree of injury to pedestrians in traffic accidents, the mechanisms of head injuries in VTPCs have been intensively investigated by automobile and research institutes.
Typically, in accidents involving adult pedestrians, the front bumper of the vehicle impacts the pedestrian's lower limbs, leading to pedestrian rotation. 4 Subsequently, the pedestrian's head comes in contact with the windshield or hood. The driving speed, vehicle type, pedestrian angle, pedestrian gait speed, and pedestrian direction influence the head-to-vehicle impact angle and impact area, thereby affecting the kinematic response of the pedestrian's head. 5 Owing to the complex interactions among these factors, further research is required to understand the relationship between vehicle–pedestrian dynamics and head kinematics.
Owing to the challenges of conducting crash tests with real human subjects, accident data mining and bionic dummies have been widely used to examine the main factors that influence pedestrian injuries. Accident data mining approaches, including statistical regression, machine learning, and deep learning methods, have become popular tools for predicting vehicle dynamics, accident rates, and injury risks. 6 However, these methods cannot be used to accurately locate head injuries. Bionic dummies, which are widely used in crash tests, provide insights into the biomechanical responses of the human body. However, these methods are expensive and have limitations in representing the medical outcomes of crashes.
With the development of computer simulation technology, the multibody system (MBS) model simulation has become the most popular modeling tool for pedestrian collisions and injury assessments in recent years. Most pedestrian models in collision simulation software are MBS models, which represent human body parts in a simplified manner and connect them to different types of hinges. MBS models enable the simulation of the mechanical responses in each part of the human body across multiple virtual vehicle-to-pedestrian crashes (VTPC) tests for different rotation angles, vehicle types, driving speeds, and pedestrian gait speeds. 7
Although the MBS models in simulation software are convenient for conducting general injury analyses, they have several limitations. First, the models typically represent the head as a single unit. However, the head is composed of multiple tissues with complex structural and mechanical characteristics and different materials, and there are large differences between the collision responses of the intracranial parts. Second, the current MBS crash test dummy models are generally designed based on body data from Europeans and Americans; therefore, they have limitations in terms of the prediction of injuries in other regions of the world. 8 Third, many MBS models provide only acceleration-related outputs, such as the head's synthetic acceleration and the head injury criterion (HIC). Therefore, they cannot accurately represent certain medical criteria for the degree of head injuries. 9 Consequently, it is beneficial to construct a human head model and evaluate the collision response of each part of the head.
The finite element (FE) model of the head features a highly detailed structure that allows for the representation of all brain tissues and the simulation of cerebrospinal fluid dynamics in the brain. 10 It also facilitates the calculation of mechanical interactions between brain tissues after a collision. Accordingly, injury assessments derived from FE models can provide a more precise representation of actual head injuries than the MBS models. Currently, injury assessment parameters in the literature include the maximum strain in the brain tissue, intracranial pressure distribution, strain, and stress parameters. 11
On the other hand, the area where the head makes impact with the vehicle body significantly affects the degree of injury. Common impact areas include hoods, windshields, and A-pillars. Previous studies identified vehicle hoods as the most frequent impact region for pedestrian head collisions. 12 Consequently, the European Enhanced Vehicle Safety Committee Working Group 17 (EEVC WG 17) test procedures mainly evaluate pedestrian head safety during hood collisions. As modern vehicles feature shorter and steeper bonnets, head impact locations have shifted from hoods to windshields. 12 Therefore, the test points for the risk of head injury should be concentrated on or around the impact point of the windshields. Although some studies have focused on the kinematic response of the head after windshield collisions, their primary focus has been on improving the design and properties of windshields, rather than offering sufficient insights into head injury mechanisms. 13 Moreover, their results cannot be directly used to accurately evaluate the degree of brain tissue injury for medical purposes.
The objective of this study is to examine the effects of various collision parameters on each head injury level using real data from a 50th-percentile Chinese male. There are three specific contributions of this work.
First, by investigating the entire process starting from a vehicle-to-pedestrian collision to head-windshield contact to the biomechanical response of the head, we examined pedestrians’ brain tissue-level injury based on a race-specified head model. Some studies have focused on the brain tissue-level injury of pedestrians in VTPCs without considering the head characteristics of different races. 14 However, using popular commercially available FE models, such as the Total Human Model for Safety (THUMS), to study traffic safety problems in China is not always appropriate because there are differences in the brain-tissue responses across different regions of the world.15,16
Secondly, we consider deeper and finer indicators of brain injury. In the field of traffic injury, the abbreviated injury scale (AIS) is commonly used to score injury severity and describe the types of injuries. However, the AIS cannot reflect the actual differences between injuries with the same score but different severities, and cannot differentiate between a single injury and multiple injuries in the same area.14,17 Hence, in this study, more specific indicators of brain tissue injury (i.e. intracranial pressure and von Mises stress) are adopted to reflect the severity of the injury in different parts of the brain.
Third, we examined the relationship between accident parameters (impact velocity, impact position, and angle) and brain injury. Although some studies have also explored the effect of vehicle parameters (such as windshield inclination angle) on head injuries, these vehicle parameters are fixed for a given vehicle model. 4 However, there are many accident parameters in VTPC accidents, and the changes in these parameters are highly random. In this study, we selectively investigated accident parameters (including driving speed, pedestrian direction, pedestrian gait speed, and pedestrian collision position) that can be measured using corresponding sensors such as laser radar, millimeter radar, and cameras. 18 Consequently, the relationship developed in this study can be used for brain injury prediction, which is the core module in Advanced Automatic Crash Notification systems in intelligent vehicles.
The remainder of this paper is organized as follows. Section 2 outlines the technical framework and describes the work performed. The results on the relationships between the collision and biomechanical parameters of head injuries are presented in Section 3. Section 4 discusses the injury mechanism associated with the kinematic response of a pedestrian's head in a VTPC. Section 5 presents the limitations of this study. Finally, Section 6 summarizes the conclusions and discusses possible future work.
Methods
The technical framework of this study is illustrated in Figure 1. First, the MBS model was used to reconstruct the VTPC scenarios. As a result, kinematic response parameters of the head, such as the head-impact-windshield (HIW) velocity, impact position, and impact angle, during VTPCs were obtained. These parameters were input into the head-windshield FE collision model. Subsequently, a bionic head FE model with high biological characteristics based on real human head data was established and verified. The FE models of the head and windshield were subsequently combined to form an HIW simulation model. As mentioned above, the kinematics response parameters of the head were set as the initial conditions for the simulation of head–windshield collisions. The biological response parameters of head injuries, including intracranial pressure and stress distribution in the head, were calculated. Finally, the relationships between collision conditions and head injuries were determined.

Technical framework of the study.
Relationship between driving speed and HIW velocity
PC-Crash (Dr Steffan Datentechnik, Linz, Austria) was used to reproduce the VTPC scenarios. The parameters of the MBS model, that is, of the dummy, in the PC-Crash model were set according to the human body model of a 50th-percentile Chinese male. The height of the dummy was set to 169.7 cm, and its mass was set to 66 kg. The other parameters of the dummy model are listed in Table 1. 19 The resulting VTPC model is shown in Figure 2.
VTPC model in PC-Crash.
Parameters of dummy model in PC-Crash.

During VTPC, the initial contact typically occurs between the pedestrian's lower legs and the vehicle's front bumper, followed by thigh contact with the hood edge. As the lower limbs accelerate forward, the upper body rotates relative to that of the vehicle. The pelvis and chest then strike the hood edge and top, respectively, while the head may impact either the hood or windshield. The driving speed (vs) significantly affects the location of the impact of the head on the vehicle.
When vs is greater than 40 km/h, the probability of a pedestrian's head colliding with the windshield reaches 97%. When vs is between 40 and 60 km/h, the injury caused owing to the pedestrian's head hitting the windshield can be fatal. 20 Most VTPCs occur at medium to low speeds, that is, approximately 20–60 km/h. Figure 3 shows a typical vehicle collision model. When vs is 20 km/h, the head collides with the hood instead of the windshield. When vs is 35 km/h, the head collides with the windshield. In this work, we studied head-to-windshield collisions; therefore, vs was selected to be in the range of 35–55 km/h.

Head impact position at different vs.
By conducting simulations at different values of vs, we can obtain the corresponding HIW velocity (vh), as shown in Figure 4. The results indicate that the relationship between vh and vs is linear. The ratio of vh to vs is approximately 0.8. This result is consistent with those reported by Li et al. 21 This ratio is used in subsequent studies to describe the relationship between vh and vs.

Relationship between vh and vs.
Distribution of head impact points of the VTPC
Several factors, including the direction of movement of the pedestrian and type of vehicle, substantially affect the kinematic response of the pedestrian's head. 22 This study aims to explore the mechanisms of the dynamic response of the head and determine the kinematic response parameters of the head for FE analysis of collisions. We selected vs, the pedestrian direction (θp), pedestrian gait speed (vp), and pedestrian collision position (dp) as the MBS simulation parameters. The entire VTPC process was simulated by inputting these parameters into the PC-Crash model. Five values of vs, in the range of 35–55 km/h, were selected. As shown in Figure 5, θp was set to 0°, 90°, 180° and 270°, in accordance with Euro NCAP regulations. The pedestrian speed in the PC crash can be set to simulate the gait motion. In this study, vp takes the values of 4, 5, and 6 km/h, corresponding to the usual pace of a healthy person. The roads were considered to be dry and of asphalt/concrete. The collision parameter settings are shown in Table 2.23,24

VTPC simulation under different collision angles.
Collision parameters.
Note: s: friction coefficient between human and vehicle; fvel−ground: friction coefficient between vehicle and road; fped−ground: friction coefficient between pedestrian and road.
Figure 6 shows the kinematic responses of the pedestrians in collisions in different directions at vs = 35 km/h. As shown in Figure 6, the side impacts at 0° and 180° primarily involve the lateral bending of the upper body around the pelvis, whereas the frontal impact at 90° and the rear impact at 270° correspond to flexion and extension movements, respectively. In side collisions, the legs come in contact with the vehicle first, followed by rotational motion of the body. However, owing to arm swing, the lateral bending motion of the head around the neck differs, resulting in different impact locations. Finally, for the 0° and 180° side impacts, the head strikes the windshield on the right and left temporal bones, respectively. In the 90° frontal collision, after the legs contact the bumper, the chest and abdomen make contact the hood. This is followed by the head bending around the neck, leading to a collision between the frontal bone and the windshield.

Pedestrian kinematics during the simulation test at vs of 35 km/h, with different θp.
Similarly, we conducted simulations with different values of vs, vp, and dp. When conducting the simulation experiments, we changed only one parameter and kept all other parameters fixed. Five simulations were conducted for each condition. Thus, 55 trials were conducted. The distribution of human head impact points in these trials is shown in Figure 7. Figure 7(a) demonstrates the results of 25 trials where vs ∈ {35 km/h, 40 km/h, 45 km/h, 50 km/h, 55 km/h} and θp is 0°, and dp is center collision and vp is 5 km/h. Figure 7(b) demonstrates the results of 15 trials where vs is 45 km/h and θp is 0°, and dp is center collision and vp ∈{4 km/h, 5 km/h, 6 km/h}. Figure 7(c) demonstrates the results of 15 trials where vs is 45 km/h and θp is 0° and dp ∈{left collision, right collision, center collision} and vp is 5 km/h. Figure 7(a) shows that, with increasing vs, the impact point of the pedestrian's head gradually moves upward and toward the center of the windshield. The main reason for this is that as vs increases, the linear and angular accelerations of the head gradually increase, the time for the head to rotate around the neck decreases, and the distribution of the impact points is concentrated. As shown in Figure 7(b), with increasing vp, the impact points of the head gradually diverge from the center of the windshield to the sides. However, the offset position is not obvious; therefore, it is concluded that there is no significant relationship between vp and the impact point. As shown in Figure 7(c), the impact points are close to each other relative to the impact position, and the impact point of the head changes constantly with the movement of the impact positions.

Distribution of human head impact points under different conditions.
Head FE modeling
Construction of the head FE model
To ensure that the head model accurately reflects the biological response of the head in a collision, a detailed model with a complete structure of the head is established. Computed tomography (CT) and magnetic resonance imaging (MRI) data of a 50th-percentile Chinese adult male volunteer were selected for head modeling, as shown in Figure 8(a). There were 374 CT and 103 MRI images. First, 10 parts of the skull, lateral ventricle, brain stem, scalp, pia mater, brain, cerebellum, tentorium cerebellum, third ventricle, and cerebrospinal fluid were extracted using Mimics software (Materialise, Belgium). The skull and scalp geometry models and brain tissue geometries constructed using Mimics are shown in Figure 8(b)–(d), respectively. The head model in Mimics s subsequently imported into ANSA (BETA, Greece) for meshing, loading, and contact definitions. The FE model of the head in ANSA is shown in Figure 9.
Verification of the FE model of the head
We imported the FE model of the head into ABAQUS (Dassault, France) and defined the attribute materials for each part of the head. The skull is simulated using linear elasticity theory. The material properties of the brain tissue (i.e. the brain, brainstem, and cerebellum) and cerebrospinal fluid (CSF) are assumed to be linear, isotropic, and viscoelastic. The formula for the shear modulus G(t) is as follows:
The FE model of the head must be validated using data from head impact experiments. Typically, experimental samples of impact are human cadavers. To the best of our knowledge, there is very little experimental data on Chinese cadavers and tissues. Consequently, almost all relevant studies in China have adopted the data from European and American experiments, such as the Nahum, Yoganandan, and Trosseille experiments. Among them, the Nahum experiment data are most widely used.27–29 However, there are some differences in the human body between Chinese and Americans. For instance, the bones and muscles of cadaver samples used in the Nahum experiments are generally larger than those of an ordinary Chinese human. Hence, it is suggested the Nahum data be modified to reflect the head of a 50th percentile Chinese adult male. 30 In this study, we validated the FE model with the original and modified data from the Nahum Experiment 37.

Construction of the head model using mimics.

The FE model of the head in ANSA after meshing, loading, and contact definition.
Material properties of brain tissues.

Note: ρ: density; v: Poisson's ratio; E: elastic modulus; K0: bulk modulus.
Figure 10 presents the comparison between the simulation curves, Nahum experiment curves, and modified Nahum curves.30,31 Figure 10(a) shows a simulation of the head-impact experiment using ABAQUS. Figure 10(b)–(d) compare the contact force, impact side pressure, and offset side pressure, respectively. From Figure 10(b), the Nahum experimental and modified and simulated contact force peak values were 7900 N at 3 ms, 6488 at 2.7 ms, 6758 at 2.94 ms, respectively. From Figure 10(c), the Nahum experimental and modified and simulated impact side pressures were 149 kPa at 3 ms, 138 kPa at 2.68 ms, 148 kPa at 2.69 ms, respectively. From Figure 10(d), the Nahum experimental and modified and simulated offset side pressures were −65 kPa at 3.93 ms, −79 kPa at 2.76 ms and −54 kPa at 3.8 ms, respectively. The peak values of the simulated contact force and impact-side pressure fall between those of the experimental and modified data. The peak value of the simulated offset side pressure is closer to its counterpart in the Nahum experimental data than that in the modified data. The peak percentage differences (PPDs) of the contact force, impact side pressure, and offset side pressure between the experimental and simulation data were 14.4%, 0.6%, and 16.9%, respectively. All the PPDs were within 20%. Hence, we determined that the simulation curve trends during collisions were similar to those in the cadaver experiments. The results show that the FE model based on real human data is reliable and can be used in subsequent studies.

Comparison between Nahum experimental data and simulation data.
Front windshield FE model
A windshield model of the entire vehicle was constructed. The model included two coincident layers representing the glass and PVB layers. Wang et al. 29 reported that the interaction between the head and windshield is often more severe when the impact position is close to the fixed boundary of the windshield. This results in a greater probability of head injury, particularly axonal injury, and brain contusions. In accordance with previous studies, head-windshield collisions are divided into central and edge impacts based on impact position. There is a large difference between the mechanical responses of the central and edge impacts. The impact of the head on these parts can lead to serious injuries. This is because the edge of the windshield is connected to various steel-supporting structures with higher hardness and rigidity. In this study, the windshield area is divided into two parts. The first part is the center collision area of the windshield, where the materials have a higher stiffness. The second part is the edge collision area, where the materials have lower stiffness. The FE of the front windshield is illustrated in Figure 11.

Finite element model of the front windshield.
HIW simulation
The HIW simulation model in ABAQUS consists of the FE models of the windshield and head. The results of the MBS model in PC-Crash, including vh and the corresponding impact position and angle, were input into the HIW simulation model. The friction coefficient between the windshield and the scalp was set to 0.2. Note that the MBS simulation in PC-Crash usually lasts 1–3 s because the simulation process includes the time interval from the front end of the vehicle contacting the legs of the pedestrian to their body hitting the ground. However, the HIW process in ABAQUS occurs in a much shorter timeframe, making long FE simulations impractical. As this study focused on the HIW process, the FE simulation was initiated 25–30 ms before the head contacted the vehicle. The dynamic response of the head was analyzed 30–40 ms after starting the simulation.
Results
Effect of HIW velocity on head injuries
In the HIW simulation, vh was set to 7.5, 9.2, 10.2, 11.8, and 12.9 m/s. Accordingly, the collision positions were set to the edge, center, and top of the window, and the collision angles were set to frontal, occipital, and left and right temporal collisions. The HIW simulation model is shown in Figure 12.

HIW simulation model.
The intracranial pressure (ICP), denoted by pi for different vh values, is shown in Figure 13. Under different values of vh, pi first increased and then decreased with time. As vh increases, the peak pi increases accordingly; the arrival time of the peak pi occurs sooner, and head injuries occur earlier. The tolerance limit of the adult head, pi, denoted by pit, is 235 kPa. Severe craniocerebral injury may occur when pi exceeds pit. Let pim be the moderate-injury threshold. pim is within the range of 173–235 kPa; that is, if pi is less than 173 kPa, minor or no injury to the head occurs. When vh is 10.2 m/s, the peak pi reaches 250.7 kPa, which is greater than pit. Serious injuries are more likely to occur when vh exceeds 10.2 m/s. When vh is 9.2 m/s and 7.5 m/s, the peak pi values are 213.9 kPa and 153 kPa, respectively. Under these circumstances, the head may suffer moderate or minor injuries. Therefore, a vh value of 10.2 m/s can be regarded as the critical value for injury.
Variation curve of pi under different vh.
Figure 14 shows the skull stress wave during the frontal collision at 10.2 m/s. Upon impact with the windshield, head movement is abruptly halted, causing the skull to stop first, leading to stress concentration at the impact site and deformation in that region. The stress then diffuses from the forehead collision position to all sides. Part of the stress is loaded onto the parietal part, and the other part is concentrated downward in the orbital part, and finally decreases until the collision energy is exhausted. At t = 5.5 ms, the von Mises stress peak appears at the forehead region of the skull, and the maximum equivalent stress is 85 MPa. When the von Mises stress of the skull (σs) reaches 75 MPa, the skull may fracture, increasing the risk of injury. 32 Moreover, brain tissues continue to move in their initial direction owing to inertia, transmitting stress from the skull to the intracranial tissues. Affected by the characteristics of brain tissue and the buffering effect of cerebrospinal fluid, the von Mises stress of brain tissue (σb) is significantly lower than that of the skull. As the collision time increases, the stress in the frontal part of the brain in contact with the skull gradually increases and diffuses radially. The stress distribution area expands. Brain regions that experience high central pressure are more susceptible to contusions. The stress wave continues to propagate inside the brain tissue along the collision direction, and there is a stress concentration in the frontal lobe of the brain opposite the collision point. However, it is attenuated relative to the frontal part of the brain because of the propagation of stress, which also corresponds to the change in pi. Movement toward the brain tissue relative to the skull causes friction. Additionally, owing to the contact and collisions between the skull base and its irregular structure, the stress at the skull base is significantly higher than that in the surrounding areas. When t = 5.5 ms, the peak σb appears below the impact side of the brain, and the maximum equivalent stress is 45.7 kPa. In this study, we adopted the brain tissue injury standard formulated by Baumgartner and Willinger 33 and Newman et al.. 34 Through these experiments, the σb value of 38 kPa was selected as the basis for determining whether severe nerve injury occurs in the human body.

Propagation of stress waves in intracranial space.
Figures 15–17 represent the ICP peak (denoted by pi−peak) and the maximum σs (denoted by Mσs) and maximum σb (denoted by Mσb) values change with vh. As shown in Figures 15–17, as vh increases, the pi−peak and Mσs and Mσb values increase nearly linearly. We performed a linear regression analysis in SPSS (IBM SPSS Statistics, USA), where pi−peak and Mσs and Mσb were regarded as dependent variables, and vh was used as the independent variable. Tables 4–6 show the linear regression analysis of pi−peak, Mσs, and Mσb in terms of vh, respectively. These tables indicate that the R-squared values of these models are all above 0.9, and the P-values are all less than 5% of the significance level, indicating that these linear models are reliable. The P-values corresponding to vh are all less than 5% of the significance level, and the absolute values of the T-statistic are all greater than 2, indicating that the significance test has been passed. Hence, it is safe to conclude that brain tissue-level injury is positively and linearly correlated with vh.

Linear regression for intracranial pressure peak in terms of the HIW velocity.

Linear regression for maximal von Mises stress of skull in terms of the HIW velocity.

Linear regression for maximal von Mises stress of brain tissue in terms of the HIW velocity.
Linear regression analysis of HIW velocity (pi−peak included).
Note: Dependent variable: pi−peak.
Linear regression analysis of HIW velocity (Mσs included).

Note: Dependent variable: Mσs.
Linear regression analysis of HIW velocity (Mσb included).

Note: Dependent variable: Mσb.
As a structurally vulnerable part of the brain, the brain tissue exhibits a more pronounced rate of stress change than the skull. At a vh of 10.2 m/s, σs and σb reach 83.27 MPa and 39.2 kPa, respectively. Both groups reached the threshold level for brain injury. Consequently, severe brain tissue damage occurs, and the skull is at risk of fracture, which is consistent with the above results indicating that 10.2 m/s is the critical value for injury. Therefore, according to the above analysis, vh is closely related to the parameters that reflect brain injury, namely pi, σs and σb, and vh is an important factor affecting pedestrian injury.
Effects of the impact position and angle on head injuries
Figures 18–20 show the main intracranial injury parameters for different HIW positions and angles at vh = 7.5 m/s. The lower and upper parts of the windshield have a greater impact on head injuries. For the same vh, the injury parameters for edge collisions are consistently higher than those for middle collisions; thus, the injury risk is significantly increased. In addition, the temporal collision stress is the lowest. This is because there are more stress areas in a temporal collision; the propagation range of the stress wave in the brain is larger, and the stress concentration is smaller than that in other parts of the collision. Compared to the impact at other collision locations, occipital impacts exhibit large fluctuations in injury parameters. Moreover, some injury parameter values for occipital collisions approach the tolerance limit, indicating a substantially increased risk of severe injury. This observation aligns with the real-world collision scenario, where impacts on the back of the head typically cause greater damage. 35
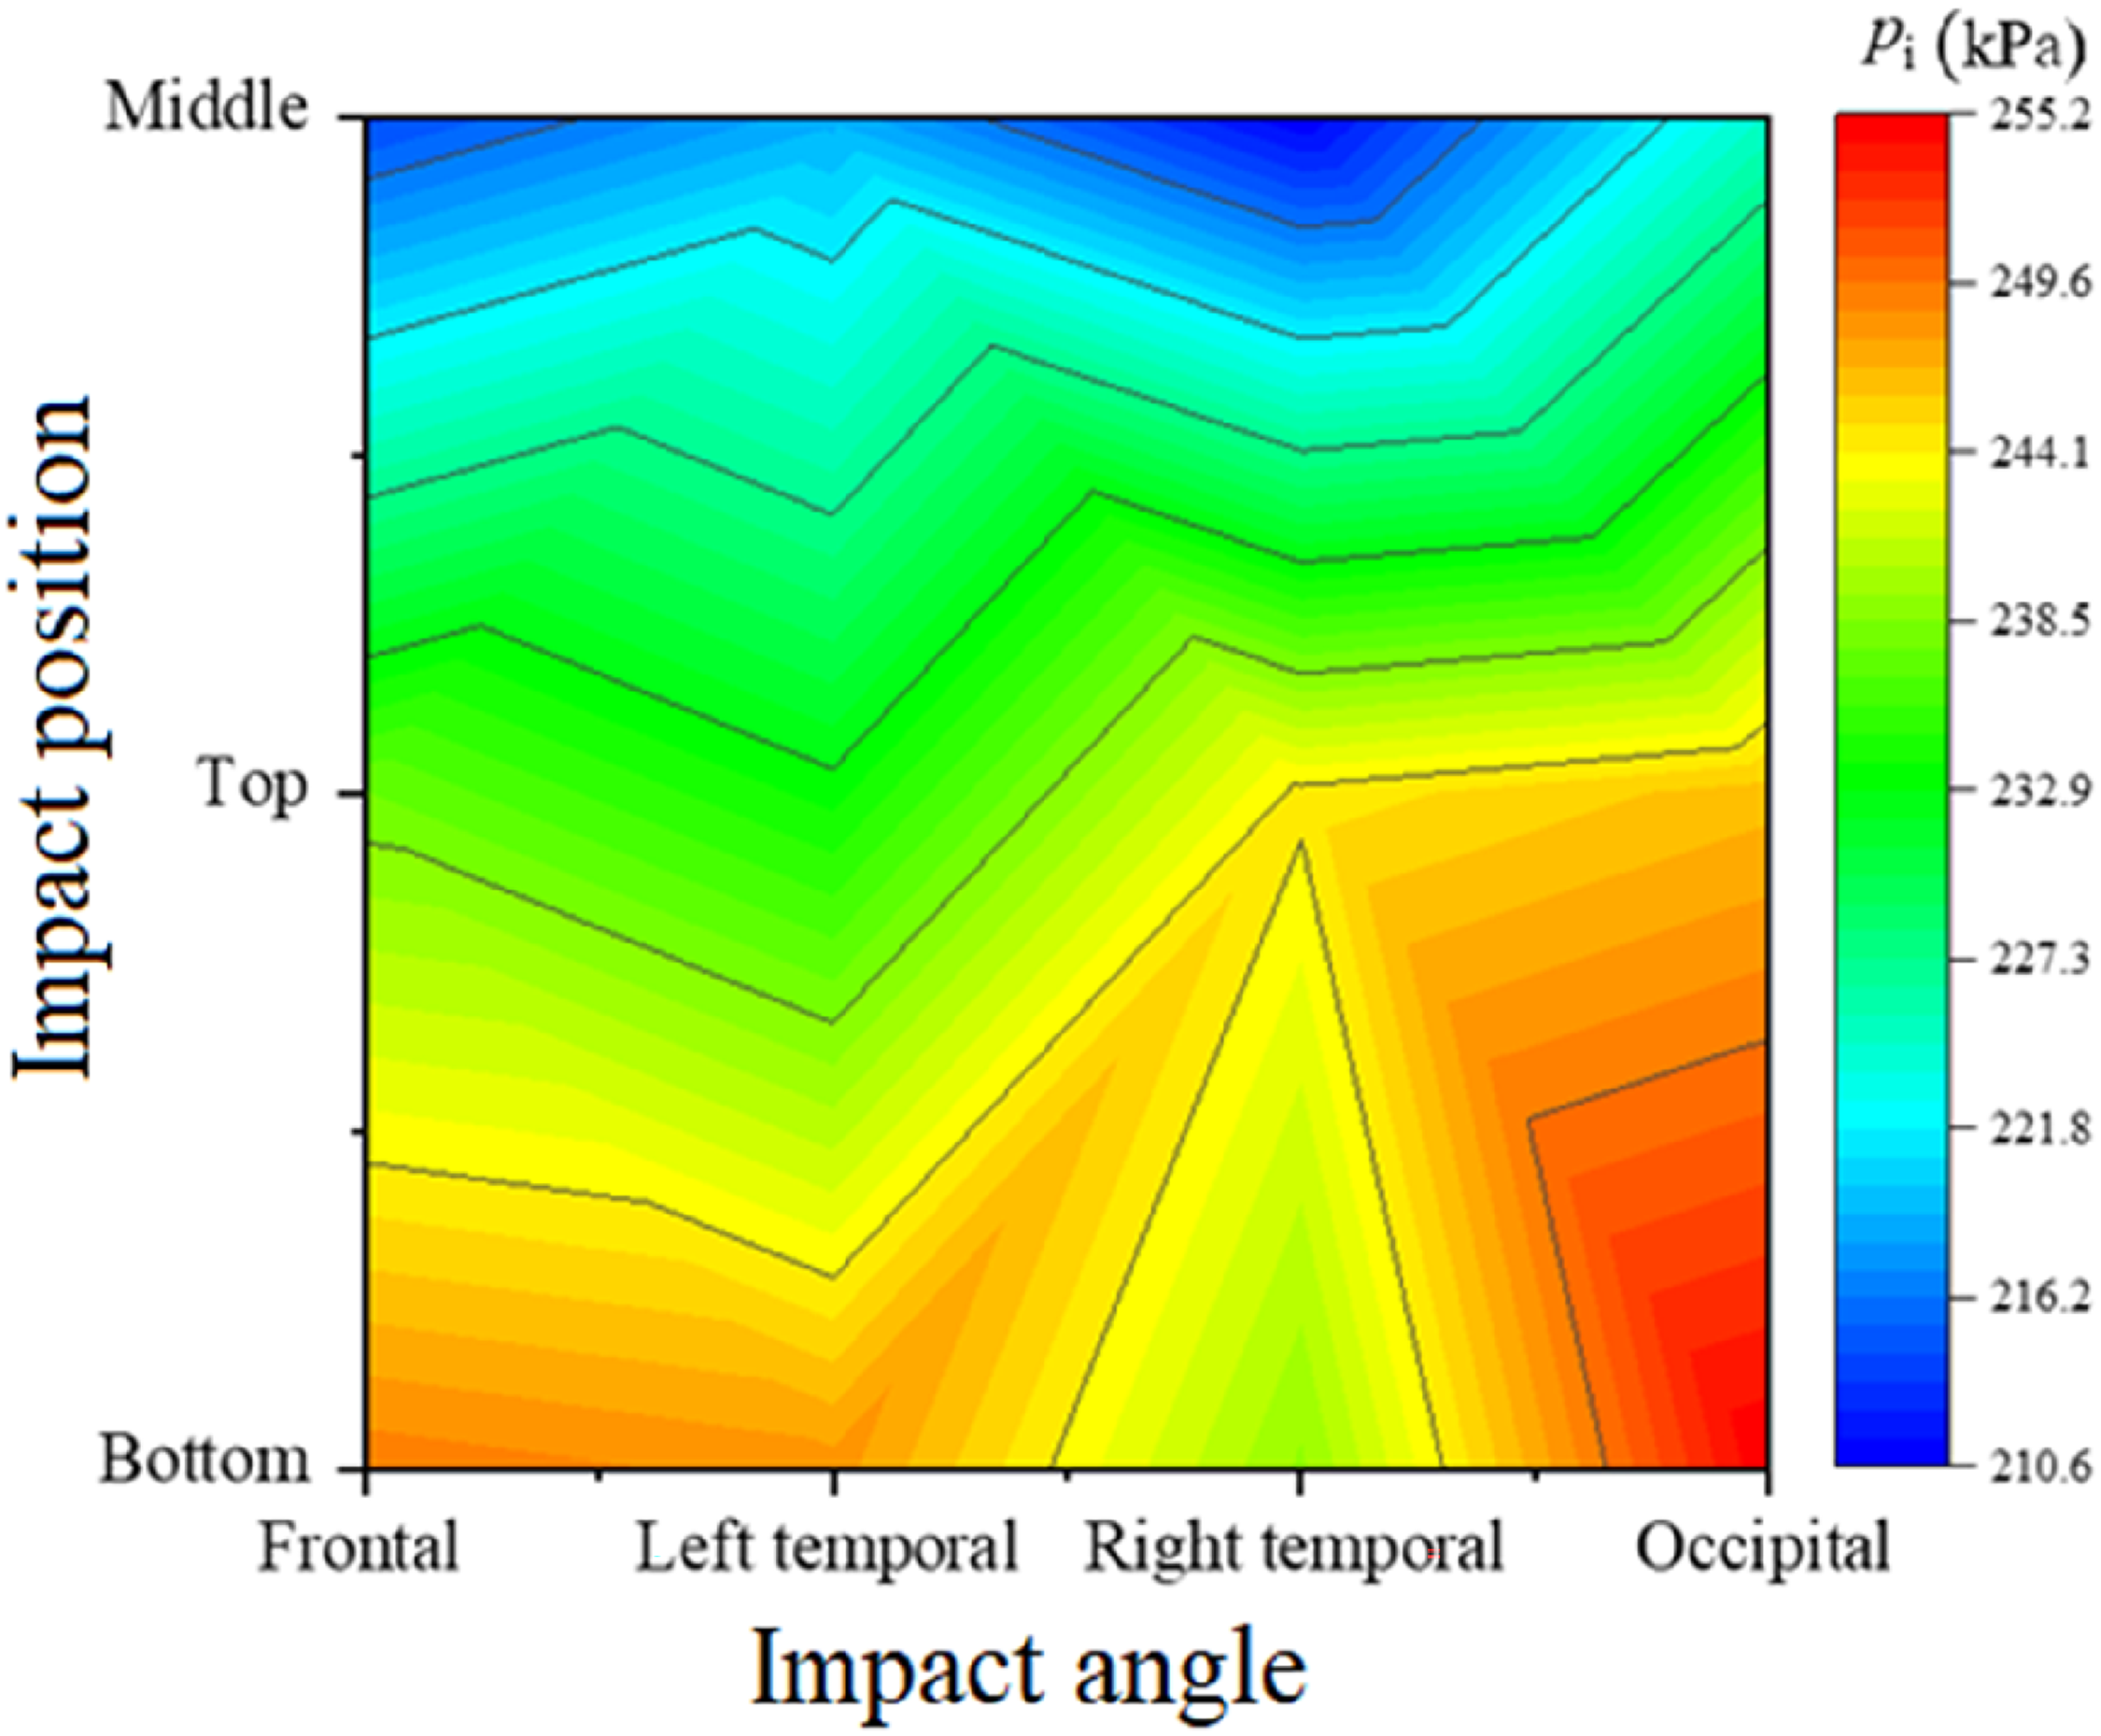
Relationships between intracranial pressure and collision parameters.

Relationship between von Mises stress of the skull and collision parameters.

Relationship between von Mises stress of brain tissues and collision parameters
We also used SPSS to analyze the effect of the impact position and angle on head injuries. The impact position and angle were treated as categorical variables. We converted these into dummy variables to participate in the linear regression analysis. Since the categorical variable is“impact position,” which can take on three different values (that is, “middle,” “top,” “bottom”), we create two dummy variables. Similarly, 3 dummy variables are required to represent the categorical variable “impact angle” because there are four different values of “impact angle” (that is, “frontal,” “left temporal,” “right temporal,” “occipital”). Setting “middle” and “occipital” to baseline values, we can convert the categorical variables of impact position and impact angle into five dummy variables. Then, we perform regression analysis where pi−peak and Mσs and Mσb are considered as dependent variables, and the dummy variables are used as the independent variables. Tables 7–9 represent the results of linear regression. In Tables 7–9, the coefficients of “top” or “bottom” are all positive and statistically significant. It means that the impact positions close to the boundary of the windshield, on average, lead to larger pi−peak and Mσs and Mσb than the impact position of the middle. This is consistent with previous studies. 29 In Tables 8 and 9, the coefficients of “frontal,” “left temporal,” and “right temporal” are all negative and statistically significant. This implies that the occipital impact, on average, leads to a larger von Mises stress than the frontal, left temporal, and right temporal impacts. In Table 7, the coefficient of “left temporal” is negative, whereas its P-value (0.254) is not less than 0.05. As far as pi−peak is concerned, the difference between the left temporal and occipital impacts is not statistically significant. The coefficients of fFrontal,” “right temporal” are all negative and statistically significant. This indicates that, on average, the occipital impact leads to a larger ICP peak than the frontal and right temporal impacts.
Linear regression analysis of impact position and angle parameters (pi−peak included).
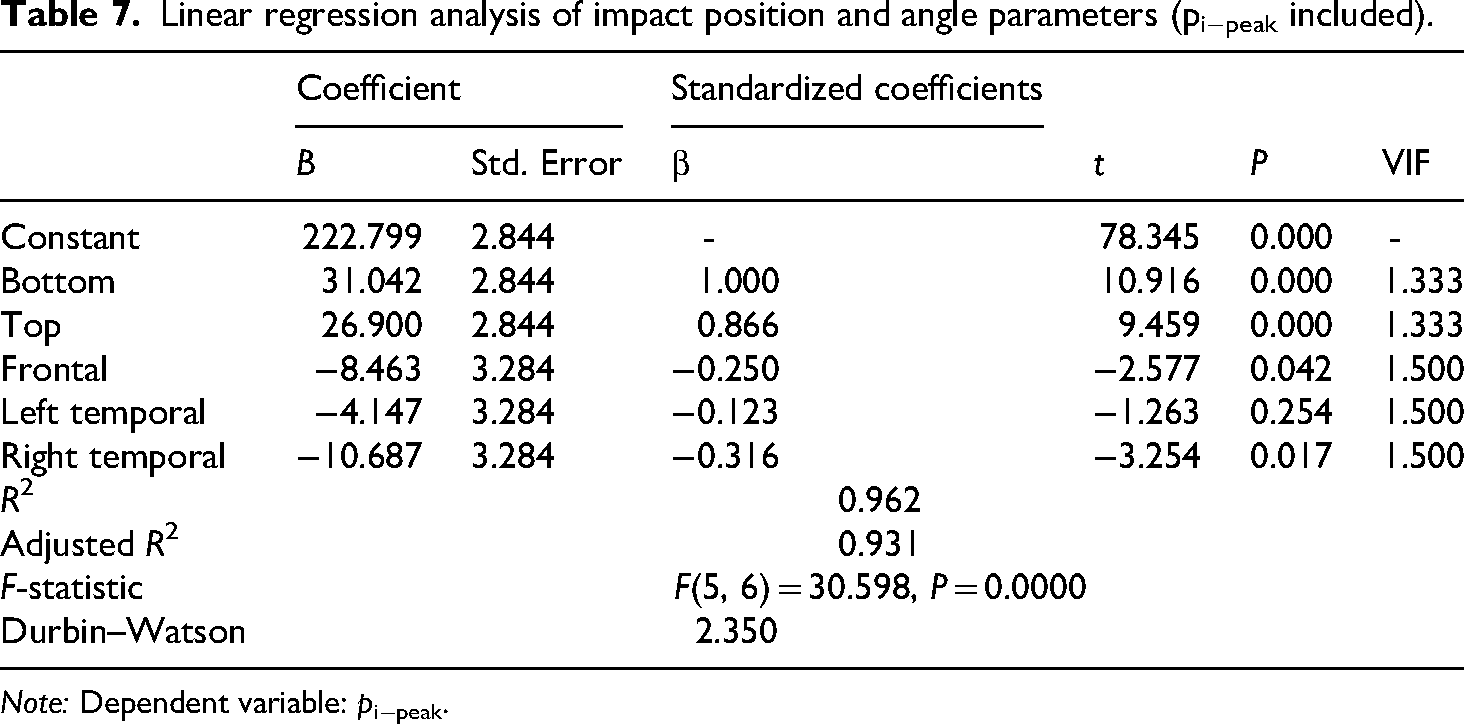
Note: Dependent variable: pi−peak.
Linear regression analysis of impact position and angle parameters (Mσs included).

Note: Dependent variable: Mσs.
Linear regression analysis of impact position and angle parameters (Mσb included).

Note: Dependent variable: Mσb.
Additionally, the above simulation results show that impacts near the windshield edge have a significant effect on pi and von Mises stresses, and lead to a high probability of pedestrian injury. Impact position also plays a crucial role in the degree of injury. Under the same load, pi and von Mises stress of the occipital collision are greater than those of the other parts. Therefore, it is necessary to minimize the occurrence of occipital collisions in VTPCs.
Discussion
This study examined the mechanism of pedestrian head injury from the perspective of the characteristics of stress wave propagation and stress distribution. The conditions leading to head impact injuries can be determined by observing the propagation of stress waves in the head, and the mechanisms of intracranial injuries can be explored from a clinical perspective. The stress-wave propagation processes for frontal, temporal, and occipital collisions were analyzed in detail. During the initial impact, stress is concentrated at the collision site before propagating along the impact direction. Stress is concentrated in the skull and brain tissues and can lead to various injuries to the skull and brain. σb is significantly less than σs. Therefore, different injury indices must be used to assess the severity of the injury in each region. 28 Moreover, the establishment of a head model based on real human data is important for obtaining intracranial parameters. In addition, this study revealed that stress propagates from the collision side against the opposite side of the brain and is ultimately concentrated at the skull base and the bottom of the brain. The maximum stress on the collision side is greater than that on the opposite side. This is because stress attenuates in the process of propagating through the brain tissue. However, the stress concentration remains at the opposite site. In combination with pedestrian head injuries, stress concentration may play a role in the damage mechanisms associated with head collisions.
VTPC accidents usually involve primary impacts (i.e. pedestrians directly impacting the front of vehicles) and secondary impacts (i.e. pedestrians impacting the road surface). 36 Some studies have reported that primary impacts, mainly in the form of a pedestrian's head directly impacting the front windshield, increase the risk of head injury more than secondary impacts. 37 Moreover, there is considerable controversy regarding whether the inclination angle of the windshield affects pedestrian head injury. 4 Consequently, we only considered the HIW velocity in this study. We observed a clear relationship between vh and the severity of pedestrian head injury. We studied the results of the human collision response to different values of vs. First, we found that vs affected the kinematic response to the pedestrian's head. With increasing vs, the impact point of the head on the windshield gradually moves up. There is a clear linear relationship between vh and vs; that is, the ratio of the former to the latter is approximately 0.8. pi, σb, σs, and other parameters that directly reflect the degree of head injury have a significant linear relationship with vs. Higher vs leads to increased σb and pi, which results in a higher probability of brain tissue contusion and severe nerve injury. When vh is greater than 10.2 m/s, severe damage usually occurs after the head collides with the windshield, whereas when vh is below 10.2 m/s, the value of each damage parameter decreases significantly, and the probability of head injury is greatly reduced. Therefore, 10.2 m/s could serve as the critical threshold for severe injuries. The injury parameters change significantly with the change in vs, and even a small reduction in vs significantly reduces the degree of injury. Therefore, reducing vs before a collision is highly important for reducing the occurrence of fatal accidents.
The kinematic response following a pedestrian collision is another focus of this study. When the front of a vehicle collides with the legs, the pedestrian's upper body usually rotates around its longitudinal axis of their body. Collisions of the head, windshield, and hood are the main sources of pedestrian injury. In VTPCs, the pedestrian head collision point gradually concentrates in the middle and upper areas along the vehicle's longitudinal axis with increasing vs. After vs exceeds 35 km/h, the head has a 90% probability of collision with the windshield. The collision points on the windshield and the kinematic response of the pedestrian after collision indicate that vs, θp, and dp are important factors affecting pedestrian collision injuries. Because the windshield edge has a supporting structure, head-edge collisions lead to more serious damage than middle collisions in the same vehicle. This is consistent with previous studies. 29 The head injury from a middle-area collision will be minor. However, the opposite may occur in edge collisions. In the case of edge collisions, the probability of the injury parameters exceeding the tolerance value increases significantly. To reduce the risk of injury caused by these structures, energy-absorbing devices, such as airbags, can be used in front of the vehicle to prevent the head from directly hitting rigid structures and to ensure that the safety performance of the vehicle itself will not be affected in a rollover accident.
In this study, various injury indicators were used to evaluate damage scenarios, and an orthogonal experiment was designed to determine the collision angles that significantly affected head damage. There is a higher risk of injury during an occipital region-to-windshield collision. 28 The occipital and temporal regions are relatively weak parts of the head. In traffic accidents, the occurrence of such collisions should be reduced, and these parts should be protected.
Limitations
This study has several limitations that warrant discussion. First, this study only considered brain injury during the collision between the head and the windshield in a single-collision scenario without accounting for the collision between the head and the ground. Some studies have suggested that head impacts with the ground lead to more severe injuries. However, because of the complex interactions between the human body and vehicles, factors such as vehicle type, pedestrian posture, and collision location can lead to variations in the angle and speed when a pedestrian's head strikes the ground, resulting in a certain degree of randomness in the severity of head injuries and significantly increasing the complexity of related research. In future studies, it may be beneficial to introduce accident reconstruction to define the range of influencing factors based on case studies, which could significantly reduce the complexity of the research.
Second, in the course of studying pedestrian head injuries, the degree of head injury in adult men of different body types (5th and 95th percentiles) must be considered. In addition, because of the difference in body size between men and women, the degree of head injury in women must be considered. The same collision conditions were used to simulate collisions to compare and analyze the degree of head damage in men and women.
Third, this study examined only the impact of accident parameters on brain injury that did not involve the structure of the vehicle itself, such as the front-end structure of the vehicle or the inclination angle of the windshield. Some studies have shown that the windshield inclination angle does not have a significant effect on head injury. 4 However, the influence of other parameters, such as the front-end structure of the vehicle, on the head needs to be further studied.
Fourth, in this study, when setting the friction coefficient between human and road as well as that between vehicle and road, we mainly considered dry and asphalt/concrete roads. Automobile safety research has predominantly focused on dry and asphalt/concrete roads. 38 However, VTPCs can also occur on other types of roads, such as wet roads and sandy roads. 39 Therefore, in future studies, it will be necessary to investigate pedestrian head injuries in VTPCs under different road conditions.
Conclusion
In this study, the kinematic response of pedestrians in VTPCs was simulated using the MBS model, and the head kinematic response parameters that are most related to pedestrian head injuries were explored. The results show that vs, θp, and dp have great effects on the kinematic response of the pedestrians’ head. The FE model of the head was established based on real 50th-percentile Chinese male data, and the kinematic response parameters of the head were input into the HIW model to simulate the head–windshield collision process. Finally, when vh exceeds 10.2 m/s, pedestrians are seriously injured and there is a risk of death. Compared to the middle part of the windshield, the injury is more severe when the head collides with the lower or upper parts of the windshield. In addition, compared to the frontal region, the temporal and occipital regions are more vulnerable and often suffer more injuries. Reducing vs below 10.2 m/s is important for protecting pedestrians in the event of a VTPC. Vehicle manufacturers should consider installing pedestrian protection devices on the upper and lower parts of windshields to effectively reduce the severity of pedestrian injuries. Special attention should also be paid to protection against temporal and occipital collisions if pedestrians are involved in vehicle accidents.
Footnotes
Ethics statement
The personal data (CT and MRI data) in this study is obtained with the approval of the volunteer. All data is for research purposes only and not for commercial use. The personal information of the volunteer is kept strictly confidential during the process of research and paper writing.
Funding
The authors disclosed receipt of the following financial support for the research, authorship, and/or publication of this article: This work was supported by the National Key Research and Development Program of China (No. 2019YFB1600500) and the Key Research and Development Plan of Zhenjiang City (No. SH2019054).
Declaration of conflicting interests
The authors declared no potential conflicts of interest with respect to the research, authorship, and/or publication of this article.
Data availability statement
The data used to support the findings of this study are available from the corresponding author upon request.