
Abstract
Objective
Managing end-of-life (EOL) patients with cancer has always been a major challenge in healthcare. Previous studies have highlighted the need for individualized EOL treatment and the importance of avoiding overtreatment. However, accurately identifying EOL patients with cancer to provide appropriate care and improve their quality of life remains an unresolved issue.
Methods
This study was based on investigation on Nutrition Status and Clinical Outcomes of Common Cancer (INSCOC) cohort. Machine-learning methods analyzed the characteristics of EOL patients with cancer and identified the determinants associated with EOL risk. Population-attributable fractions, least absolute shrinkage and selection operator regression analysis, random forest, and logistic regression (LR) analysis were used to screen predictive indicators for EOL risk. LR, support vector machines, generalized linear models, gradient boosting machine, random forests, and artificial neural networks were then used to construct models based on the identified risk factors.
Results
In total, 17,013 patients from the INSCOC cohort (including 1109 EOL patients) were analyzed. LR was the best-performing machine-learning model, and factors such as advanced stage, neutrophil-to-lymphocyte ratio, malnutrition, hypoalbuminemia, poor self-health assessment, limited mobility, prognostic nutritional index, lack of appetite, and cancer location were the key determinants of EOL risk.
Conclusion
The findings of this study provide valuable insights for clinical practice, indicating potential pathways for the more precise management of patients with EOL cancer. Through timely identification and intervention of the identified risk factors, the risk of EOL in these patients may be reduced and their prognosis can be improved.
Introduction
According to the latest global cancer statistics report, the number of patients with cancer continues to grow at a rate of nearly 20 million per year, and the number of deaths remains at approximately 10 million annually. 1 End-stage cancer is an important stage in the life cycle of patients with cancer. However, no universally agreed timeframe exists to define the end stage of cancer from the perspective of death. End-stage cancer is usually defined as the stage at which cancer can no longer be effectively treated, and the prognosis of the patient has declined sharply. 2 Patients who will likely die within 90 days are considered to have entered the end-stage, also known as the end-of-life (EOL). 3 At this stage, the tumor cannot be eliminated, survival of patients is significantly shortened, and quality of life is significantly reduced.4,5 Overactive antitumor treatment may aggravate the physiological and psychological burden on end-stage patients. A US longitudinal cohort study showed that chemotherapy did not improve patients’ survival and exacerbated the deterioration of quality of life in patients with good performance status (Eastern Cooperative Oncology Group performance status score of 1). 6 A study by Canavan et al. also found that there was no significant difference in the overall survival rate of patients receiving systemic anticancer therapy for advanced diseases regardless of different treatment rates, and excessive treatment instead increased the medical burden on end-stage patients. 7 Conversely, alleviating pain and ensuring quality of life have become very important issues instead of active antitumor treatment.8,9
Although we recognize the significance of the EOL stage, many patients and even clinical practitioners often confuse the concepts of EOL and late stage, misdefining treatment goals. This misinterpretation has led to some EOL patients with cancer enduring economic burdens and physical suffering that they should not have bore. 10 The lack of awareness regarding EOL stages may be due to various reasons. Clinicians may not recognize this problem in a timely manner, with research indicating that only 9.5% of patients are informed by doctors about the risks of cancer overdiagnosis and overtreatment. 8 However, for patients’ families, choosing EOL care over potentially life-saving treatments is a difficult choice. A pediatric study showed that many patients were reluctant to participate in EOL care and preferred to undergo intensive treatment at hospitals. 11 Therefore, early identification of EOL predictors may aid in survival assessment of end-stage patients and improve their quality of life during the EOL period.
Notably, nutritional status serves as a crucial bridge connecting the pathophysiological mechanisms of end-stage cancer to patients’ survival outcomes and quality of life, and it is also an indispensable core dimension for understanding and managing the EOL stage. For patients with end-stage cancer, tumor-induced metabolic reprogramming (e.g. aerobic glycolysis) competitively seizes nutrients such as glucose and amino acids. 12 Meanwhile, treatment-related adverse reactions (e.g. nausea, oral ulcers) and psychological stress further suppress patients’ appetite, resulting in insufficient nutrient intake. This dual burden triggers a vicious cycle, inadequate nutrient intake accelerates muscle catabolism and fat depletion, exacerbating malnutrition and even leading to cancer cachexia. 13 Conversely, impaired nutritional status weakens immune function and increases the risk of infections and pressure ulcers. Our previous studies have shown that nutritional indicators affect the short-term prognosis of cancer patients, 14 and cancer-related symptoms, such as loss of appetite, also significantly increase patients’ short-term risk of death. 15 Based on this, this study illustrated the characteristics of end-stage patients with cancer in China, screened predictive indicators associated with EOL risk in these patients through population attributable fraction (PAF) and machine learning, and constructed and verified a model with high EOL risk predictive efficiency.
Materials and methods
Patients and variable definitions
The patients in this study were sourced consecutively from the Investigation on Nutrition Status and Clinical Outcome of Common Cancers (INSCOC), a prospective cohort study from China that was started in 2013. It is registered at https://www.chictr.org.cn/ (registration number ChiCTR1800020329). To investigate the nutritional status of patients with common cancers, we included 91 clinical centers at the national, provincial, and city levels. These centers conducted questionnaire surveys and hematological and anthropometric measurements by clinicians who received uniform training. 16 All patients provided written informed consent forms. In total, 22,783 patients were recruited for the INSCOC project, all of whom provided informed consent. In this study, 11 patients lacked age data, 31 lacked body mass index (BMI) data, and 2672 were missing data on staging. Furthermore, in terms of laboratory data, 577 patients lacked albumin data and 248 were missing the data needed to calculate the neutrophil-to-lymphocyte ratio (NLR). From a nutritional standpoint, 2048 patients lacked cachexia data, and 183 were missing treatment or other physiologic measurement data (Figure 1). The data accessed for research purposes were 2023/5/1. Authors had access to information that could identify individual participants during or after data collection. The reporting of this study conforms to STROBE guidelines. 17

Flowchart.
The observational variables included baseline demographic characteristics, tumor features, symptoms, and nutritional indicators. Baseline characteristics encompass age, sex, residence (metropolitan vs. nonmetropolitan), smoking, drinking, tea consumption, education level, hypertension, diabetes, coronary heart disease, Karnofsky Performance Scale (KPS) score, 18 self-assessment of health (good vs. bad), and BMI (considered overweight or obese if ≥24 kg/m2, considered underweight if <18 kg/m2). Tumor features included tumor stage (early stage for stages 1–3, late stage for stage 4), family history of cancer, treatment modalities (radiotherapy, chemotherapy, and surgery), and tumor location, including digestive system tumors, lung cancer, and breast cancer. Symptoms included depression, anxiety, sleep disorders, weakness, mobility impairment, loss of appetite, early satiety, dry mouth, changes in taste, changes in smell, diarrhea, constipation, nausea, vomiting, pain, difficulty swallowing, oral ulcers, and weight loss within the previous month. Nutritional indicators included NLR (divided into high and low inflammation with a threshold of 3 19 ), albumin, Nutritional Risk Screening 2002 (NRS2002), prognostic nutritional index (PNI, PNI = serum albumin (g/L) + 5 × total peripheral blood lymphocyte count (×109/L) 20 ), anemia (hemoglobin <120 g/L for males, <110 g/L for females), cachexia, and malnutrition (based on Patient-Generated Subjective Global Assessment diagnosis, with a cutoff value of 4).
The outcome was defined as EOL risk, specifically operationalized as the probability of a cancer patient meeting the “EOL status” criteria during follow-up. To address the inconsistency in EOL definitions across existing literature (ranging from 30 days to 6 months before death21,22), we adopted a time-bound, clinically actionable definition aligned with prior studies on EOL cancer care 23 : a patient was classified as having “EOL status” if they died within 90 days after hospital admission (the index admission for baseline data collection, including demographic surveys, laboratory tests, and symptom assessments). The patient survival status was assessed by the attending physician through outpatient visits, medical records, or telephone follow-ups, with follow-up data collected until December 31, 2021. This study was in accordance with the Helsinki Declaration of 1975 as revised in 2024.
Statistical analysis
All analyses were performed using R version 4.2.0. Statistical significance was set at P-value <0.05.
Continuous variables are presented as means with standard deviation or medians with quartiles. Between-group differences were compared using unpaired t-tests or Mann–Whitney U tests. Categorical variables are presented as N (%), and between-group comparisons were performed using the chi-squared test or Fisher's exact test.
Next, the data were randomly divided into training and validation sets in a 7:3 ratio. To identify the potential risk factors for EOL patients, four methods were employed: PAF, least absolute shrinkage and selection operator (LASSO) regression, random forest (RF), and logistic regression (LR). Factors with PAF values of >20% were selected for the PAF model. PAF is commonly used to assess the proportion of a population expected to reduce the occurrence of outcomes after eliminating specific risk factors, as described in our previous study. 24 LASSO regression was conducted four times based on variable categorization. In the RF model, factors with the top 20 variable importance were selected, and statistically significant factors from the univariate LR analysis were also included. The risk factors identified from the four models were incorporated into subsequent analyses and visualized using Venn diagrams. Correlation analysis was used to describe the relationships among the nine variables.
Subsequently, to build the best model for predicting EOL risk, machine-learning methods, such as LR, support vector machine (SVM), generalized linear model (GLM), gradient boosting machine (GBM), RF, and artificial neural network (ANN) were used to construct models based on the identified risk factors. Model comparisons were performed using receiver operating characteristic curves, coefficient of determination R2, and the optimal model was presented using a nomogram. Meanwhile, we have also developed a web-based calculator to better visualize the results of our model.
Results
Baseline characteristics
In total, 17,013 patients from the INSCOC cohort (including 1109 EOL patients) were analyzed (Figure 1). Regarding tumor types in these patients (Figure 2), lung cancer was followed by colorectal and gastric cancers second and third, respectively. Additionally, we specifically described the nutritional and inflammatory statuses of patients within the INSCOC cohort. The majority (61.2%) were in a high inflammatory state (NLR ≥ 3), and 84.67% of participants were malnourished. During the previous month, 52.21% of the patients experienced weight loss (Tables S1 and S2). To better assess EOL risk for patients, we divided the data into training and validation sets. Compared with the training set, none of the variables in the validation set showed significant differences (Table 1, P > 0.05).
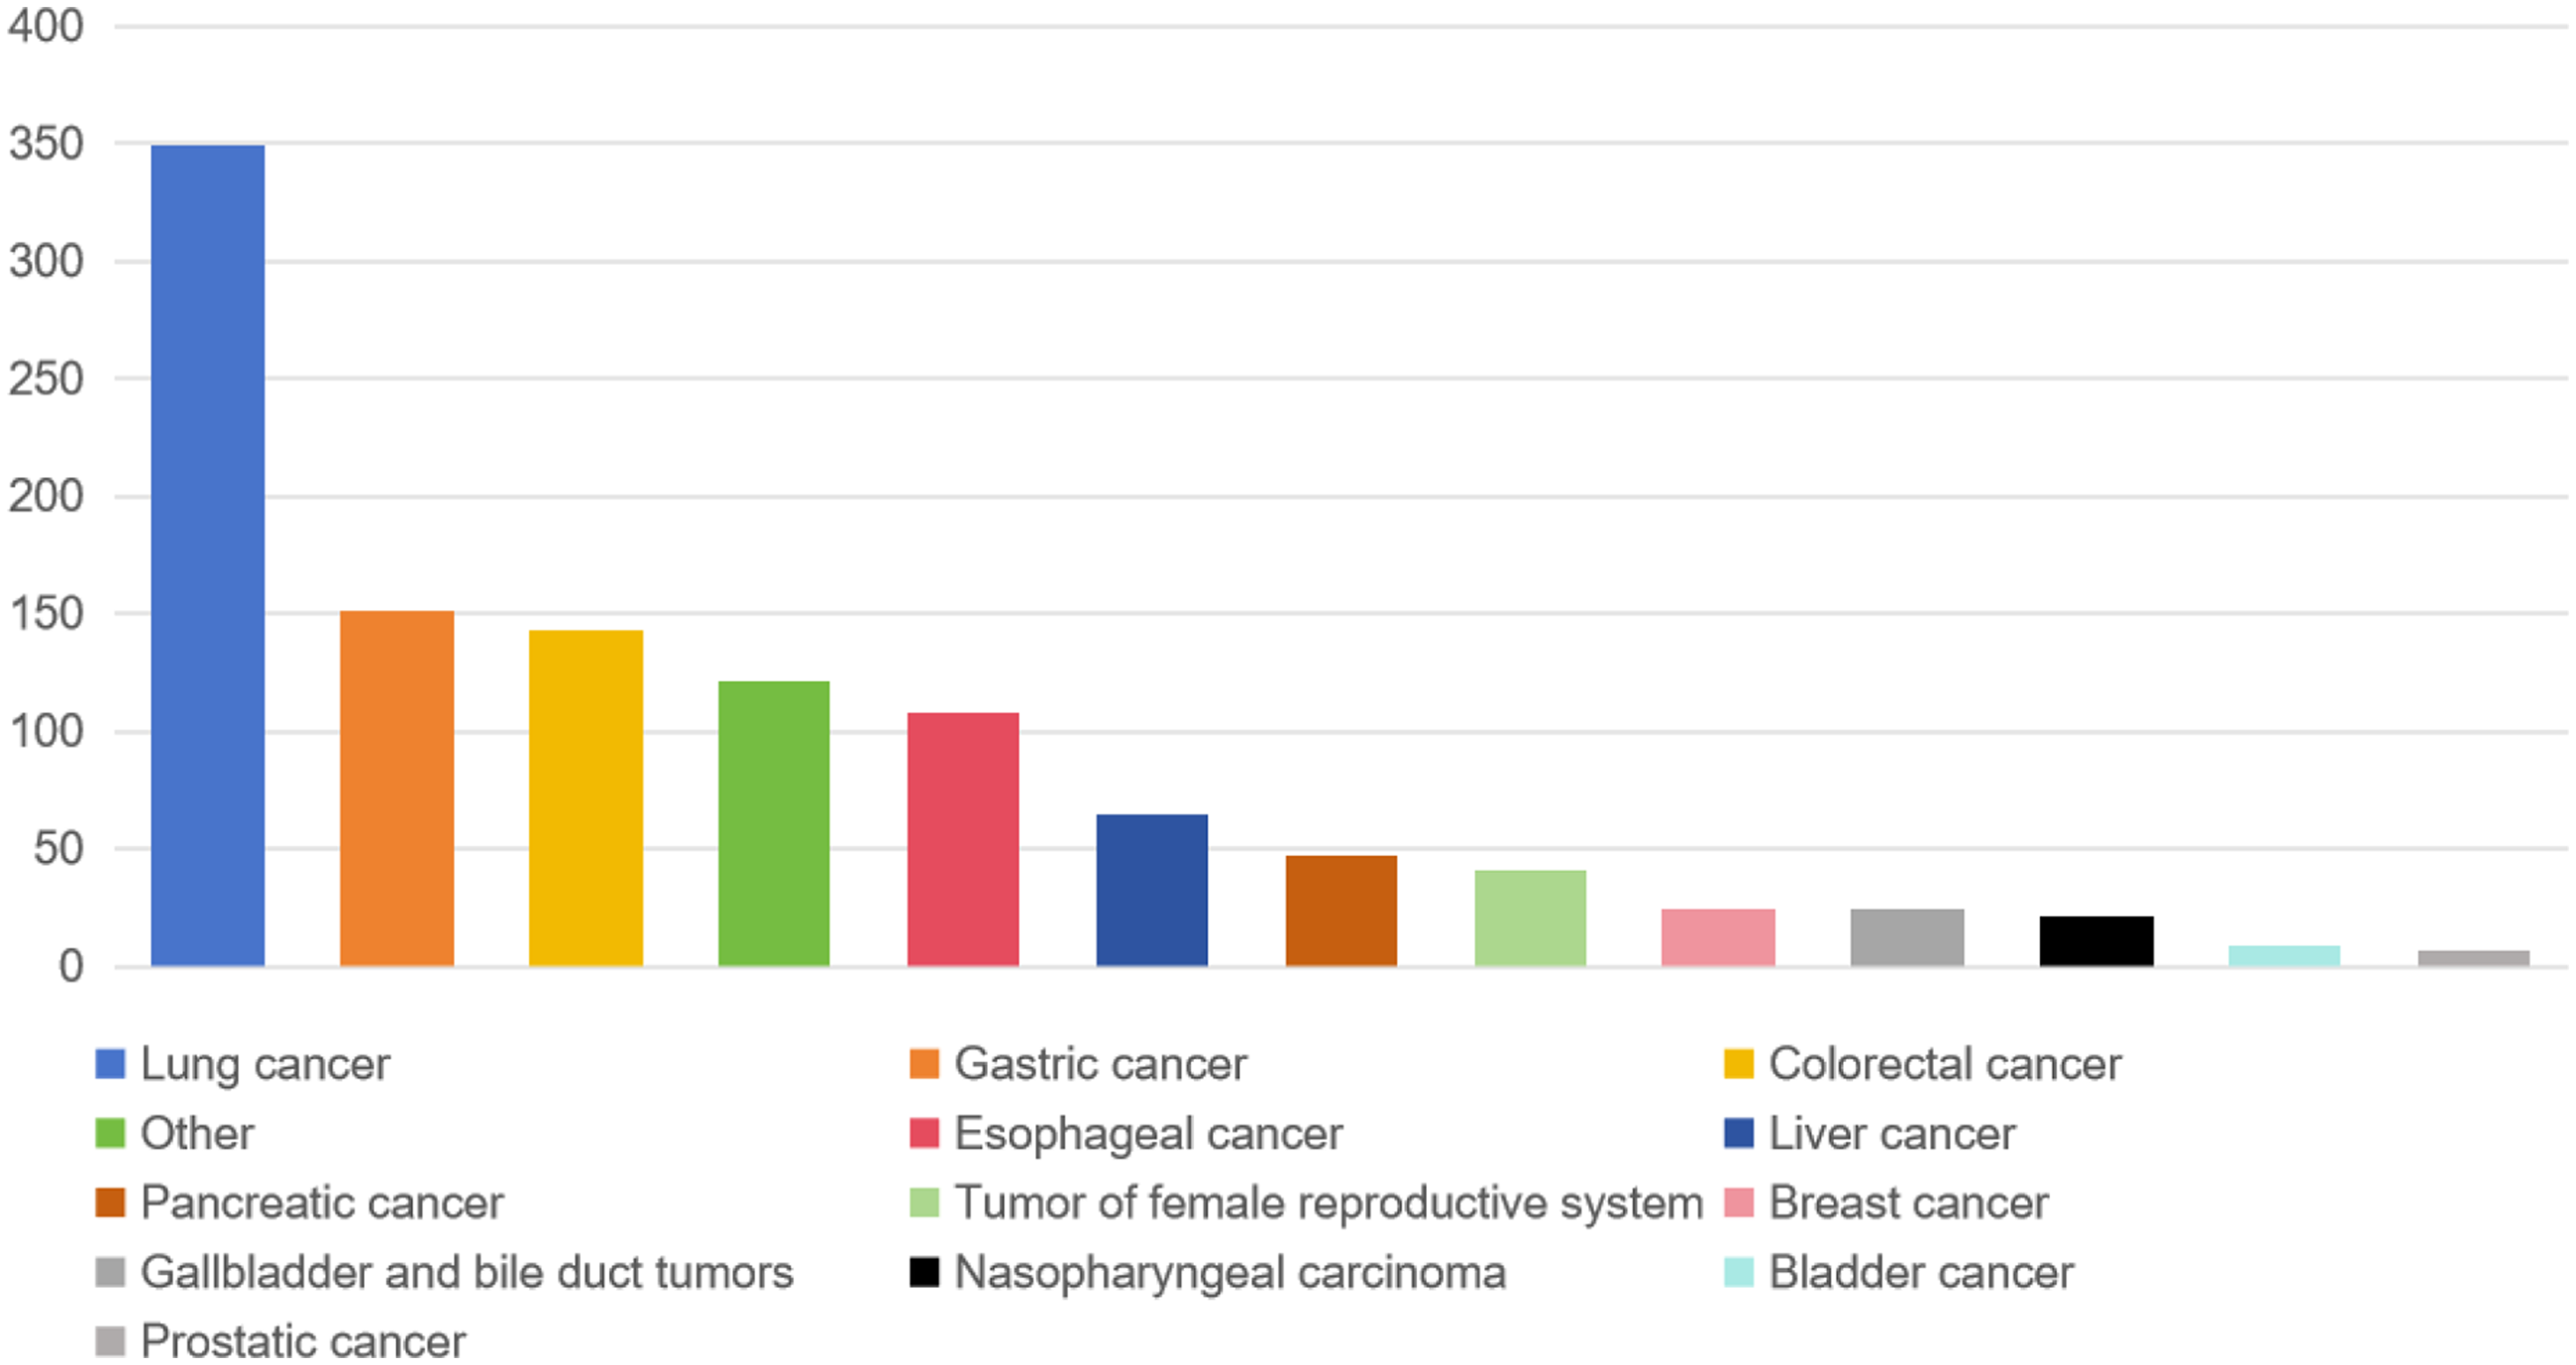
Distribution of tumor types in end-stage patients in the INSCOC database.
Baseline characteristics of training and validation sets.

BMI: body mass index; CHD: coronary heart disease; KPS: Karnofsky Performance Scale; IQR: interquartile range; NRS2002: nutritional risk screening 2002; NLR: neutrophil-to-lymphocyte ratio; PNI: prognostic nutritional index.
Intergroup differences were determined using a nonparametric test.
Intergroup differences were determined using a t-test.
Factor selection and model choice
In the PAF model, malnutrition, advanced stage, NLR, PNI, weakness, difficulty with physical activity, anemia, hypoalbuminemia, sleep disorder, nutritional risk, cachexia, loss of appetite, anxiety, weight loss within the previous month, self-health assessment, and depression were all considered risk factors for the EOL stage (Table S3).
In the LASSO regression model (Figure S1A), factors based on baseline demographic characteristics, including KPS, sex, self-health assessment, and low body weight, were incorporated into the final model. Further, Figure S1B shows that factors based on the tumor characteristics, including tumor location, advanced stage, and chemotherapy were present in the final model while Figure S1C illustrates that factors based on patient symptoms, such as lack of appetite, difficulty with physical activity, sleep disorders, and weakness, were incorporated. Finally, nutrition-related indicators, such as NLR, albumin, malnutrition, PNI, and nutritional risk, were included in the final model (Figure S1D).
In the RF model (Figure S2), advanced stage, NLR, albumin level, surgery, difficulty with physical activity, tumor location, malnutrition, self-health assessment, weakness, PNI, pain, loss of appetite, early satiety, dry mouth, constipation, changes in taste, changes in smell, low body weight, KPS, and difficulty in swallowing were identified as predictors for the EOL stage.
LR analysis (Table S4) identified sex, diabetes, self-health assessment, cancer site, advanced stage, surgery, radiotherapy, chemotherapy, loss of appetite, dry mouth, difficulty with physical activity, sleep disorders, weakness, NLR, albumin level, anemia, PNI, and malnutrition as risk factors for EOL stage.
We merged the identified risk factors from these four models, and a Venn diagram illustrating the common factors across all models is shown (Figure 3). The nine factors included in all the models were self-health assessment, cancer site, advanced stage, loss of appetite, difficulty with physical activity, NLR, hypoalbuminemia, malnutrition, and PNI score. The correlations between these nine factors are shown in Figure S3.

Venn diagram of four variable screening methods.
Construction and validation of the predictive models
Using the nine identified variables and six machine-learning methods, we constructed six models. The SVM model had an area under curve (AUC) of 0.615 for the training set and 0.705 for the validation set. The GLM had an AUC of 0.830 for the training set and 0.784 for the validation set. The GBM had an AUC of 0.846 in the training set and 0.784 in the validation set. The RF model had an AUC of 0.830 for the training set and 0.779 for the validation set. The ANN model had an AUC of 0.795 for the training set and 0.794 for the validation set. The highest-performing model was the LR model with an AUC of 0.816 for the training set and 0.822 for the validation set (Figure S4).
Considering that LR was the highest-performing method, two prediction models were constructed (Table S5). One model included the nine factors: advanced stage (odds ratio (OR) = 3.37, 95% confidence interval (CI): 2.85–3.99), NLR (OR = 1.93, 95% CI: 1.63–2.28), malnutrition (OR = 1.91, 95% CI: 1.51–2.40), hypoalbuminemia (OR = 1.75, 95% CI: 1.45–2.10), self-health assessment (OR = 1.60, 95% CI: 1.34–1.90), difficulty with physical activity (OR = 1.46, 95% CI: 1.23–1.73), PNI (OR = 0.75, 95% CI: 0.62–0.92), no appetite (OR = 1.31, 95% CI: 1.10–1.54), and cancer location (OR for lung cancer = 1.02, 95% CI: 0.87–1.21, OR for breast cancer = 0.30, 95% CI: 0.19–0.49, OR for other cancers = 0.50, 95% CI: 0.39–0.64). Another model improved upon this by only including factors that are clinically actionable: NLR (OR = 2.14, 95% CI: 1.81–2.53), malnutrition (OR = 2.09, 95% CI: 1.67–2.62), hypoalbuminemia (OR = 1.83, 95% CI: 1.52–2.20), self-health assessment (OR = 1.77, 95% CI: 1.50–2.10), difficulty with physical activity (OR = 1.67, 95% CI: 1.41–1.97), PNI (OR = 0.73, 95% CI: 0.60–0.89), and no appetite (OR = 1.48, 95% CI: 1.26–1.74). This improved model reached an AUC of 0.787 and R2 of 0.812 in the training set and AUC of 0.779 and R2 of 0.803 in the validation set. Nomogram visualization is shown in Figure S5. The web-based calculator in Figure S6 provides better and more convenient visualization of the results (https://future0405.shinyapps.io/eol_mortality_risk_calculator/).
Discussion
To our knowledge, this is the first study that uses a large clinical cohort, applies machine-learning techniques, and comprehensively evaluates a multidimensional set of indicators (baseline characteristics, cancer features, symptomatological indicators, nutrition-related indicators) to predict the EOL risk in cancer patients. The findings indicate that the LR model incorporating advanced stage, NLR, malnutrition, hypoalbuminemia, self-health assessment, difficulty with physical activity, PNI, lack of appetite, and cancer site can accurately predict EOL risk in these patients. Understanding that cancer stage and type are difficult to modify, we developed a more clinically applicable prediction model, excluding these two factors, which facilitates the dynamic observation of a patient's terminal risk with similarly high predictive performance. This model can help in the early identification and assessment of terminal risk predictors.
As early as the last century, doctors have recognized the need for personalized treatment of EOL patients. Holli et al. conducted a follow-up study of 555 patients with breast cancer and revealed that the proportion of deceased women who received treatment at the last follow-up was higher than that of survivors. Within the last week after the final follow-up, the number of women who died and received chemotherapy was to 2–6 times higher than that of survivors with recurrent disease. 25 Formoso et al. also indicated through a large-scale cohort that EOL antitumor treatment reduced the quality of palliative care for patients. 21 However, over the past two decades, numerous studies in the United States and Europe have shown that patients continue to receive excessive treatment, such as chemotherapy and targeted therapy, even when they are in the EOL stage. The one-size-fits-all approach did not benefit many patients. 26 Actually, there are numerous opportunities for re-challenging treatment in end-stage patients, but such opportunities can only be realized with accurate predictive models and prognostic models.27,28
Various studies have focused on the EOL stages of patients with cancer. One from the Netherlands developed a model to predict the 1-year mortality of patients with cancer; however, this model included subjective judgments from medical personnel. Although innovative, these subjective outcomes lack uniformity and universality. 29 Other studies have included patients’ laboratory indicators; Nagasako et al. improved the Glasgow score to provide a prediction scheme for the 3-day mortality rate of patients with cancer. 30 Additionally, physical measurement indicators such as phase angle can also provide information on the 3-day mortality risk for patients with cancer without edema. 31 However, these studies considered only single factors or specific aspects, whereas our study selected comprehensive and objective indicators from over 40 factors, including demographics, lifestyle habits, laboratory indicators, physical measurement indicators, symptoms, and tumor characteristics, to construct a predictive model.
It is worth noting that we have specifically incorporated a subset of nutrition-related data. The nutritional status of patients with end-stage cancer serves as a critical hub connecting pathophysiological processes and clinical care goals. From the perspective of pathophysiological mechanisms, the superimposition of tumor metabolic reprogramming and reduced nutrient intake in end-stage cancer leads to cancer-associated malnutrition and even cancer cachexia. Tumor cells competitively sequester glucose and amino acids through pathways such as aerobic glycolysis, accelerating the catabolism of muscle proteins and the consumption of fat reserves. 32 Meanwhile, tumor invasion of the digestive tract, treatment-related adverse reactions, and appetite suppression caused by psychological stress further exacerbate insufficient nutrient intake. This imbalance impairs the patient's immune function, increases the risk of complications such as infection and pressure ulcers, and triggers a vicious cycle through the release of inflammatory factors, directly shortening the patient's survival period. 33 From the perspective of clinical care, the core of end-stage cancer treatment has shifted toward the goals of improving quality of life and alleviating suffering. A favorable nutritional status enables the maintenance of patients’ basic physiological functions, reduces symptoms including fatigue and shortness of breath, enhances their ability to perform independent activities, and provides guidance for the clinical development of personalized palliative intervention plans. 34 Interestingly, in the final model, a symptomatic indicator, loss of appetite, was included. Symptoms related to nutrition affect the entire process in patients with cancer and influence their prognosis.35,36 Loss of appetite is a common and easily overlooked symptom. Studies have reported that 54% of patients with pancreatic cancer experience anorexia. 37 In the elderly, loss of appetite is especially common and is closely associated with malnutrition, sarcopenia, cachexia, and mortality. 38 Cancer-related anorexia occurs for several reasons. First, ample evidence suggests a mutual dependence between loss of appetite and inflammation. 39 Cancer itself or anticancer treatment can cause a significant increase in inflammation, undoubtedly exacerbating the degree of anorexia. Timely reduction in tumor burden and changes in treatment methods can effectively reduce the EOL risk for patients. 40 Second, the consumption of host nutrients and energy by tumors can lead to deficiencies in various nutrients such as zinc, iron, and various vitamins. Nutritional deficiencies can result in fatigue and loss of appetite. Timely supplementation may improve nutritional symptoms and alleviate EOL stress.41,42 Third, psychological factors such as anxiety, fear, and mental tension can also affect the appetite of patients with cancer. Brain modifications mediate a series of symptoms, such as interrupted sleep, anxiety, cognitive impairment, and decreased motivation (especially anorexia). 43 Psychological and social support for cancer-related anorexia is an emerging research field and preventing or alleviating this anorexia will improve patients’ quality of life and prognosis.44,45 Timely clinical assessment and intervention significantly reduce the risk of EOL care for patients.
This study had several limitations. First, our study was primarily conducted in the Chinese population, and no comparison was made between China and other countries/regions regarding differences. Second, we included a limited number of machine-learning models and conducted preliminary evaluations. Machine learning has been extensively researched in other cohort studies, with some studies employing 101 different machine-learning models for comprehensive evaluation of cohorts and model predictions. 46 Third, we did not fully describe the patients’ nutritional characteristics and lacked extensive data on muscle and fat mass, which led us to focus only on anthropometry while neglecting changes in body composition during the EOL. Finally, considering the incidence rates and number of eligible patients, we included patients from all tumor types and did not perform a more detailed analysis of patients with different types of cancer, as this might yield suboptimal results for subgroup analyses.
Conclusions
By comparing large cancer cohorts from both China and the United States, we identified the characteristics of terminally ill patients with cancer and used machine-learning techniques to identify the determinants of EOL risk in these patients. These determinants included advanced stage, NLR, malnutrition, hypoalbuminemia, self-rated health status, difficulty in mobility, PNI, lack of appetite, and cancer location. Timely identification of patients with these risk factors via our predictive model may help recognize individuals approaching EOL, thereby facilitating the prevention of futile interventions.
Supplemental Material
sj-docx-1-sci-10.1177_00368504251394547 - Supplemental material for Predicting end-of-life risk in patients with cancer: A multicenter cohort study
Supplemental material, sj-docx-1-sci-10.1177_00368504251394547 for Predicting end-of-life risk in patients with cancer: A multicenter cohort study by Lu Peng, Yixuan Wang, Wenzhi Zhao, Chenan Liu and Hanping Shi in Science Progress
Footnotes
Abbreviation
Acknowledgments
The authors would like to thank all the staff and patients who actively participated in the INSCOC project.
Ethics approval and consent to participate
The INSCOC cohort was approved by the Ethics Committee of the First Affiliated Hospital of Sun Yat-sen University on May 7, 2013 (2013-82). This study has been approved by the Beijing Shijitan Hospital ethics committee on Jun 23, 2024 (IIT2024-065-002). All patients provided written informed consent forms.
Author contributions
Conceptualization, LP; methodology, LP and CL; software, YW and CL; validation, WZ, CL, and LP; formal analysis, CL and LP; investigation, CL and LP; resources, LP; data curation, LP; writing—original draft preparation, LP and HS; writing—review and editing, LP and HS; visualization, LP and YW; supervision, LP; project administration, HS; funding acquisition, HS. All authors have read and agreed to the published version of the manuscript.
Declaration of conflicting interests
The authors declared no potential conflicts of interest with respect to the research, authorship, and/or publication of this article.
Funding
The authors disclosed receipt of the following financial support for the research, authorship, and/or publication of this article: This work was supported by the National Key Research and Development Program (2022YFC2009600, 2022YFC2009601) to Dr Hanping Shi.
Data availability statement
The datasets used during the current study are available from the corresponding author on reasonable request.
Supplemental material
Supplemental material for this article is available online.
References
Supplementary Material
Please find the following supplemental material available below.
For Open Access articles published under a Creative Commons License, all supplemental material carries the same license as the article it is associated with.
For non-Open Access articles published, all supplemental material carries a non-exclusive license, and permission requests for re-use of supplemental material or any part of supplemental material shall be sent directly to the copyright owner as specified in the copyright notice associated with the article.