
Abstract
Objective
Sepsis treatment remains challenging in ICU due to patient heterogeneity. Although sodium imbalance is common and associated with poor outcomes, its longitudinal dynamics and complexity have been overlooked. This study aimed to identify sodium trajectories in ICU patients with sepsis and evaluate their prognostic value.
Methods
This retrospective study included ICU patients with sepsis from the Medical Information Mart for Intensive Care IV v3.0 database. Time-series sodium measurements were extracted for the first 8 days of ICU stay. Latent Class Mixed Model was used to identify sodium trajectory patterns. The primary outcome was 28-day mortality, and the secondary outcome was 90-day mortality. Kaplan–Meier, cox regression, and logistic regression analyses were employed to examine associations between trajectory classes and outcomes. Further SHAP analysis quantified the contribution of individual features to mortality across the different classes. Subgroup analyses assessed robustness and effect modification.
Results
A total of 9697 patients were included and divided into four trajectory groups: “U-shaped increase”; “Low-level stable”; “High-level stable”; and “Inverted U-shaped decrease”. Class 1 exhibited the highest mortality risk, followed by Class 4, with adjusted hazard ratios (HRs) of 1.55 (95% CI: 1.30–1.85; p < 0.001) and 1.44 (95% CI: 1.18–1.74; p < 0.001), respectively. The death risk of Class 1 is primarily driven by indicators of acute physiologic disturbances. For class 4, the short- and long-term mortality risks were mainly influenced by comorbidities and coagulopathy. Subgroup analysis showed that the risk of death was more significant in class 1, particularly in patients with Simplified Acute Physiology Score < 35 (HR = 3.47, 95%CI:2.37–5.07, (p < 0.001)).
Conclusions
This study identified four distinct sodium level trajectory sub-phenotypes in ICU patients with sepsis and examined the risk factors associated with mortality. These findings provided a basis for risk stratification of sepsis patients and may inform personalized critical care strategies.
Introduction
Sepsis is defined as a life-threatening organ dysfunction caused by a dysregulated host response to infection, as established by consensus from The Third International Task Force on Sepsis and Septic Shock (Sepsis-3). 1 Globally, there are approximately 48.9 million cases of sepsis annually, resulting in 11 million deaths, accounting for 19.7% of total deaths worldwide. 2 It is worth noting that there are significant differences in pathogenesis, pathophysiological responses, and clinical phenotypes among septic patients. This seriously limits the development of clinical utilities and the improvement of therapeutic efficacy.3–5 Currently, no single biomarker or physiological parameter can accurately predict the imminent progression of sepsis in clinical practice. 6 Consequently, early and precise identification of risk factors and implementation of stratified management becomes crucial.
Sodium plays a critical role in maintaining acid-base balance, osmotic pressure, and normal cellular function. Patients with sepsis are prone to combine with abnormal blood sodium levels due to infections, feeding difficulties, abnormal hormone secretion, and internal environment disorders. Changes in blood sodium metabolism disorders likewise exacerbate the risk of sepsis thrombosis, acute kidney injury, and metabolic acidosis.7–9 The risk of death is as high as 40% when serum sodium abnormalities are severe. 10 Notably, even borderline sodium disturbances have been shown to adversely affect prognosis. 11 Therefore, monitoring sodium levels helps clinicians to effectively manage patients with sepsis by taking appropriate interventions, such as fluid resuscitation medications.
Sodium has been identified as an important risk factor for mortality in septic patients. Castello 12 and colleagues identified both moderate-to-severe hyponatremia (hazard ratio (HR) = 4.89, 95%CI: 2.38–10.03 vs 1.79, 95%CI: 1.07–3.01) and hypernatremia (HR = 3.52, 95%CI: 1.58–7.82 and 2.14, 95%CI: 1.17–3.92) as independent predictors of 7-day and 30-day mortality. A study 13 of 207,702 ICU patients demonstrated that ICU-acquired hypernatremia (defined as a serum sodium >149 mEq/L) was associated with increased in-hospital mortality and prolonged length of stay. Research by Li 14 found a negative correlation between sodium levels within 102 to 138 mmol/L and 28-day mortality, while levels ranging from 140 to 179 mmol/L were positively associated with increased mortality (OR = 1.04, 95% CI 1.03–1.06, p = 0.0001).
Although previous studies have demonstrated the ability of sodium disorders to influence the prognosis of sepsis patients, accurately typing and individualizing interventions for risk factors remain important challenges. Additionally, sodium levels in sepsis patients are in a state of constant fluctuation. Traditional methods that rely on a single extreme value or static snapshot fail to accurately reflect the pathophysiologic evolution of the patient. Early studies15,16 have shown an association between serum sodium ion fluctuations ≥6 mEq/L and increased 28-day mortality in critically ill surgical patients. A subsequent study in critically ill burn patients also reported similar results. 17 However, it is unclear whether this association applies to hospitalized sepsis patients.
Such methodological limitations may obscure clinically meaningful patterns of sodium fluctuations that may serve as dynamic prognostic indicators. To address heterogeneity in sepsis, recent studies18,19 have utilized cluster analysis to identify distinct patient phenotypes with unique characteristics. These studies have shown that treatment benefits are often confined to specific phenotypes. The presence of hypernatremia in septic patients suggests a severe disturbance in the regulation of water and sodium balance, making fluid resuscitation more complex and difficult.20–22 Therefore, exploring trajectory changes in serum sodium levels in patients with sepsis is warranted to help elucidate chronobiologic patterns and inform fluid resuscitation strategies.
This study aimed to classify distinct serum sodium trajectories among ICU patients with sepsis. The associations between these trajectories and both 28-day and 90-day outcomes were further examined. Furthermore, phenotype-specific risk factors were characterized to facilitate the development of targeted clinical interventions. These results provide novel insights for early intervention and individualized management strategies for this high-risk patient group.
Methods
Data source and ethical approvals
This retrospective study was conducted in accordance with the ethical principles of the Declaration of Helsinki (1975) and its later amendments (revised in 2024). The reporting of this study follows the STROBE guidelines, 23 and the completed checklist is provided as Supplementary File 2. The data was based on the Medical Information Mart for Intensive Care IV (MIMIC-IV, version 3.0), developed by the Laboratory for Computational Physiology at Massachusetts Institute of Technology (MIT; Cambridge, MA, USA). The MIMIC-IV database contains detailed clinical data from over 250,000 hospital admissions at the Beth Israel Deaconess Medical Center in Boston, Massachusetts, spanning the period from 2008 to 2019 (https://mimic.mit.edu/docs/iv/).
Because the database is de-identified and its use has no impact on clinical care, informed consent was not required. We confirm that all patient details have been fully de-identified. Prior to accessing the database, the researcher (ID: 11273841) completed the online course provided by the National Institutes of Health and passed the Protecting Human Research Participants exam, thereby obtaining official authorization to use the MIMIC-IV database.
Study population
ICU patients were identified according to the sepsis 3.0 criteria, and sodium ion time-series data and corresponding detection times within 0–8 days of ICU admission were extracted. A time block of 2 days was used, and the first sodium ion detection value of the patient within 2 days was retained. If a patient had multiple measurements, only the first measurement was used. The Stineman interpolation algorithm was applied to standardize the sodium time-series data to a 48-h resolution. Thus, sodium ion records with less than four times were excluded to ensure accurate differential values. The definition of sepsis 3.0 is based on guidelines, 2 which states that it involves suspected or confirmed infection and an increase in the Sequential Organ Failure Assessment (SOFA) score of ≥ 2 points. The exclusion criteria for this retrospective observational study were as follows: (1) age less than 18 years or more than 80 years; (2) ICU stay less than 3 days; (3) International Classification of Diseases (ICD) information not available; and (4) less than 4 sodium recordings during ICU stay.
Data extraction
Baseline demographic characteristics including age, gender, systolic and diastolic blood pressure, pulse, and heart rate were collected. Disease severity was assessed using the SOFA score, Simplified Acute Physiology Score II (SAPS II), Glasgow Coma Scale, and the Charlson Comorbidity Index. Comorbidities were identified based on ICD codes and included heart failure, chronic kidney disease, liver disease, chronic obstructive pulmonary disease (COPD), stroke, malignancy, and diabetes. Treatment-related variables such as the use of mechanical ventilation, renal replacement therapy, and the presence of atrial fibrillation were also recorded. Laboratory parameters obtained within 24 h prior to ICU admission were extracted, including serum creatinine, blood urea nitrogen, white blood cell count, prothrombin time (PT), activated partial thromboplastin time (APTT), calcium, potassium, and chloride. The presence of septic shock was recorded. Medication use was also recorded, including argipressin, epinephrine, and vasopressin.
Outcome
Short-term and long-term clinical outcomes were collected for the patients. The primary outcome was 28-day mortality, and the secondary outcome was 90-day mortality, referring to deaths occurring within 28 days or 90 days following ICU admission. Other outcomes included survival time, ICU and hospital survival time, ICU, and hospital mortality.
Statistic analysis
Continuous variables were expressed as medians with interquartile ranges (IQRs), and group comparisons were performed using one-way ANOVA or the Kruskal–Wallis H test. Categorical variables were summarized as frequencies and percentages, and analyzed with the Chi-square test or Fisher's exact test, as appropriate. Statistical significance was set at p < 0.05 (two-sided). Covariates with more than 30% missing data were excluded, and multiple imputation was applied to estimate the missing data for the remaining variables.
Latent Class Mixed Models (LCMMs) were used to identify distinct classes based on serum sodium trajectory patterns. This method models longitudinal data using mixed-effects regression while incorporating a latent categorical variable to classify patients into unobserved groups. Models with 2 to 6 latent classes were systematically estimated. Samples were probabilistically assigned to potential categories based on temporal or longitudinal data. The optimal number of classes was determined using the Akaike Information Criterion (AIC), Bayesian Information Criterion (BIC), entropy, and percentage of patients in each category. The percentage of patients in each category must be greater than 5%. The average posterior probability of each category must exceed 70% and the entropy must be greater than 0.7.
Cox proportional risk and logistic regression models were used to assess the association between sodium trajectory and risk of 28- and 90-day mortality. Covariates associated with 28-day mortality were identified, and covariates with p-values less than 0.05 were included in the adjusted models. Model I was adjusted for basic variables, and Model II was adjusted for baseline variables that were significantly different. Model III adjusted for all covariates.
The SHAP algorithm in machine learning was used to perform an interpretable analysis of the 28- and 90-day risk of death for the four trajectory groups, calculating the contribution of each feature to the model outputs and ranking the features in order of importance to the risk of clinical outcomes. The result shows the top 15 features in terms of SHAP values.
Structured Query Language (SQL) scripts were developed and validated using DBeaver (Community Edition 23.1.2). The DBI package in R (version 4.4.3) was used to execute SQL queries, construct the necessary tables within the MIMIC-IV database, and import relevant variables into the R global environment to support data extraction. Trajectory analysis was performed using the LCMM package (version 2.2.1) in R, followed by SHAP analysis implemented in Python (version 3.9.5).
Results
Study cohort
A total of 9697 patients were included in the analysis, and the inclusion and exclusion criteria are illustrated in Figure 1. As the number of latent classes increases, both the AIC and BIC values of the LCMM decline consistently. Entropy values remain above 0.7 for models with two to six classes, and the average posterior probability exceeds 70% across all identified classes. However, subgroups emerging from models with more than five classes each comprise less than 5% of the total population. Based on these criteria, the four-class model was selected as the optimal solution (Supplementary Table 1). The sodium trajectories were characterized as follows: Class 1 (7.06%): U-shaped increase; Class 2 (31.44%): Low-level stable; Class 3 (52.74%): High-level stable; Class 4 (8.76%): Inverted U-shaped decrease (Figure 2).

Flowchart of patient selection in the study.

Sodium trajectories based on LCMM model. LCMM: Latent Class Mixed Model.
Baseline characteristics and outcomes across the trajectories are summarized in Table 1. The 9697 patients had a mean age of 60.79 years, mean survival of 314 days, and ICU mortality of 10%. Of these, 3974 (40.98%) were female. Asian population accounted for 2.61% of population, while Caucasians constituted the largest group at 60.60%. Baseline characteristics differed between trajectory groups. Baseline characteristics varied significantly across trajectory groups. The youngest patients were identified in Class 4, with a median age of 59.0 years (IQR 48.0–68.0), which also had the lowest proportion of females. In contrast, Class 3 exhibited the highest median weight, at 83.62 kg (IQR 69.90–100.00). Kaplan–Meier curves in Figure 3 revealed significant differences in 28-day mortality among the classes (p < 0.001), and Supplementary Figure 1 showed similar divergence in 90-day mortality. Class 1 exhibited the highest mortality at all time points, followed by Class 4. Although mortality rates were comparable between these two classes, their overall survival distributions differed significantly (p < 0.001). Among patients who survived the first 28 days, the risk of subsequent mortality from day 28 to 90 rose in parallel across all classes, indicating a convergence in long-term risk among survivors.

Kaplan–Meier survival curve in different trajectories of 28-day mortality.
Baseline characteristics and outcomes across the trajectories.
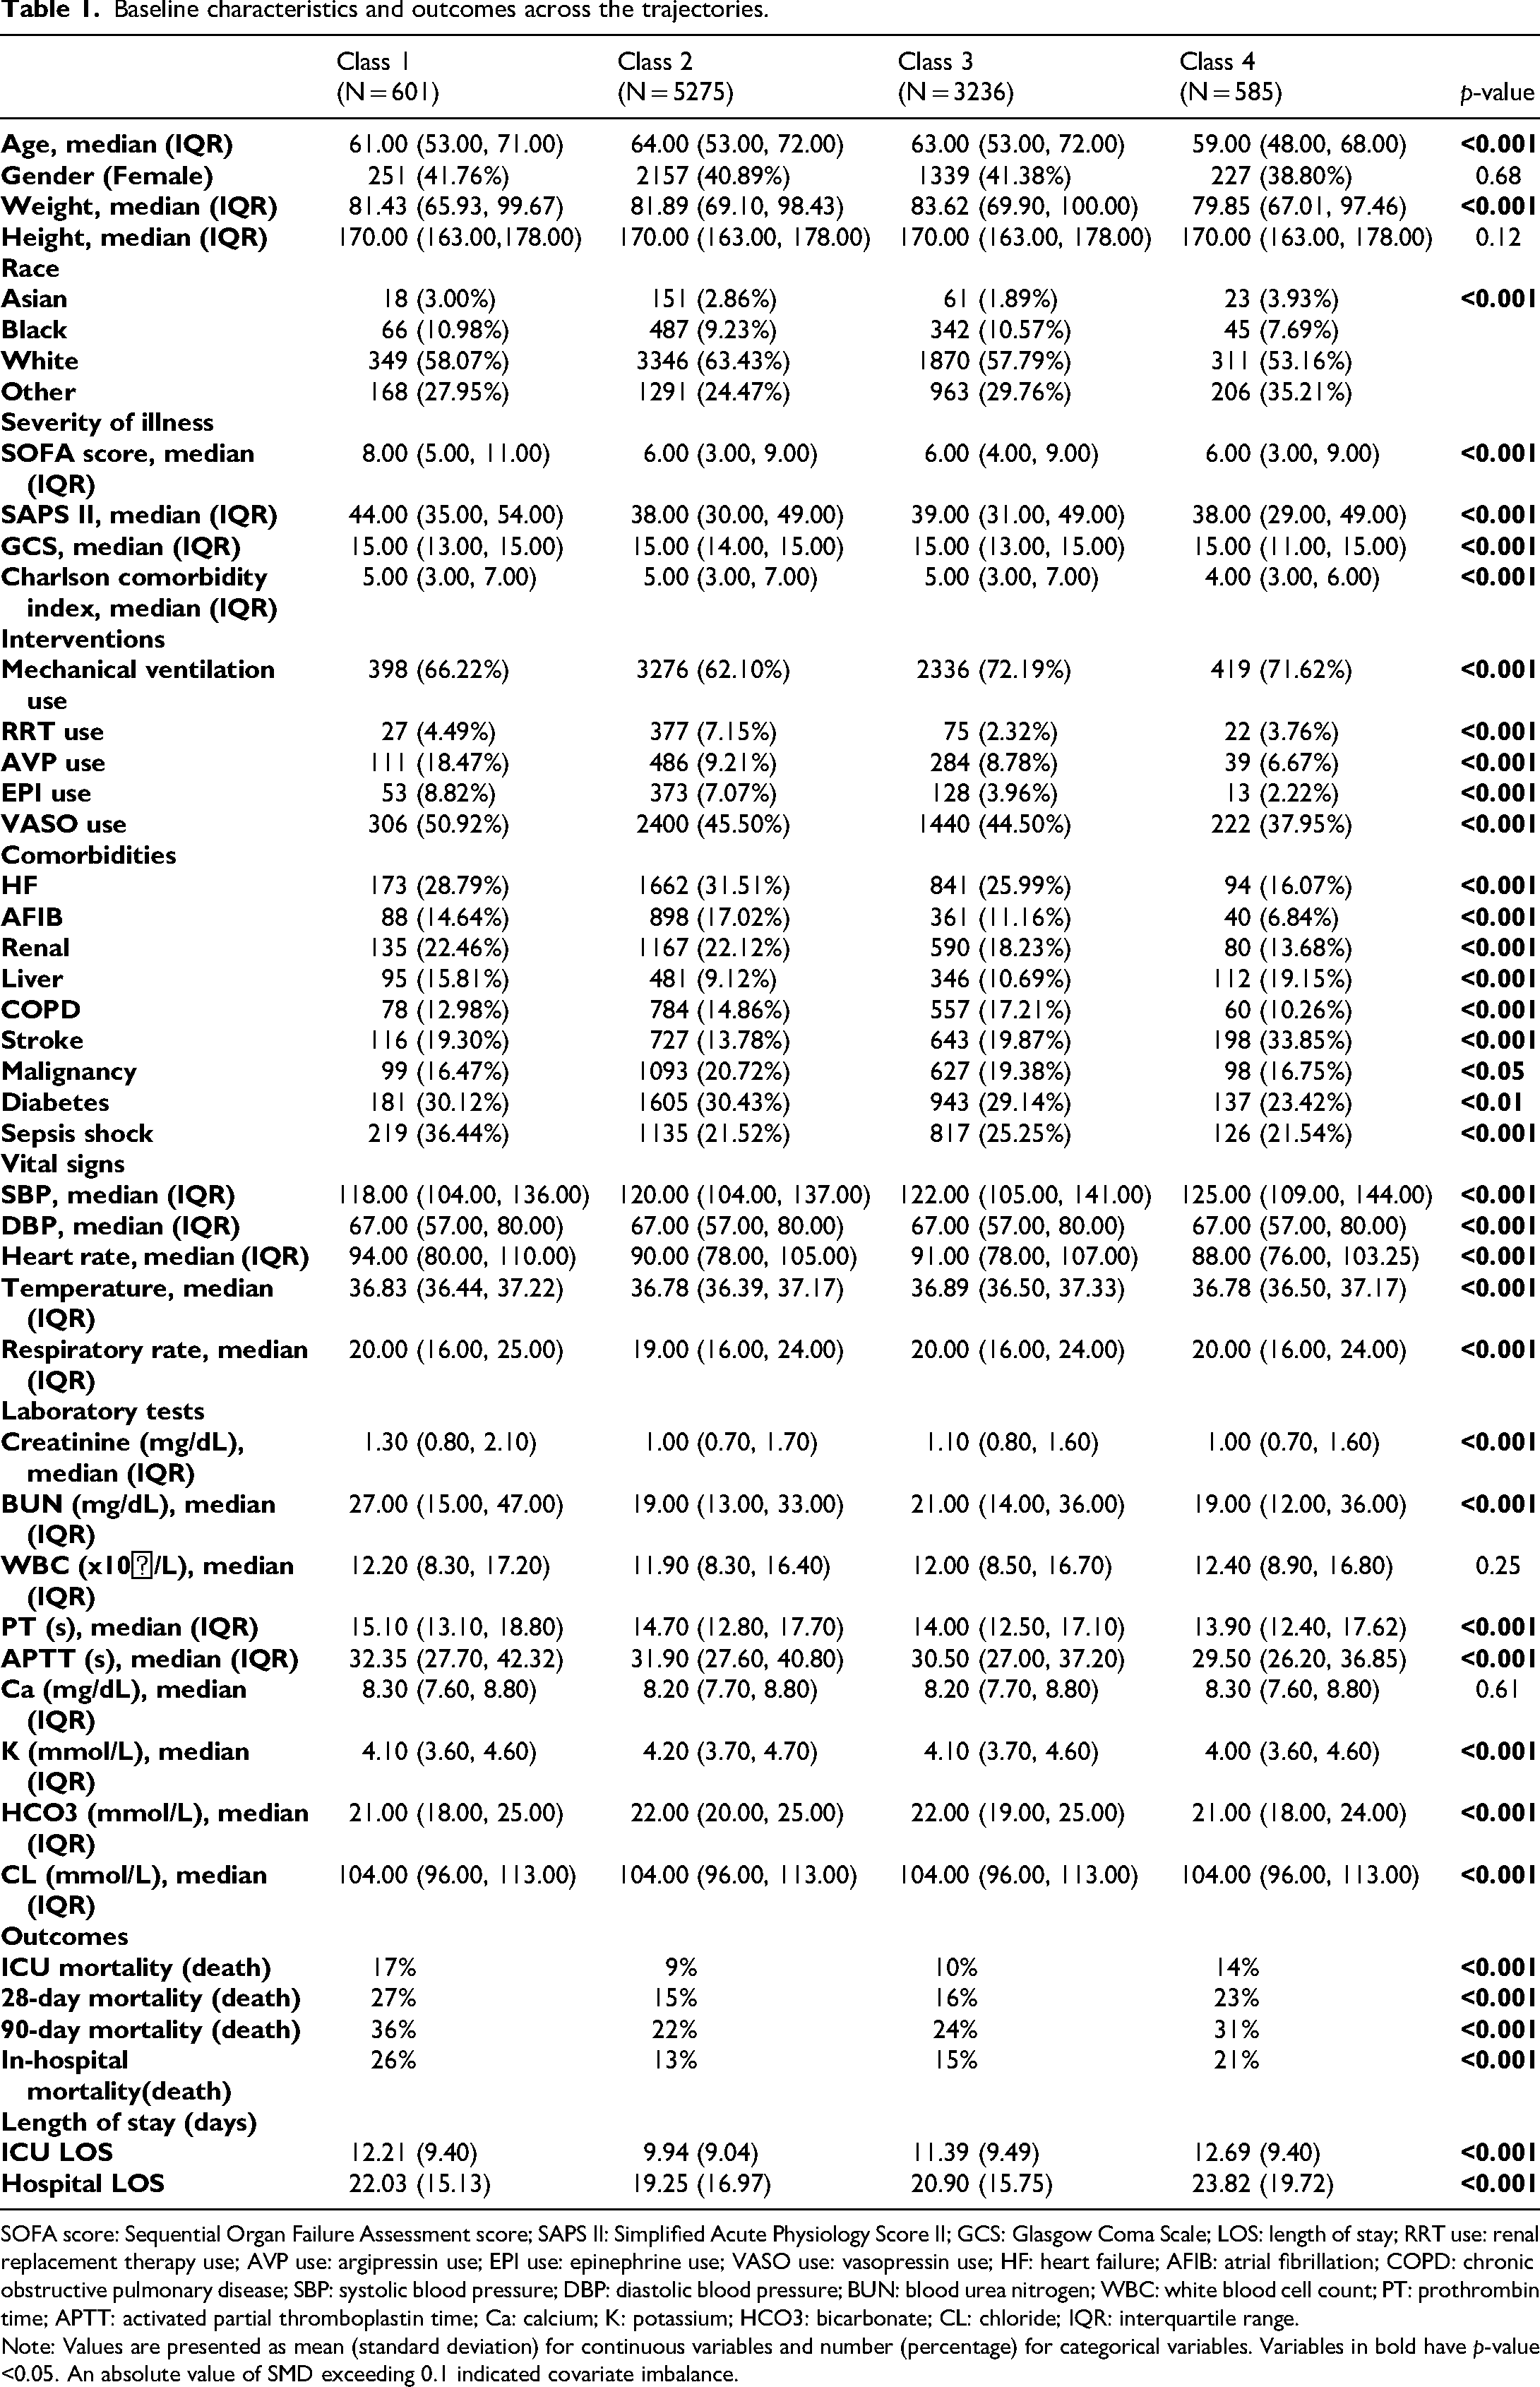
SOFA score: Sequential Organ Failure Assessment score; SAPS II: Simplified Acute Physiology Score II; GCS: Glasgow Coma Scale; LOS: length of stay; RRT use: renal replacement therapy use; AVP use: argipressin use; EPI use: epinephrine use; VASO use: vasopressin use; HF: heart failure; AFIB: atrial fibrillation; COPD: chronic obstructive pulmonary disease; SBP: systolic blood pressure; DBP: diastolic blood pressure; BUN: blood urea nitrogen; WBC: white blood cell count; PT: prothrombin time; APTT: activated partial thromboplastin time; Ca: calcium; K: potassium; HCO3: bicarbonate; CL: chloride; IQR: interquartile range.
Note: Values are presented as mean (standard deviation) for continuous variables and number (percentage) for categorical variables. Variables in bold have p-value <0.05. An absolute value of SMD exceeding 0.1 indicated covariate imbalance.
Independent influence factors of 28-day and 90-day mortality
Class 1 and 4 were associated with increased 28-day and 90-day mortality in all Cox and logistic regression models compared to Class 2, which had the lowest mortality rate in 28-day and 90-day mortality (Table 2). In the fully adjusted Cox model (Model III), Class 3 showed no significant difference from Class 2 for either outcome (p > 0.05). Logistic regression analyses confirmed these findings. These results suggest that both Class 1 (U-shaped increase) and Class 4 (Inverted U-shaped decrease) are independently associated with increased short- and long-term mortality.
Cox and logistic regression analysis for trajectories.

SOFA score: Sequential Organ Failure Assessment score; SAPS II: Simplified Acute Physiology Score II; GCS: Glasgow Coma Scale; RRT use: HF: heart failure; AFIB: atrial fibrillation; COPD: chronic obstructive pulmonary disease; HR: hazard ratio.
The distribution of SHAP values for each feature is presented in Figure 4 and Supplementary Figure 2. Mortality risk drivers exhibited distinct temporal dynamics between 28 and 90 days. In Class 1, early mortality risk was driven by acute physiological markers such as APTT, septic shock, and age, reflecting the influence of compensatory capacity and coagulation function. By day 90, comorbidities dominated mortality risk, while bicarbonate levels at admission also gained importance, underscoring the role of chronic disease burden and metabolic balance in long-term outcomes. In Class 4, the Charlson Comorbidity Index ranked first in both 28-day and 90-day mortality risk, indicating the persistent influence of chronic comorbidities on both short- and long-term prognosis. For Classes 2 and 3, pre-existing comorbidities constituted the key risk factors.
Subgroup analysis

Density scatter plot of the top 15 features by SHAP value. SOFA score: Sequential Organ Failure Assessment score; SAPS II: Simplified Acute Physiology Score II; GCS: Glasgow Coma Scale; VASO: vasopressin use; HF: heart failure; COPD: chronic obstructive pulmonary disease; SBP: systolic blood pressure; DBP: diastolic blood pressure; WBC: white blood cell count; PT: prothrombin time; APTT: activated partial thromboplastin time; Ca: calcium; K: potassium; HCO3: bicarbonate; CL: chloride.
Compared to class2, patients in Class 1 and Class 4 showed significant higher risks in most subgroups (HR > 1 and p < 0.05), with the risk being most pronounced in Class 1 (Table 3 and supplement table 2). The risk of Class 3 was largely comparable to the reference group (p > 0.05), except in a few specific subgroups (not receiving RRT) where it significantly differed. In the subgroup with significant interaction (p < 0.05), Class 1 had similar results to Class 4. The association between trajectory classes and mortality was notably stronger in younger patients (<65 years), those with a lower comorbidity burden (Charlson Index <5), and those with less severe initial illness (SAPS II <35). In particular, HR for Class 1 was significantly higher in patients with a SAPS II score below 35 (HR: 3.47) than in those with a score of 35 or greater (HR: 1.67; p = 0.001). The HR for 90-day mortality was generally attenuated relative to those for 28-day mortality, though the overall risk trends remained consistent, indicating that risk disparities were most pronounced early after admission.
The subgroup analysis based subgroups and 28-day mortality.

SOFA score: Sequential Organ Failure Assessment score; SAPS II: Simplified Acute Physiology Score II; GCS: Glasgow Coma Scale; RRT use: HF: heart failure; AFIB: atrial fibrillation; COPD: chronic obstructive pulmonary disease. Note: Variables in bold have p-value <0.05.
Discussion
This study identified four patterns of sodium trajectory change in ICU patients: Class 1: U-shaped increase; Class 2: Low-level stable; Class 3: High-level stable; Class 4: Inverted U-shaped decrease. Cox and logistic regression analyses indicated that patients in class 1 and class 4 had significantly higher 28- and 90-day mortality. SHAP analysis revealed that mortality in Class 1 was primarily driven by coagulation dysfunction, septic shock, and age, while in Class 4, comorbidities constituted the main risk factor. Subgroup analysis further demonstrated that the association was most pronounced in Class 1, particularly among patients with lower illness severity (SAPS II < 35). Furthermore, the observed attenuation of HRs at 90 days compared to 28 days indicates that the disparities in mortality risk were most acute in the early period following ICU admission.
Currently, various approaches exist to categorize sepsis trajectory sub-phenotypes. Two plasma cortisol sub-phenotypes identified in a cohort of 258 patients were shown to exhibit distinct 28-day and 90-day mortality risks. 24 Takkavatakarn 25 identified eight serum creatinine trajectories in septic patients and demonstrated the associations with key predictors of acute kidney injury in critically ill patients. Sachin et al. 26 identified two common phenotypes based on the trajectories of high-sensitivity C-reactive protein and soluble programmed death-ligand 1 in sepsis patient. Patients exhibiting the malignant inflammatory and immunosuppressive phenotype had significantly higher 1-year mortality (OR = 8.26; 95% CI, 3.45–21.69; p < 0.001). However, studies focusing on ion dynamics over time in septic patients are uncommon. One study 27 reported a U-shaped association between serum calcium and 28-day mortality in patients with sepsis by smoothed spline fitting, with a 12% increased risk of 28-day mortality per unit increase in serum calcium when serum calcium was >9.0 mg/dL (HR, 1.12; 95% CI, 1.04–1.20). Our study introduced a novel perspective on sepsis heterogeneity by distinguishing sub-phenotypes according to sodium level trajectory patterns. Future studies should focus on these high-risk trajectory groups to assess in detail their association with clinical events. Further research is also needed to determine how changes in trajectory factors influence patient outcomes.
Previous studies 12 have shown that both hypernatremia and moderate-to-severe hyponatremia independently predict short-term mortality in septic patients. Thongprayoon et al. 28 also reported that fluctuations in sodium exceeding 6 mEq/L between measurements were independent predictors of increased short- and long-term mortality risk in hospitalized adults. However, these studies did not further investigate the relationship between dynamic sodium ion changes over time and mortality risk. Although one study 29 examined the relationship between short-term serum sodium trajectories and 30-day mortality in patients with lactic acidosis and sepsis, it found a higher survival rate among those with stable serum sodium. This study analyzed sodium trajectories over a longer time span in a broader sepsis population with a larger sample size. We identified two high-risk sub-phenotypes (Class 1 and Class 4) and demonstrated associations between elevated mortality and factors such as acute physiological disturbances, comorbidities, and coagulation dysfunction. These findings suggest that closer clinical monitoring and personalized management are warranted for these vulnerable subgroups.
In our study, Class 1 patients exhibited the highest short-term and long-term mortality risks. This trajectory pattern may reflect an initial low sodium state, followed by rapid fluid resuscitation or overcorrection, leading to osmotic fluctuations and exacerbating cellular damage. Studies have shown that the efficacy of sodium bicarbonate in treating metabolic acidosis caused by sepsis/septic shock remains controversial. 30 A study by Zhang 31 found that sodium bicarbonate use was not significantly associated with the prognosis of septic patients with general metabolic acidosis, showing potential benefit only in patients with acute kidney injury stage 2 or 3 and pH < 7.2 (HR = 0.74; 95% CI 0.51–0.86; p = 0.021). This suggests that bicarbonate therapy is specific and may be limited to severe acidotic states. Notably, patients in class 1 received vasoactive drugs most frequently. Although SHAP analysis did not identify these agents as major direct drivers of mortality in the overall model, it indicates that they serve as markers rather than independent predictors of disease severity. Further analysis revealed that vasopressin use was independently associated with increased 90-day mortality, suggesting a potential safety signal that warrants further investigation.
The influence of hormones introduces further complexity in sepsis. Adrenocortical insufficiency is common in septic patients, and cortisol levels correlate with both disease severity and clinical outcomes. 32 Administering exogenous hormones 33 can alter immune cell and mitochondrial activity, rendering the use of corticosteroids such as hydrocortisone controversial in sepsis management. Although sodium fluctuations might indirectly reflect hormonal changes, existing evidence does not sufficiently establish a direct causal link between specific hormone levels and sodium concentrations. Consequently, the elevated incidence of hypernatremia may partially stem from iatrogenic factors, including fluid management and hormonal therapies. This underscores the importance of meticulous care in critically ill patients and thorough risk-benefit evaluation of pharmacological interventions.
The elevated mortality risk in Class 1 was mainly associated with coagulation disorders, which is consistent with the pathophysiological features of sepsis-associated disseminated intravascular coagulation. 34 A retrospective study by Han Y 35 showed that elevated serum sodium levels independently correlated with sepsis-induced coagulopathy (OR = 1.127, p = 0.001), though it did not explore how temporal changes in sodium influenced mortality. Sodium's role in coagulation has been studied for over two decades. 36 As a thrombin activator, it binds to specific sites to enhance thrombin activity and generate osmotic stimuli. However, high sodium levels might damage the endothelial glycocalyx, 37 inducing coagulation disorders. One study 38 pointed out that elevated serum sodium was related to Platelet, PT, and fibrinogen, but not significantly to APTT and D-dimer. In contrast, our study found that APTT as a key predictor of mortality in Class 1, a finding that may result from our more refined sodium trajectory grouping.
Subgroup analysis indicated that Class 1 had a greater impact on mortality risk in younger patients, which differs from previous studies. Maryam's research 39 showed that sodium variability (SD ≥3 mmol/L) had prognostic value in older patients by increasing mortality risk. In contrast, similar fluctuations in younger patients were often less significant, as they were frequently driven by treatment factors like fluid resuscitation. The difference may arise because drastic sodium fluctuations are less common in younger individuals, and when they do occur, the prognosis is worse. Meanwhile, Class 1 fluctuation was associated with a higher risk of death in patients at lower risk with SAPS II score < 35 (HR 3.47 vs. 1.67, p = 0.001), which is consistent with the following findings. Although basal 28-day mortality was lower in patients without RRT use, heart failure, COPD, and malignancy, Class 1 sodium fluctuations were associated with a higher relative risk of death. This phenomenon may suggest that acute sodium fluctuations have a more dramatic impact on the body in the absence of buffering mechanisms in chronic diseases and predispose to serious physiological disturbances and adverse outcomes. 40 In contrast, patients with underlying diseases may have been identified early as being at high risk for more aggressive surveillance and intervention. This suggests that it is critical that we correct sodium disturbances too quickly, especially in patients with a better basal state. Too rapid correction of hyponatremia may lead to osmotic demyelination, while too slow can exacerbate organ damage. 41
This study boasts several strengths: First, an integrative analysis of sodium trajectory patterns, Cox regression, SHAP interpretation, and subgroup analyses offered new insights into mortality risk in sepsis patients. Second, SHAP analysis further identified key predictive features and potential mechanisms related to sodium fluctuations. Third, these findings indicate that early sodium trajectory trends have prognostic value and could serve as dynamic early warning indicators in clinical practice. Subsequent studies might develop simplified models that use early inflection points to support more timely risk stratification. Importantly, this trajectory model captures longitudinal dynamics, providing a distinct advantage over conventional systems such as SOFA by uncovering pathophysiological processes that may otherwise go undetected.
This study also has some limitations. First, due to its retrospective nature, potential confounding factors cannot be excluded. Second, although the study is based on large-scale ICU data, patient populations across different hospitals and regions may vary, and the external generalizability of the results needs to be validated. Third, there is a potential risk of selection bias and immortal time bias like any method for analyzing time-series trajectories. Because it systematically excludes patients who die prematurely or are too ill to be tested frequently. Forth, although SHAP analysis provides valuable model explanations, the formation mechanisms of sodium ion trajectory patterns require further experimental research and validation. Finally, this retrospective study design precludes any assessment of causality. Future studies should prioritize multicenter prospective designs to validate the reproducibility of our trajectory subtypes and assess the effectiveness of subtype-targeted treatments. Concurrently, efforts are needed to develop simplified models for earlier risk stratification by identifying key inflection points. Crucially, these endeavors must employ advanced statistical methods, such as inverse probability weighting, to account for selection and immortal time biases inherent in longitudinal analyses.
Conclusion
This retrospective cohort study identified four sodium ion trajectory groups with different clinical phenotypes in septic patients over time. Furthermore, key mortality risk factors were identified. Monitoring sodium levels and targeting the management of death risk factors can provide valuable insights for clinical decision-making and promote the implementation of individualized management strategies.
Supplemental Material
sj-doc-1-sci-10.1177_00368504251392602 - Supplemental material for Association between sodium level trajectories and clinical prognosis in patients with sepsis: A longitudinal retrospective cohort study
Supplemental material, sj-doc-1-sci-10.1177_00368504251392602 for Association between sodium level trajectories and clinical prognosis in patients with sepsis: A longitudinal retrospective cohort study by Ke-Xin Sun, Chen Cui, Zhen Yan, Fei Mu, Meng Tang, Rui Gong, Jin-Yi Zhao and Jing-Wen Wang in Science Progress
Footnotes
Acknowledgements
None.
Ethical considerations
Ethics approval was not required for this research.
Author's contributions
JYZ and KXS conceived and designed the study; CC, TM, and KXS collected the data and analyzed it; ZY and FM rigorously revised the manuscript; JWW and RG supervised the study. JYZ and JWW made identical contributions to this manuscript as co-corresponding authors.
Funding
The author(s) disclosed receipt of the following financial support for the research, authorship, and/or publication of this article: This study was supported by the National Nature Science Foundation of China (82203190, 72074218, 82400418), the Innovative Talent Promotion Project of Shaanxi Province (2023-CX-TD-76), and the Shaanxi Provincial Health Research Innovation Capacity Enhancement Program (2023 PT-10).
Declaration of conflicting interests
The authors declared no potential conflicts of interest with respect to the research, authorship, and/or publication of this article.
Data availability statement
The MIMIC-IV database is publicly available on PhysioNet (https://www.physionet.org/). Concepts codes are available in the MIMIC Code Repository (![]() ).
).
Supplemental material
Supplemental material for this article is available online.
References
Supplementary Material
Please find the following supplemental material available below.
For Open Access articles published under a Creative Commons License, all supplemental material carries the same license as the article it is associated with.
For non-Open Access articles published, all supplemental material carries a non-exclusive license, and permission requests for re-use of supplemental material or any part of supplemental material shall be sent directly to the copyright owner as specified in the copyright notice associated with the article.