
Abstract
Background
Red cell distribution width (RDW) has been identified as a potential prognostic marker in multiple cardiovascular and critical illnesses. Nevertheless, its prognostic value, particularly regarding changes in RDW over time among patients with atrial fibrillation (AF), remains uncertain.
Methods
A retrospective cohort study was conducted using data from the Medical Information Mart for Intensive Care (MIMIC)-IV database. The study included adult intensive care unit (ICU) patients with AF who had at least three RDW measurements within the first 36 h of ICU admission. Latent growth mixture modeling (LGMM) was applied to identify distinct RDW progression patterns over time. The association between the identified RDW trajectory groups and 28-day mortality was assessed using Cox proportional hazard regression. Kaplan–Meier survival curves and subgroup analyses were also conducted.
Results
A total of 3509 patients were enrolled in the analysis. LGMM identified three distinct RDW trajectories: Class 1 (stable and low RDW), Class 2 (moderate with a rising RDW) and Class 3 (high with fluctuating RDW). After adjusting for demographics, clinical parameters, comorbidities and treatments, Class 2 remained independently associated with higher 28-day mortality compared with Class 1 (P = 0.003). No significant difference was observed between Class 3 and Class 1. Kaplan–Meier analysis confirmed significant differences in survival among the classes (P < 0.001). Subgroup analysis showed consistent associations without significant interactions.
Conclusion
RDW trajectory patterns are independently associated with 28-day mortality in critically ill AF patients and may serve as valuable prognostic indicators in this population.
Keywords
Introduction
Atrial fibrillation (AF) is the most common sustained arrhythmia, defined by rapid, disorganized atrial activity and an irregular ventricular response. Symptoms range from being absent to presenting as palpitations, fatigue or dizziness. AF substantially increases the risk of stroke and heart failure. Approximately 5%–35% of cases are asymptomatic yet carry comparable risks. The prevalence of AF is estimated at 0.4%–2% in the general population and rises to over 8% in individuals older than 80 years, with higher rates reported in men and those of European ancestry. As the population ages, AF prevalence is expected to continue increasing, with projections exceeding 12 million cases in the United States by 2050.1–3
Red cell distribution width (RDW) is a routine hematological parameter reflecting variability in red blood cell size, traditionally applied in the differential diagnosis of anemia. In recent years, numerous studies have demonstrated that elevated RDW is not confined to hematologic disorders but is also frequently observed in chronic diseases, especially cardiovascular conditions. RDW is regarded as a comprehensive biomarker that reflects diverse pathophysiological processes, including oxidative stress, chronic low-grade inflammation, impaired erythropoiesis and tissue hypoxia.4,5 In conditions such as atherosclerosis, myocardial infarction, AF and heart failure, elevated RDW levels are associated with disease progression, poor therapeutic response and increased mortality risk.5,6 RDW is also influenced by factors including age, inflammatory markers (e.g. IL-6), metabolic status and nutritional state, reflecting characteristics closely linked to biological aging. 7
RDW has been recognized as an important prognostic marker in various critical illnesses. Previous studies have shown that the RDW-to-albumin ratio (RDW/Alb) is an effective predictor of short-term outcomes, including 30- and 90-day mortality, particularly in patients with sepsis, and may outperform several traditional indicators. 8 In elderly patients with sepsis, RDW is also an independent predictor of mortality. 9 In addition, elevated RDW levels are significantly associated with mid-term mortality in patients with acute heart failure. 10 It can also predict both short-term and long-term mortality risks in intensive care unit (ICU) patients with AF. 11 Studies have further demonstrated that elevated RDW independently predicts the severity of acute ischemic stroke and unfavorable functional outcomes within three months. 12 In a recent cohort study based on the Medical Information Mart for Intensive Care (MIMIC)-IV database, a lower hemoglobin-to-RDW ratio (HRR) was independently associated with higher 28- and 90-day mortality in patients with coexisting heart failure and acute kidney injury, underscoring its prognostic value in high-risk ICU populations. 13
While previous studies have associated elevated RDW levels with adverse outcomes in patients with AF, they have primarily focused on single, static RDW measurements. However, systematic research on the association between RDW trajectories and prognosis in AF patients remains limited. This study aimed to investigate this relationship to provide new insights into risk assessment and potential guidance for clinical decision-making. Accordingly, we examined the association between RDW trajectory patterns and 28-day mortality in AF patients using data from the MIMIC-IV database. Understanding this association may improve risk stratification and support more informed clinical management in critically ill patients with AF.
Materials and methods
Data source
This study was conducted using the MIMIC-IV database, a publicly available resource containing de-identified data from over 60,000 ICU admissions at the Beth Israel Deaconess Medical Center between 2008 and 2022. 14 All patient-related information used in this study was fully de-identified prior to analysis. No personal identifiers were accessed or included in the dataset, in compliance with Health Insurance Portability and Accountability Act (HIPAA) regulations and the data usage agreement for the MIMIC-IV database. The database provides detailed clinical information including demographics, vital signs, laboratory results, diagnoses and outcomes. Author Huan Zuo completed the required training and certification, obtained access to the database and was responsible for data extraction and processing in accordance with the data use agreement (Record ID: 65378168 (for HZ)). This study was conducted in accordance with the ethical principles outlined in the Declaration of Helsinki, as revised in 2024. As this study is retrospective and based on publicly available data, informed consent was not required. The methodology and reporting of our study follow the principles outlined in the Strengthening the Reporting of Observational Studies in Epidemiology (STROBE) guidelines. 15
Inclusion and exclusion criteria
Patients diagnosed with AF were identified in the MIMIC-IV version 3.1 database using standardized codes from the International Classification of Diseases, ninth and tenth revisions (ICD-9 and ICD-10). To evaluate the prognostic significance of RDW trajectories, several exclusion criteria were applied to ensure data integrity and clinical relevance: (1) age <18 or >100 years; (2) ICU stay <36 h; (3) absence of RDW measurements obtained at ≤12-h intervals within the first 36 h of ICU admission; and (4) ICU admissions other than the patient's first during the current hospitalization. After applying these criteria, the final study cohort was established (Figure 1).

Flowchart of atrial fibrillation patient inclusion and classification.
Outcome
The primary outcome of this study was 28-day all-cause in-hospital mortality. Follow-up began at the time of ICU admission and continued until in-hospital death or discharge, whichever occurred first.
Data collection
Clinical data were extracted from the MIMIC-IV v3.1 database using PostgreSQL with structured SQL queries. Only variables documented within the first 24 h of ICU admission were included to ensure consistency and reduce potential confounding from disease progression or clinical interventions. The collected variables comprised demographics (age, sex, race), vital signs (heart rate; systolic, diastolic and mean arterial pressure; respiratory rate; temperature; peripheral oxygen saturation (SpO2)) and laboratory parameters (glucose, international normalized ratio (INR), prothrombin time (PT), partial thromboplastin time (PTT), white blood cell count (WBC), mean corpuscular hemoglobin concentration (MCHC), red blood cell count (RBC), platelets, mean corpuscular volume (MCV), mean corpuscular hemoglobin (MCH), hemoglobin, hematocrit, blood urea nitrogen (BUN), potassium, sodium, creatinine, chloride, anion gap, bicarbonate, calcium). Severity scores, including Sequential Organ Failure Assessment (SOFA), Simplified Acute Physiology Score (SAPS) II, Glasgow Coma Scale (GCS) and the Charlson Comorbidity Index, were also obtained. Comorbidities were identified using ICD codes and encompassed acute kidney injury (AKI), myocardial infarction, liver disease, paraplegia, chronic kidney disease, congestive heart failure, peripheral vascular disease, cerebrovascular disease, dementia, chronic pulmonary disease, rheumatic disease, peptic ulcer disease, diabetes, hyperlipidemia and hypertension. Treatment-related variables included the use of vasopressors, aspirin, warfarin, mechanical ventilation and continuous renal replacement therapy (CRRT), which were recorded as binary indicators.
Latent growth mixture modeling
RDW values were collected at 12, 24 and 36 h following ICU admission. To identify distinct RDW trajectory patterns over the first 36 h, latent growth mixture modeling (LGMM) was applied using the "lcmm" package in R. This method assumes that the population comprises unobserved (latent) subgroups, each following a unique time-based trajectory characterized by different patterns of change over time.
A series of quadratic growth models with one to seven latent classes were fitted to capture potential nonlinear trends in RDW trajectories. 16 Both the fixed effects and the class-specific (mixture) effects included linear and quadratic time terms (time and time 2 ). Random effects were specified on the intercept and linear slope (random = ∼1 + time), with a full covariance structure (idiag = FALSE). To allow for heteroskedasticity across classes, class-specific residual variances were estimated (nwg = TRUE). All models were fitted using maximum likelihood estimation, and only complete-case data were included due to limitations in handling missing data within the lcmm package. Model convergence was assessed using default criteria, including thresholds for parameter stability, log-likelihood changes and second derivatives, all of which were satisfied in the final models.
Model selection was based on a combination of statistical fit indices and clinical interpretability. Specifically, the evaluation considered the following: (1) lower values of the Akaike information criterion (AIC), Bayesian information criterion (BIC) and sample-size-adjusted BIC; (2) higher log-likelihood and entropy values (entropy ≥ 0.7 indicating good classification); (3) each class comprising at least 1% of the total sample; (4) average posterior probabilities (APPAs) for class membership ≥ 70%; and (5) selection of the most parsimonious model with clinically meaningful trajectories.
Statistical analysis
All statistical analyses were conducted using R software. Continuous variables were summarized as mean ± standard deviation (SD) or median (interquartile range, IQR), depending on distribution. Categorical variables were presented as frequencies and percentages. Group comparisons were performed using one-way ANOVA or Kruskal–Wallis tests for continuous variables and chi-square or Fisher's exact tests for categorical variables. LGMM was applied to identify distinct RDW trajectory patterns within the first 36 h of ICU admission. The optimal number of latent classes was determined according to model fit indices, including AIC, BIC, entropy and class distribution. Cox proportional hazard regression was used to evaluate the association between RDW trajectory groups and 28-day in-hospital mortality in AF patients. Three models were constructed: Model 1 (unadjusted); Model 2 (adjusted for age, sex and race); and Model 3 (further adjusted for variables significant in univariate analysis, P < 0.05). Each trajectory class was sequentially used as the reference group for pairwise comparisons. Kaplan–Meier curves were generated to illustrate 28-day survival across trajectory groups, with differences assessed using the log-rank test. Subgroup analyses were performed to explore potential interactions with age, sex and comorbidities. All tests were two-sided, and P < 0.05 was considered statistically significant. Results were reported as hazard ratios (HRs) with corresponding 95% confidence intervals (CIs).
Result
Identification of RDW trajectory classes using LGMM
LGMM was applied to identify RDW trajectory patterns during the first 36 h of ICU admission in patients with AF. Model fit indices for one- to seven-class solutions are presented in Table 1a. As the number of classes increased, AIC and BIC values decreased, indicating improved model fit. The three-class model provided a better fit than the two-class model, with lower AIC (26,149.24 vs. 27,075.09), lower BIC (26,254.01 vs. 27,149.04) and an acceptable entropy value of 0.714, indicating good classification accuracy. The three patient groups exhibited distinct longitudinal patterns of RDW change. The APPAs for each class were 0.883, 0.868 and 0.877, all exceeding 0.86, indicating high classification accuracy of the model. Further analysis showed that 90.7%, 80.9% and 84.4% of individuals in Classes 1, 2 and 3, respectively, had posterior probabilities greater than 0.7, supporting the reliability of the classification.(Table 1b). Although models with four or more classes showed further statistical gains, they included classes with fewer than 2% of patients, limiting clinical relevance. Thus, based on model fit, entropy, class size and interpretability, the three-class model was selected for subsequent analysis.
Model fit indices for latent class trajectory models based on RDW levels in patients with AF.
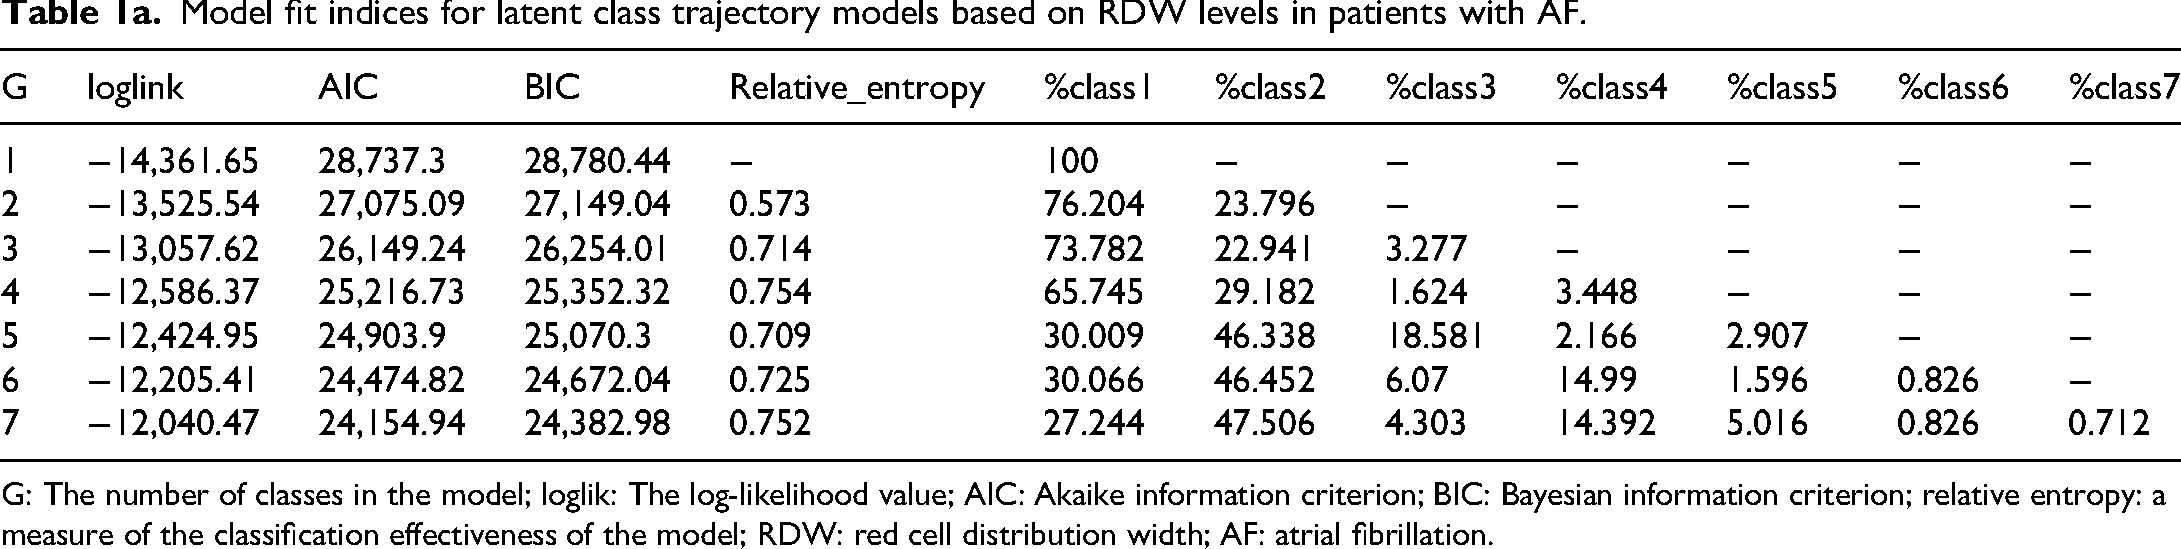
G: The number of classes in the model; loglik: The log-likelihood value; AIC: Akaike information criterion; BIC: Bayesian information criterion; relative entropy: a measure of the classification effectiveness of the model; RDW: red cell distribution width; AF: atrial fibrillation.
APPAs and classification accuracy by latent class.

APPA: average posterior probability of class assignment. Higher APPA values and higher percentages of individuals with a posterior probability of >0.7 or >0.8 are indicative of better classification quality. Values above 0.7 are generally considered acceptable for latent class models.
Figure 2 depicts the class-specific mean predicted RDW trajectories during the first 36 h of ICU admission, derived from the three-class latent growth mixture model. Class 1 (black line), representing the majority of patients, was characterized by consistently low and stable RDW levels throughout the observation period. Class 2 (red line) demonstrated persistently moderate RDW levels with a slight upward trend. In contrast, Class 3 (green line) exhibited high initial RDW values, followed by a marked increase peaking at approximately 20 h, and then a gradual decline thereafter. These distinct temporal patterns highlight the heterogeneity of RDW dynamics in AF patients during the early ICU stay and may reflect differences in inflammatory status, erythropoiesis or disease severity across subgroups.

Predicted RDW trajectories over time by class.
Baseline differences among RDW trajectories and univariate analysis of 28-day mortality
Significant differences (P < 0.05) were observed among the three RDW trajectory classes with respect to sex, race, vital signs (heart rate, blood pressure, respiratory rate, temperature, SpO2) and key laboratory parameters (e.g. glucose, INR, PT, PTT, red blood cell indices, BUN, creatinine, chloride, anion gap). Differences were also noted in severity scores (SOFA, SAPS II, GCS, CCI), comorbidities (liver disease, chronic kidney disease, heart failure, vascular disease, peptic ulcer disease, diabetes, hyperlipidemia, hypertension) and treatments (vasopressors, aspirin, warfarin, CRRT). Furthermore, the 28-day length of hospital stay and mortality differed significantly across the classes (P < 0.001) (Table 2).
Clinical characteristics and outcomes by RDW trajectory in AF patients.

SBP: systolic blood pressure; DBP: diastolic blood pressure; MBP: mean blood pressure; SpO2: peripheral oxygen saturation; INR: international normalized ratio; PT: prothrombin time; PTT: partial thromboplastin time; WBC: white blood cell count; MCHC: mean corpuscular hemoglobin concentration; RBC: red blood cell count; MCV: mean corpuscular volume; MCH: mean corpuscular hemoglobin; BUN: blood urea nitrogen; SOFA: Sequential Organ Failure Assessment; SAPSII: Simplified Acute Physiology Score II; GCS: Glasgow Coma Scale; AKI: acute kidney injury; CRRT: continuous renal replacement therapy.
Univariate Cox regression identified several variables significantly associated with 28-day in-hospital mortality (P < 0.05). A higher mortality risk was associated with non-White race, AKI, liver disease, paraplegia, heart failure, cerebrovascular disease, dementia, use of vasopressors and CRRT, as well as higher values of age, heart rate, respiratory rate, INR, PT, PTT, WBC, MCV, BUN, potassium, creatinine, anion gap, SOFA, SAPS II, and Charlson Comorbidity Index. Lower mortality was associated with male sex, hyperlipidemia, use of aspirin and warfarin, and higher levels of SpO2, MCHC, chloride, bicarbonate and GCS (Table 3).
Univariate Cox regression analysis of 28-day mortality in patients with AF.

HR: hazard ratio; CI: confidence interval; AKI: acute kidney injury; CRRT: continuous renal replacement therapy; SpO2: peripheral oxygen saturation; INR: international normalized ratio; PT: prothrombin time; PTT: partial thromboplastin time; WBC: white blood cell count; MCHC: mean corpuscular hemoglobin concentration; MCV: mean corpuscular volume; BUN: blood urea nitrogen; SOFA: Sequential Organ Failure Assessment; SAPS II: Simplified Acute Physiology Score II; GCS: Glasgow Coma Scale.
Association between RDW trajectories and 28-day mortality
Table 4 summarizes the relationship between RDW trajectory classes and 28-day in-hospital mortality. Compared to Class 1, Class 2 showed a significantly higher mortality risk in both the unadjusted model (HR = 1.90, 95% CI: 1.64–2.20, P < 0.001) and the model adjusted for age, sex and race (HR = 1.91, 95% CI: 1.65–2.21, P < 0.001). This association remained significant after full adjustment for clinical factors, comorbidities and treatments (HR = 1.27, 95% CI: 1.09–1.49, P = 0.003). No significant mortality difference was found between Class 3 and Class 1 in any model (all P > 0.05).
Multivariate Cox regression analysis of RDW trajectories and 28-day mortality in AF.

HR: hazard ratio; CI: confidence interval.
Model 1: Crude.
Model 2: Adjust gender, age, race.
Model 3: Adjust gender, age, race, heart_rate, resp_rate, SpO2, INR, PT, PTT, WBC, MCHC, MCV, BUN, potassium, creatinine, chloride, anion gap, bicarbonate, SOFA, SAPSII, GCS, charlson_comorbidity_index, AKI, liver_disease, paraplegia, congestive_heart_failure, cerebrovascular_disease, dementia, hyperlipidemia, vasopressin, aspirin, warfarin, CRRT
Survival analysis by RDW trajectory classes
Kaplan–Meier survival curves demonstrated significant differences in 28-day in-hospital survival across the three RDW trajectory classes (Figure 3). Patients in Class 1 showed the highest survival probability, followed by Class 3 and then Class 2, which had the lowest survival throughout the observation period. The log-rank test confirmed that the difference among the three groups was statistically significant (P < 0.001).

Survival curves of atrial fibrillation patients stratified by RDW trajectory classes.
Subgroup analysis of RDW trajectories and 28-day mortality
Subgroup analyses were performed to evaluate the association between RDW trajectory classes and 28-day mortality across clinical strata, including sex, age, diabetes and hypertension (Figure 4). The associations between RDW trajectories and mortality were generally consistent across subgroups. No significant interactions were observed for sex (P = 0.67), diabetes (P = 0.448) or hypertension (P = 0.426). A borderline interaction was observed for age group (P = 0.091), suggesting a potential differential effect between patients aged ≤65 and those >65 years, although this did not reach statistical significance.
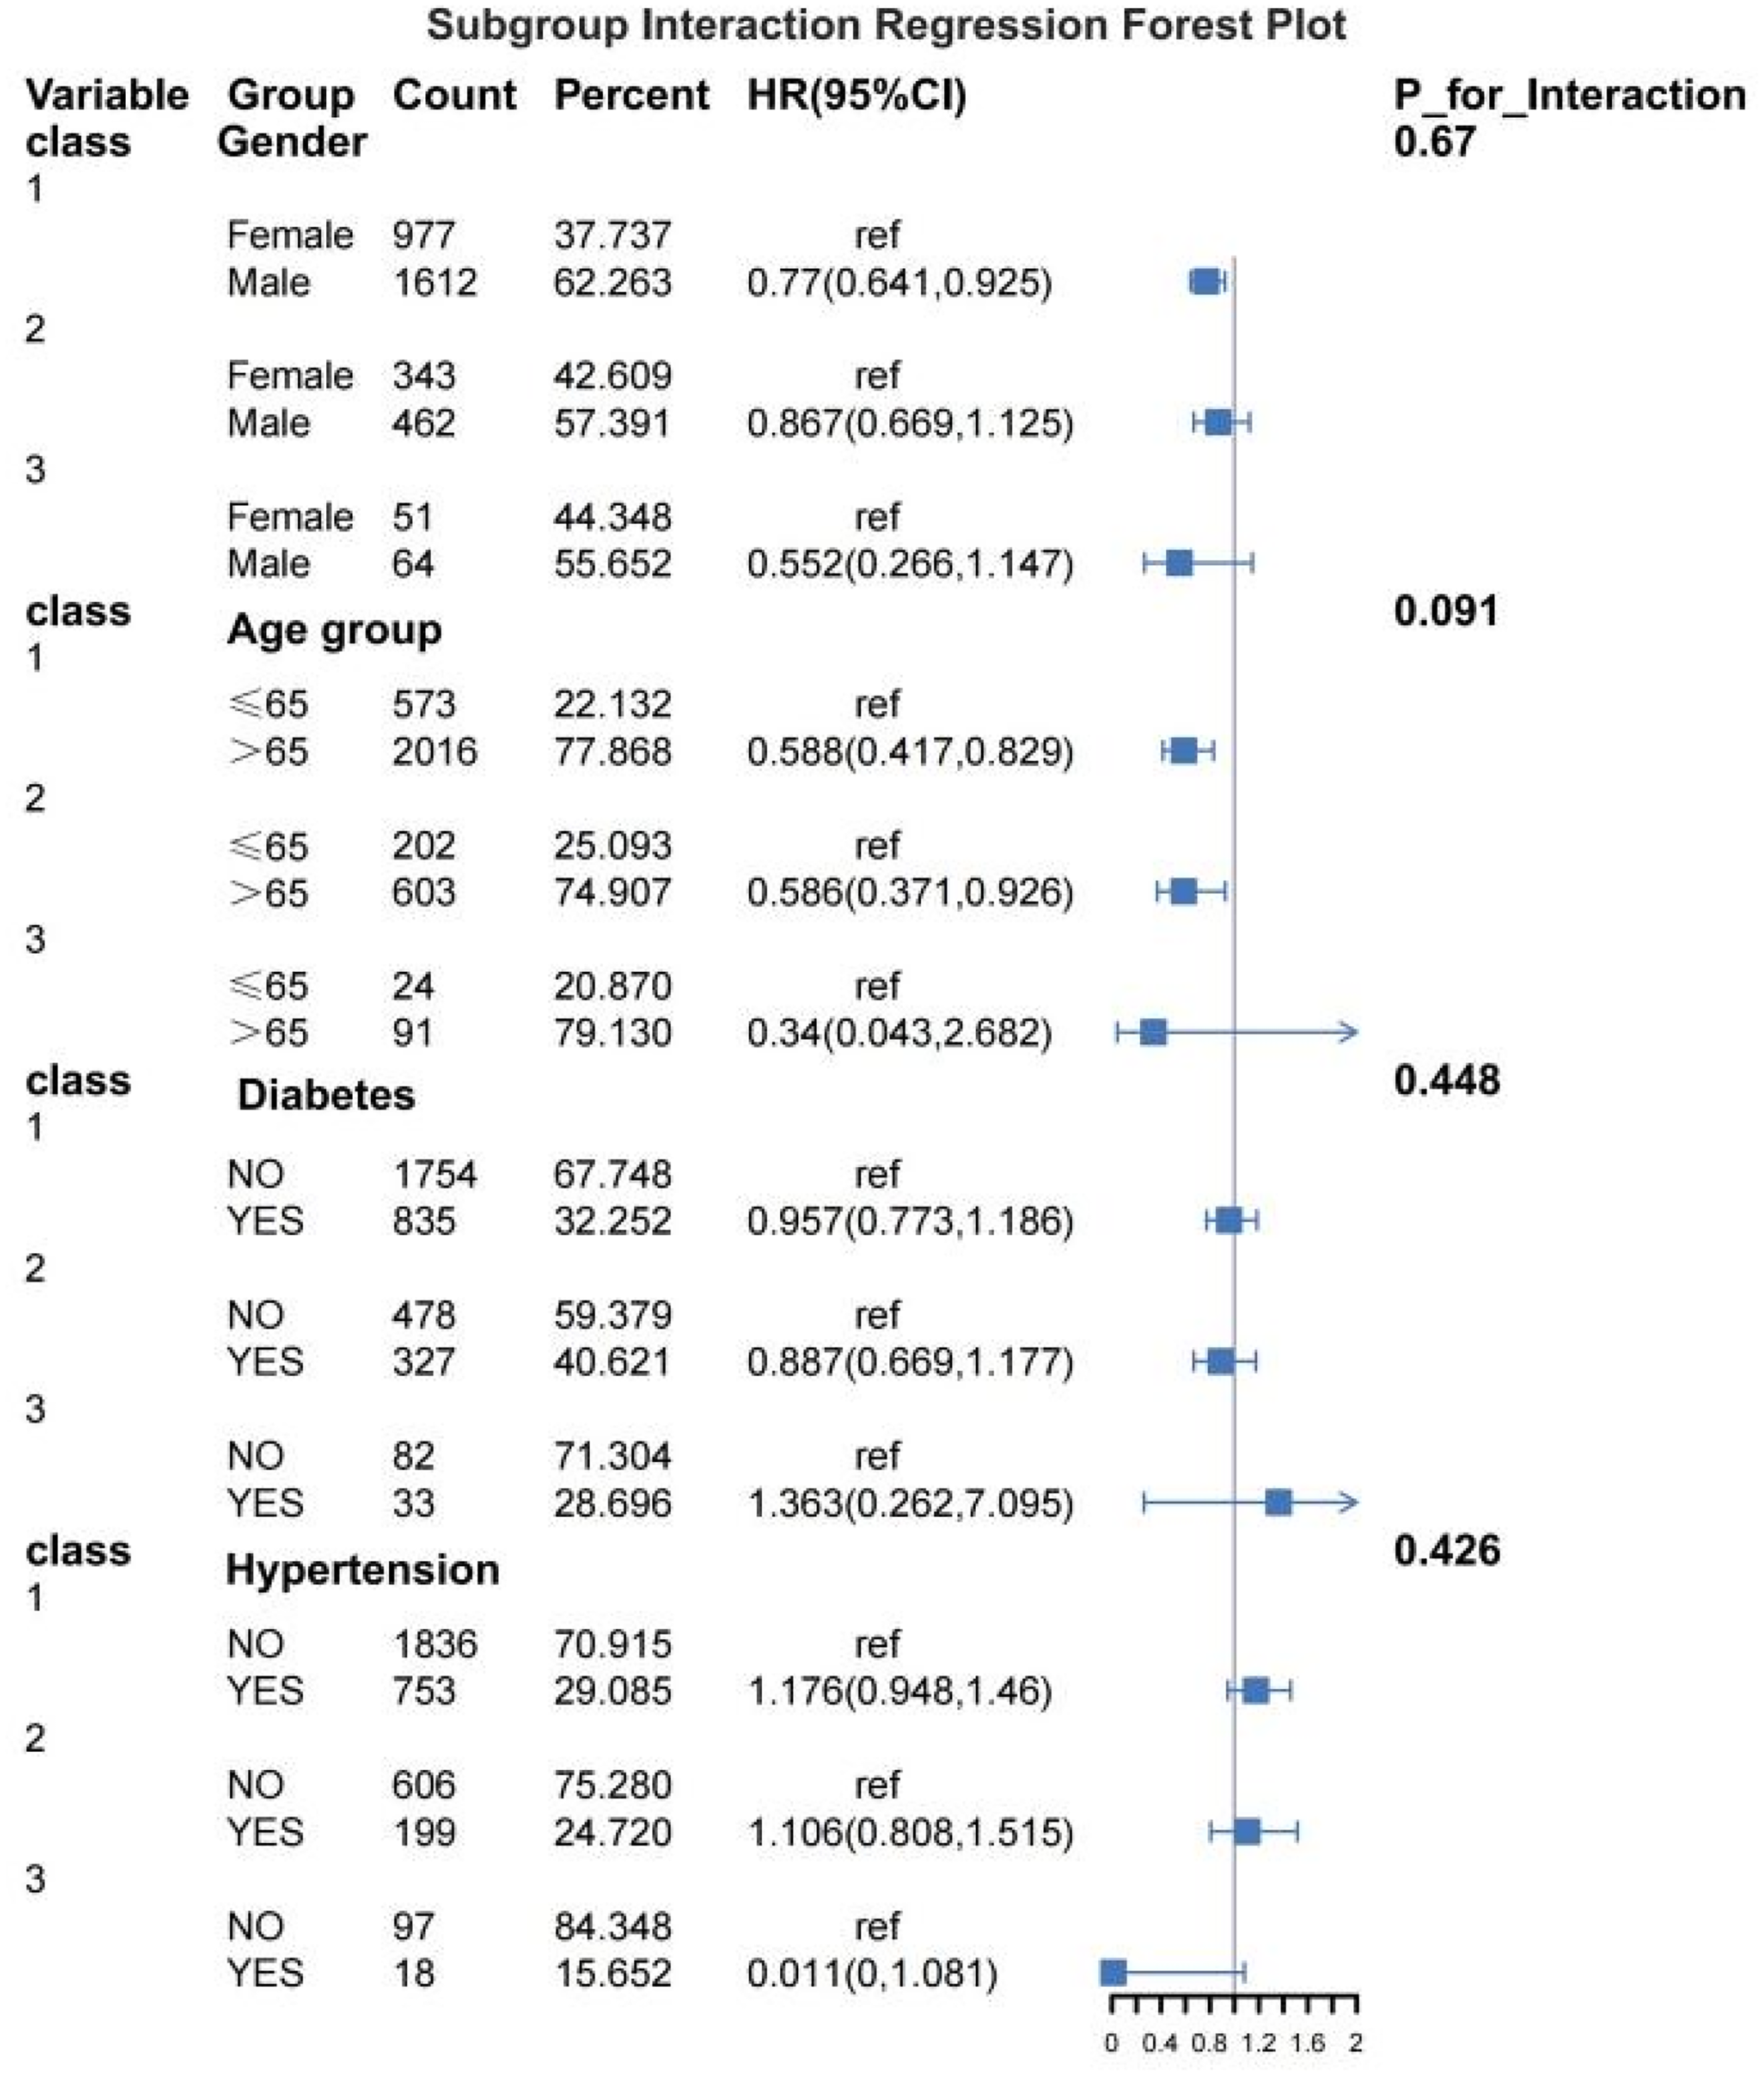
Subgroup forest plot of 28-day mortality risk by RDW trajectory classes in patients with atrial fibrillation.
Discussion
In this study, three distinct RDW trajectory patterns within the first 36 h of ICU admission were identified in patients with AF using LGMM: a low and stable trajectory (Class 1), a moderately elevated and rising trajectory (Class 2) and a high initial trajectory followed by a subsequent decline (Class 3). Compared with Class 1, patients in Class 2 had a significantly higher risk of 28-day in-hospital mortality, and this association remained robust after adjustment for age, sex, comorbidities and treatment variables (HR = 1.27, P = 0.003). No significant difference in mortality was observed between Class 3 and Class 1. These findings suggest that early dynamic changes in RDW may reflect distinct underlying pathophysiological states, with a persistently moderate and increasing RDW trajectory identifying a subgroup at higher risk of adverse outcomes.
RDW, an index that reflects the variation in red blood cell volume, has been shown to be closely associated with mortality risk across a range of diseases. In a large community-based cohort study, Perlstein et al. reported that each one–standard deviation increase in RDW was associated with a 23% higher risk of all-cause mortality, with significant associations observed for deaths from cardiovascular disease, cancer and respiratory illnesses. 17 A systematic review and meta-analysis by Keesari et al. further showed that elevated RDW was associated with a higher risk of frailty and a higher risk of mortality, underscoring its potential utility as an early-warning marker in the elderly. 18 Nguyen et al. further reported that elevated RDW in patients with hip fractures was a significant predictor of mortality within 30 days to 1 year after surgery, with risks increasing up to sixfold. 19
In recent years, the prognostic value of RDW in critically ill patients has attracted widespread attention. Beyond the use of RDW as a single indicator, some studies have attempted to combine RDW with markers related to nutritional or inflammatory status to form ratio-based indices, aiming to improve predictive accuracy. Pan and Song found that the RDW-to-albumin ratio (RAR) could independently predict in-hospital mortality in ICU patients with AF. 20 Wang et al. reported that in patients with sepsis complicated by AF, a low hemoglobin-to-RDW ratio (HRR < 5.877) was significantly associated with an increased risk of in-hospital and short-term all-cause mortality and served as an independent predictor of poor prognosis. 21 The study by Li and Song demonstrated that among patients undergoing coronary angiography, a higher RAR was associated with an approximately twofold increased risk of AF. 22 In diseases other than AF, a large-scale study of ICU patients with heart failure found a nonlinear association between RAR and one-year all-cause mortality. 23 Similarly, in community-acquired bacteremia, an RAR greater than 5.824 was significantly associated with an increased risk of in-hospital mortality, particularly in cases of Gram-negative bacterial infections, and demonstrated superior predictive performance compared with RDW or albumin alone. 24 However, although these ratio-based indices show certain potential, their calculation relies on multiple variables and may be influenced by factors such as nutritional status and liver function, which limits their widespread applicability. In contrast, RDW, as a simple, independent and readily accessible laboratory parameter, is more practical in clinical settings. Building upon existing evidence, the present study is the first to evaluate the prognostic significance of RDW in ICU patients with AF from the perspective of a “dynamic trajectory.” Unlike previous studies based on static measurements at a single time point, RDW trajectories provide a more comprehensive reflection of disease progression and individual condition fluctuations, thereby facilitating earlier identification of high-risk populations and offering more valuable information for clinical decision-making.
Although the present study focused on critically ill ICU patients with AF, the prognostic value of RDW is not limited to this specific population. Previous studies have consistently demonstrated that elevated RDW is significantly associated with adverse clinical outcomes across various groups of ICU patients. Systematic reviews and meta-analyses have shown that in patients with aneurysmal subarachnoid hemorrhage (aSAH), increased RDW is significantly correlated with poor functional outcomes, higher mortality and an elevated risk of cerebral infarction. 25 In addition, reviews have highlighted that RDW, as a potential marker of inflammation and oxidative stress, possesses independent prognostic value in various common ICU conditions, including heart failure, acute coronary syndrome (ACS), stroke, severe infections and pulmonary embolism. 26 Elevated RDW is closely associated with adverse outcomes in ACS. Increased RDW typically reflects a systemic inflammatory response and is linked to impaired cardiac function (such as reduced ejection fraction) and the severity of coronary artery damage. Studies have shown that patients with RDW levels above 15% have a significantly higher risk of heart failure and multivessel coronary artery disease. 27 This study further confirms that, in the general ICU population, elevated RDW at admission is significantly associated with increased in-hospital mortality and prolonged ICU length of stay. Although its predictive performance is moderate, combining RDW with other indicators can improve the accuracy of risk assessment. 28
This study classified the dynamic RDW trajectories of ICU patients with AF into three groups and evaluated their association with 28-day in-hospital mortality. Class 1, defined by persistently low and stable RDW levels, likely reflected a favorable metabolic profile with lower inflammation and stress and was associated with the lowest mortality risk. Class 2 showed moderately elevated RDW levels with a gradual upward trend, suggesting ongoing inflammation, oxidative stress or bone marrow dysfunction, indicative of a worsening clinical condition. Compared with Class 1, Class 2 was associated with a significantly higher mortality risk in the unadjusted model (HR = 1.90, 95% CI: 1.64–2.20, P < 0.001). This association remained significant after adjustment for age, sex and race (Model 2) and persisted after further adjustment for clinical variables, comorbidities and treatments (Model 3: HR = 1.27, 95% CI: 1.09–1.49, P = 0.003). Class 3, characterized by high initial RDW levels that subsequently declined, may represent patients with severe baseline illness but favorable treatment response; its mortality risk did not differ significantly from Class 1 across all models (all P > 0.05). These findings suggest that dynamic RDW trajectories provide a more accurate reflection of disease evolution and mortality risk than single–time point measurements, with Class 2 particularly indicating a markedly poorer prognosis. One possible explanation for the similar prognosis observed between Class 3 and Class 1 is that the initial elevation of RDW may reflect acute physiological stress or an inflammatory state at ICU admission, whereas the subsequent downward trend suggests that this condition has been alleviated through treatment or clinical improvement. The decline in RDW may indicate recovery of bone marrow hematopoietic function, control of inflammation or overall stabilization of the patient's condition, thereby mitigating the initial risk.29,30
An elevated RDW may indicate not only abnormal erythropoiesis but also broader pathophysiological processes. Prior studies have demonstrated that oxidative stress is a key mechanism underlying increased RDW, as oxidative damage reduces red blood cell deformability and promotes heterogeneity in cell size, thereby elevating RDW levels. 31 In addition, elevated RDW is frequently observed in conditions characterized by an imbalance between red blood cell production and destruction, such as anemia, iron deficiency or deficiencies in vitamin B12 and folate. These abnormalities result in the coexistence of red blood cells of different sizes in the peripheral circulation, thereby exacerbating anisocytosis. 32 Chronic inflammation is also strongly associated with elevated RDW, as proinflammatory cytokines can impair bone marrow hematopoiesis and shorten red blood cell lifespan, thereby contributing to increased RDW. 32 Further studies have indicated that RDW is negatively correlated with coronary microvascular dysfunction (such as a decrease in coronary flow reserve), suggesting that RDW reflects, to some extent, microcirculatory damage. 33 In addition, RDW is positively correlated with coronary artery calcium score, further supporting its clinical significance as a potential cardiovascular risk marker. 34 Therefore, RDW is not just a simple parameter in routine blood tests; its elevation may reveal a complex interplay of pathological processes involving inflammation, oxidative stress, dysregulation of erythropoiesis and cardiovascular dysfunction, making it an important tool for prognostic assessment.
This study has several notable strengths. First, it applied LGMM to capture dynamic changes in RDW during the early ICU period, providing a more precise evaluation of its prognostic value than traditional static measurements. Second, the use of the large-scale, high-quality MIMIC-IV critical care database ensured a robust sample size and enhanced the generalizability of the findings. Third, comprehensive adjustment for a wide range of clinical confounders improved the reliability of the results. Furthermore, by focusing on patients with AF, a high-risk population, this study offers a novel framework for early-risk stratification.
This study has several limitations that should be considered when interpreting the results. First, only patients who underwent at least three RDW measurements within the first 36 h after ICU admission were included in the trajectory analysis. This inclusion criterion may have excluded patients who died early or experienced rapid deterioration, thereby introducing survivor bias and making the findings more representative of those who survived beyond the initial critical phase. Second, the study was conducted as a single-center retrospective analysis without external validation, which limits the generalizability of the results and the strength of causal inference. Third, the distribution of latent classes was unbalanced, with Class 3 accounting for only 3.3% of the total sample. Although the model demonstrated good classification quality, the relatively small sample size in this subgroup may compromise the precision and generalizability of its parameter estimates, warranting further validation in larger cohorts. In addition, the study did not explore in depth the biological mechanisms underlying the dynamic changes in RDW, such as inflammatory responses, bone marrow dysfunction or regulation of erythropoiesis. Future studies should clarify these mechanisms using experimental or prospective data.
Conclusion
This study is the first to assess the prognostic value of RDW trajectory patterns in ICU patients with AF, showing a strong association with 28-day in-hospital mortality. Using LGMM, we identified three RDW trajectories: stable low RDW (Class 1), moderately elevated and rising RDW (Class 2) and initially high RDW followed by a decline (Class 3). Class 2 had a significantly higher mortality risk than Class 1, even after adjusting for multiple factors. RDW trajectories offer a more comprehensive view of disease progression, with Class 2 indicating a poorer prognosis.
Footnotes
Acknowledgments
The authors thank all colleagues who contributed to this effort. The authors acknowledge the use of an AI language model (ChatGPT, OpenAI) to assist in improving the English language and clarity of the manuscript during the writing process.
Ethics approval and consent to participate
This study received approval from the Institutional Review Board (IRB) at Beth Israel Deaconess Medical Center under approval number 2001P-001699/14, with informed consent obtained from all study participants.
Consent for publication
All authors have agreed to publish. This manuscript has not been published elsewhere and has not been considered by other journals.
Author contributions
Study concept and design by XZ and HZ; Acquisition, analysis, or interpretation of data by all authors; Drafting of the manuscript by HZ; Critical revision of the manuscript by HZ and XZ; Statistical analyses by HZ and XZ; Supervision of research by MZ. All authors contributed to the article and approved the submitted version.
Funding
The authors declared the following potential conflicts of interest with respect to the research, authorship, and/or publication of this article: The project was supported by the Fujian Provincial Natural Science Foundation General Program, Grant/Award Number: 2020D039.
Declaration of conflicting interests
The authors declared no potential conflicts of interest with respect to the research, authorship and/or publication of this article.