
Abstract
Objectives
Low lean mass (LLM), as a critical element of sarcopenia, is associated with chronic inflammation and malnutrition and presents substantial risks to ageing populations. Although the red blood cell distribution width-to-albumin ratio (RAR) has been identified as a promising biomarker in various inflammatory and nutritional contexts, its relationship with LLM has not yet been investigated. This study seeks to examine the association between RAR and the risk of LLM.
Methods
A cross-sectional analysis was conducted using data from 22,299 adults participating in the National Health and Nutrition Examination Survey (NHANES) from 1999 to 2018. LLM was defined according to the criteria established by the Foundation for the National Institutes of Health. Multivariable logistic regression and restricted cubic spline models were employed to assess the relationship between RAR and LLM, adjusting for variables including age, gender, marital status, race and ethnicity, body mass index, smoking status, alcohol consumption, educational attainment, diabetes mellitus, cardiovascular disease, moderate-to-vigorous physical activity, and time spent in sedentary activities. Subgroup analyses and propensity score matching analyses were also conducted.
Results
The prevalence of LLM was 10.3% in NHANES 1999–2018. Restricted cubic splines analysis revealed a significant dose-response relationship between RAR and LLM risk (P < .001). Based on multivariate logistic regression, elevated RAR levels were linked to a higher odds of LLM (OR 1.84, 95% CI 1.64–2.06, P < .001). Specifically, individuals in the highest RAR quartile (Q4) had an OR of 2.38 (95% CI 2.00–2.83, P < .001) for developing LLM compared to those in the lowest quartile (Q1). Sensitivity analysis confirmed the robustness of this positive association in several subgroup analyses and propensity score matching analysis.
Conclusion
High RAR is associated with higher odds of LLM risk in community populations. These findings serve as a basis for further research on sarcopenia and need thorough validation in various populations.
Keywords
Introduction
Sarcopenia, characterized by progressive loss of skeletal muscle mass and function, poses a significant health challenge for aging populations. It affects an estimated 10–27% of individuals aged 60 years and older globally, with projections indicating that up to 2 billion people could be affected by 2050. This condition not only diminishes physical capacity but also elevates the risk of falls, fractures, and frailty, imposing substantial healthcare burdens and significantly impairing the quality of life in older adults.1,2 Systemic inflammation, malnutrition, and aging are recognized as critical factors driving sarcopenia onset and progression.3,4
Red blood cell distribution width (RDW) is a conventional, cost-effective hematological parameter quantifying erythrocyte volume heterogeneity and aiding in anemia differential diagnosis.5,6 Recent evidence indicates a positive association between RDW and chronological age, 7 establishing it as a biomarker of aging pace.8–10 Serum albumin is essential for maintaining plasma osmotic pressure and transporting bioactive substances. Reduced albumin levels correlate with malnutrition, systemic inflammation, and frailty.11–13 Given these physiological roles, the RDW to albumin ratio (RAR) represents an emerging composite index reflecting malnutrition, inflammation, and aging. 6 Previous studies have highlighted the prognostic value of RAR in conditions involving heightened inflammation, such as diabetes mellitus, sepsis, rheumatoid arthritis, metabolic syndrome, and chronic kidney disease.14–17 However, the relationship between RAR and sarcopenia risk remains unelucidated.
This study focuses on low lean mass (LLM), defined by the appendicular lean mass to body mass index ratio (ALM/BMI) and identified as a core component of sarcopenia by the Foundation for the National Institutes of Health (FNIH) Sarcopenia Project. Utilizing data from the United States National Health and Nutrition Examination Survey (NHANES), our objective was to investigate the association between elevated RAR and LLM risk within the general population. We hypothesized that higher RAR levels are associated with an increased risk of LLM.
Methods
Study design and participants
The NHANES database provides nationally representative cross-sectional data for the non-institutionalized US civilian population. This resource includes demographic details, clinical examination findings, and survey responses. 18 Our study employed a cross-sectional design. Participants aged ≥18 years with complete data for RDW, serum albumin concentration, and appendicular lean mass (ALM) measured via dual-energy X-ray absorptiometry (DXA) were identified using the publicly available NHANES Data Dictionary. As DXA data were unavailable for the 2007–2008 and 2009–2010 survey cycles, analyses utilized data from eight 2-year cycles (1999–2006, 2011–2018). The final analytical cohort comprised 22,299 individuals (Figure 1).

Participant selection process in NHANES (1999–2018). Initial screening identified 54,477 eligible participants. After applying exclusion criteria for missing RDW (n = 5418), ALB (n = 11,153), DXA (n = 12,755) data and BMI (n = 2852), the analytic cohort comprised 22,299 participants. Within this cohort, 2295 (10.3%) were diagnosed with sarcopenia. RDW, red blood cell distribution width; ALB, albumin; DXA, dual-energy X-ray absorptiometry; BMI, body mass index.
Our study was conducted in accordance with the Declaration of Helsinki (2024). The National Center for Health Statistics (NCHS) Research Ethics Review Board approved the NHANES protocol, and participants provided written informed consent. Ethical approval and participant consent for this specific analysis were waived as it utilized publicly available, de-identified data. Reporting adhered to the Strengthening the Reporting of Observational Studies in Epidemiology (STROBE) guidelines. 19
Measurement of RAR
Serum albumin concentration was determined using the bromocresol purple method. RDW was measured on peripheral blood samples using a Coulter analyzer at mobile examination centers. The RAR was calculated as the ratio of RDW to serum albumin.
Outcome
The primary outcome, LLM, was defined using the FNIH Sarcopenia Project criteria: ALM adjusted for body mass index (BMI). Cutoff values were <0.789 kg/m2 for men and <0.512 kg/m2 for women.20,21 ALM data were derived from DXA scans within the NHANES database.
Covariates
Drawing on previous epidemiological studies of LLM, 22 we considered covariates encompassing demographics, lifestyle factors, and clinical conditions. Self-reported questionnaires provided data on demographics (age at baseline, sex, race/ethnicity [non-Hispanic white, non-Hispanic black, Mexican American, other Hispanic, other], educational attainment [below high school, high school, college or above]) and lifestyle (sedentary behavior, smoking status [ever/n], alcohol consumption [yes/no]). BMI was calculated and categorized as <25.0, 25.0–29.9, or ≥30.0 kg/m2. Moderate-to-vigorous physical activity (MVPA) was assessed based on self-reported exercise, sports, or active hobbies undertaken in the preceding 30 days. Self-reported diagnoses of diabetes mellitus (DM) and cardiovascular disease (CVD), confirmed by healthcare professionals, were included. Collinearity among all selected covariates was assessed.
Statistical analysis
Continuous variables are presented as mean ± standard deviation (SD) or median with interquartile range (IQR) for non-normally distributed data. Categorical variables are expressed as frequencies (percentages). Logistic regression estimated odds ratios (ORs) and 95% confidence intervals (CIs) for the association between RAR (analyzed continuously and categorized into quartiles: Q1: 2.02–2.76, Q2: 2.76–98, Q3: 2.98–3.24, Q4: 3.24–11.92) and LLM. Trend across quartiles was assessed. Variance inflation factor (VIF) assessment confirmed absence of significant multicollinearity among covariates (all VIF < 2.0), supporting model robustness (Table S4).23,24 We built 5 models: Model 1, adjusting for no covariates; Model 2, adjusting for age and sex; Model 3, adjusting for the variables in Model 2 plus race and ethnicity, marital status, BMI, smoking status, alcohol consumption and education levels; Model 4, adjusting for the variables in Model 3 plus DM and CVD; and Model 5, adjusting for the variables in Model 4 plus MVPA and minutes spent in sedentary activities. Restricted cubic spline regression (adjusted for Model 5 covariates) explored potential non-linearity in the RAR-LLM association. Subgroup analyses were performed across age, sex, race/ethnicity, education, marital status, smoking, alcohol consumption, DM, CVD, and MVPA.
Propensity score matching (PSM) was employed to enhance robustness. Using a 1:1 nearest neighbor approach (caliper width = 0.2), participants were grouped by RAR level (low: <2.9; high: ≥2.9) based on the median. The propensity score incorporated age, sex, BMI, race/ethnicity, education, MVPA, sedentary time, smoking status, and alcohol consumption. Balance after PSM was assessed using standardized mean differences (<0.1 deemed acceptable). Multivariable logistic regression compared LLM risk between groups.
Missing data were handled thus: participants missing key variables (DXA, RDW, albumin) were excluded; missing covariates underwent multiple imputation (5 datasets) using the R mice package to optimize power and reduce bias. Analyses were repeated using complete cases for comparison. Sensitivity analyses evaluated the robustness of findings across association models. Statistical significance was set at P < .05 (two-tailed). Analyses used R software (version 4.2.2) and the Free Statistics platform (version 2.1), which employs R for computation and a Python-based interface for reproducible analysis.
Results
Participant selection
The initial cohort consisted of 54,477 NHANES participants surveyed between 1999 and 2018. Exclusions were applied for 5,418 participants lacking RDW data and 11,153 participants missing albumin data, leaving 37,906 individuals eligible for LLM outcome assessment. Further exclusions occurred due to unavailable DXA measurements (12,755 participants) and missing BMI data (2,852 participants), resulting in a final analytical cohort of 22,299 participants (Figure 1). Detailed information on the baseline characteristics of included and excluded participants due to DXA unavailability was provided in Table S7.
Characteristics of the study population
The study population comprised 22,299 participants: 11,289 males (49.4%) and 11,010 females (50.6%). Applying FNIH criteria, 2,295 participants (10.3%) were classified as having LLM. Age distribution was 51.7% <40 years, 34.4% 40–60 years, and 13.8% ≥65 years. Racial composition was 38.9% Non-Hispanic White, 21.1% Non-Hispanic Black, 20.3% Mexican American, 7.7% Other Hispanic, and 11.9% Other race. Baseline characteristics are detailed in Table 1. Participants with higher RAR levels were generally older, more frequently female, Non-Hispanic White, and partnered. They also exhibited higher BMI, greater educational attainment, increased sedentary behavior, and higher prevalence of CVD and DM. Conversely, smoking, alcohol consumption, and MVPA engagement were less common in this group. Detailed information on anthropometric measurements and body composition is provided in Tables S5 and S6.
Baseline characteristics of included participants by RAR.
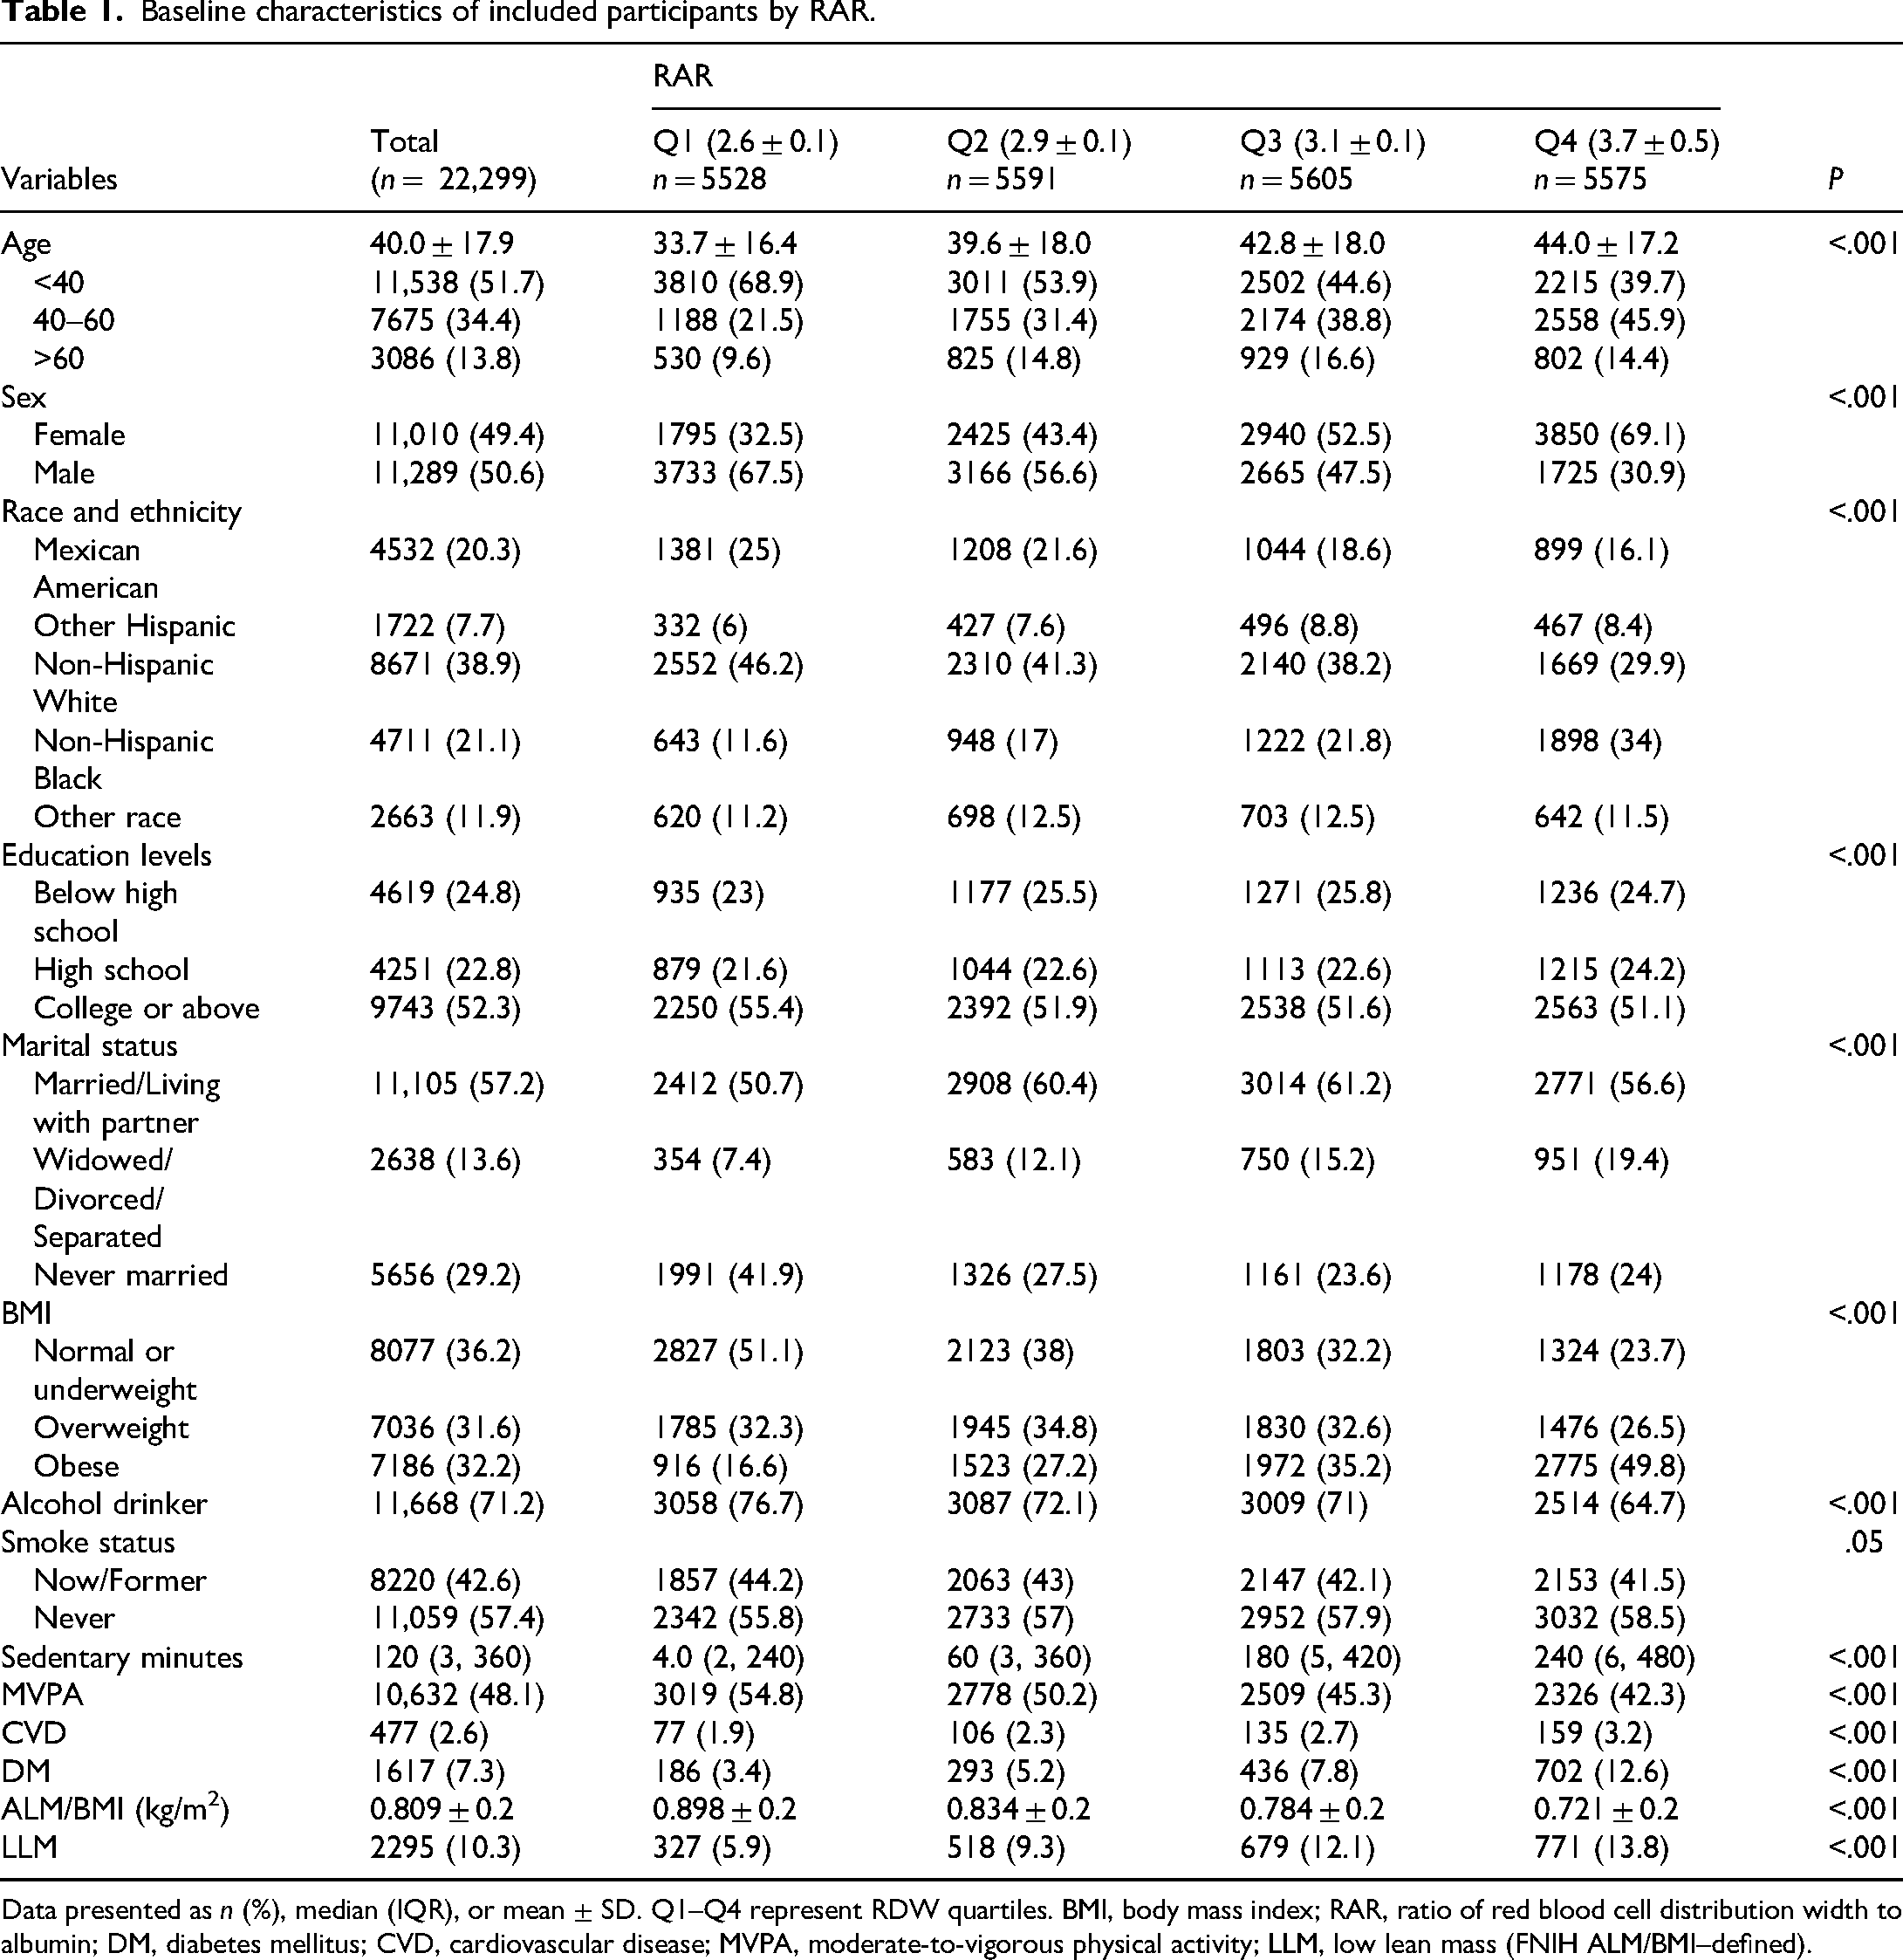
Data presented as n (%), median (IQR), or mean ± SD. Q1–Q4 represent RDW quartiles. BMI, body mass index; RAR, ratio of red blood cell distribution width to albumin; DM, diabetes mellitus; CVD, cardiovascular disease; MVPA, moderate-to-vigorous physical activity; LLM, low lean mass (FNIH ALM/BMI–defined).
Association between RAR and LLM
Multivariable logistic regression across five sequential models assessed the RAR-LLM association. The unadjusted model revealed a positive association (OR 1.69, 95% CI 1.56–1.83; P < .001; Table 2). This association persisted and strengthened after full adjustment for confounders (Model 5: OR 1.84, 95% CI 1.64–2.06; P < .001; Table 2). Sensitivity analysis categorizing RAR into quartiles corroborated these findings. Compared to the lowest quartile (Q1), participants in the highest quartile (Q4) demonstrated a significantly elevated LLM risk (Q4: OR 2.38, 95% CI 2.00–2.83; P < .001; Table 2). Restricted cubic spline regression treating RAR as continuous confirmed a significant, linear positive dose–response relationship after full covariate adjustment (Figure 2; overall P < .001, nonlinearity P = .349).

Association between the ratio of red blood cell distribution width to albumin and sarcopenia risk. The association between RAR and sarcopenia was analyzed in the National Health and Nutrition Examination Survey (NHANES). Restricted cubic spline models show the association between RAR and OR for sarcopenia, with 95% CIs. Overall, P-values indicate statistical significance of the association between RAR and sarcopenia risk (P < 0.001). Nonlinear P-values represent the linear components of the association (P = 0.349). OR, odds ratio; CI, confidence interval.
Associations between RAR and LLM in the multiple regression model.

Model 1: Unadjusted model. Model 2: Adjust for age and sex. Model 3: Adjust for the variables in Model 2 plus marital status, race and ethnicity, BMI, smoking status, alcohol consumption and education levels. Model 4: Adjust for the variables in Model 3 plus diabetes (DM) and cardiovascular disease (CVD). Model 5: Adjust for the variables in Model 4 plus moderate-to-vigorous physical activity (MVPA) and minutes spent in sedentary activities, C-reactive protein, controlling nutritional status scores. RAR, ratio of red blood cell distribution width to albumin, OR, odds ratio; 95% CI, 95% confidence interval, BMI, body mass index, LLM, low lean mass (FNIH ALM/BMI–defined).
Sensitivity analyses
Stratified analyses across subgroups (age, sex, race/ethnicity, BMI, marital status, education, smoking, alcohol consumption, DM, CVD, MVPA) revealed no significant effect modification on the RAR-LLM association (Figure 3).

Associations between the ratio of red blood cell distribution width to albumin and sarcopenia in different subgroups. Forest plot displays odds ratios (ORs) with 95% confidence intervals for subgroup analyses stratified by demographic and lifestyle factors. Except for the stratification component itself, each stratification factor was adjusted for age, sex, race/ethnicity, educational level, marital status, smoking status, alcohol consumption, DM, CVD, and MVPA. OR, odds ratio; CI, confidence interval.
PSM yielded 5042 well-balanced pairs (Supplementary Table S1; Supplementary Figure S1). Within this matched cohort, LLM prevalence was significantly higher in the high RAR group (14.8% [748 cases]) versus the low RAR group (10.9% [549 cases]; P < .001; Supplementary Table S1). The association remained significant post-matching (OR 1.43, 95% CI 1.27–1.61; P < .001; Table 3). Inverse probability weighting analysis similarly indicated elevated risk for the high RAR group (OR 1.27, 95% CI 1.15–1.40; P < .001; Table 3).
Association between high-level RAR and LLM using propensity score analysis.
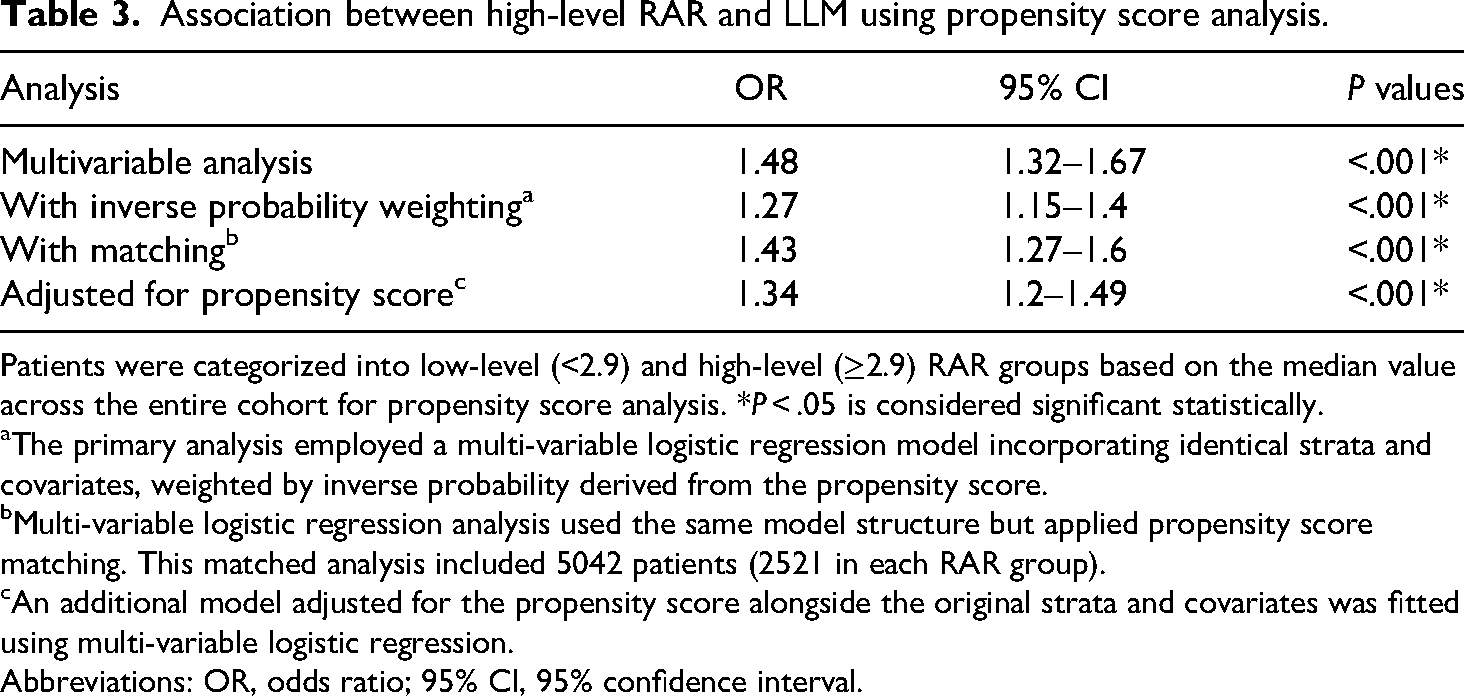
Patients were categorized into low-level (<2.9) and high-level (≥2.9) RAR groups based on the median value across the entire cohort for propensity score analysis. *P < .05 is considered significant statistically.
The primary analysis employed a multi-variable logistic regression model incorporating identical strata and covariates, weighted by inverse probability derived from the propensity score.
Multi-variable logistic regression analysis used the same model structure but applied propensity score matching. This matched analysis included 5042 patients (2521 in each RAR group).
An additional model adjusted for the propensity score alongside the original strata and covariates was fitted using multi-variable logistic regression.
Abbreviations: OR, odds ratio; 95% CI, 95% confidence interval.
Analysis across five multiply imputed datasets consistently demonstrated a significant positive association between elevated RAR and LLM risk. Per unit increase in continuous RAR, the odds of LLM increased by 84–87% across imputations (OR range: 1.84–1.87; 95% CI: 1.67–2.05; all P < .001). Quartile-based analysis revealed a robust dose-response relationship: compared to Q1, Q4 conferred a 2.44–2.51-fold increased LLM odds (all P < .001), with progressively elevated risks in intermediate quartiles (Q2 OR: 1.33–1.37; Q3 OR: 1.76–1.82; all P < .001). Trend tests confirmed a monotonic increase (OR per quartile increment: 1.35–1.36; 95% CI: 1.29–1.42; P < .001). The remarkable consistency of effect estimates across all imputed datasets (total N = 23,699) underscores the robustness of these findings (Table S2).
Discussion
Utilizing the NHANES database, we evaluated the association between the RAR and LLM risk. The analysis encompassed 22,299 participants at baseline, of whom 2295 were identified with LLM. Higher RAR levels were independently associated with an increased risk of LLM in the general population. When stratified by quartiles, ascending RAR quartiles demonstrated a graded association with greater LLM risk. Sensitivity analyses, including subgroup assessments and PSM, confirmed the robustness of this positive association.
Previous research has explored the individual components of RAR—RDW and serum albumin—in relation to sarcopenia. RDW is recognized as a marker of nutritional deficiencies (e.g., iron, vitamin B12, or folate),25,26 and chronic inflammation. 27 Elevated RDW levels correlate with impaired physical performance and reduced muscle mass, reflecting inflammatory processes that contribute to muscle catabolism.27–29 Similarly, hypoalbuminemia indicates chronic protein-energy malnutrition or systemic inflammation, 30 both central to sarcopenia development.14,31–33 Unlike isolated factors, RAR may better encapsulate the interplay between malnutrition and chronic inflammation in sarcopenia pathophysiology. This study reinforces the premise that combining these markers offers a more accurate reflection of underlying pathophysiological processes than either factor alone.
Emerging evidence suggests RAR may outperform traditional malnutrition screening tools (e.g., CONUT score) in cohorts with overlapping inflammatory and nutritional pathologies. 34 As a composite factor, RAR integrates hematologic and nutritional parameters, enhancing its utility in clinical settings where conventional factors are confounded by inflammation or chronic disease. Its dual reflection of hematologic and metabolic disturbances positions RAR as a valuable adjunct for personalized nutritional interventions, particularly in conditions like chronic heart failure, rheumatoid arthritis, and metabolic syndrome, where malnutrition-inflammation complexes are prevalent.17,34–37 While RAR may partially reflect an underlying state of inflammation and nutritional compromise. The RAR may partially reflect an underlying milieu of inflammation and nutritional compromise, this observational study cannot elucidate precise biological mechanisms.
Our results indicate RAR holds promise as a biomarker for predicting LLM, capturing the combined effects of chronic low-grade inflammation and malnutrition. Studies support a bidirectional relationship wherein chronic inflammation exacerbates muscle wasting, while reduced muscle mass amplifies systemic inflammation.4,38 Although RAR encapsulates the organism's inflammatory and nutritional status, the exact biological mechanisms remain unelucidated. The strong, independent association between elevated RAR and LLM underscores the need to explore nutrition-inflammation dynamics, aligning with the “inflammaging” concept—chronic inflammation linked to aging and geriatric conditions like sarcopenia.39,40
Age and sex significantly influence RDW. Our data demonstrate a progressive rise in RDW with advancing age, consistent with epidemiological evidence.41,42 This age-associated increase likely stems from multifactorial mechanisms, including “inflammaging.” 43 Elevated RDW in older adults may signify diminished physiological reserve and increased biological vulnerability, serving as an integrative marker of physiological dysregulation. Sex-based differences were also evident, with females exhibiting higher mean RDW than males after age adjustment. This finding corroborates observations from large population-based studies.42,44 This dimorphism may arise from hormonal influences on hematopoiesis, iron depletion due to menstrual blood loss, genetic factors, or differences in body composition and inflammatory profiles.42,44,45
This study has several limitations. First, as an observational study, it cannot establish causal links between RAR and LLM. Despite controlling for confounders, the potential for residual confounding by unmeasured aspects of inflammation (e.g., IL-6, TNF-α) and nutritional status (e.g., detailed dietary intake, specific micronutrient levels, albumin kinetics) that were not available in the NHANES dataset. While we utilized CRP and the CONUT score as proxies, their incomplete coverage of these complex pathways means we cannot fully rule out confounding effects on the observed associations involving RAR. Second, this study identified sarcopenia by evaluating muscle lean mass quality using DXA data from the NHANES, without incorporating assessments of muscle strength or physical performance. Our operational definition, which relies solely on the FNIH ALM/BMI criteria, does not constitute a comprehensive diagnostic evaluation of sarcopenia as delineated by the current major clinical guideline (EWGSOP2). This limitation introduces the potential for misclassification, particularly due to the omission of functional impairment assessment, and may influence the interpretation of our findings. There is a possibility of overestimating prevalence if individuals with normal strength or performance are classified as having low muscle mass, or underestimating associations if functional impairment serves as a stronger predictor of the outcomes studied. Therefore, our findings pertain specifically to the association of LLM with the outcomes investigated and should not be directly extrapolated to suggest diagnostic or screening recommendations for clinical sarcopenia. Thirdly, given its retrospective, single-center design and absence of external validation, this study does not support the derivation of definitive diagnostic or prognostic thresholds for RAR applicable to clinical practice. These findings suggest that RAR warrants further investigation as a candidate biomarker. However, its role at this stage should be viewed primarily as hypothesis-generating, meriting rigorous prospective validation and external replication in diverse populations before any consideration for clinical implementation.
Conclusions
In conclusion, this study reveals a strong, independent association between elevated RAR levels and increased LLM risk. This finding lays the groundwork for further exploration into the interplay between nutrition, inflammation, and muscle health.
Supplemental Material
sj-docx-1-sci-10.1177_00368504261426679 - Supplemental material for Association between red blood cell distribution width-to-albumin ratio and risk of low lean mass: A cross-sectional study of NHANES 1999–2018
Supplemental material, sj-docx-1-sci-10.1177_00368504261426679 for Association between red blood cell distribution width-to-albumin ratio and risk of low lean mass: A cross-sectional study of NHANES 1999–2018 by Yifeng Niu, Lihua Yang, Haolei Yong and Min Li in Science Progress
Supplemental Material
sj-docx-2-sci-10.1177_00368504261426679 - Supplemental material for Association between red blood cell distribution width-to-albumin ratio and risk of low lean mass: A cross-sectional study of NHANES 1999–2018
Supplemental material, sj-docx-2-sci-10.1177_00368504261426679 for Association between red blood cell distribution width-to-albumin ratio and risk of low lean mass: A cross-sectional study of NHANES 1999–2018 by Yifeng Niu, Lihua Yang, Haolei Yong and Min Li in Science Progress
Footnotes
Acknowledgments
We express gratitude to Jie Liu from the Chinese PLA General Hospital for statistical support, study design advice, and manuscript feedback. We also thank the NHANES team and participants.
Ethics approval
The NHANES was approved by the NCHS Ethics Review Committee in December 1998. Participants provided written informed consent before enrollment. The secondary analysis did not require additional Institutional Review Board approval.
Author contributions
Definitions of the study design Manuscript concept, study design, and statistical methods: Min Li. Collecting data: Yifeng Niu, Lihua Yang, Haolei Yong. Analysis, interpretation of data, and drafting of the manuscript: Min Li. Critical revision of manuscript for important intellectual content: all authors. All authors read and approved the final manuscript.
Funding
The authors disclosed receipt of the following financial support for the research, authorship, and/or publication of this article: This work was supported by grants from the Talent Project of the Air Force Military Medical University (4145D3), the Clinical Research Project of the Air Force Military Medical University (2024LC2442), and the Key Discipline Construction Project of Tangdu Hospital (2024JCRH037).
Declaration of conflicting interests
The authors declared no potential conflicts of interest with respect to the research, authorship, and/or publication of this article.
Data availability
Supplemental material
Supplemental material for this article is available online.
References
Supplementary Material
Please find the following supplemental material available below.
For Open Access articles published under a Creative Commons License, all supplemental material carries the same license as the article it is associated with.
For non-Open Access articles published, all supplemental material carries a non-exclusive license, and permission requests for re-use of supplemental material or any part of supplemental material shall be sent directly to the copyright owner as specified in the copyright notice associated with the article.