
Abstract
Objective
To evaluate the TSAT*SF and SF/TSAT indices in children living at different altitudes, with and without inflammation, and to examine their correlations with markers of iron homeostasis.
Methods
A cross-sectional, multicenter study included 238 children aged 6 to 72 months. We assessed TSAT*SF and SF/TSAT indices in relation to serum hepcidin, total body iron (TBI), hematological and nutritional parameters, and inflammatory markers.
Results
Children with elevated inflammatory markers resided at high altitude (HA) and exhibited increased hemoglobin (Hb), hematocrit, and a higher prevalence of erythrocytosis, alongside lower rates of anemia. Log-transformed values of SF, TBI, hepcidin, SF/TSAT ratio, and log(SF/TSAT) were significantly elevated in the inflammation group. In contrast, TSAT*SF values were unaffected by inflammation, showing no significant differences between groups. Among children with normal C-reactive protein (CRP ≤10 mg/L), TSAT*SF > 900 was associated with higher Hb, serum iron, hepcidin, TBI, and TSAT, as well as reduced height-for-age and weight-for-age Z-scores. Across the full sample, CRP positively correlated with ferritin, hepcidin, TBI, neutrophils, and unadjusted Hb, and negatively with serum iron and lymphocytes. CRP showed no correlation with TSAT*SF but was positively associated with the SF/TSAT ratio. Multivariate analysis revealed that the TSAT*SF index correlated with iron status but not inflammation, whereas the SF/TSAT index correlated with both iron status and inflammation. The SF*TSAT ratio demonstrated differential performance, showing a higher area under the ROC curve for the diagnosis of iron deficiency compared to inflammation (0.75 vs 0.98, p < 0.05), whereas the log-transformed SF/TSAT ratio did not exhibit this distinction.
Conclusion
The TSAT*SF index effectively identifies tissue iron overload independently of inflammation. Its use may improve iron status assessment in pediatric populations exposed to HA and systemic inflammation. Elevated TSAT*SF was linked to erythrocytosis and impaired growth, underscoring its diagnostic and public health significance.
Introduction
Iron is essential for health, but both iron deficiency (ID) and iron overload (IO) are harmful. Without a regulated excretory pathway, excess iron accumulates in organs, increasing risks of chronic diseases like non-alcoholic fatty liver disease (NAFLD), cirrhosis, diabetes, and heart failure, while deficiency leads to anemia. 1 During pregnancy, both ID and IO are associated with adverse outcomes. 2
Serum ferritin (SF) is the most widely used biomarker to assess iron status in clinical settings. As an iron storage protein, SF reflects body iron stores where low serum levels suggest ID, while elevated levels may indicate pathological IO.3,4 However, ferritin is also an acute-phase reactant, meaning its levels can rise in response to inflammation or infection, independently of iron stores. 5 This dual role contributes to variability and potential misinterpretation in cases of hyperferritinemia (HF), where elevated ferritin may not necessarily reflect IO.6,7
Under IO conditions, the transferrin saturation (TSAT) increases, leading to the accumulation of non-transferrin-bound iron and the generation of reactive oxygen species, which damage cellular structures and impair organ function. 8 While current diagnostic tools such as liver iron concentration (LIC) or myocardial iron concentration measured by magnetic resonance imaging (MRI) are accurate, they are invasive, expensive, and not always feasible in routine clinical practice.9,10 Given the variety of conditions that cause IO and the associated risks, there is a clear need for simple, non-invasive, and reliable diagnostic tools.
Combining elevated SF with elevated fasting TSAT improves diagnostic accuracy for IO. 11 These two markers commonly rise together in cases of IO. 12 If elevated SF and TSAT levels are associated with increased tissue iron, then their product (TSAT*SF) could serve as a surrogate marker for total body iron (TBI), independent of inflammatory markers. Conversely, the ratio (SF/TSAT) may reflect both TBI and the influence of inflammation. A good marker for excess iron in the body would be that index correlates with TBI but not with inflammation.
The objective of this study is to develop and validate a novel index combining serum transferrin saturation and SF (TSAT * SF) as a surrogate marker of tissue iron stores in children from Arequipa, Peru, living at different altitudes, and to compare its performance with the SF/TSAT index. Additionally, the study aims to evaluate the index's ability to distinguish high TBI in the presence or absence of inflammatory markers, and to explore its correlation with established indicators of iron homeostasis.
We hypothesize that the TSAT * SF index will be a reliable, non-invasive biomarker for differentiating true IO from HF caused by inflammation. Furthermore, we expect this index to show strong correlations with iron status markers, even after adjusting for altitude-related variations in hemoglobin concentration among children living at different elevations.
Material and methods
Study design, population, and sample size
A cross-sectional study included children aged 6 to 72 months, both with and without elevated inflammatory markers. We assessed the TSAT-SF index and the SF/TSAT ratio in relation to serum hepcidin, TBI, hematological, and nutritional markers. Inclusion criteria encompassed permanent residence within the designated enrollment districts, a minimum of six months’ residence in the study areas, singleton birth, documented parental consent, and absence of clinical indicators of acute or chronic disease. Exclusion criteria consisted of the presence of congenital anomalies, a history of perinatal asphyxia, chronic medical conditions, and administration of any vaccination on the day of enrollment.
Data were collected between March and May 2023 in the Arequipa Region of southern Peru, encompassing areas ranging from 9 to 4310 m above sea level. The sample size was calculated to estimate the proportion of inflammation among infants, expected to be 24.7% based on previous literature. 13 Using a 95% confidence level (Z = 1.96) and a margin of error of 5%, the minimum required sample size was approximately 286 participants. A total of 280 children were recruited. Ultimately, after excluding children due to missing Hb data (n = 23) and then, 19 children due to missing inflammatory marker data, 238 infants who met the inclusion criteria were considered in the study, resulting in a statistical power of 80%.
Patients were selected consecutively from children entering the health centers within the Arequipa Department participating in the Growth and Development Control (CRED) program as established by the Ministry of Health (MINSA), during the study period, provided they met the established inclusion criteria. Three principal provinces were selected for the study: Islay (comprising 6 districts), Arequipa (29 districts), and Caylloma (20 districts). These provinces correspond to populations residing at low (N = 84; 0–999 m), moderate (N = 102; 1000–2999 m), and high altitudes (N = 94; above 3000 m), respectively. 14
This program conducts periodic and systematic activities focused on monitoring children's growth and development, with the objective of early detection of risks or disorders and identification of diseases to enable timely diagnosis and intervention. CRED visits are carried out at all primary-level health facilities, including both public and private centers, as well as in certain hospitals. 15
The reporting of this study conforms to the STROBE statement, and the checklist is available as Supplemental Material 1. 16
Biological sample
A 3 mL venous blood sample was drawn between 8:00 and 11:00 AM from the anterior forearm. Samples were collected in two tubes: one with anticoagulant for a complete blood count and the other for serum biomarker assessment.
Hematological markers
Hematological parameters were measured using a Simex Kx21N automated analyzer and included: red blood cell count (RBC, 10⁶/mm³), hemoglobin (Hb, g/dL), hematocrit (Hct, %), mean corpuscular volume (MCV, fL), mean corpuscular hemoglobin (MCH, pg/cell), mean corpuscular hemoglobin concentration (MCHC, g/dL), red cell distribution width-coefficient of variation (RDW-CV, %), white blood cell count (WBC, 10³/mm³), and platelet count (10³/mm³).
Serum biomarkers
Serum levels of ferritin (SF, µg/L), hepcidin (ng/mL), and soluble transferrin receptor (sTfR, mg/L) were measured using ELISA kits (DRG International, GmbH, Marburg, Germany). Serum transferrin (TF, mg/dL) and C-reactive protein (CRP, mg/L) were assessed via turbidimetry. Serum iron (Fe, µg/dL) was measured photometrically using Ferene (Ferene Iron WS, MS 80115310192, Kovalent, Brazil).
TBI was calculated as: TBI (mg/kg) = [−log₁₀(sTfR × 1000 / SF) − 2.8229] / 0.1207.17,18 Total iron-binding capacity (TIBC, µg/mL) was calculated as: TIBC = Serum transferrin (g/L) × 25.1. 19
Transferrin saturation (TSAT, %) was calculated as: TSAT = (Serum iron / Serum transferrin) × 70.9. 20 ID was defined as TSAT <10%.21–23 TSAT >45% was considered elevated in cases of hemochromatosis. 24
Nutritional status
Nutritional status z-scores (weight-for-height, height-for-age, weight-for-age) were calculated according to WHO guidelines. 25 Z-scores between −2 and +2 standard deviation (SD) were considered normal; < −2 and < −3 SD indicated moderate and severe malnutrition, respectively. Overweight/obesity was defined as a WHZ >+2 SD.
Definitions of anemia, normal hemoglobin, and erythrocytosis
Anemia was defined as Hb levels below 10.5 g/dL for children aged 6–23 months, below 11 g/dL for those aged 24–59 months, and below 11.5 g/dL for children aged 60–72 months. Hb values were assessed without altitude adjustment, in accordance with recommendations from certain authors.13,26,27 and adjusted for altitude according to new WHO recommendations. 28
Normal Hb levels were defined as 10.5 to less than 14.5 g/dL for children aged 6–23 months, 11 to less than 14.5 g/dL for those aged 24–59 months, and 11.5 to less than 14.5 g/dL for children aged 60–72 months. Erythrocytosis was defined as Hb levels of 14.5 g/dL or higher. 29
Iron status according to TBI
Iron status was classified by TBI as follows: Low: < 0 mg/kg; Normal: 0–5 mg/kg; High: > 5–10 mg/kg; Very high: > 10 mg/kg. 29
Serum ferritin
Low SF was defined as <12 µg/L at ages 6–59 months or <15 µg/L at ages 60–72 months. High ferritin or HF was defined as >150 µg/L in girls and >200 µg/L in boys aged 60–72 months. 30
TSAT*SF and SF/TSAT indexes
The TSAT*SF index was calculated as: TSAT × SF (µg/L). For analysis, the index was categorized as ≤300, 301–900, and >900. The SF/TSAT index was calculated as: SF (µg/L) / TSAT (%)
Inflammatory marker
Children with CRP >10 mg/L were classified as having inflammation. 22
Bias
Potential sources of bias were systematically controlled at multiple phases of the study design and implementation. Inclusion and exclusion criteria were rigorously applied, specifically omitting infants with heightened inflammatory responses, such as those attributable to recent immunization. To mitigate information bias, data collection employed standardized protocols and calibrated instrumentation. Confounding was addressed using multivariate regression analyses, with adjusted effect estimates reported to account for potential covariates.
Statistical analysis
Information was entered into an Excel database and analyzed using STATA statistical software, version 18.0. The normality of continuous variables was evaluated using the Shapiro-Wilk test. The results indicated that the variables did not follow a normal distribution (p < 0.05) (Supplemental Material 2).
Numerical variables were reported as medians ± interquartile ranges (IQR), while categorical variables were presented as absolute and relative frequencies. To evaluate differences in categories according to inflammation status, TBI categories, nutritional Z-score groups, and anemia status (without Hb altitude adjustment), bivariate analyses were conducted using chi-square tests, Mann–Whitney U tests, or Kruskal–Wallis tests, as appropriate.
Missing data was presented as the number and proportion in each variable studied for children with and without inflammation. The chi-square test was used to assess whether the amount of missing data differs significantly between groups with and without inflammation. This will serve to check if the pattern of missing data is associated with belonging to one group or another, which could indicate bias.
To assess the effect of the TSAT*SF Index as a marker of iron status in the body, different intervening variables have been analyzed in a subgroup of children with absence of inflammation (CRP < 10 mg/L). With this group of children without inflammation, three TSAT*SF Index ranges with different variables have been analyzed.
Spearman's correlation was used to assess the relationship between altitude and the following dependent variables: Hb, altitude-adjusted Hb, MCV, MCH, and MCHC (Supplemental Material 3).
Additionally, correlations were examined through exponential, logarithmic, polynomial, and power regression models; the model with the highest R² value was selected. Logistic regression models were constructed for the dichotomous dependent variables of elevated iron stores (TBI >15 mg/kg) and inflammation (CRP >10 mg/L), using TSAT*SF or log-transformed SF/TSAT as independent variables, adjusted for sex, age, and altitude. Adjusted odds ratios (aORs) were reported. Receiver operating characteristic (ROC) curves were constructed to evaluate diagnostic performance, and the area under the curve (AUC) was calculated for both markers (SF*TSAT and Log SF/TSAT) at different cut-off points (ID: TBI < 0 mg/kg; inflammation: CRP > 5 or 10 mg/L) as part of the sensitivity analysis. A p-value of less than 0.05 was considered statistically significant.
Ethics approval
The study was conducted in accordance with the Helsinki Declaration of 1975 as revised in 2024 and was approved by the Institutional Review Board of the Universidad Peruana Cayetano Heredia (Approval No. 037-01-19, Date: 16-01-2019). Authorization was also granted by the Regional Health Directorate of Arequipa to access data and contact caregivers at Ministry of Health centers. All patient details were de-identified prior to analysis to ensure confidentiality and anonymity. Parents voluntarily sign informed consent forms and were asked to complete sociodemographic and child health questionnaires. A trained nurse measured each child's height and weight during the same clinical visit, and all laboratory analyses were performed by qualified health professionals specialized in clinical laboratory procedures.
Results
In the study population, 175 children without inflammation and 63 with inflammation were observed (Table 1). Children with elevated serum inflammatory markers resided at higher altitudes (p < 0.01), which were associated with higher Hb levels (adjusted Hb, p < 0.05; unadjusted Hb, p < 0.01), and higher Hct (p < 0.01). Interestingly, unadjusted anemia prevalence was greater among children without inflammation (p = 0.0031), and adjusted anemia prevalence was similar between both groups (p > 0.05) whereas erythrocytosis was more prevalent among those with inflammation (p = 0.0003).
Description of altitude of residence, age, anemia prevalence, iron supplementation, erythrocytosis, serum iron markers, and nutritional status in children from Arequipa aged 6–72 months according to inflammation.

Data are means ± SEM. *p < 0.01; **p < 0.05. Children with inflammation included those with elevated CRP (>10 mg/L). Comparisons of anemia, iron supplements, and erythrocytosis in children with or without inflammation were analyzed with square chi test (ap = 0.0031; bp = 0.0003). No differences were observed in missing data from the groups with and without inflammation (Chi-square test, p > 0.05).
Log-transformed values of serum hepcidin, TBI, SF, the SF/TSAT ratio, and Log SF/TSAT were all significantly elevated in children with inflammation. In contrast, soluble transferrin receptor (sTfR), the TSAT*SF index, and nutritional status (measured as Z-scores) did not differ significantly between children with and without inflammation (Table 1). Missing data is lower in both groups of children (with and without inflammation) without significant differences between them (p > 0.05)
Children with inflammation also demonstrated higher RBC, MCH, MCHC, neutrophil percentage, and platelet count. Conversely, they exhibited lower RDW-CV, lymphocyte percentage, platelet distribution width, mean platelet volume, and platelet large cell ratio. No significant differences were found in MCV, WBC, or in the proportions of monocytes, eosinophils, and basophils (Supplemental Table 1).
Among 175 children with normal CRP concentrations (≤10 mg/L), the TSAT*SF index further categorized them into 70 children with an index ≤300, 68 children with an index of 301–900, and 36 children with an index >900, totaling 174 children with only one missing data point. Children in the >900 group resided at higher altitudes and exhibited higher Hb levels, lower prevalence of anemia, higher prevalence of erythrocytosis, and elevated serum iron, hepcidin, TBI, TSAT, and SF levels. Additionally, they had significantly lower height-for-age (HAZ) and weight-for-age (WAZ) Z-scores compared to those with lower TSAT*SF index (Table 2).
Description of altitude of residence, age, anemia prevalence, iron supplementation, erythrocytosis, serum iron markers, and nutritional status in children without inflammation from Arequipa aged 6–72 months.

IS: iron supplementation; sTfR: soluble transferrin receptor; TBI: total body iron; TSAT: transferrin saturation (%); SF: serum ferritin; WHZ: weight per age z score: WAZ; HAZ: height per age z score; CRP: C-reactive protein.
Data are means ± SEM. ap = 0.03 (Chi-square test). *p < 0.01; **p < 0.05 with respect to the group of children with TSAT*SF Index 300–900.
In the full sample from Arequipa (n = 238), serum CRP showed positive correlations with altitude (r = 0.35; p < 0.01), SF (r = 0.16; p < 0.05), unadjusted Hb (r = 0.22; p < 0.01), hepcidin (r = 0.33; p < 0.01), TBI (r = 0.19; p < 0.05), RBC (r = 0.17; p < 0.05), WBC (r = 0.28; p < 0.01), platelets (r = 0.14; p < 0.05), and neutrophils (r = 0.26; p < 0.01). Negative correlations were observed with serum iron (r = –0.16; p < 0.05) and lymphocyte percentage (r = –0.28; p < 0.01). No significant correlations were found between CRP and age, sTfR, TSAT, MCV, MCH, MCHC, RDW-SD, eosinophils, basophils, monocytes, the TSAT*SF index, or altitude-adjusted Hb (Table 3). Additionally, WBC did not correlate significantly with either unadjusted (r = 0.09; p > 0.05) or altitude-adjusted Hb (r = 0.06; p > 0.05) (data not shown).
Correlation between C-Reactive protein (mg/L) and different variables in 238 children aged 6–72 months.

The outcome variable was C-reactive protein (CRP). Mean corpuscular volume (Femtoliter), Mean corpuscular hemoglobin (MCH, pg/cell), Mean corpuscular hemoglobin concentration (MCHC, g/dL).
Altitude correlated positively with Hb, adjusted Hb, MCH, MCHC, SF, hepcidin, sTfR, and CRP (Supplemental material 2).
Figure 1 illustrates positive correlations between CRP and WBC (upper panel), a negative correlation with lymphocytes (middle panel), and a positive correlation with neutrophils (lower panel).

Correlation between C-reactive protein (mg/L) in 238 children from Arequipa aged 6 to 72 months with (A) White blood cells count, (B) Lymphocytes and (C) Neutrophils.
Figure 2 shows that the log-transformed SF/TSAT index is positively correlated with serum CRP concentration ( 2A; p < 0.01), while no significant correlation was found between CRP and the TSAT*SF index (2b; p > 0.05). However, CRP did correlate positively with TBI (2c; p < 0.01).

Correlation between C-reactive protein (mg/L) in 238 children from Arequipa aged 6 to 72 months with (A) Log SF/TSAT index, (B) TSAT*SF Index and (C) total body iron (TBI).
Figure 3 demonstrates that TBI is positively correlated with both the Log SF/TSAT ratio and the TSAT*SF index (p < 0.01 for both). Figure 4 shows that serum hepcidin correlates with the Log SF/TSAT ratio (p < 0.01), but not with the TSAT*SF index (p > 0.05).

Correlation between total body iron (TBI) in 238 children from Arequipa aged 6 to 72 months with (A) Log SF/TSAT index and (B) TSAT*SF Index.

Correlation between serum hepcidin (ng/mL) in 238 children from Arequipa aged 6 to 72 months with (A) Log SF/TSAT index and (B) TSAT*SF Index.
Logistic regression analysis showed that Log. SF/TSAT but not TSAT*SF was associated with inflammation when altitude, age, and sex were controlled. Increased altitude was associated with inflammation, and female children had less risk for inflammation (Table 4). Increased values of Log SF/TSAT and SF*TSAT, both were associated with IO (p < 0.001) (Table 5).
Logistic regression analysis to associate inflammation and predictor markers in children aged 6–72 months residing in Arequipa.
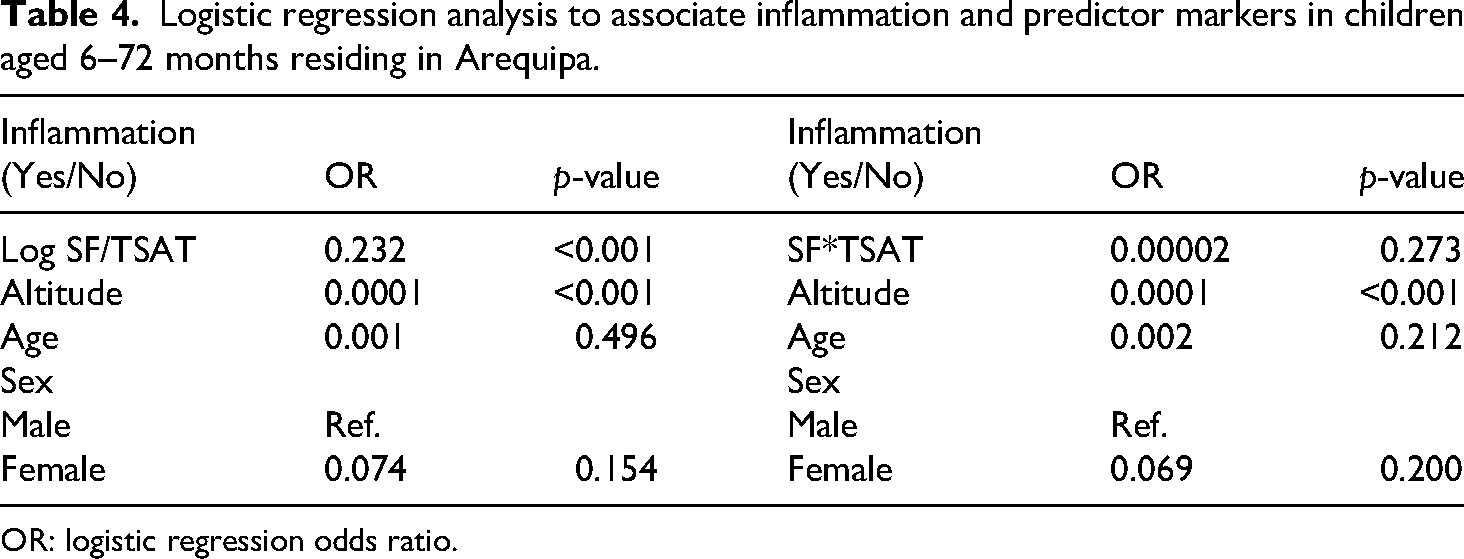
OR: logistic regression odds ratio.
Logistic regression analysis to associate iron overload and predictor markers in children aged 6–72 months residing in Arequipa.

OR: logistic regression odds ratio.
Figure 5 presents the ROC curves based on the SF*TSAT and Log SF/TSAT ratios, considering two outcomes: ID (TBI < 0) and inflammation (CRP > 5 mg/L). Table 6 summarizes the AUC values from both unadjusted and adjusted models (adjusted for sex, age, and altitude). A differentiated performance is observed for the SF*TSAT ratio, with a significant difference between the AUCs for ID and inflammation (0.75 vs 0.98, respectively; p < 0.05).

ROC curves and corresponding area under the curve (AUC) for the diagnosis of inflammation (CRP > 5 mg/L): (A) SF*TSAT; (B) Log SF/TSAT; and for the diagnosis of iron deficiency (TBI < 0 mg/kg): (C) SF*TSAT; (D) Log SF/TSAT. All models were adjusted for altitude, age, and sex.
AUC values for iron deficiency and inflammation, based on the SF*TSAT and LogSF/TSAT ratios.
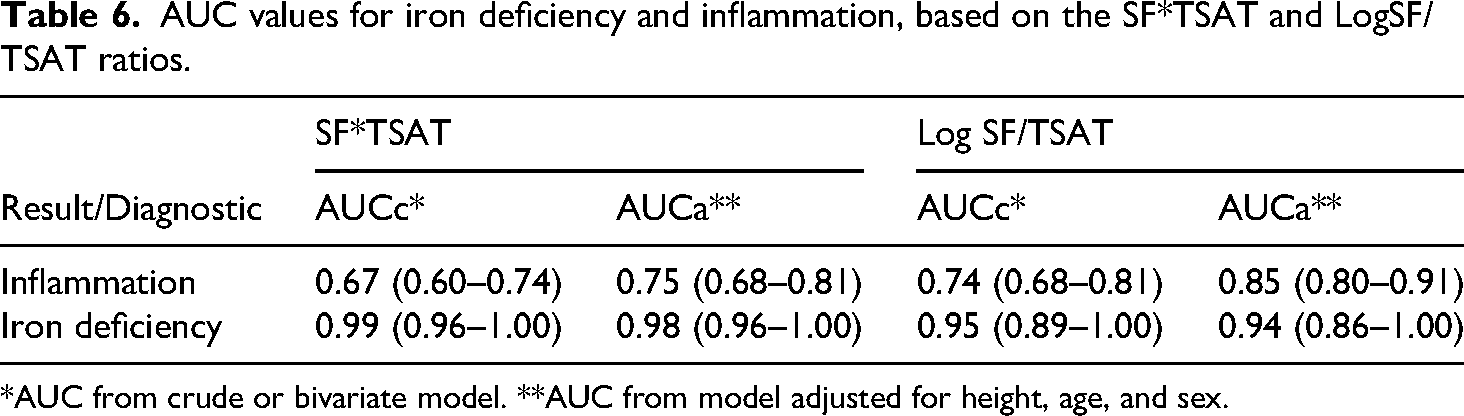
*AUC from crude or bivariate model. **AUC from model adjusted for height, age, and sex.
Discussion
Given the overlap of contributing factors and the need for simple, low-cost biomarkers, there is a pressing need for reliable, inflammation-independent indices of IO. Although elevated TSAT and SF levels can identify over 95% of individuals with grade 3 LIC as determined by MRI, this level of diagnostic accuracy is generally achieved only when TSAT exceeds 60% and SF exceeds 963 µg/L. 31 In such cases, the need for MRI assessments can be reduced by more than 50%.
Our study introduces and evaluates the TSAT*SF index as a novel marker of tissue iron content. This index showed a strong correlation with TBI, but notably did not correlate with CRP or other inflammatory markers. In contrast, the SF/TSAT ratio was associated with both iron status and inflammation. Indeed, the log-transformed SF/TSAT ratio was five times higher in children with inflammation compared to those without.
The TSAT*SF index appears to reflect iron-related changes independently of inflammatory status. Children with low TSAT*SF values were eight times more likely to be anemic than those with elevated TSAT*SF levels. Conversely, children with high TSAT*SF values were four times more likely to present with erythrocytosis compared to those with low TSAT*SF values.
Humans cannot synthesize iron and must obtain it from dietary sources. Under normal physiological conditions, intestinal iron absorption is tightly regulated by circulating hepcidin levels to meet the body's iron requirements, thereby maintaining homeostasis and preventing IO. 11 While ID remains a leading global cause of anemia, inflammation has emerged as a significant contributing factor particularly in low- and middle-income countries (LMIC) where infectious diseases such as malaria are endemic. 32
Assessing iron status in children presents significant challenges due to the confounding effects of inflammation. CRP and alpha-1-acid glycoprotein (AGP) are commonly used biomarkers to indicate inflammatory activity. When SF is used to assess ID, adjusting for inflammation based on CRP levels has been shown to increase ID prevalence estimates by approximately 3% in preschool-aged children and 7% in women.18,33 These differences between children and women indicate that inflammation affects the interpretation of iron markers differently depending on the population group.
Another possibility is to incorporate the erythroferrone/hepcidin ratio, which has been evaluated in other populations and allows for the discrimination of individuals with ID. 34 However, this measurement, in the context of primary health care, involves high costs and limited accessibility.
SF primarily reflects iron stores, particularly hepatic iron. 35 However, because SF is an acute-phase reactant, its circulating levels can rise in response to inflammation, complicating the accurate assessment of iron status.36–38 Consistent with this, our findings confirm a positive association between SF concentrations and markers of inflammation.
The widespread use of iron supplementation and food fortification in children may expose those without anemia or ID to excessive iron intake. 39 This has raised concerns among researchers about the harmful effects of excess iron on tissues.40,41
A two-step Mendelian randomization study demonstrated that excess body iron is a causal factor in NAFLD, 42 a condition affecting up to 25% of the global population. 43 By 2021, NAFLD cases among adolescents and young adults had increased by 75.31% since 1990, reaching an estimated 423 million globally. 44
Although HF is often interpreted as IO, 12 SF is also elevated during inflammation, limiting its diagnostic utility. To address this, TBI calculated using SF and sTfR has been proposed as an alternative marker. 17 Some studies suggest that TBI is unaffected by inflammation, 17 but others indicate it may be influenced, particularly in children.13,45 In our study, serum CRP was significantly correlated with TBI, limiting its use unless inflammation is accounted for, as has been proposed for SF. 33
We observed that elevated CRP levels were associated with increased WBC count, platelets, and neutrophils, and decreased lymphocytes hallmarks of systemic inflammation.46–48
Environmental factors, such as high altitude (HA), influence inflammation. Hypoxia induces interleukin-6 (IL-6) production. 49 In our cohort, CRP increased with altitude, consistent with prior findings from another HA region, where IL-6 was elevated in native children without a corresponding increase in serum hepcidin. 13 Our analysis showed no significant association between altitude and WBC counts, suggesting that low-grade inflammation at HA may be a physiological adaptation rather than a pathological condition.
Hepcidin, the master regulator of iron metabolism, is influenced by both iron status and inflammation. 50 In our study, hepcidin was more closely associated with inflammation than with true IO, limiting its usefulness as an iron status biomarker in inflammatory contexts.
Iron homeostasis is shaped by complex interactions among ferritin, hepcidin, erythropoiesis, oxidative stress, hypoxia, and inflammation. 51 In recent decades, public health efforts to combat anemia through iron supplementation and fortification have led to increased iron intake among non-anemic individuals, raising concerns about tissue damage caused by iron excess. 52
Excessive iron intake and high systemic iron levels can disrupt intestinal iron regulation and lead to IO and ferroptosis, a form of cell death driven by iron-dependent lipid peroxidation, contributing to intestinal disease. 53
It is therefore essential to identify a biomarker that can indicate increased iron availability in the blood independently of inflammation. According to our findings, the TSAT*SF index meets this criterion more effectively than the SF/TSAT ratio, TBI, or serum hepcidin.
Our results suggest that children living in HA may be more susceptible to developing IO. A high TSAT*SF index was associated with increased Hb, serum iron, hepcidin, and TBI factors that may contribute to physiological dysfunction.
In children from Arequipa, a high TSAT*SF index was linked to a fourfold increase in erythrocytosis rates compared to those with index values <300. Erythrocytosis is a known contributor to chronic mountain sickness in high-altitude populations. 54
Physiological high-altitude erythrocytosis is a normal adaptive response, whereas pathological high-altitude polycythemia results in impaired oxygen delivery, increased blood viscosity, microvascular congestion, and tissue hypoxia. 55 In a separate cohort of children from Arequipa living at altitudes ranging from 0 to 4500 m, elevated Hb (erythrocytosis) was associated with increased rates of stunting. 56
Furthermore, our study showed that a high TSAT*SF index negatively affected growth and development, as reflected in reduced HAZ and WAZ scores. Short stature, low weight, and delayed sexual development, well-documented in children with beta-thalassemia major, are often linked to IO. 57 In the general pediatric population, excessive iron accumulation from dietary sources may similarly impair growth and development. 58
One limitation of this study is the absence of direct assessment of iron levels in tissues such as the liver and heart to evaluate the relationship between the TSAT*SF index and actual iron reserves in these organs. While liver or cardiac biopsy remains the gold standard for accurately measuring tissue iron content, this procedure is invasive and carries a risk of complications. Consequently, biopsies are not routinely performed in children unless strongly clinically indicated, making their use unfeasible for population-based studies such as the present one. Furthermore, the collection of such samples requires specific facilities and conditions that are unlikely to be met across all study sites. The second one, the use of serum biomarkers such as SF, hepcidin, and TBI has intrinsic constraints, since SF is strongly influenced by inflammation, hepcidin is highly regulated by inflammatory cytokines such as IL-6, and TBI calculations may be less reliable in children due to ontogenetic variations.
An alternative method is T2* MRI, which is employed in clinical contexts, such as IO secondary to transfusions or in children at risk for metabolic syndrome. 59 However, this technique requires age-specific precautions, is not widely accessible, and is costly, further limiting its applicability in large-scale population studies.
This study utilized a convenience sample comprising children attending health centers for growth and development evaluations. Consequently, the findings are specific to this cohort and may not be generalizable to broader populations. The primary objective, however, was to assess a novel diagnostic methodology for quantifying body iron levels independent of inflammatory status. The method demonstrated robust performance in both the overall study population and the inflammation-free subgroup, indicating its potential utility in varied field settings. Furthermore, this approach represents a cost-effective alternative to conventional gold-standard diagnostic modalities.
Conclusion
In conclusion, our study supports the use of TSAT*SF as a simple and effective index for assessing tissue IO, particularly in pediatric populations exposed to altitude and inflammation. Unlike conventional markers, this novel index offers a more reliable evaluation of iron status, as it is less affected by inflammatory processes.
Supplemental Material
sj-docx-1-sci-10.1177_00368504251385071 - Supplemental material for A novel diagnostic approach to differentiate iron overload from inflammation in children using transferrin saturation (TSAT) and ferritin-based indices: A cross-sectional study
Supplemental material, sj-docx-1-sci-10.1177_00368504251385071 for A novel diagnostic approach to differentiate iron overload from inflammation in children using transferrin saturation (TSAT) and ferritin-based indices: A cross-sectional study by Gustavo F Gonzales, Julio Aguilar, Sandra Yucra and Cinthya Vásquez-Velásquez in Science Progress
Footnotes
Acknowledgements
We sincerely thank all the children and their families for their participation and cooperation in this study. Their contributions were invaluable to the success of this research. We also thank Cecilia Manrique-Sam for her support in the recruitment of the infants and Dr Manuel Gasco for his support in the work of field. We acknowledge the use of an AI-based language tool (ChatGPT) to improve the grammar and readability of the manuscript. All content, analysis, and conclusions are the sole responsibility of the authors.
Author contributions
GFG contributed to conceptualization, data curation, formal analysis, investigation, methodology, validation, visualization, writing—original draft, and writing—review & editing. CV-V contributed to data curation, formal analysis, and writing—review & editing. SY contributed to investigation and supervision. JA contributed to conceptualization, funding acquisition, methodology, project administration, resources, supervision, validation, visualization, and writing—review & editing. All authors reviewed and approved the final version of the manuscript.
Funding
The authors disclosed receipt of the following financial support for the research, authorship, and/or publication of this article: Dr Julio Aguilar, from Jorge Basadre Grohmann-Tacna National University, received financial support for this research through Rectoral Resolution No. 4596-2018-UNJBG, funded by Canon, Sobrecanon, and Mining Royalties resources. The funders had no role in the study design, data collection and analysis, decision to publish, or preparation of the manuscript.
Declaration of conflicting interests
The authors declared no potential conflicts of interest with respect to the research, authorship, and/or publication of this article.
Availability of data and materials
The data is available in the ZENODO repository, under the DOI: 10.5281/zenodo.15161509.
Supplemental material
Supplemental material for this article is available online.
References
Supplementary Material
Please find the following supplemental material available below.
For Open Access articles published under a Creative Commons License, all supplemental material carries the same license as the article it is associated with.
For non-Open Access articles published, all supplemental material carries a non-exclusive license, and permission requests for re-use of supplemental material or any part of supplemental material shall be sent directly to the copyright owner as specified in the copyright notice associated with the article.