
Abstract
Objective
Hepatocellular carcinoma (HCC) has a poor prognosis, necessitating novel biomarkers. The role of LSM7 (Like-Sm protein 7), an RNA-binding protein, in HCC remains unclear.
Methods
We employed a multiomics strategy using transcriptomic data from TCGA, GTEx, GEO, and ICGC to evaluate LSM7's expression and prognostic value. A protein–protein interaction (PPI) network was constructed via STRING, followed by Gene Ontology/KEGG/Gene Set Enrichment Analysis (GSEA) functional enrichment analysis. The relationship between LSM7 and the immune infiltration landscape was assessed using single-sample GSEA (ssGSEA) and the TISCH single-cell database. Drug sensitivity was analyzed using Genomics of Drug Sensitivity in Cancer, and structure-based virtual screening was performed on the ZINC library to identify potential LSM7 inhibitors. Key findings were validated in clinical samples and MHCC97H cells and Huh-7 cells using Western blot, IHC, and MTT assays.
Results
LSM7 was significantly overexpressed in HCC, correlating with adverse clinicopathological features (higher histological grade, elevated AFP levels, vascular invasion) and shorter overall survival, identifying it as an independent risk factor. Functionally, LSM7 was implicated in processes such as hormone regulation. Immune analysis revealed that high LSM7 expression was associated with altered immune cell abundance, upregulation of immune checkpoints, and a higher Tumor Immune Dysfunction and Exclusion score, suggesting a role in immune evasion. The high-LSM7 group showed increased sensitivity to drugs like sorafenib. Virtual screening identified Velpatasvir as a top LSM7-targeting candidate, with in vitro validation confirming that it inhibits MHCC97H cells and Huh-7 cells proliferation and downregulates LSM7 protein in a concentration- and time-dependent manner.
Conclusions
By integrating multiomics strategy and experimental validation, this study suggests that LSM7 may play a role in HCC progression and influence the tumor immune microenvironment. LSM7 may serve as a potential biomarker and therapeutic target, and Velpatasvir appears to be a candidate agent worthy of further investigation.
Keywords
Introduction
Despite advances in prevention and treatment, liver cancer remains the third deadliest malignancy worldwide. Over the past decade, while overall cancer survival in China has risen by roughly 10 percentage points, survival for liver cancer has barely improved.1,2 Hepatocellular carcinoma (HCC), comprising ∼90% of primary liver cancer, 3 is molecularly heterogeneous even within the same stage, impeding targeted therapy. 4 The occurrence and development of HCC have been shown to be related to the immune microenvironment. Based on this, immune checkpoint inhibitors (ICIs) were developed, and the combination therapy of ICIs such as atezolizumab and the antivascular endothelial growth factor drug bevacizumab is the first treatment plan that has been proven to improve the overall survival (OS) rate of patients with advanced HCC compared with sorafenib. 5 Therefore, it is urgently needed to find new biological targets and clarify their relationship with immune infiltration to improve the prognosis of HCC.
LSM7 (Like-Sm protein 7) is a member of the LSM family, which consists of RNA-binding proteins (RBPs) that are found across all three domains of life. They form ring-shaped complexes on specific RNAs, participating in RNA biosynthesis, function, and degradation. 6 Previous study has shown that LSM proteins can promote anchorage-independent growth, tumor formation, and reduced growth factor dependence. In addition, transforming acidic coiled-coil proteins have been reported to interact with LSM7 to form complexes that may influence breast cancer–related cellular processesr. 7 More recently, RIP-seq analyses revealed that LSM7 directly binds CD44 RNA, enhances the expression of alternatively spliced CD44 isoforms, and consequently promotes tumor cell migration and invasion in vitro, as well as spontaneous lung metastasis in vivo. 6 Despite this, the molecular mechanism of LSM7 in the occurrence of HCC remains unclear.
Our study examines the expression pattern of LSM7 in liver cancer and its association with key clinical features (shown in Graphical Abstract). We also explore its potential diagnostic and prognostic relevance, as well as its relationship with immune infiltration. In addition, we perform virtual drug screening to identify compounds that may interact with LSM7. These findings suggest that LSM7 may have potential value as a biomarker and therapeutic target in HCC.
Materials and methods
Data acquisition and preprocessing
Pan-cancer and liver HCC (LIHC) RNA-seq data were retrieved from The Cancer Genome Atlas (TCGA; https://portal.gdc.cancer.gov) and the Genotype-Tissue Expression project (GTEx; https://www.gtexportal.org). Validation cohorts GSE14520 (n = 225) and ICGC-LIRI-JP (n = 243) were downloaded from the Gene Expression Omnibus (GEO; https://www.ncbi.nlm.nih.gov/geo) and ICGC data portals, respectively. Fragments per kilobase per million values were converted to transcripts per million (TPM) and log2(TPM + 1) prior to analysis.
Human specimens
From December 2023 to June 2024, paired HCC lesions and adjacent nontumor liver tissues were collected from 19 patients with liver cancer undergoing curative resection at the Department of Hepatobiliary, Pancreatic and Hernia Surgery, Guangdong Second Provincial General Hospital (GD2H). For Western blotting, tissue samples from four patients were selected. Specimens were snap-frozen in liquid nitrogen within 15 min of devascularization and stored at −80 °C.
qRT-PCR and Western blotting
Total RNA was extracted from frozen tissues with TRIzol reagent (Invitrogen, Guangzhou, China) following the manufacturer's instructions. One microgram of RNA was reverse-transcribed with the PrimeScript RT Reagent kit plus gDNA Eraser (Takara Bio, Otsu, Japan). The primer sequences were as follows: LSM7, forward 5′-GACGATCCGGGTAAAGTTCCA-3′ and reverse 5′-AGGTTGAGGAGTGGGTCGAA-3′; GAPDH (reference), forward 5′-TGAAGGTCGGAGTCAACGGAT-3′ and reverse 5′-TCGCTCCTGGAAGATGGTGAT-3′. Relative expression was calculated by the 2−ΔΔCt method and normalized to GAPDH.
Tissue lysates were prepared with RIPA buffer containing 1% PMSF (Beyotime, Shanghai, China). Protein (20 μg) was separated on 12% SDS-PAGE, transferred to PVDF membranes (Millipore), and blocked with 5% nonfat milk. Membranes were incubated overnight at 4 °C with rabbit anti-LSM7 (1:5000; Cat. No. PHR8731, Abmart, Shanghai, China) or mouse anti-GAPDH (1:5000; Cat. No. 60004-1-Ig, Proteintech, Wuhan, China), followed by HRP-conjugated secondary antibodies (1:10,000; Cat. No. SA00001-2, Proteintech, Wuhan, China) for 1 h at room temperature. Bands were visualized with ECL reagent (Thermo) and quantified using ImageJ v1.54.
Immunocytochemistry
For immunohistochemistry, fresh tissues were fixed in 10% neutral-buffered formalin for 24 h, dehydrated, paraffin-embedded, and sectioned (4 μm). After deparaffinization and antigen retrieval (citrate pH 6.0), endogenous peroxidase was quenched with 3% H2O2 for 10 min. Sections were incubated with anti-LSM7 (1:1000; Cat. No. PHR8731, Abmart, Shanghai, China) at 4 °C overnight, followed by HRP-labeled polymer (Dako) and DAB chromogen. Hematoxylin counter-staining, dehydration, and mounting were performed according to standard protocols. Staining intensity was scored independently by two pathologists blinded to clinical data.
Cell inhibition and cytotoxicity assay
MHCC97H (RRID: CVCL_4972) and Huh-7 (RRID: CVCL_0336) cells, both obtained from the Shanghai Cell Bank of the Chinese Academy of Sciences, MHCC97H cells and Huh-7 cells were maintained in DMEM (Gibco) supplemented with 10% FBS and 1% penicillin-streptomycin at 37 °C with 5% CO2. For viability assays, 5 × 10³ cells per well were seeded in 96-well plates, allowed to attach overnight, and treated with Velpatasvir (Selleck; 0–768 nM) or vehicle (0.1% DMSO) for 24, 36, or 48 h. MTT (5 mg/mL, 20 μL) was added for 4 h, after which medium was aspirated and 150 μL DMSO was added to dissolve the formazan. Absorbance was measured at 570 nm using a PerkinElmer EnSight plate reader. Viability was calculated as: (ODtreat − ODblank)/(ODcontrol − ODblank) × 100%.
Establishment of the prognostic gene signature
Clinical and survival data were extracted from TCGA-LIHC and Liu et al. 8 Expression differences across clinicopathologic variables were assessed using R v4.2.1. Time-dependent ROC curves were generated with the “survivalROC” package. 9 Kaplan–Meier curves and log-rank tests were used to compare survival outcomes. Independent prognostic factors were identified by multivariate Cox regression and incorporated into a nomogram using the “rms” package. Calibration plots (1000 bootstrap resamples) were used to assess predictive accuracy. 10 The thresholds for identifying significant genes were log2FC > 1 and adjusted p-value <.05.
PPI networks and single-gene correlation analysis
The STRING database (v11.5; https://string-db.org) 11 was queried for LSM7 interactors (confidence ≥ 0.7). Networks were visualized in Cytoscape v3.9. In the TCGA-LIHC cohort, the expression correlation between LSM7 and all protein-coding genes was calculated, and the top 10 positively and negatively correlated genes were visualized in a heatmap.
Enrichment analysis
Differentially expressed genes (|log2FC| > 1, adjusted p < .05) between tumors with high and low LSM7 expression were subjected to Gene Ontology (GO) and Gene Set Enrichment Analysis (GSEA) using clusterProfiler v4.6. Gene sets with FDR < 0.25 and adjusted p < .05 were considered significant. Reference gene sets were C2.cp.v7.2.symbols.gmt and C5.all.v7.2.symbols.gmt (from MSigDB). 12
Analysis of immune infiltration and immune checkpoints
The relative abundance of 24 immune cell subsets was estimated by single-sample GSEA (ssGSEA) using the GSVA v1.46.0 package and marker genes described by Bindea et al. 13 Group differences and the association between LSM7 expression and drug sensitivity were assessed using comparative and correlation analyses. Single-cell expression was interrogated in TISCH (http://tisch.comp-genomics.org) using datasets GSE125449, GSE140228, and GSE166635. 14 Seventy-nine immune checkpoint genes (ICGs) were curated from the literature 15 ; their correlations with LSM7 were calculated and visualized with corrplot. Tumor Immune Dysfunction and Exclusion (TIDE) scores, exclusion scores, dysfunction scores, and Microsatellite Instability (MSI) scores were downloaded from http://tide.dfci.harvard.edu; Immune Phenotype Scores (IPS) were retrieved from The Cancer Imaging Archive.
Drug sensitivity analysis
IC50 values for six commonly used hepatobiliary drugs were estimated from Genomics of Drug Sensitivity in Cancer (https://www.cancerrxgene.org) using the “pRRophetic” package. 16 Differences between the high-LSM7 and low-LSM7 groups were assessed by Wilcoxon tests. The association between LSM7 expression and drug sensitivity was evaluated by correlation analysis.
Virtual screening of drugs for LSM7
The crystal structure of LSM7 (PDB ID: 7ABG, 7.8 Å) was prepared in Chimera v1.16 by adding hydrogens and assigning AMBER14SB charges. A library of 5903 approved drugs (ZINC15 subset “World”) was converted to 3D conformers using SPORES v1.3. Binding pockets were detected with DoGSiteScorer; the top-ranked pocket (P0, volume 422.78 Å3, surface area 821.21 Å2, depth 14.2 Å) was used for docking. Ligands were docked with PLANTS v1.2 using ChemPLP scoring and a 15 Å sphere centered on the pocket centroid. The best pose (RMSD ≤ 2.0 Å) was selected for each compound. Two-dimensional interaction maps were generated with LigPlot + v2.2.5 and three-dimensional images with PyMOL v2.5.
Single-cell inference of LSM7 function
Using the GSE202642 scRNA-seq atlas (Figure 1A), we performed QC, normalization, clustering and cell-type annotation with Seurat. Epithelial cells were extracted, reclustered and split into LSM7-high and LSM7-low subsets based on the median LSM7 transcript count. The thresholds for high and low LSM7 expression were determined using log2 fold change (log2FC) and adjusted p-values (FDR < 0.05). Monocle3 17 was used to reconstruct the pseudotemporal trajectory of the LSM7-high population. Single-cell pathway activities for MAPK, Notch, PI3 K and WNT were quantified with singscore. Differential expression analysis between the two subsets (LSM7-high vs LSM7-low) was performed using log2FC and adjusted p-values (FDR < 0.05) to identify signature genes of the LSM7-high population. These genes were subsequently subjected to GO and KEGG enrichment analysis to reveal the associated biological processes and pathways.

LSM7 mechanism prediction in single-cell profiling and visualization in hepatocellular carcinoma. (A) Distribution plots showing the relationship between the number of molecules and ribosomal, mitochondrial, and gene counts. (B) UMAP plots displaying different cell clusters. (C) Extraction of epithelial cells with classification of high and low LSM7 expression. (D) Trajectories of epithelial cells with high and low LSM7 expression. (E) SingScore single-cell scoring UMAP distribution maps for the MAPK, NOTCH, PI3K, and WNT pathways. (F) GO/KEGG enrichment analysis of high LSM7 expression cell populations, highlighting biological processes, cellular components, molecular functions, and KEGG pathways.
Ethics approval
This study was conducted in accordance with the Declaration of Helsinki (1975, as revised in 2024) and was approved by the Medical Research Ethics Committee of Guangdong Second Provincial General Hospital on 30 August 2023 (Approval No. 2023-KY-KZ-139-03). Written informed consent was obtained from all participants prior to tissue donation.
Statistical analyses
All statistical analyses were performed in R v4.2.1. Differences between two groups were evaluated with paired t-tests or Mann–Whitney U tests, as appropriate. Logistic regression was used to assess associations between clinicopathologic features and LSM7 expression. Pearson's correlation analysis was employed to quantify the strength and direction of linear relationships between continuous variables, including screening LSM7-related genes in TCGA-LIHC and evaluating the association between LSM7 expression and drug sensitivity. A two-sided p < .05 was considered statistically significant: *p < .05, **p < .01, ***p < .001, ****p < .0001; ns, not significant.
Results
Expression pattern of LSM7 in pan-cancer perspective
As demonstrated in Figure 2, LSM7 exhibits significant differential expression in 29 out of 31 cancer types compared to normal tissues. Notably, LSM7 was overexpressed in tumor tissue samples, with the exception of acute myeloid leukemia (LAML). This suggests that LSM7 may play a role in various types of cancer, with its overexpression being a common feature in many tumor tissues.

Pan-cancer expression landscape of LSM7. The expression levels of LSM7 were analyzed in 31 types of cancer tissues and normal tissues based on the TCGA database and GTEx database.
LSM7 mRNA and protein expression levels are upregulated in HCC patients
LSM7 mRNA expression was significantly higher in HCC tissues (n = 374) compared to normal controls (n = 50) (4.184 ± 0.726 vs 3.154 ± 0.376, p < .001) as shown in Figure 3A. This overexpression of LSM7 was also confirmed in the ICGC and GSE14520 datasets (Figures 3B and 3C). Similar results were observed in the GD2H cohort with 19 samples (Figure 3D). Western blotting (Figure 3E) and immunohistochemistry (Figure 3F) further revealed elevated LSM7 protein levels in tumor tissues.

Validation of LSM7 upregulation in HCC. (A–D) LSM7 mRNA levels in TCGA-LIHC (n = 374 tumor vs 50 normal), ICGC-LIRI-JP (n = 243), GSE14520 (n = 225), and GD2H (n = 19). ***p < .001. (E) Representative Western blot of LSM7 protein in four patient-matched HCC (T) and adjacent nontumor (N) samples collected in this study. Quantification of Western blot signals normalized to GAPDH. ***p < .01. (F) Immunohistochemistry of LSM7 in paraffin-embedded HCC and adjacent liver (original magnification ×200; scale bar, 100 μm).
Association between LSM7 and clinicopathologic variables of liver HCC
The baseline characteristics of HCC patients are detailed in Table 1. The expression level of LSM7 was found to be significantly higher in tumors with a higher histologic grade (p = .003), AFP levels exceeding 400 ng/mL (p < .001), and vascular invasion (p = .022). However, no statistically significant correlation was found between the expression levels of LSM7 and other clinical-pathological features such as tumor size (p = .529), lymph node metastasis (p = .636), distant metastasis (p = .667), pathologic stage (p = .543), gender (p = .740), and age (p = .438). These results indicate that LSM7 overexpression is associated with more aggressive HCC features, such as higher histologic grade, elevated AFP levels, and vascular invasion, suggesting that LSM7 may serve as a valuable biomarker for both the diagnosis and prognosis of HCC.
Clinicopathologic characteristics of TCGA-LIHC patients (n = 374) by LSM7 expression median split.

Evaluation of diagnostic and prognostic value of LSM7 in HCC
To assess the diagnostic value of LSM7, we used ROC curve analysis to investigate its ability to distinguish HCC samples from normal liver tissues. As shown in Figure 4A, LSM7 exhibited excellent diagnostic performance with an AUC value of 0.925 (95% CI [0.891–0.959]). At a cutoff value of 4.663, the specificity, sensitivity, and accuracy of LSM7 were 84.0%, 89.6%, and 88.9%, respectively. Additionally, time-dependent ROC analysis was performed to evaluate the predictive accuracy of LSM7 for OS over 1, 3, and 5 years (Figure 4B). Kaplan–Meier survival analysis showed that patients with high LSM7 expression had significantly shorter OS (Figures 4C–E), progression-free survival (18.4 vs 24.7 months, p = .324), and disease-specific survival (80.5 vs 83.4 months, p = .447), compared to those with low LSM7 expression.

Diagnostic and prognostic value of LSM7 in HCC. (A) ROC curve distinguishing HCC from normal tissue; AUC = 0.925. (B) Time-dependent ROC for 1-, 3-, and 5-year overall survival (OS). (C–E) Kaplan–Meier curves for OS, progression-free survival, and disease-specific survival stratified by LSM7 median expression. (F) Forest plot of multivariate Cox regression (TCGA-LIHC). (G) Nomogram predicting 1-, 3-, and 5-year OS. (H) Calibration plot of observed versus predicted survival probabilities.
To confirm that LSM7 expression is an independent prognostic factor for HCC, we performed both univariate and multivariate logistic regression analyses. Figure 4F shows the results of the multivariate logistic regression analysis, indicating that LSM7 (1.984, 95% CI [1.266–3.107], p = .003) and tumor size (T3: 3.502, 95% CI [2.084–5.884], p < .001; T4: 5.128, 95% CI [1.887–13.931], p = .001) are independent prognostic factors for HCC. Additionally, a nomogram was developed based on these independent prognostic factors to predict the 1-, 3-, and 5-year survival probabilities for HCC (Figure 4G). Calibration plots demonstrated that the nomogram had good predictive accuracy, although it slightly under- or overestimated mortality in some cases (Figure 4H).
PPI network and functional enrichment analyses of LSM7
To investigate the biological functions associated with LSM7, we first constructed a PPI network centered on LSM7 using the STRING database, visualized with Cytoscape (Figure 5A). Differential expression analysis revealed a list of genes positively and negatively associated with LSM7 expression, presented in a heatmap (Figure 5B). GO analysis of LSM7-related genes showed significant enrichment in biological processes related to hormone regulation, cellular responses to xenobiotics, and immunoglobulin complex binding (Figure 5C). Furthermore, GSEA revealed that high LSM7 expression was positively correlated with pathways related to mesodermal commitment, endoderm differentiation, and olfactory transduction, while negatively correlating with pathways involved in xenobiotic metabolism and cytochrome P450-related processes (Figure 5D).

Functional annotation of the LSM7-associated interactome. (A) PPI network constructed in STRING and visualized in Cytoscape (confidence ≥ 0.7). (B) Heatmap of top 10 genes positively and negatively correlated with LSM7 expression. (C) GO biological-process enrichment. (D) GSEA showing positively and negatively enriched hallmark pathways (FDR < 0.25). LSM1 – Like-Sm protein 1; LSM2 – Like-Sm protein 2; LSM3 – Like-Sm protein 3; LSM4 – Like-Sm protein 4; LSM5 – Like-Sm protein 5; LSM6 – Like-Sm protein 6; LSM8 – Like-Sm protein 8; PRPF4 – Pre-mRNA-processing factor 4 homolog A; SNRPA1 – Small nuclear ribonucleoprotein polypeptide A; SNRPB – Small nuclear ribonucleoprotein polypeptides B and B1; SNRPD2 – Small nuclear ribonucleoprotein D2; SNRPD3 – Small nuclear ribonucleoprotein D3; SNRPE – Small nuclear ribonucleoprotein E; SNRPF – Small nuclear ribonucleoprotein F; SNRPG – Small nuclear ribonucleoprotein G; SNRNP200 – Small nuclear ribonucleoprotein 200; SART1 – Squamous cell carcinoma antigen recognized by T-cells 1; SF3B5 – Splicing factor 3B subunit 5; TXNL4A – Thioredoxin-like protein 4A; ZMAT2 – Zinc finger matrin-type 2.
The correlation between LSM7 expression and immune infiltration and immune checkpoints
Analysis of immune cells infiltration based on the TCGA database revealed significant differences in the abundance of 10 out of 24 immune cell subtypes between the high and low LSM7 expression groups. Specifically, the high LSM7 expression group exhibited higher levels of NK CD56bright cells, pDC, T cells, TFH, and Th2 cells, while eosinophils, neutrophils, Tcm, Th17 cells, and Treg cells were more abundant in the low LSM7 expression group (Figure 6A). Correlation analysis between LSM7 and different immune cells revealed a strong positive correlation between LSM7 and NK CD56bright cells, TFH, and Th2 cells, and a moderate positive correlation with pDC and T cells. In contrast, eosinophils, neutrophils, Tcm, and Th17 cells showed a strong negative correlation with LSM7, while Treg cells exhibited a moderate negative correlation (Figure 6B). In addition, single-cell RNA-seq analysis using the TISCH database provided further insights into the role of LSM7 in the tumor microenvironment (TME). Figure 6(C–F) shows that LSM7 was predominantly expressed in monocytes/macrophages, B-cells, CD8⁺ T-cells, fibroblast cells, malignant cells, and hepatic progenitor cells across multiple datasets (Figure 7).

Immune-infiltration landscape associated with LSM7. (A) Relative abundance of 24 immune-cell subsets in TCGA-LIHC tumors stratified by LSM7 expression (Wilcoxon test). (B) Correlation between LSM7 mRNA and immune-cell fractions. (C) UMAP projection of scRNA-seq data (TISCH) indicating LSM7 expression across major cell types in GSE125449, GSE140228, and GSE166635. (D–F) Heatmaps showing mean LSM7 expression in indicated cell clusters for each dataset.

Association between LSM7 and immunotherapy response. (A) Immune Phenotype Scores (IPS) in LSM7-high versus -low patients. (B–D) IPS under PD-1 or CTLA-4 blockade scenarios. (E) Correlation heatmap of LSM7 with 79 immune-checkpoint genes. (F–I) TIDE, exclusion, dysfunction, and MSI scores by LSM7 expression. ***p < .0001.
Drug sensitivity analysis
To assess the relationship between LSM7 expression and drug sensitivity, we performed a drug resistance analysis using targeted therapy drugs and traditional chemotherapy drugs. The high LSM7 expression group demonstrated greater sensitivity to sunitinib, imatinib, sorafenib, gefitinib, docetaxel, and 5-fluorouracil compared to the low-expression group (Figure 8A–F). The IC50 values for these drugs decreased as LSM7 expression increased (Figure 8G–L), suggesting that these drugs may serve as potential therapeutic agents for targeting LSM7.

Drug-sensitivity signature of LSM7. (A–F) Estimated IC50 values for sunitinib, imatinib, sorafenib, gefitinib, docetaxel, and 5-fluorouracil in GDSC cell lines stratified by LSM7 expression. (G–L) Correlation between LSM7 mRNA and IC50 for each agent.
The virtual screening of drugs targeting LSM7
Through DoGSiteScorer, five potential binding sites (P0 to P4) were identified on LSM7 (Figure 9A). As shown in Figure 9(B–C), the amino acids forming these pockets mediate interactions between Sm-like (LSM) proteins and are involved in the formation of the heptameric ring of U6 snRNP. Among the five pockets, the optimal drug-binding pocket P0 (colored yellow) had a score of 0.67, a volume of 422.78 Å3, a surface area of 821.21 Å2, and a depth of 14.20 Å. Based on these results, we employed virtual screening techniques to identify potential inhibitors with sufficient binding affinity. To this end, we initially used a chemical database containing 5903 approved drugs from the ZINC database (https://zinc15.docking.org/substances/subsets/world). To improve efficiency, we adopted an empirical screening method to dock all pockets. Figure 9(D–F) illustrates the three-dimensional (3D) and two-dimensional (2D) structures of ligand-receptor interactions between LSM7 and the top three approved drugs, namely Velpatasvir, Alpha-Hydroxysalmeterol, and 6-Methoxy-2-naphthylacetic acid. Table 2 provides a detailed list of the top five screened compounds with the best binding scores, which are potential LSM7 inhibitors. Velpatasvir was selected for investigation to assess its effects on MHCC97H and Huh-7 cells. Treatment with Velpatasvir significantly inhibited cell proliferation in a time- and concentration-dependent manner (Figure 9G). As the treatment duration extended, cell viability gradually decreased. Western blot analysis at 48 h confirmed that Velpatasvir reduced LSM7 expression in both MHCC97H and Huh-7 cells (Figure 9H).
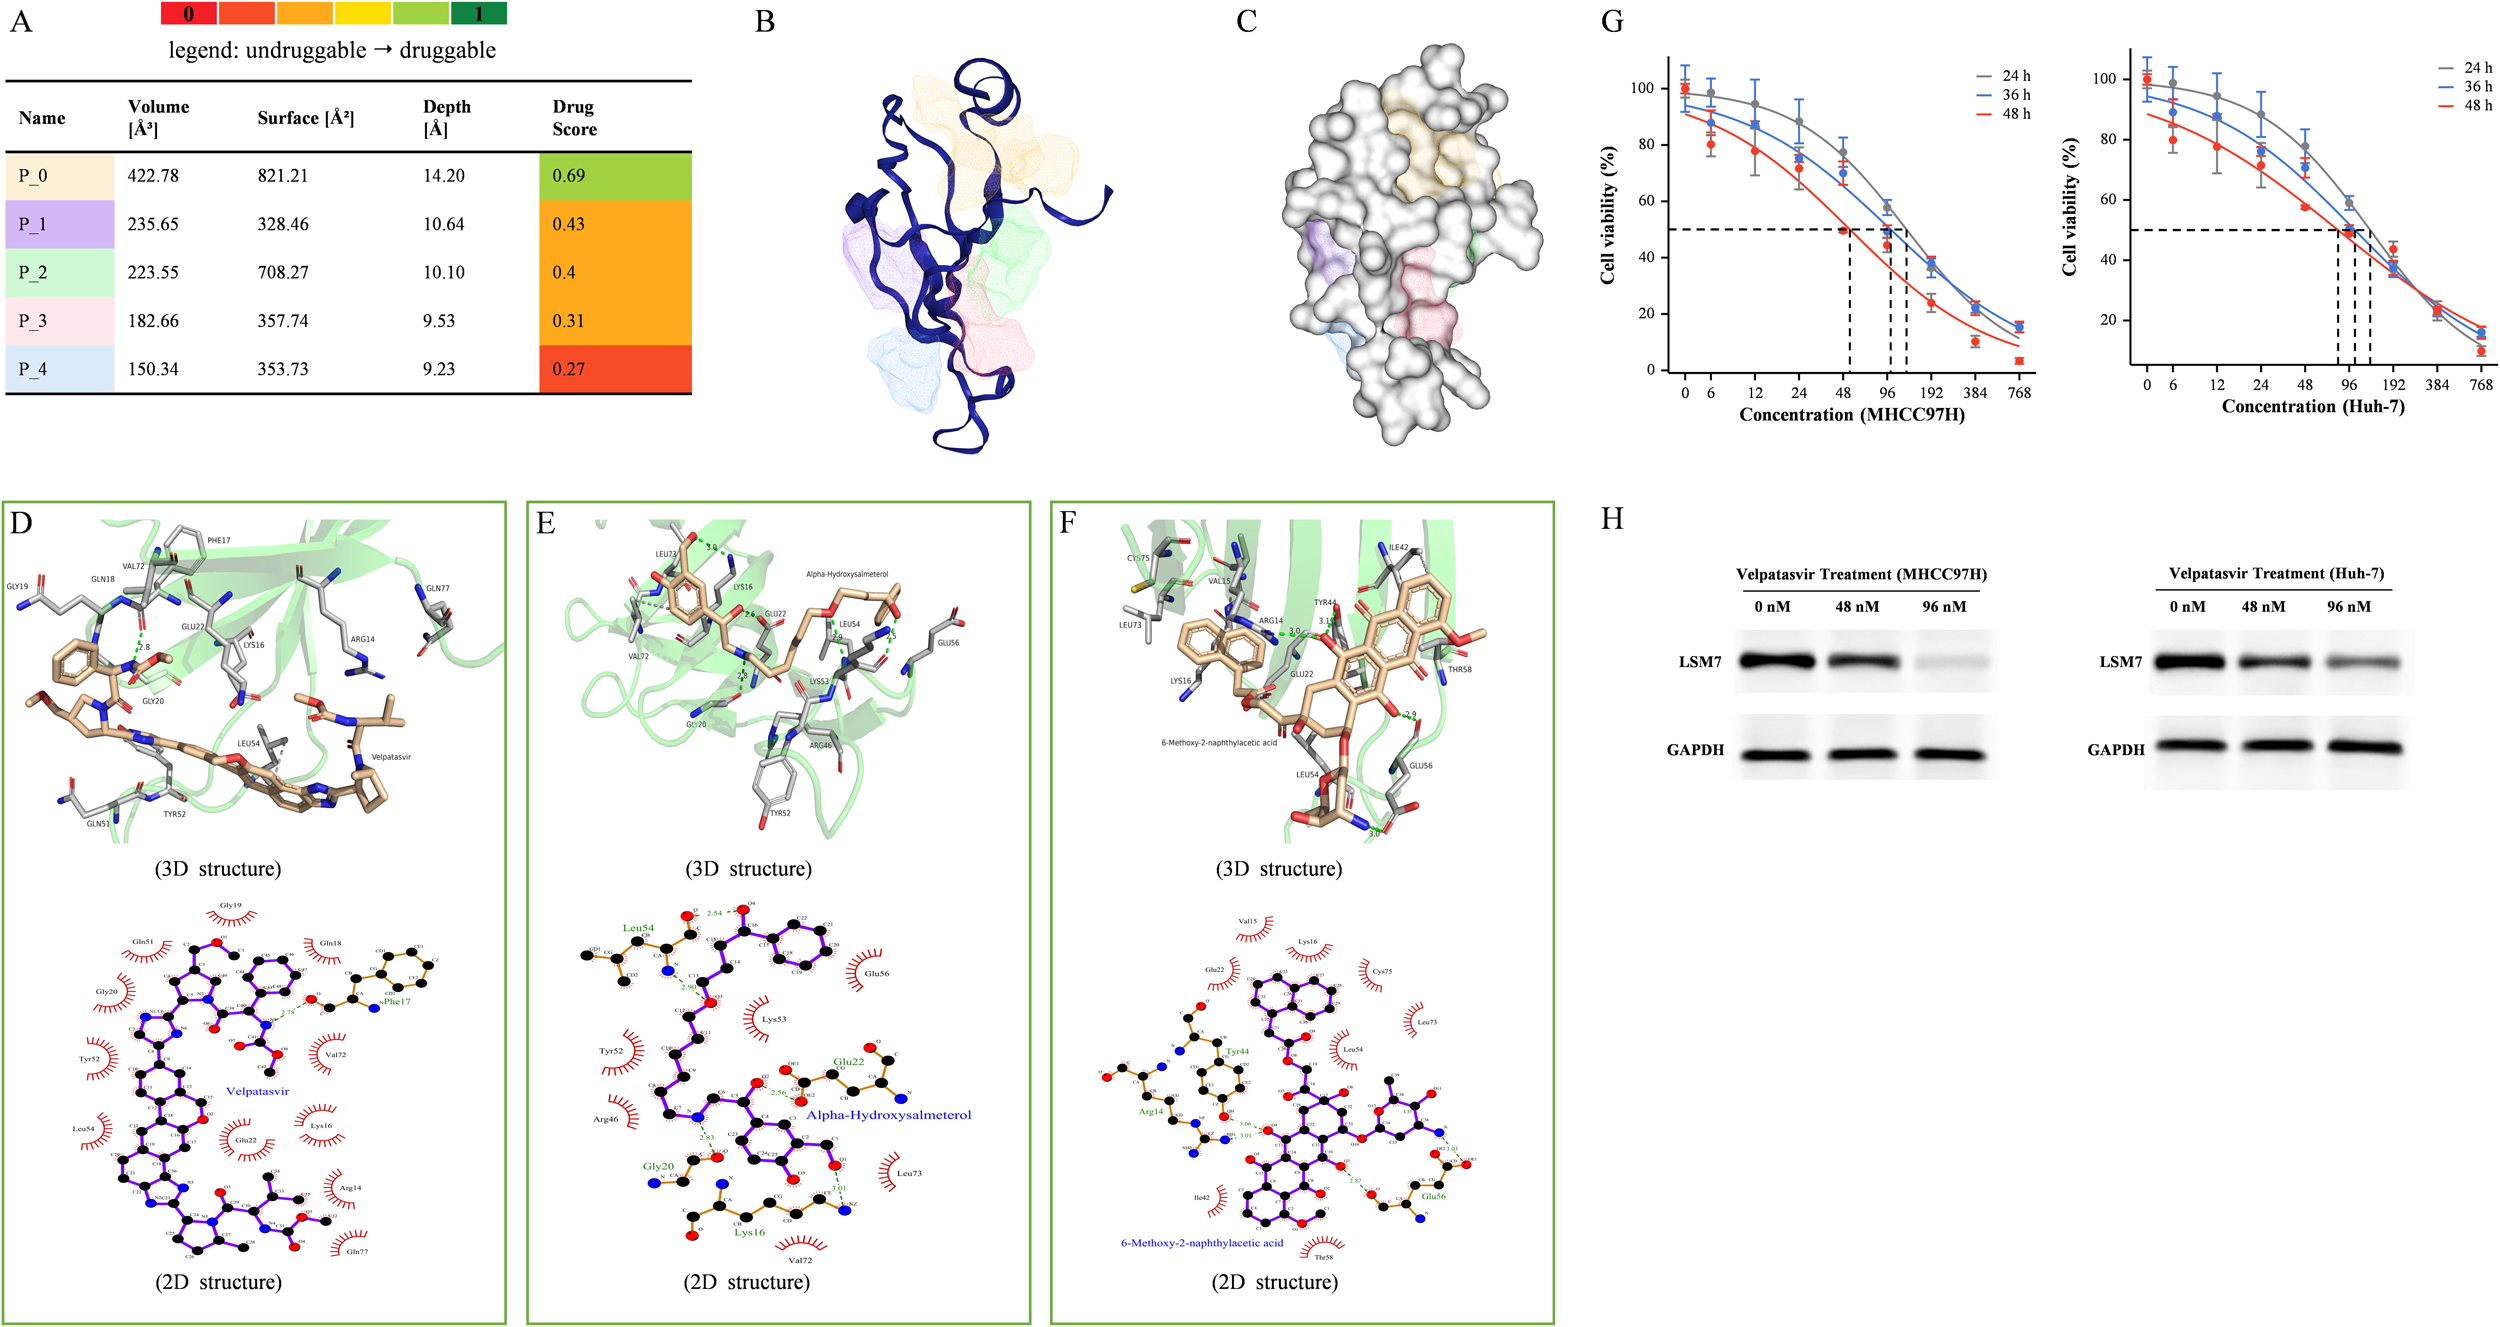
Structure-based virtual screening identifies Velpatasvir as an LSM7 ligand. (A) Pocket map generated by DoGSiteScorer; P0 (yellow) selected for docking. (B) Cartoon and (C) surface representation of LSM7 with five predicted pockets. (D–F) 2D and 3D interaction plots of top-ranked drugs: Velpatasvir, Alpha-Hydroxysalmeterol, and 6-Methoxy-2-naphthylacetic acid. Hydrogen bonds in green, π–π/π-cation in yellow, hydrophobic in gray. (G) Concentration- and time-dependent viability of MHCC97H cells and Huh-7 cells treated with Velpatasvir (MTT assay). (H) Western blot showing LSM7 protein levels after 48 h Velpatasvir treatment in MHCC97H cells and Huh-7 cells (0, 48, 96 nM).
Top five approved compounds identified by virtual screening against LSM7 pocket P0.

Docking score (ChemPLP) and interacting pockets are listed.
ZINC IDs correspond to the ZINC15 “world” subset.
LSM7 expression and its potential role in tumor progression
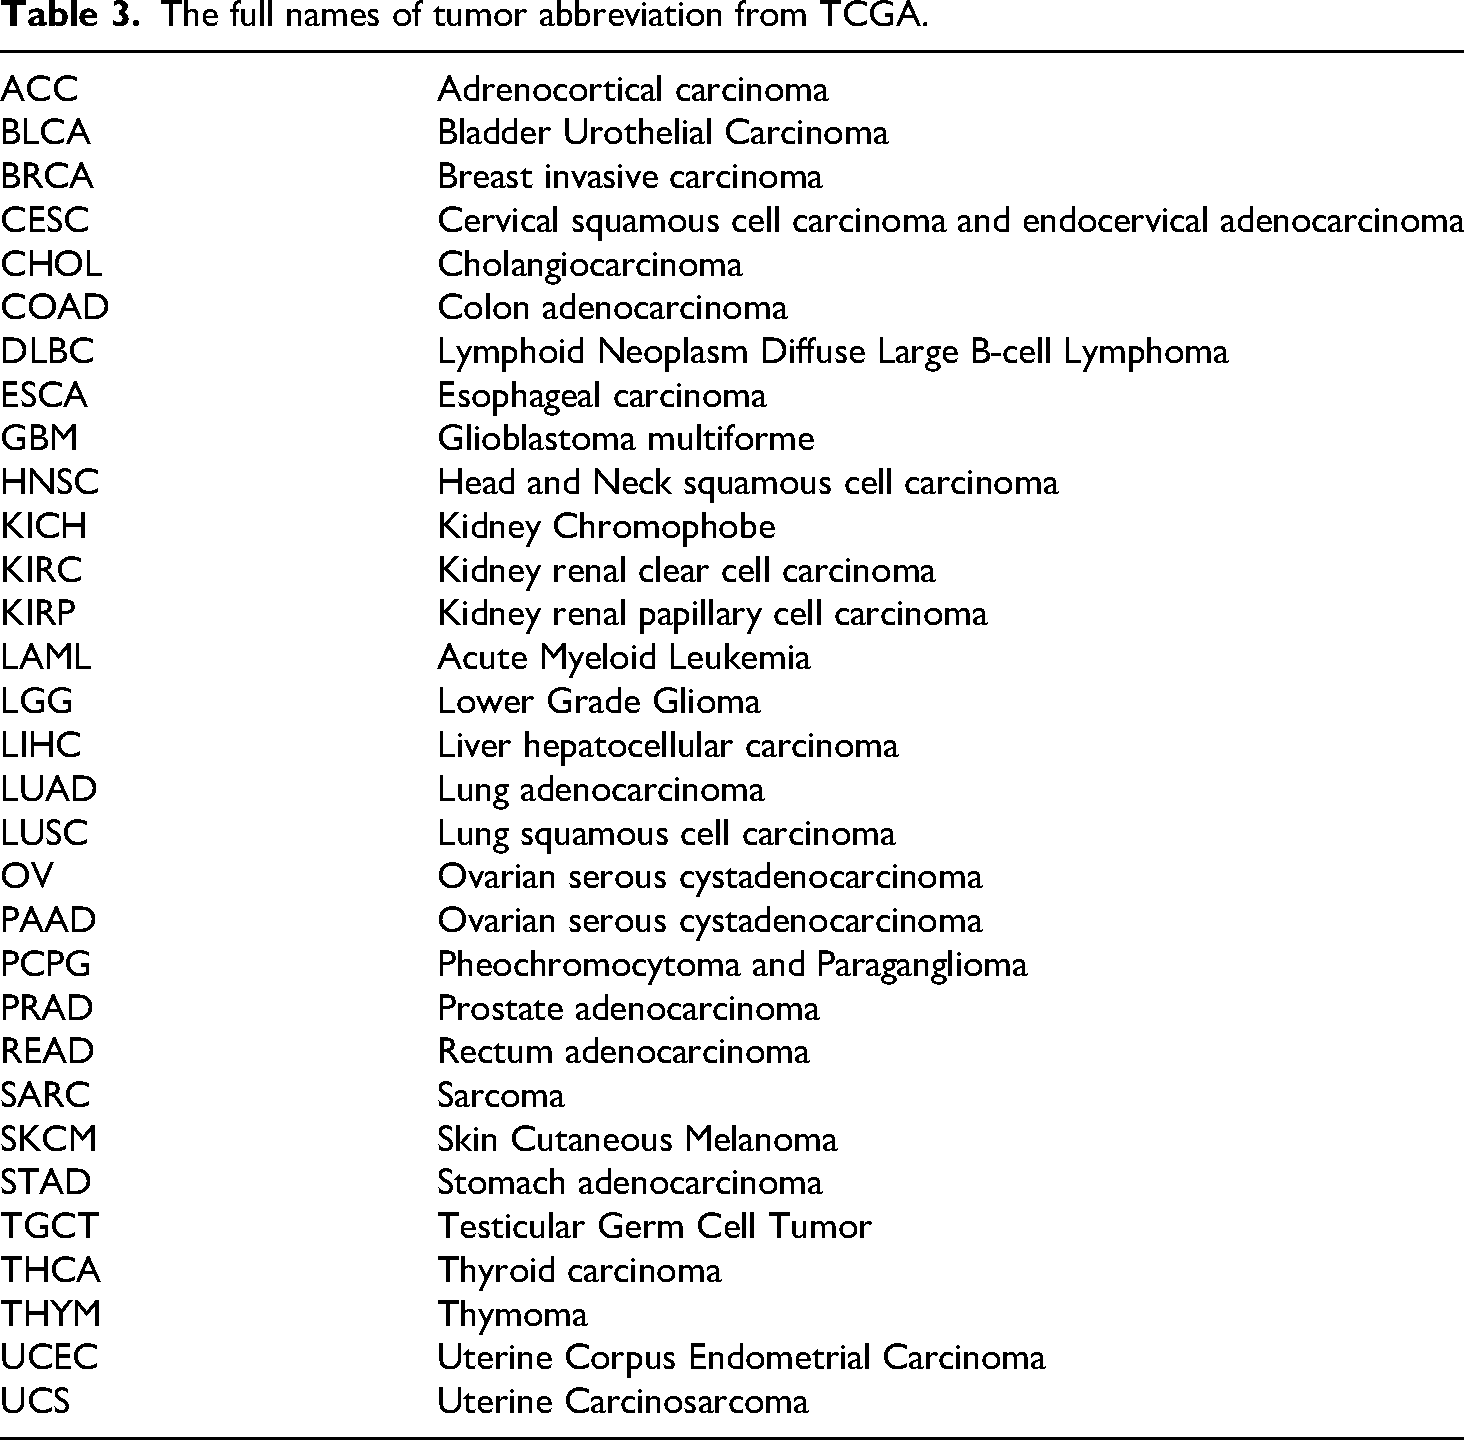
In liver cancer single-cell analysis, LSM7 was found to be enriched in epithelial cells (Figure 1B), which were classified into six cell subpopulations: T cells (0), Macrophages (1), Endothelial cells (2), Epithelial cells (3), Neutrophils (4), and Smooth Muscle cells (5). Further analysis classified epithelial cells into two groups based on high and low LSM7 expression levels (Figure 1C). Trajectory analysis showed that cells with low LSM7 expression gradually transitioned to a higher expression state over time (Figure 1D). Additionally, SingScore analysis revealed a strong correlation between high LSM7 expression and key tumor-associated signaling pathways, including MAPK, NOTCH, PI3K, and WNT (Figure 1E). GO/KEGG enrichment analysis of high LSM7 expression cell populations (Figure 1F) identified several key biological processes and pathways, primarily involving proteasomal function, protein synthesis, intracellular transport, cell adhesion, and metabolic pathways. These results suggest that high LSM7 expression may contribute to tumor progression by regulating mechanisms such as protein degradation, intracellular vesicular transport, and cell adhesion (Tables 3 and 4).
The full names of tumor abbreviation from TCGA.
Accession numbers and primary citations of the public datasets used in this study.

GDSC: Genomics of Drug Sensitivity in Cancer.
Discussion
LSM7 is a conserved RNA-binding protein that forms part of the LSM complexes, which participate in RNA splicing and other RNA metabolic processes. 18 Although several LSM family members have been linked to tumor biology, 19 the specific expression pattern and role of LSM7 in HCC remain insufficiently understood.
We first observed widespread dysregulation of LSM7 across multiple cancer types in the pan-cancer analysis. Focusing specifically on HCC, the consistently elevated expression of LSM7 in tumor tissues suggests that its imbalance may play a role in hepatocarcinogenesis. Early HCC currently lacks protein biomarkers with both high sensitivity and specificity. 20 Here, we first demonstrate via Cox regression that LSM7 acts as an independent prognostic factor, suggesting its potential as a complementary diagnostic marker for the early diagnosis of HCC in translational applications. Current BCLC or TNM staging systems exhibit limited ability to stratify postoperative recurrence risk in HCC. 21 Our findings that high LSM7 expression correlates with microvascular invasion, poor differentiation, and unfavorable prognosis highlight its potential as a complementary biomarker for refined risk stratification in HCC.
To explore the biological roles of LSM7, we constructed a PPI network and conducted functional enrichment analyses. GO results indicated that LSM7-related genes were enriched in pathways involving hormone regulation, xenobiotic metabolism, and immunoglobulin receptor binding, all of which have been implicated in hepatocyte proliferation and HCC progression.22–24 GSEA further showed that high LSM7 expression correlated positively with the mesodermal commitment pathway and negatively with cytochrome P450-mediated xenobiotic metabolism. These pathways are linked to processes such as MET/EMT transitions, altered differentiation states, and metabolic reprograming, which contribute to tumor invasiveness and aggressiveness.25–27 Overall, these findings suggest that LSM7 may influence HCC progression through pathways related to differentiation, immune interaction, and metabolic regulation.
Notably, a newly described IFNγ−IL-17⁺ CD8⁺ T-cell subset is enriched in human liver cancer and associated with immunosuppression and tumor progression, 28 underscoring the context-dependent nature of immune cells function within the TME. LSM7 expression is associated with several immune cells. Moreover, LSM7 expression can be detected in malignant cells as well as other cell types, including immune cells and stromal cells. These findings strongly suggest a close correlation between LSM7 and the TME, indicating that LSM7 may be involved in various cell-induced mechanisms within the TME. Taken together, the distribution of LSM7 across multiple immune and stromal compartments, along with its correlations with immune cell abundance, suggests that LSM7 may influence HCC progression at least in part by modulating the tumor immune microenvironment.
LSM7 expression is correlated with multiple immune cell populations across TCGA and other datasets, although its specific impact on immune cells function in HCC remains unclear. Given its association with poor prognosis, we speculate that elevated LSM7 may contribute to immune evasion in HCC. To further explore this possibility, we compared IPS between LSM7 high- and low-expression groups but found no significant differences, suggesting that LSM7 may not be linked to PD-1 or CTLA-4 response. Instead, LSM7 expression showed positive correlations with several other immune checkpoints. Moreover, high LSM7 expression was associated with higher TIDE and exclusion scores and lower dysfunction and MSI scores, supporting a potential role for LSM7 in promoting immune escape in HCC.
Additionally, prior research has shown that cancer patients with low MSI tend to have lower responsiveness to immunotherapy. 29 Our analysis revealed that high levels of LSM7 expression were associated with a stronger response to sunitinib, imatinib, sorafenib, gemcitabine, doxorubicin, and 5-fluorouracil. We speculate that these effects may relate to factors such as vascular invasion, increased malignancy, and enhanced proliferation. Although RBPs have long been considered undruggable, 30 growing evidence indicates that targeting RBPs is a rapidly advancing field, with promising candidates such as eIF4F, FTO, SF3B1, nucleolin, and RBM39 already in clinical trials. 31 Evidence from our study shows that Velpatasvir can downregulate LSM7 expression; given its approved application for HCV treatment and well-established safety profile, 32 these findings provide preliminary theoretical support for further investigation of its repurposing value. Previous studies on the LSM family have largely been conducted at the bulk tissue level.33,34 To gain a more precise mechanistic insight, we leveraged scRNA-seq, which allowed us to anchor the dynamic shift from low to high LSM7 expression along a pseudotime trajectory and reveal its correlation with key oncogenic pathways—MAPK, PI3K, WNT, and NOTCH. Together, these findings suggest that LSM7 may contribute to HCC progression and represents both a promising biomarker and a potential therapeutic target.
Limitations
First, the limited availability of paired HCC tissues (n = 19) allowed for preliminary validation of LSM7 overexpression at mRNA and protein levels, but precluded statistically powered protein-level confirmation. To strengthen our conclusions, we integrated complementary public datasets (bulk and scRNA-seq) to systematically corroborate LSM7 dysregulation. However, the small cohort size remains a limitation. Future work should aim to expand the clinical sample set and conduct multicenter studies to achieve statistically conclusive protein-level validation and to further delineate the functional mechanisms of LSM7 in HCC. Second, the molecular pathways through which LSM7 influences immune infiltration and drug response were not fully elucidated. Further in vitro and in vivo experiments are warranted to clarify these mechanisms and to validate the candidate compounds identified via virtual screening.
Conclusion
In conclusion, our integrated analysis spanning bulk tissue to single-cell resolution identifies LSM7 as a promising prognostic biomarker and a potential multifunctional mediator of HCC aggressiveness, which may act by modulating cell differentiation, metabolic processes, and the immune microenvironment. The observation that Velpatasvir can downregulate LSM7 points to the potential of LSM7 as a novel therapeutic target, and further studies are warranted to elucidate its functional mechanisms and evaluate its potential for drug repurposing.
Supplemental Material
sj-pdf-1-sci-10.1177_00368504251413427 - Supplemental material for Integrative multiomics dissection of LSM7 as a prognostic biomarker and therapeutic target in hepatocellular carcinoma
Supplemental material, sj-pdf-1-sci-10.1177_00368504251413427 for Integrative multiomics dissection of LSM7 as a prognostic biomarker and therapeutic target in hepatocellular carcinoma by Shanshan Fan, Yifeng He, Peifeng Ke, Jianhong Jiang, Shengming Zhang, Deqin Zeng, Juan Duan and Ming Wu in Science Progress
Footnotes
Acknowledgments
We thank Mr Zhitao Duan and Dr. Ruijian Liu for their theoretical guidance on bioinformatics analysis and virtual screening.
Institutional review board approval
This study was conducted in accordance with the Declaration of Helsinki (1975, as revised in 2024) and was approved by the Medical Research Ethics Committee of Guangdong Second Provincial General Hospital, Guangzhou, China (Approval No. 2023-KY-KZ-139-03; Approval Date: 30 August 2023). Written informed consent was obtained from all participants prior to tissue donation.
Consent for publication
All authors consent to the publication of this manuscript and its contents.
Author contributions
Shanshan Fan: statistical analysis and manuscript drafting; Yifeng He: study design and data curation; Peifeng Ke: experimental assays and figure preparation; Jianhong Jiang and Shengming Zhang: patient recruitment, specimen collection, and clinical data assembly; Deqin Zeng: supervision and funding acquisition; Juan Duan: methodology design and manuscript revision; Ming Wu: project leadership and final approval. All authors read and approved the final manuscript.
Funding
The authors disclosed receipt of the following financial support for the research, authorship, and/or publication of this article: This work was supported by the Research Project Grant of the Guangdong Provincial Traditional Chinese Medicine Bureau (No. 20242004), the Guangdong Medical Science and Technology Research Foundation (No. B2025376), and the Science and Technology Program of Guangzhou, China (Grant No. 2025A03J4293).
Declaration of conflicting interests
The authors declared no potential conflicts of interest with respect to the research, authorship, and/or publication of this article.
Data availability statement
All datasets analyzed are publicly available. Primary data were obtained from the TCGA portal (https://portal.gdc.cancer.gov), GTEx (https://www.gtexportal.org), GEO (GSE14520), and ICGC-LIRI-JP. LSM7 expression profiles are accessible via the Human Protein Atlas (![]() ). Raw data and R scripts are available from the corresponding author upon reasonable request (1947695134@qq.com).
). Raw data and R scripts are available from the corresponding author upon reasonable request (1947695134@qq.com).
Supplemental material
Supplemental material for this article is available online.
References
Supplementary Material
Please find the following supplemental material available below.
For Open Access articles published under a Creative Commons License, all supplemental material carries the same license as the article it is associated with.
For non-Open Access articles published, all supplemental material carries a non-exclusive license, and permission requests for re-use of supplemental material or any part of supplemental material shall be sent directly to the copyright owner as specified in the copyright notice associated with the article.