
Abstract
Keywords
Introduction
Race-walking, as a unique track and field event, requires athletes to always maintain at least one foot in contact with the ground while ensuring that the front leg is straightened upon landing. This rule presents a dual challenge for athletes in terms of both speed and technique. The research on race-walking speed and technique has mainly focused on how to improve speed while adhering to technical regulations. 1 As an official track and field event, race-walking made its debut at the 1908 London Olympics. Since then, athletes and coaches have been dedicated to enhancing speed through technical improvements. Early research largely relied on coaches’ personal experiences and athletes’ intuition, lacking systematic scientific analysis. During this period, athletes gradually realized the impact of stride length, step frequency, and body posture on speed.2,3
In the Mid-20th Century, with the advancement of science and technology, particularly the rise of sports biomechanics, research on race-walking speed and technique entered a new phase. Researchers began using high-speed cameras and mechanical analysis tools to explore the gait characteristics and mechanical performance of race walkers.4–7 In terms of gait analysis, researchers analyzed stride, step frequency, step length, and knee joint angles, aiming to identify the most optimized gait patterns to improve speed without violating race-walking rules.8–10 In the area of energy consumption and efficiency, the focus was on reducing energy expenditure and improving efficiency in long-distance race-walking.11–17 Studies have shown that factors such as the body lean angle,11–14 arm swing amplitude, 15 and frequency significantly affect energy consumption.16,17
Entering the 21st Century, race-walking research delved further into the fields of exercise physiology,18,19 sports biomechanics, and sports psychology. 20 Modern technologies such as 3D motion capture systems, computer simulations, and wearable technology21–23 have refined our understanding of the relationship between race-walking speed and technique. In biomechanics and neuromuscular control, studies indicate that race-walking speed is not only dependent on lower limb strength but also closely related to the stability of the core muscles and neuromuscular control capabilities. Researchers have used methods like electromyography (EMG)24–27 to analyze muscle activation patterns and gait control strategies at different speeds. In terms of technical optimization and training, modern training methods increasingly rely on scientific data, where coaches analyze athletes’ technical data to design personalized training plans that improve speed while ensuring technical compliance.
With the application of artificial intelligence, big data, and machine learning in sports science, research on race-walking speed and technique will continue to deepen.28,29 Athlete technical pattern analysis based on big data, virtual reality-assisted technical training, and other innovations will become key directions for future race-walking training and research. Achieving more precise performance analysis is critical for enhancing the scientific and precise nature of race-walking training.
In previous research, the standardization and efficiency of race-walking techniques have always been central themes. Specifically, when one tries to strike a balance between race-walking speed and technique, the contradiction between them becomes quite obvious. If the race-walking speed is excessively high, the situation of “flight time” will occur, which goes against the technical rules. On the other hand, if too much emphasis is placed on ensuring that the race-walking techniques comply with the regulations, it will impede the enhancement of speed. This contradiction is particularly pronounced. Therefore, it is crucial to address the relationship between race-walking speed and technique effectively. Among numerous studies, only a few have quantitatively defined the relationship between race-walking speed and technique.1,30–32 However, this research goes beyond examining just a few indicators and aims for a comprehensive evaluation of race-walking techniques. By extensively collecting and organizing data on race-walking speed and technical indicators, this study uses machine learning techniques to establish a model of the interrelationship between technical indicators and high-speed race-walking. The research finds that when technical indicators fall within a reasonable range, they can significantly promote the improvement of race-walking speed. Conversely, if these technical indicators deviate from their optimal range, they restrict the further development of race-walking speed.
Methods
Research design
The primary objective of this study is to conduct an in-depth analysis of race-walking speed and technique using methods such as random forests (RFs). During the research process, we integrated 14 key technical indicators of race-walking, including step frequency, step length, angle between thighs, flight distance, angle between upper and forearms, head undulation distance, landing angle, rear pedal angle, backpedal distance, back swing distance, arm swing angle, front support distance, front swing distance, and flight time. The core of this study is to explore the optimal combination of race-walking speed and technique through methods like RFs, identify the range of race-walking technical indicators, and provide strategies and recommendations to enhance race-walking speed based on these findings.
This experiment was approved by the Ethics Committee of Capital University of Physical Education and Sports on June 11, 2024, with approval number 2024A105. Additionally, all participants were fully informed about the purpose, procedures, potential risks, and benefits of the study before participation, and they signed informed consent forms. The experimental design is shown in Figure 1.

Study design flowchart.
Experiment
Data acquisition
(1) Participants
This study focuses on the relationship between race-walking speed and technical indicators in elite race walkers. The test subjects were 8 female elite race walkers, all of whom are internationally recognized athletes, and their competitive performance data were used for analysis. The basic information of the athletes is shown in Table 1.
(2) Selection of indicators
The acquisition of technical indicators for elite race walkers follows a four-step process: Initial selection of indicators, expert survey screening, testing results screening, and statistical results screening. 33
Basic information of athletes.

The basis for the initial selection of indicators comes from previous research. This study reviewed domestic and international literature related to athlete selection criteria and race-walking research, as well as relevant monographs, to extract the necessary selection indicators for the race-walking event. These indicators are grouped into seven key areas: overall technique, upper body technique, upper limb technique, hip technique, lower limb technique, knee joint technique, and foot and ankle technique.
Indicators were further screened through expert surveys. The experts involved are elite coaches and Olympic champions who are at the forefront of race-walking training and athlete selection. Based on the feasibility of large-scale testing, the experts excluded general indicators that lacked specific relevance to race-walking, confirming 14 technical indicators that reflect upper body technique, upper limb technique, hip technique, lower limb technique, knee joint technique, and foot and ankle technique.
In studies by Ma Jie et al.,34–36 these 14 indicators were tested. The results showed that speed was significantly positively correlated with stride length, step frequency, airborne backpedal distance, airborne thigh angle, flight time, and vertical head undulation height. It was significantly negatively correlated with rear pedal lift angle, front swing knee angle, and other angles. The correlation coefficients between speed and indicators like foot placement angle, front support distance upon landing, trunk tilt angle, thigh angle when overlapping, rear arm swing angle during flight, and front elbow angle during flight were very low.
Considering the numerous reference indicators and the correlation between them, dimensionality reduction was applied to the number of similar indicators. This process identified the most representative indicators within similar categories, maximizing the reduction in the number of evaluation indicators for ease of operation and strong practicality.
(3)
The testing content in this study includes the competition techniques of 12 athletes in 6 race-walking events. The primary event tested was the 20 km individual race, followed by the race-walking marathon relay team event (Figure 2).
(1) Throughout the race, we used the GPS watch technology of Garmin 265 to accurately collect speed data from the athletes. Relevant speed data were selectively extracted and analyzed according to research requirements. (2) Setting Up Equipment Based on the Venue The camera setup should be placed on flat ground with a clear view, with the camera positioned 1.0 meters above the ground. The main optical axis of the camera should be perpendicular to the direction of movement. The shooting parameters should be set according to the on-site conditions, primarily for tracking shots, to ensure the best possible image quality. Depending on the venue, the distance of the camera setup should be adjusted accordingly. The general shooting distance is around 8 meters. To capture the athlete's complete stride, the camera parameters should be adjusted based on the actual situation to ensure the best shooting effect.37,38 (3) Shooting methods
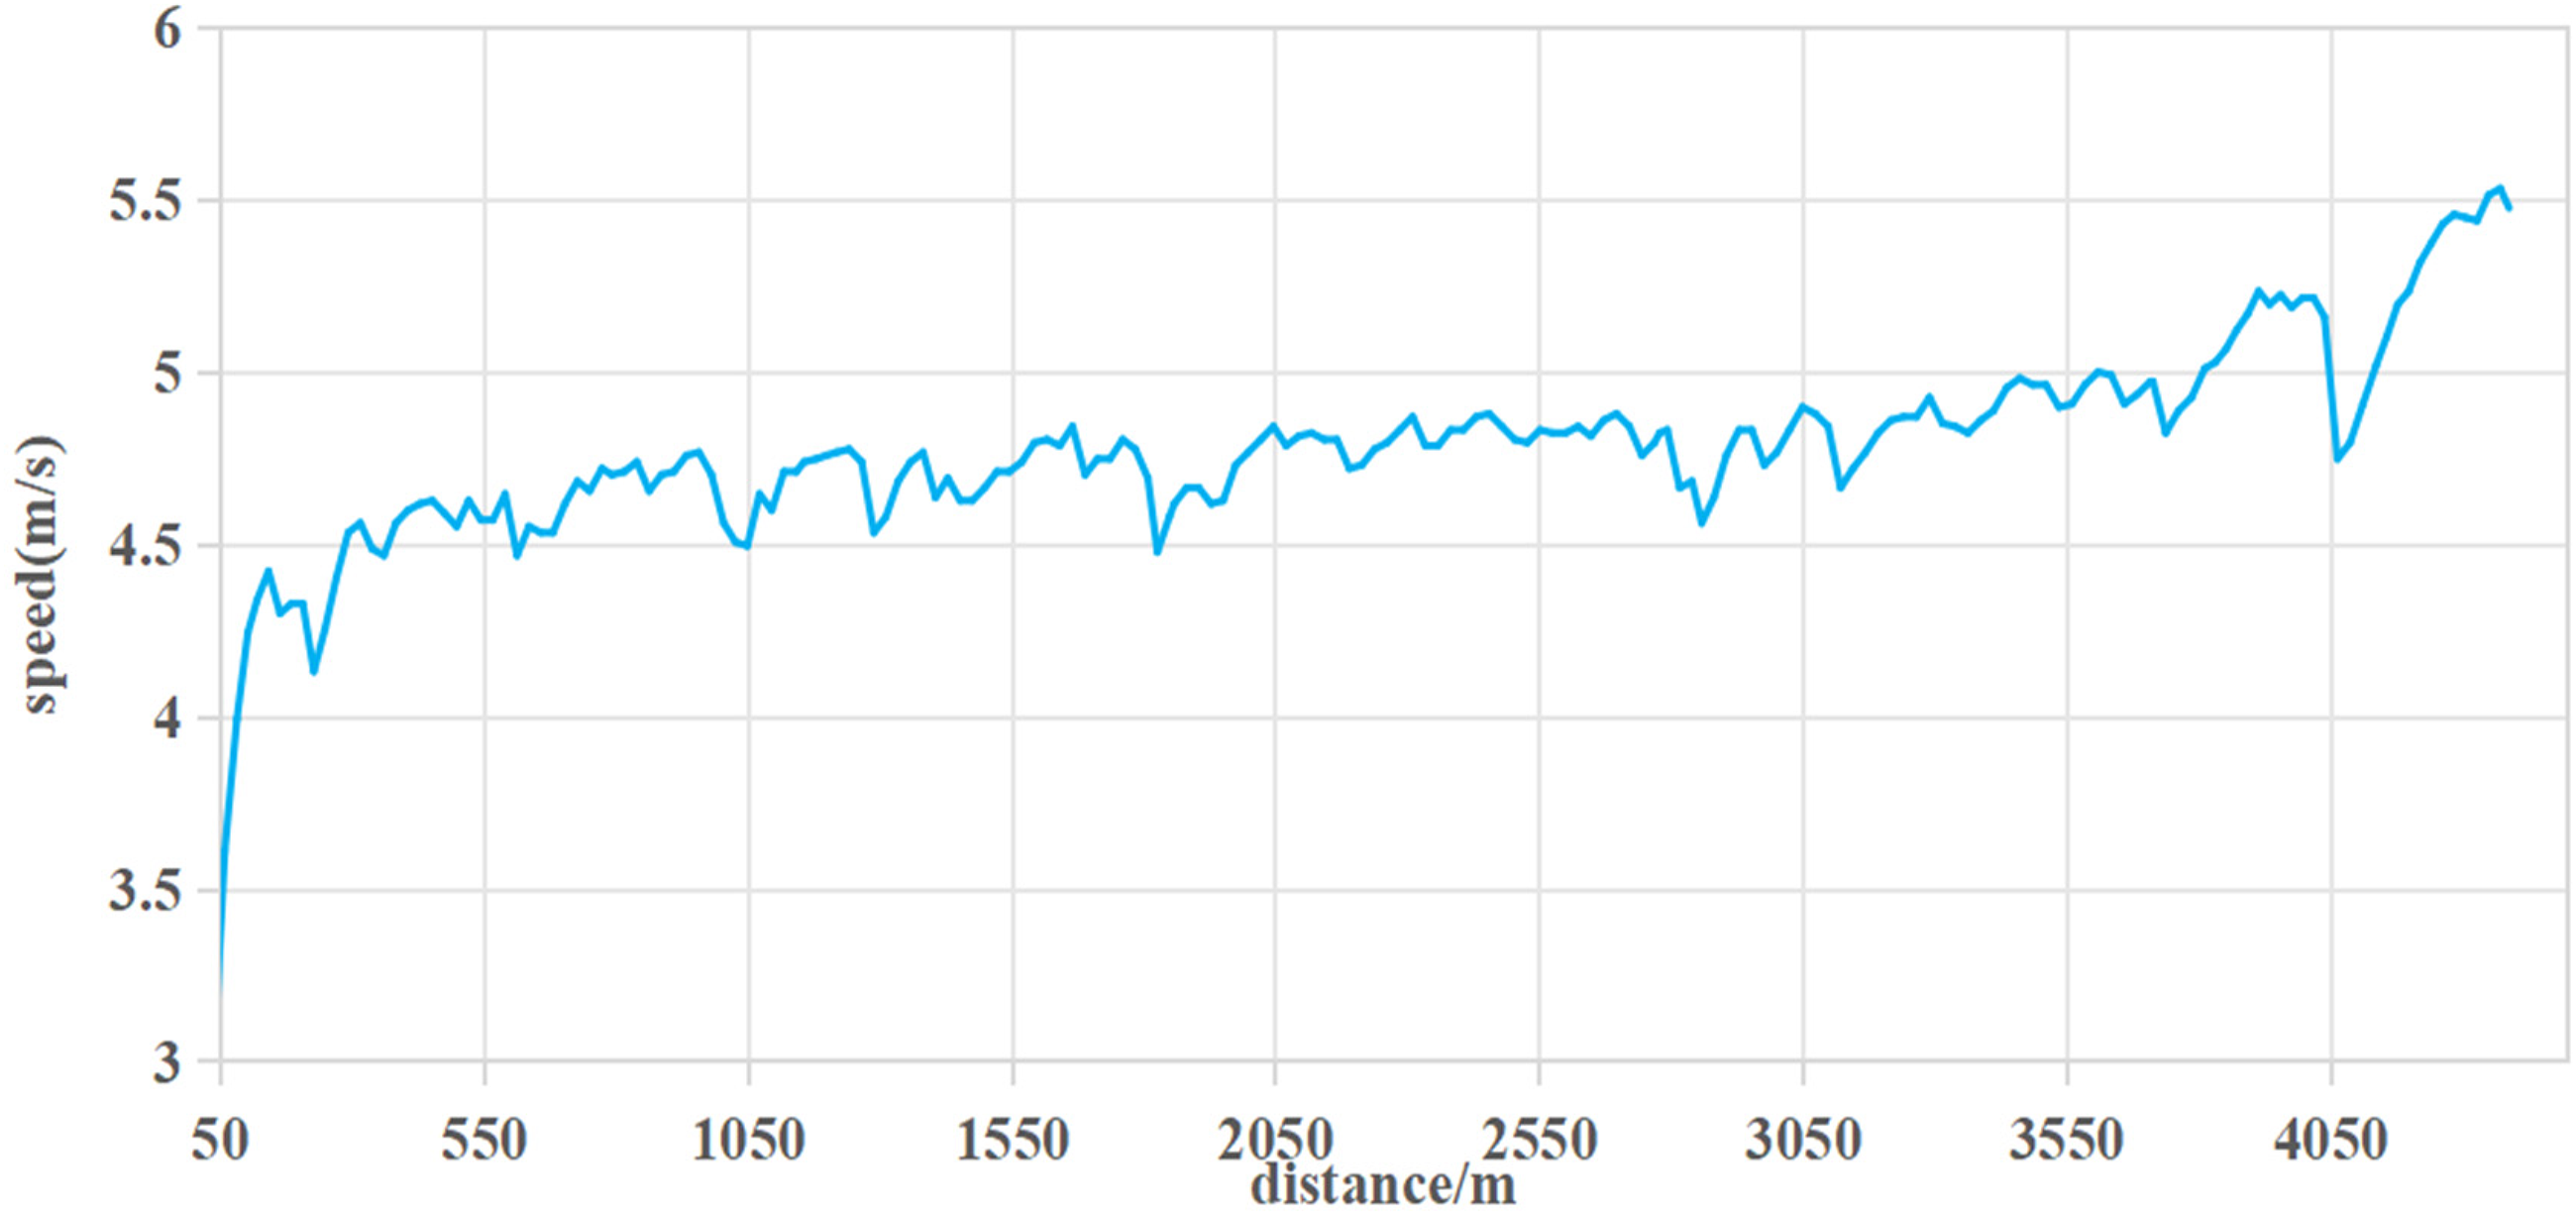
Race-walking speed collection chart.
Two-dimensional shooting:
A CASIO-FH25 high-speed camera was used for planar, fixed-focus, and fixed-point shooting of the competition scene. The shooting location was set approximately 100 m from the finish line, with no obstructions. The shooting frequency was 120 Hz, and the camera was positioned 4 m away at a height of 1.0 m. Before the competition, a scale was set within the shooting range, with a length of 2.5 m. The scale was calibrated using ground adhesive tape, with the outer edge of the tape used as the calibration point.
Three-dimensional shooting:
Two CASIO-FH25 high-speed cameras were set up with their main optical axes at an angle between 80° and 100°. The shooting frequency was 120 Hz (in both the sagittal and coronal planes). Within the shooting range, a 3D frame was set up for spatial calibration. After spatial calibration was completed, the 3D frame was removed, and the cameras were no longer adjusted in position, then shooting commenced.
Image analysis method:
The Ariel Performance Analysis System video analysis system was used to analyze the obtained video data. First, a video of the athlete's stride cycle was selected. 28 Then, the video was analyzed, and based on Matsui Hideto's human inertia model, 21 body key points were selected (as shown in Figure 3): “left toe, left heel, left ankle, left knee, left hip, left shoulder, left elbow, left wrist, left hand, right toe, right heel, right ankle, right knee, right hip, right shoulder, right elbow, right wrist, right hand, head center (ear), center of both shoulders, and center of both hips.” These key points were marked frame by frame in the technical competition video for digitization. A low-pass filter was applied to smooth the obtained data, and the parameters necessary for further study were extracted and analyzed. 35

Key points of the human body.
Kinematic parameter:
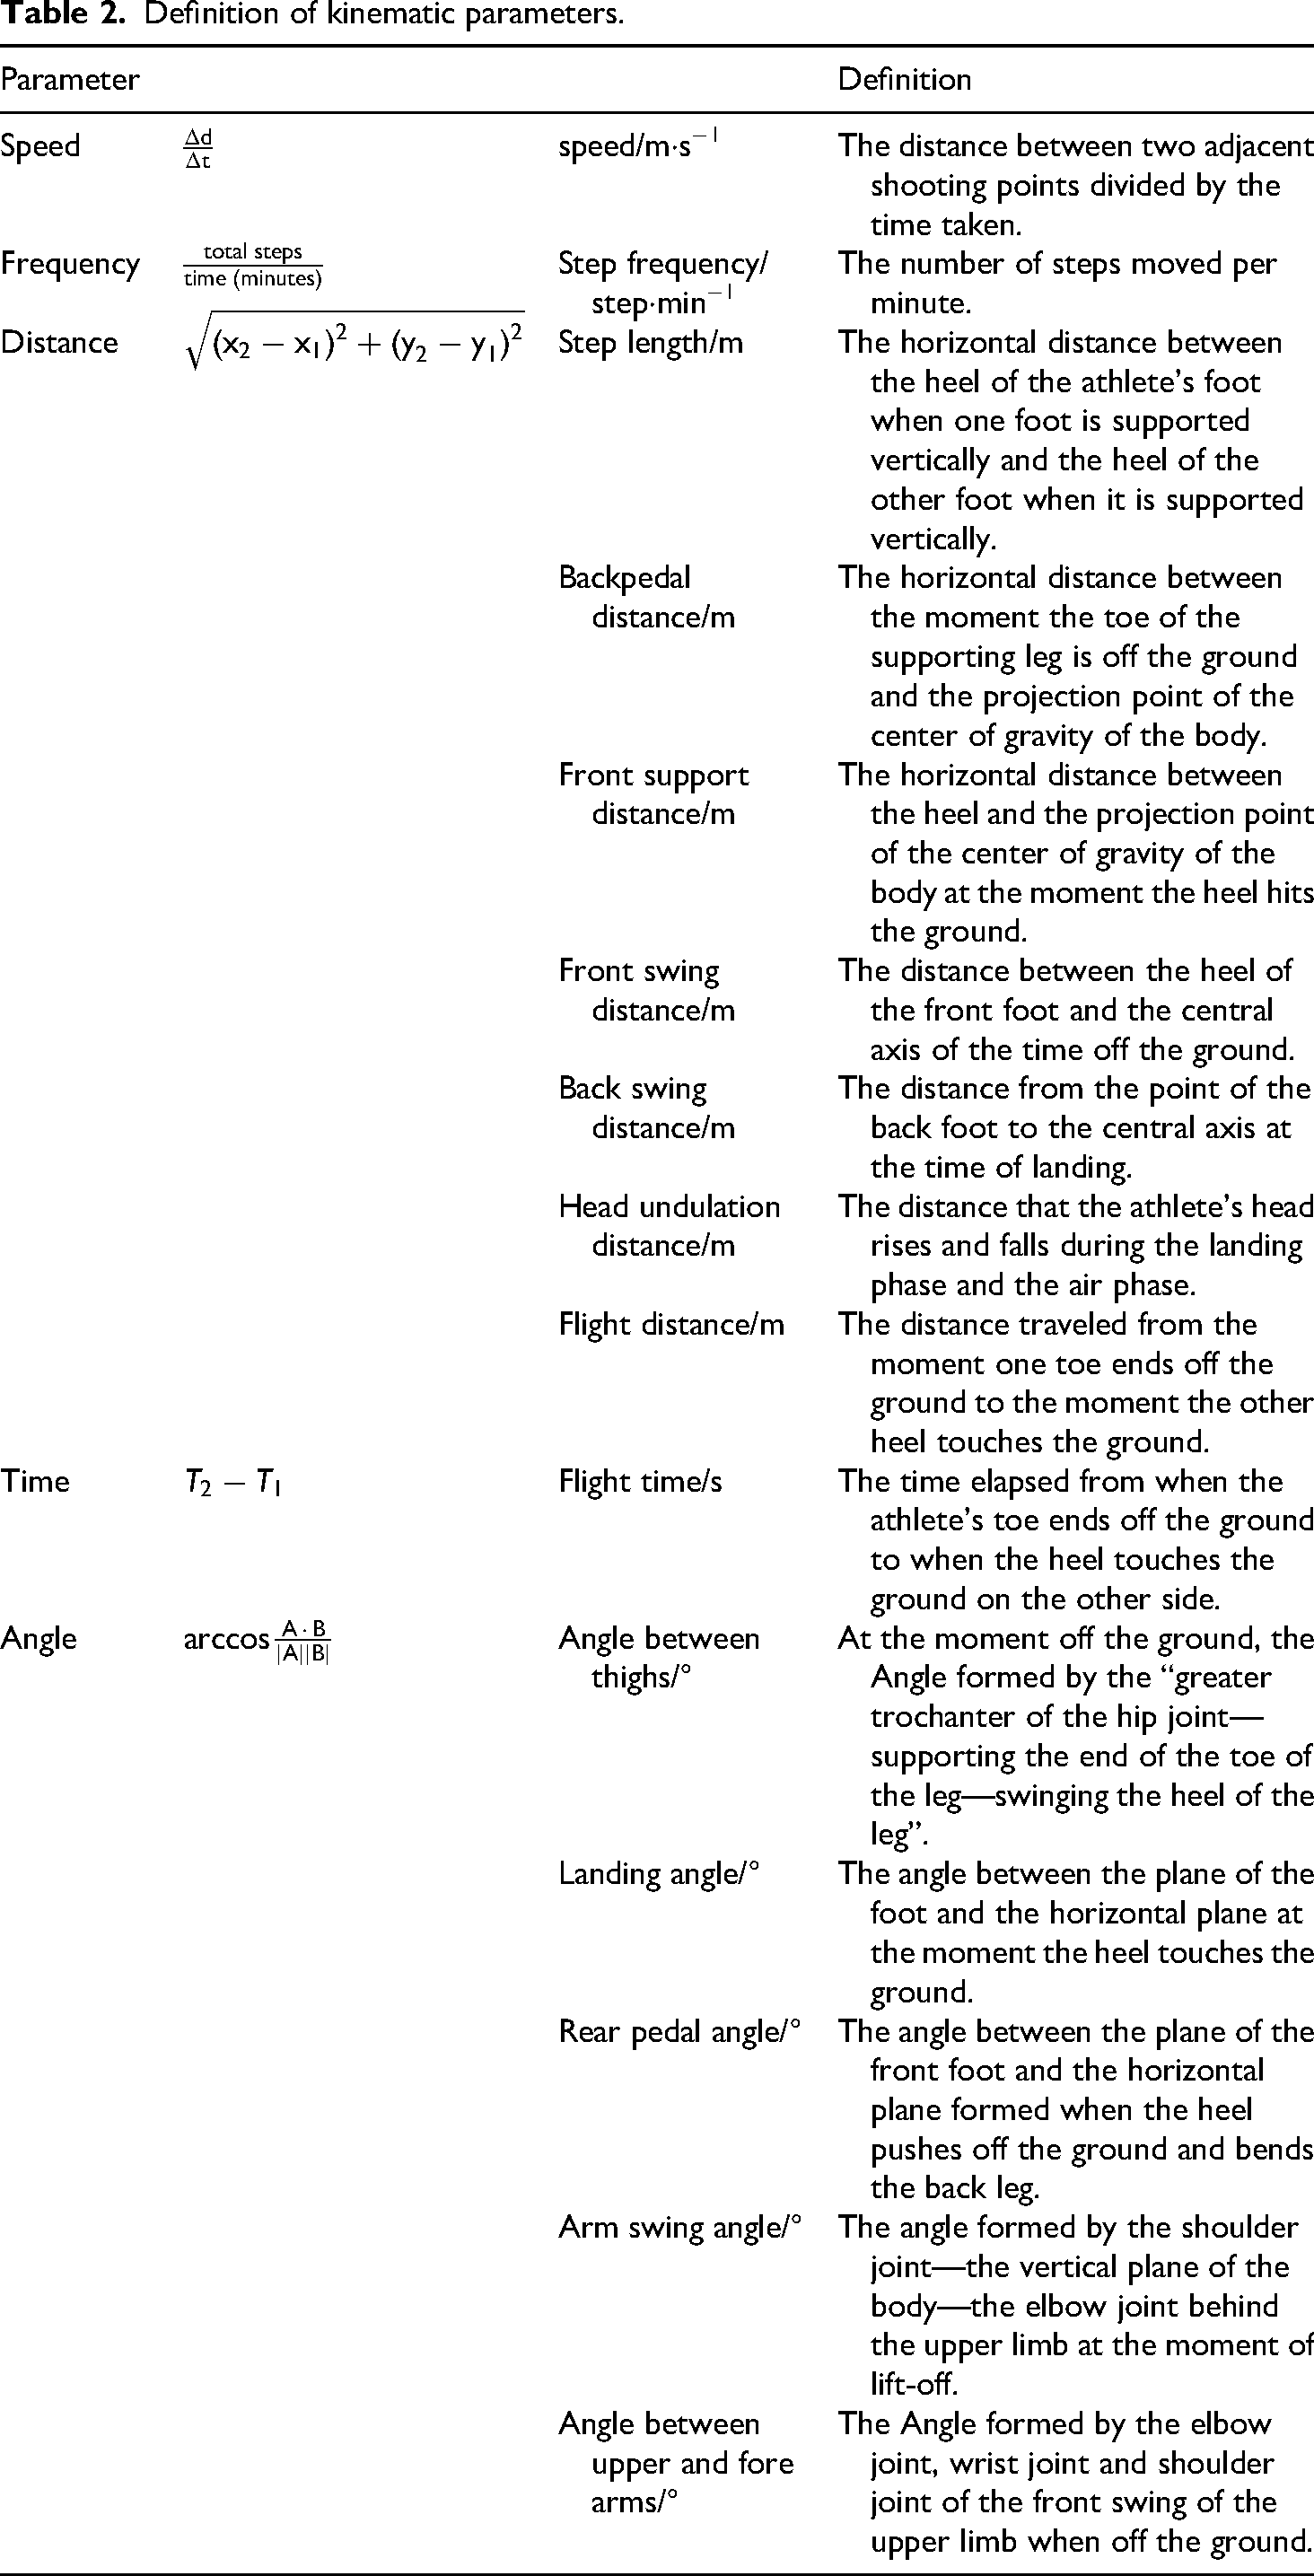
Tables 2 and 3 show the definition of each kinematic parameter representing the race-walking technology and its calculation formulas. Through these definitions and formulas, the 21 human key point coordinates obtained in the Image Parse step are converted into 15 kinematic parameters.
Definition of kinematic parameters.
Descriptive statistics of the dataset.

Note: *** indicate p-values <0.001.
Model training and validation
(1) To comprehensively evaluate the accuracy of the model, mean absolute error (MAE), root mean square error (RMSE), symmetric mean absolute percentage error (sMAPE), and R-squared (R2) were utilized as evaluation metrics. First, let the true value be denoted as In the model evaluation process, we initially calculated the MAE, RMSE, and sMAPE to quantify the magnitude of prediction errors. Subsequently, the R2 value was determined to evaluate the model's fit to the data. Finally, Spearman's correlation coefficient and Kendall's correlation coefficient were calculated to assess the linear correlation between the predicted and actual values. (2) In the RF model, “n_estimators” (the number of trees) and “max_depth” (the maximum depth of the trees) are critical hyperparameters. A grid search coupled with 5-fold cross-validation was employed to ascertain the optimal combination of “n_estimators” and “max_depth” that yields the best performance for the RF. The trend of -MSE as a function of “n_estimators” and “max_depth” is illustrated in Figure 4, indicating that the optimal combination is “n_estimators = 3” and “max_depth = 8”. (3)


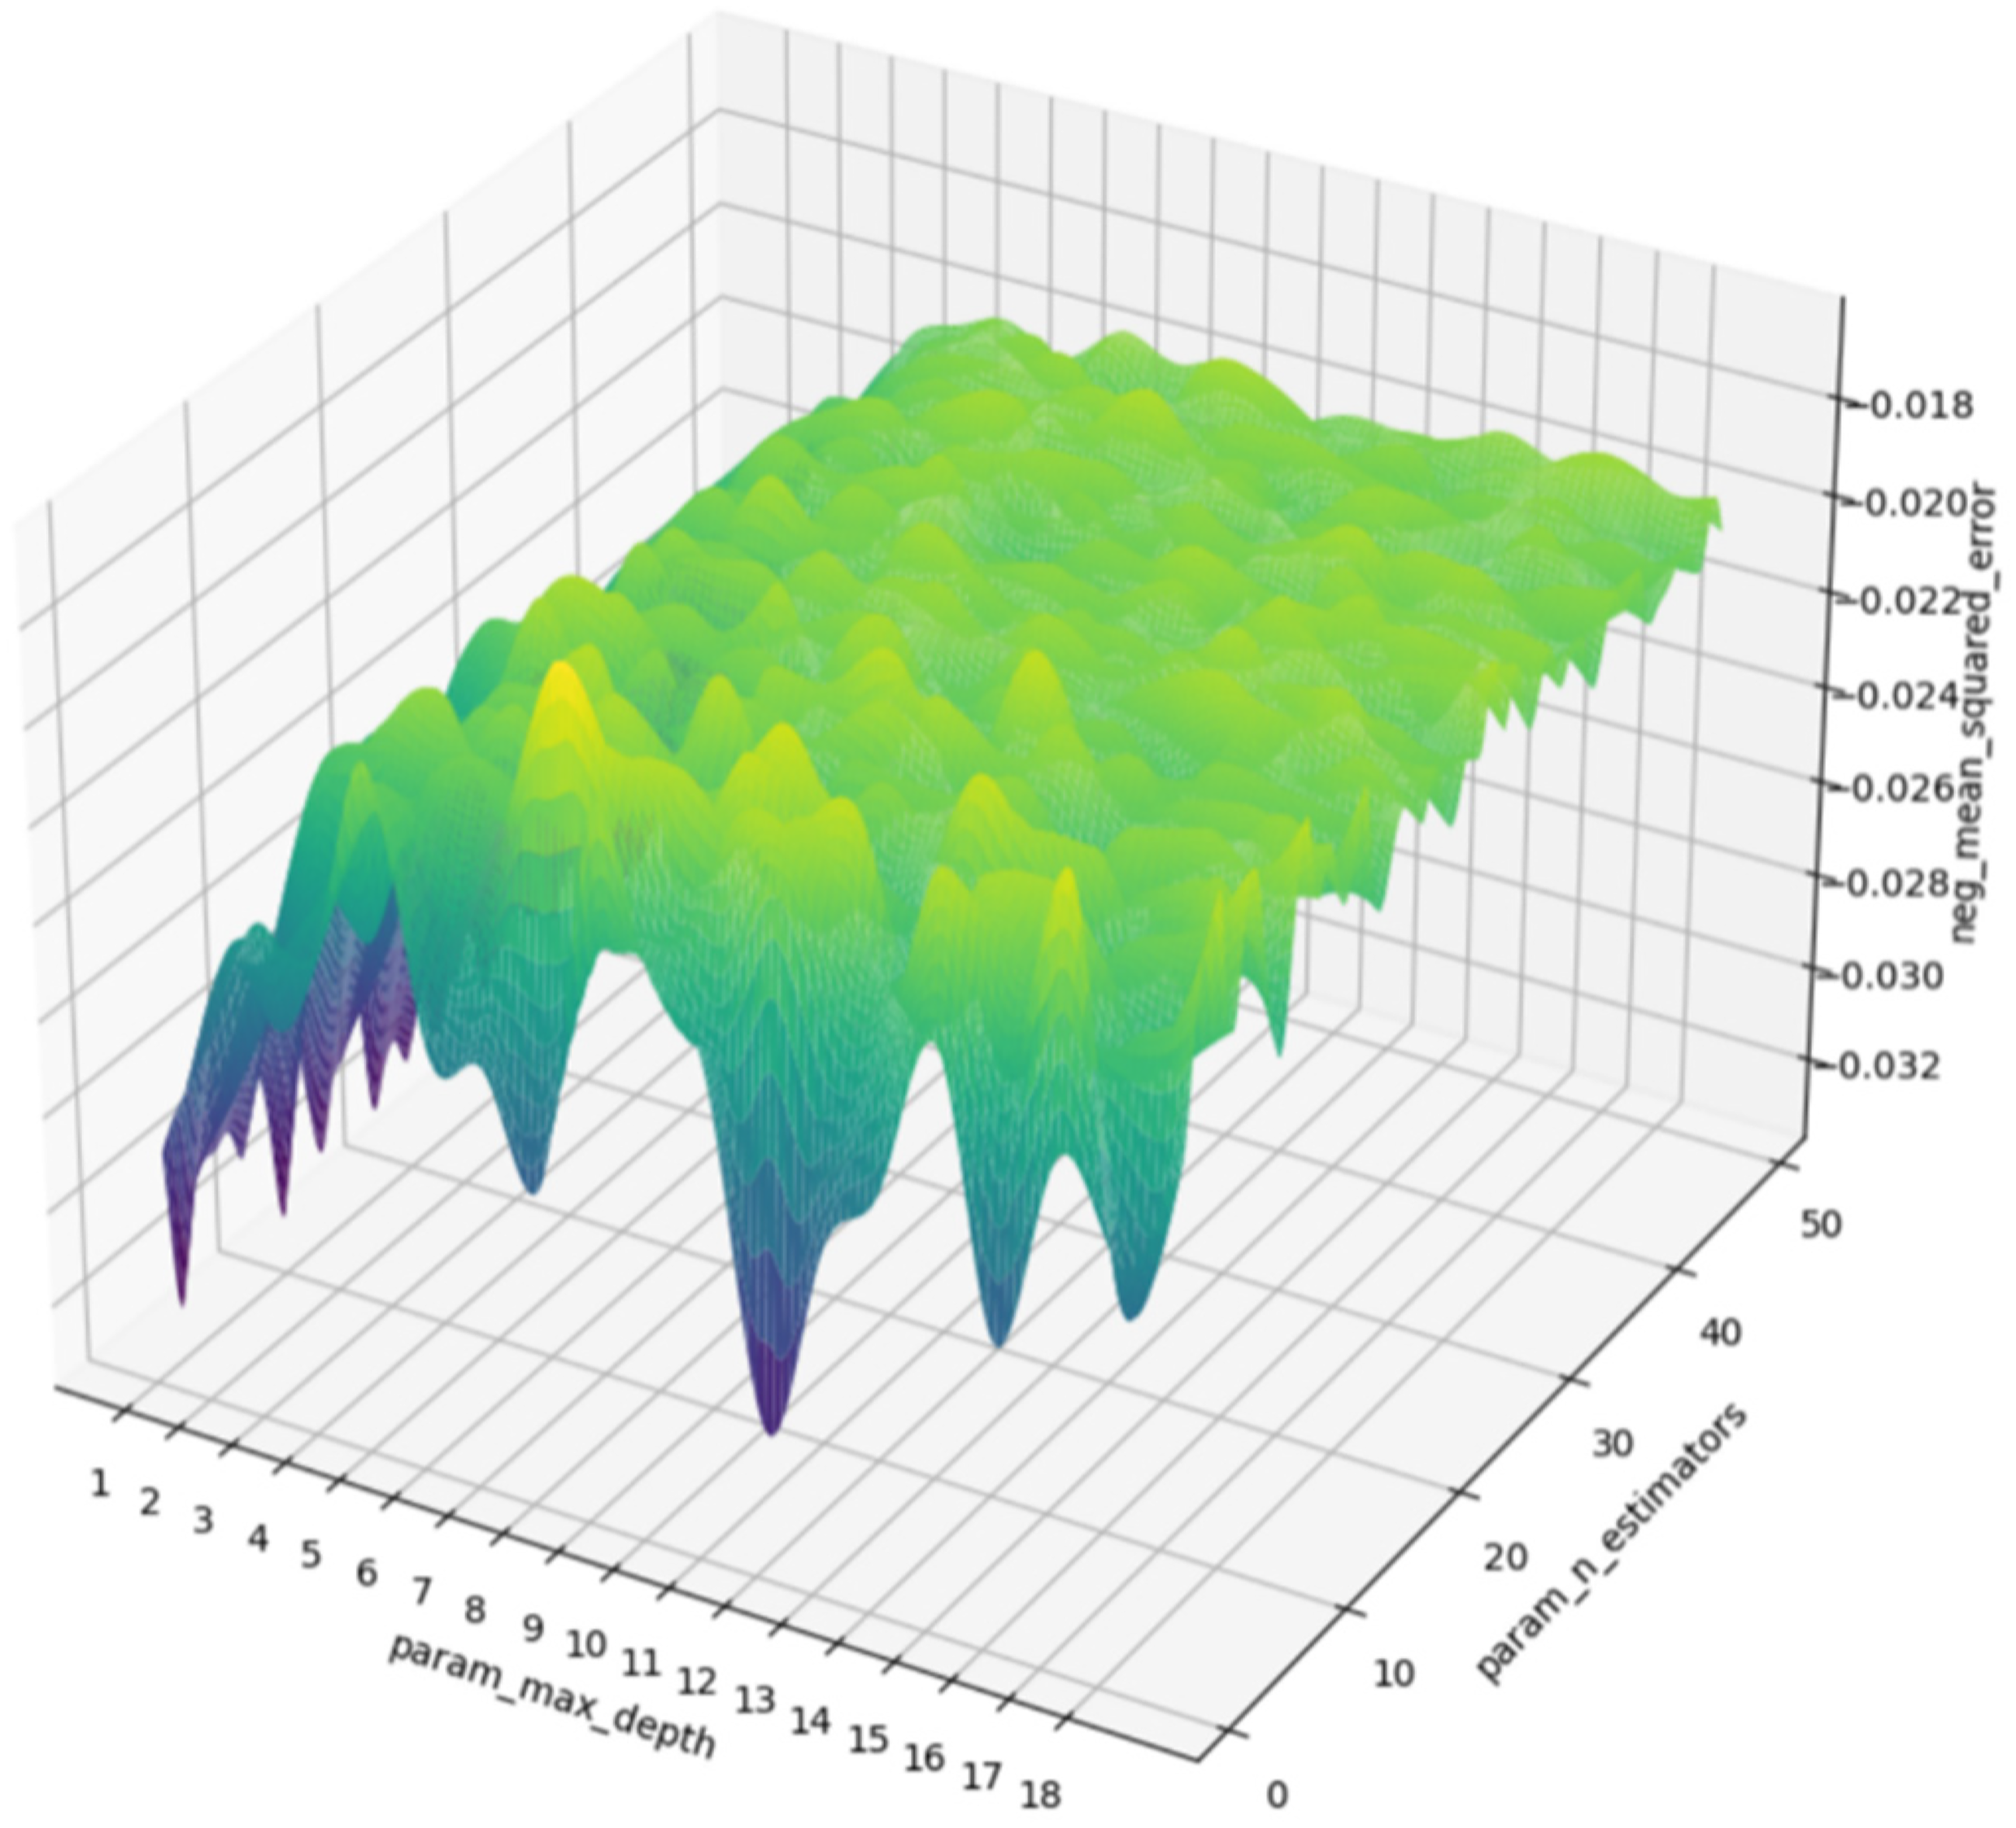
Negative mean square error (MSE) trends with “n_estimators’ and “max_depth’.
Leave-one-out cross-validation (LOOCV) is a simple and effective method for cross-validation. Each iteration retains one sample as the validation set, while the remaining samples form the training set. This process is repeated until each sample has been used once as the validation set. This study employed LOOCV as the training and validation strategy to ensure the model's generalization ability and prevent overfitting. LOOCV provided a robust approach to evaluate the model's performance, ensuring consistent performance across different data subsets.
Results
Descriptive statistics
To get a comprehensive understanding of the characteristics of the dataset, descriptive statistical analyses including maximum, minimum, mean, standard deviation, median, variance, kurtosis and skewness were performed. The specific results are shown in Table 3.
Models’ performance
The performance of several machine learning models was compared for the prediction task, specifically including RF, LASSO regression, support vector regression (SVR), K-nearest neighbors (KNN), decision tree (DT), and Bagging models. Five evaluation metrics were employed: MAE, RMSE, sMAPE, R2, Spearman's correlation coefficient and Kendall's correlation coefficient to evaluate the performance of each model. The results are presented in Table 4, and the prediction results of RF are depicted in Figure 5.

Comparison between predicted values and true values of random forest.
Results of model performance evaluation.
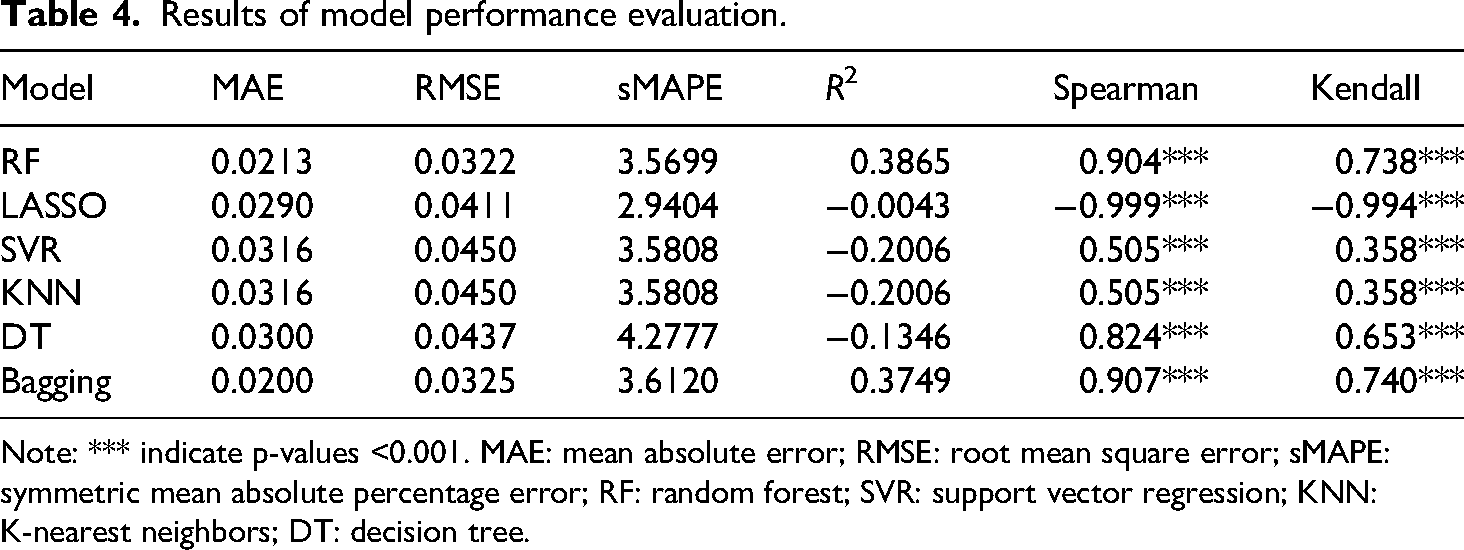
Note: *** indicate p-values <0.001. MAE: mean absolute error; RMSE: root mean square error; sMAPE: symmetric mean absolute percentage error; RF: random forest; SVR: support vector regression; KNN: K-nearest neighbors; DT: decision tree.
The relationship between sports technique and performance
There exists a mutually dependent relationship between sports technique and athletic performance. Sports technique is the foundation and core of an athlete's competitive ability, providing a solid base for the athlete to showcase exceptional performance in competitions. In turn, athletic performance is the direct manifestation and specific application of sports technique on the field, serving as an important marker for measuring an athlete's competitive level.
Taking race-walking as an example, it is a sport that heavily depends on technique and race-walking technique is considered its core competitive advantage. The athlete's proficiency in race-walking technique directly determines their performance and results on the competition field. 39 Therefore, for race walkers, the quality of their technique plays a crucial role. It not only reflects their competitive strength but also serves as the key to their pursuit of victory.
Feature importance
In this study, in-depth analysis was conducted on the competition data of 8 athletes within specific speed ranges. The speed range was determined by combining the athletes’ actual competition speeds (as shown in Figure 2) and the professional recommendations of the coaches.13,40 A total of 240 stride cycles and 480 individual step technical details were analyzed.
To reveal the relationship between speed and various technical indicators, the SHAP value algorithm was first used to calculate the feature importance of each indicator. Then, key indicators with the greatest impact were extracted for further cluster analysis to explore the specific correlations between these indicators and speed. Through this systematic and comprehensive analysis process, the relationship between speed and race-walking technique was clearly understood, providing scientific guidance for the athletes’ training and competition.
The feature importance analysis through SHAP values (as shown in Figure 6) reveals the ranking of the factors that most influence speed. The ranking is as follows: Step frequency > Step length > Angle between thighs > Flight distance > Angle between upper and fore arms > Head undulation distance > Landing angle > Rear pedal angle > Rear pedal distance > Back swing distance > Arm swing angle > Front support distance > Front swing distance > Flight time.

Importance ranking of variables.
The dependency relationship between race-walking technique and speed
From the perspective of feature importance, the dominant factors influencing race-walking speed are clearly identified as step frequency and step length. Although other influencing factors have not been clearly ranked in previous studies, this research employed the SHAP value method to systematically process and rank these indicators affecting race-walking speed, successfully identifying the optimal value ranges for each indicator. This innovative analysis not only provides a deeper understanding of the mechanisms influencing race-walking speed but also offers scientific guidance for training and competition strategies for race walkers.
Through an in-depth analysis of SHAP value feature importance, step frequency is significantly revealed as the primary factor influencing race-walking speed. This finding not only has a solid theoretical basis but is also supported by a rich historical legacy. Looking back, the outstanding achievements of China's first female race-walking gold medalist were built upon the unique technique of small steps and high frequency. Given the demonstration effect of this success, most teams tend to adopt this standard when selecting and training outstanding female race-walkers. As a result, the technique of small steps and high frequency dominates the current Chinese female race-walking community. This aligns with the research by Brian Hanley et al., 40 which found that, under the same race-walking speed conditions, female athletes tend to exhibit faster cadence and shorter step length, indicating that female race walkers are inclined to increase speed by enhancing step frequency. Therefore, in race-walking speed training, females should focus on increasing step frequency.
Based on the feature importance analysis (as shown in Figure 7), a positive correlation between step frequency and speed is observed—i.e. the faster the step frequency, the higher the speed. The optimal effect is achieved when the step frequency reaches 227 steps per minute. However, in training, one should not solely pursue an increase in step frequency at the expense of step-length training and adjustment. Only a balanced combination of optimal step frequency and step length can achieve the best athletic performance and efficiency.

Partial dependence plot for step frequency.
Through the evaluation of feature importance using SHAP values, it was found that step length is the second key factor influencing race-walking speed. In particular, when the step length reaches 1.12 m (as shown in Figure 8), its impact on speed tends to stabilize. Therefore, during training, when an athlete's step length approaches or reaches 1.12 m, if further increase in step length is desired, a detailed assessment and testing of the athlete's lower limb muscles should be conducted to determine whether they have the potential to break through the current limit. Such an assessment will help athletes effectively increase their step length while maintaining step frequency stability, thereby improving overall race-walking speed.

Partial dependence plot for step length.
Through an in-depth analysis of feature importance using SHAP values, it was found that the optimal angle between the thighs is between 50° and 65° (as shown in Figure 9). When the angle between the thighs is too large during race-walking, it can create the illusion of running, which not only attracts the attention of the judges but also may result in penalties. On the other hand, if the angle between the thighs is too small, it limits the full extension of the step length, thereby affecting the development of race-walking speed. Therefore, the appropriate angle between the thighs is crucial to ensure that the race-walking speed remains within a reasonable range. Athletes and coaches should closely monitor and adjust this key parameter to optimize race-walking performance.
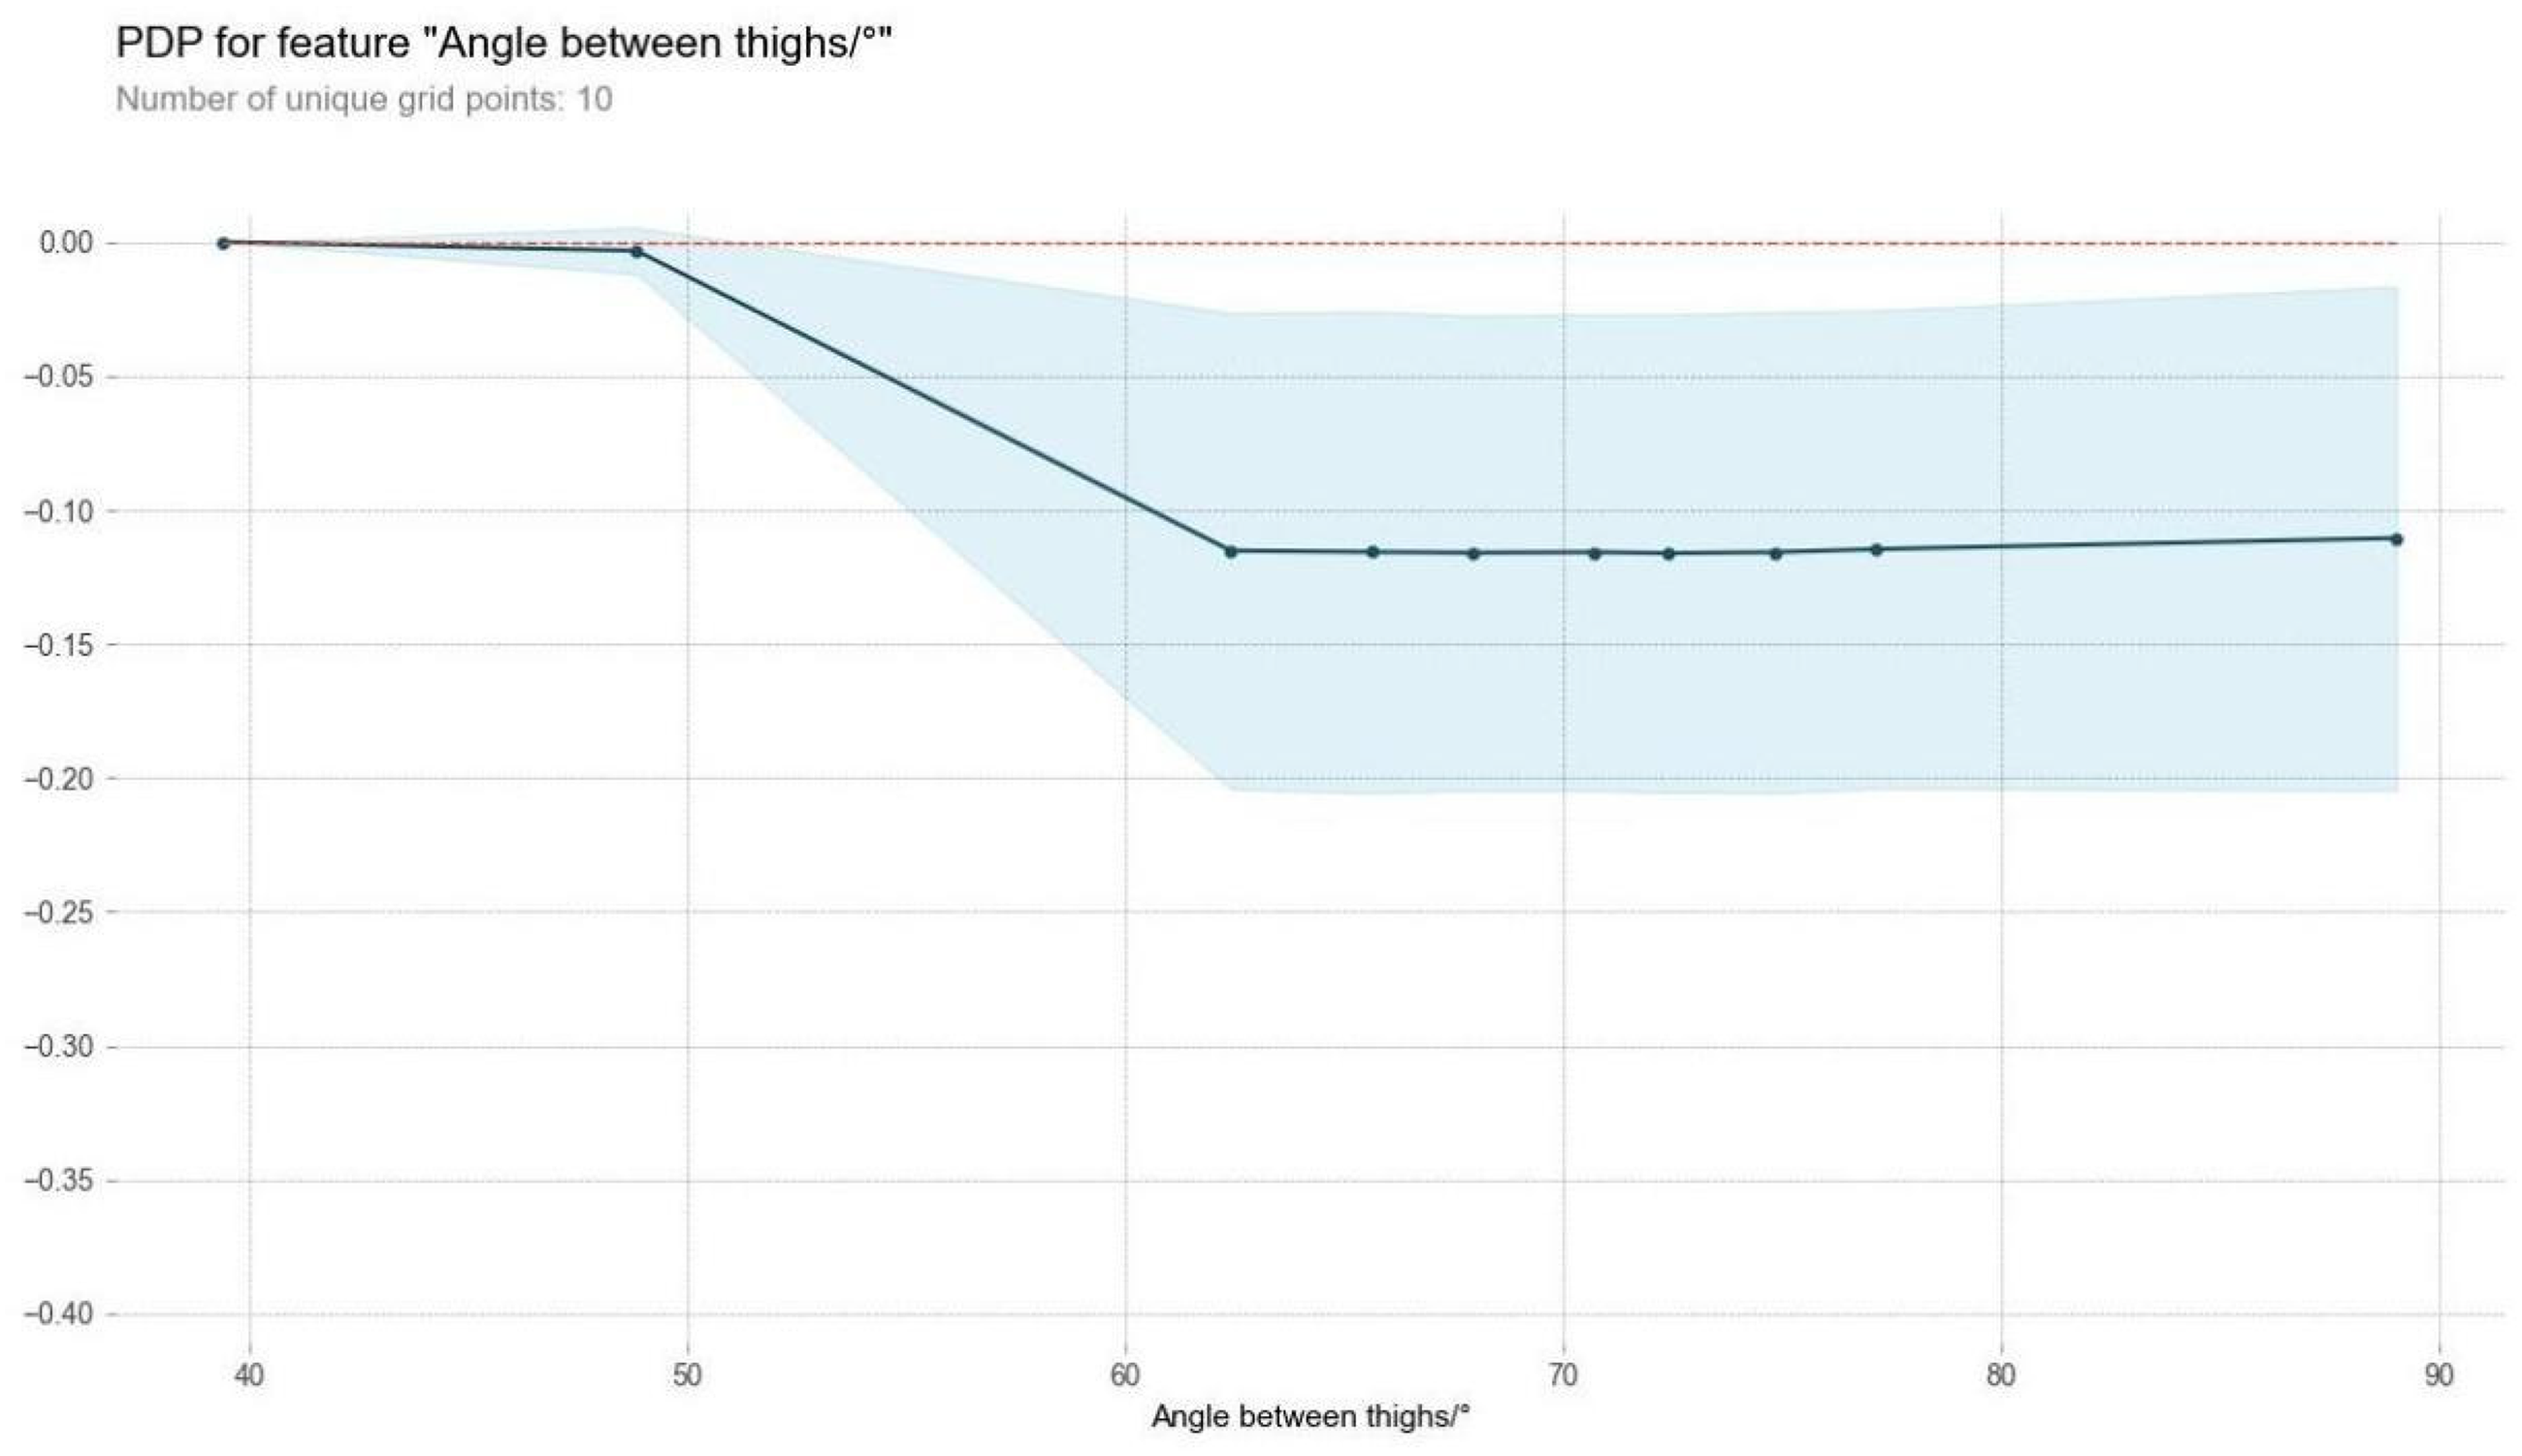
Partial dependence plot for angle between thighs.
Through a detailed exploration of feature importance based on SHAP values, it was found that flight distance has a significant impact on an athlete's performance, with its optimal value falling around 0.26 meters (as shown in Figure 10). Flight distance specifically refers to the horizontal distance the athlete's center of mass moves through the air, from takeoff to landing, during race-walking. According to the research by the Vibel, when the step frequency reaches 175 steps per minute, the double support phase disappears, and a flight phase begins. Flight distance not only reveals the horizontal movement distance of the athlete in the air during a single stride but is also closely related to the athlete's step length. Notably, world-class female race walkers tend to have a stable flight distance of around 0.25 m, 30 a finding that aligns with other scholars’ research and further validates the importance of flight distance in race-walking.

Partial dependence plot for flight distance.
In an in-depth exploration of the feature importance revealed by SHAP values, it was found that the optimal performance occurs when the angle between the upper and lower arms is approximately 77° (as shown in Figure 11). The swing of the upper arms directly reflects the degree to which the athlete's arms move forward. As the amplitude of the arm swing increases, the swing amplitude of the lower limbs also increases in synchronization due to the body's natural coordination mechanism, effectively expanding the step length. Furthermore, based on the principles of inertia and energy conservation, as the amplitude of the arm swing increases, the body's movement speed also accelerates. Specifically, when the angle between the upper and lower arms is around 77°, the forward speed of the body reaches its optimal state.

Partial dependence plot for angle between upper and fore arms.
In the rules of race-walking, the penalty for airborne movement holds a crucial position, and the head undulation distance is one of the key indicators used by referees to visually determine whether an athlete is violating the airborne rule. In the investigation of feature importance through SHAP values, it was observed that the head undulation distance falls within the range of 0.06 to 0.08 m (as shown in Figure 12), which aligns with findings from other researchers in the field. Furthermore, this data range also matches the head undulation distance of world-class race walkers (ranging from 0.05 to 0.08 m), 41 further validating the importance of this metric in race-walking.

Partial dependence plot for head undulation distance.
In race-walking, the ground contact support phase constitutes the primary resistance phase faced by athletes. The landing angle, which refers to the horizontal angle between the heel and the ground at the moment the swing leg's foot contacts the ground, is crucial for an athlete's performance. Through a thorough analysis of feature importance using SHAP values, it was found that the optimal landing angle should be between 23° and 27° (as shown in Figure 13). This finding aligns with the landing angle range of world-class race walkers (25°–30°), 1 and is consistent with conclusions from other researchers. This discovery provides a valuable reference for coaches and athletes during training, helping them optimize their technical movements and improve race-walking performance.

Partial dependence plot for landing angle.
Through detailed analysis of feature importance using SHAP values, it was determined that the optimal rear push angle should be controlled between 32° and 39° (as shown in Figure 14). This moderate rear push angle helps athletes achieve smoother movements during takeoff, reducing the upward force component, and laying a solid foundation for the subsequent landing phase. 35 The size of the landing angle is directly related to the extent of ankle joint extension. A larger landing angle indicates more complete ankle extension, resulting in a more stable landing. This ensures that the contraction of the calf muscles and tibialis posterior is more effective, and the calf extends more thoroughly. Not only does this ensure sufficient distance for the distal leg, thereby increasing stride length, but it also allows for a more efficient transition from the landing phase to the rear push, reducing energy loss during landing, shortening the support time, and making the entire technical process smoother. This finding undoubtedly provides strong support and guidance for coaches and athletes during training.
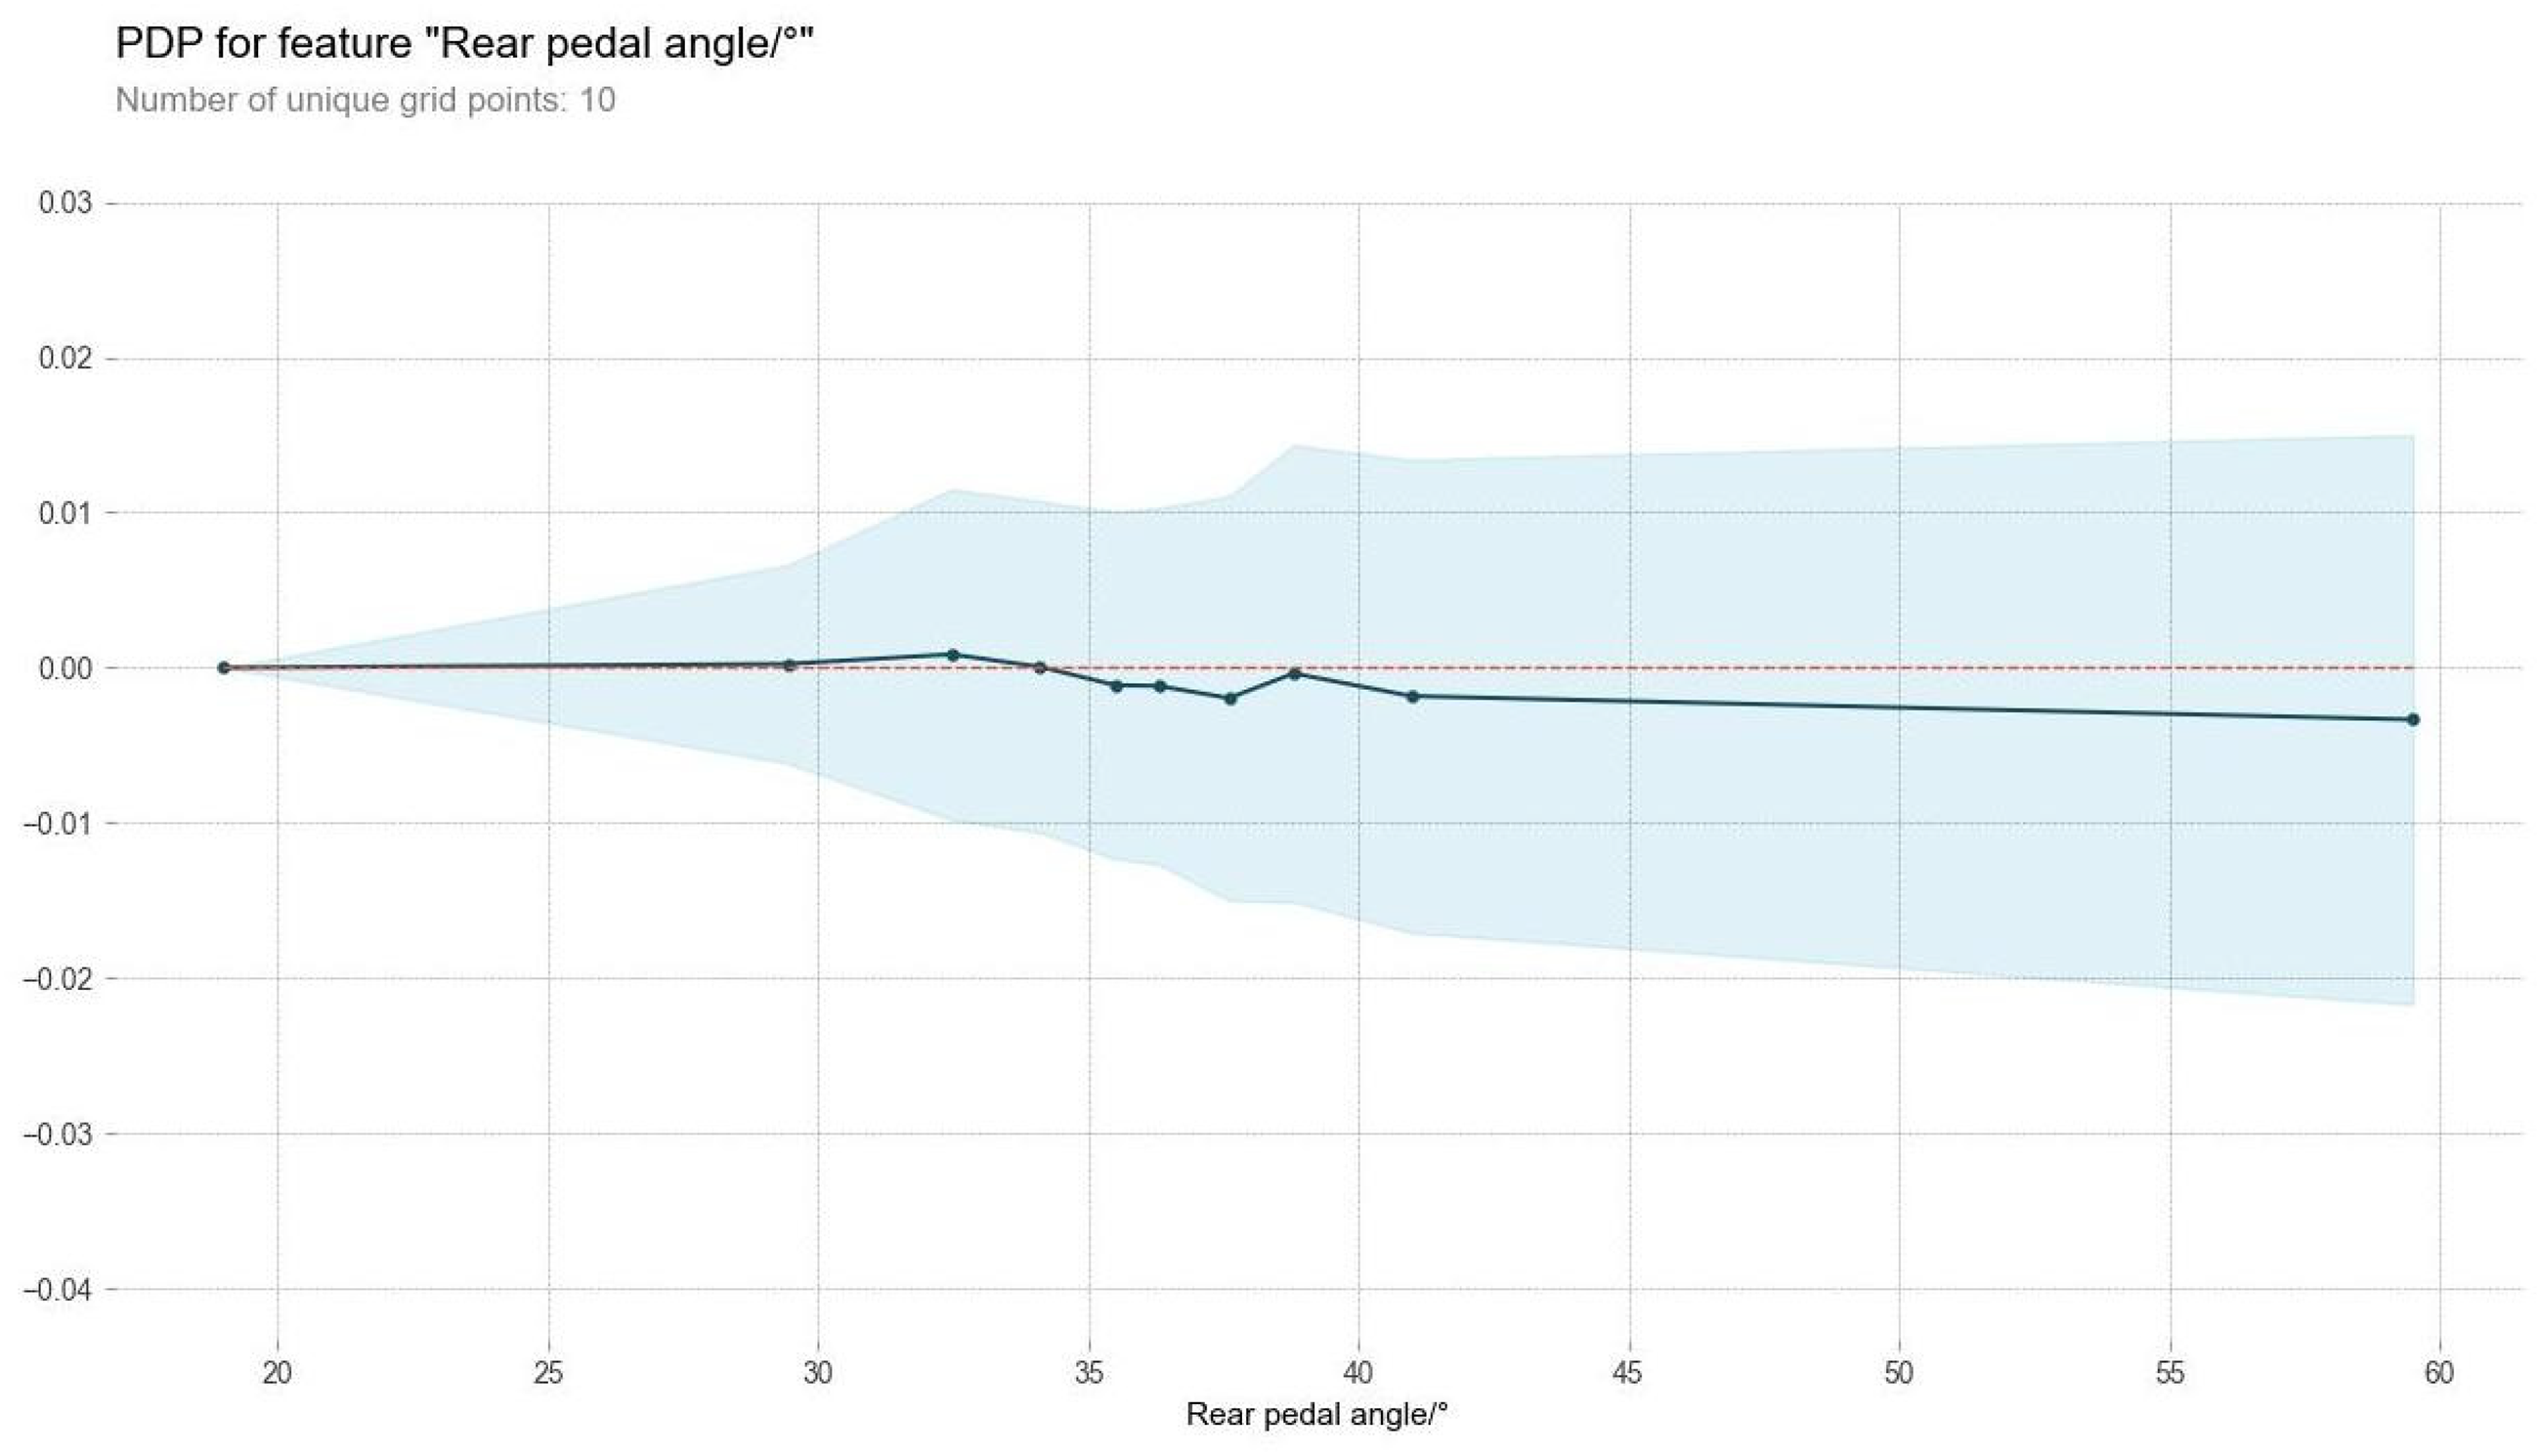
Partial dependence plot for rear pedal angle.
Through an in-depth analysis of feature importance using SHAP values, the optimal rear push distance was precisely determined to be between 0.37 and 0.43 m (as shown in Figure 15). The rear push is a crucial source of power in walking, running, and race-walking, and the length of the rear push directly reflects the strength of the rear push force. 35 The magnitude of the rear push force not only directly affects the speed at which the body's center of gravity moves, but it is also an important indicator of technical compliance. A reasonable rear push distance provides athletes with enough power while maintaining the original technical inertia, ensuring that the athlete's technical movements in the competition can flow seamlessly and exhibit the best competitive performance.

Partial dependence plot for backpedal distance.
Through careful analysis of feature importance using SHAP values, the optimal rear swing distance was precisely determined to be between 0.43 and 0.47 m (as shown in Figure 16). In race-walking, the lower limb swinging technique plays a crucial role, and the rear swing phase is particularly key. The rear swing distance refers to the distance from the rear push leg, after it leaves the ground, to the vertical line of the body's center of gravity when the front support foot touches the ground. This distance is a key technical indicator to assess the quality of the rear swing technique. The rear swing distance directly reflects the level of relaxation in the rear push leg as it swings from behind to the front, and the speed of the rear swing determines how fast the body's center of gravity moves forward. During the rear swing phase, the body moves forward relying solely on its own inertia (apart from gravity), with the rear push leg playing a crucial role in regulating the lower limb technical movements. The size of the rear swing distance is important for evaluating the quality of the lower limb swinging technique. This finding not only provides a strong basis for coaches during training but also offers valuable guidance for athletes to optimize their technical movements during competition. By precisely controlling the rear swing distance, athletes can more effectively utilize body inertia, improve race-walking efficiency, and achieve better results in competitions.

Partial dependence plot for back swing distance.
Through a detailed analysis of feature importance using SHAP values, the optimal rear swing angle of the upper arm was precisely determined to be between 57° and 62° (as shown in Figure 17). In race-walking or running, the quality of the lower limb landing technique is directly linked to the swinging technique of the upper limbs, and the upper limb swinging technique is crucial for maintaining the balance of the torso. The human body operates as a coordinated whole, with the amplitude of the upper limb swing typically affecting the amplitude of the lower limb swing. Particularly at the moment of takeoff, the rear swing angle of the upper arm guides the lower limbs forward.

Partial dependence plot for arm swing angle.
Observations of world-class athletes show that, at takeoff, the upper arm's rear swing angle is generally maintained around 70°. 42 Although this finding slightly differs from some researchers’ results, the variance is within an acceptable range and needs further verification and optimization in practical training. This precise data not only provides valuable reference for coaches during training but also offers athletes critical guidance for optimizing their technical movements and improving performance in competitions.
In the process of a race walker's progression, the landing phase is often the key period where resistance is generated. The size of the front support distance directly reflects the athlete's ability to overcome this resistance. More importantly, the front support distance not only affects the duration of the support phase but also, when increased, allows more time for landing cushioning, ensuring a smoother transition during the landing phase and making the race-walking technique more economical and coordinated.
Through a detailed analysis of feature importance using SHAP values, the optimal front support distance was precisely determined to be between 0.19 and 0.25 m (as shown in Figure 18). This aligns with previous research, which generally suggests that the optimal front support distance should be about 13% to 15% of an athlete's height. Considering that the average height of race walkers is approximately 1.66 m, this finding is highly consistent with earlier conclusions. This discovery not only provides valuable practical guidance for race walkers but also offers strong theoretical support for coaches in developing training plans, helping athletes further enhance the efficiency and coordination of their race-walking technique.

Partial dependence plot for front support distance.
Through in-depth analysis of feature importance using SHAP values, the optimal front swing distance was precisely determined to be between 0.25 and 0.30 m (as shown in Figure 19). This finding aligns with the actual front swing distance of top female race walkers, who typically maintain a front swing distance of around 0.3 m during competitions, consistent with previous research conclusions. 43 The front swing distance is an important indicator for measuring the extent of forward swing in a race walker's movement. If the front swing distance is insufficient, it will lead to a reduction in the amplitude of the lower limb swing, thereby limiting the forward extension of the entire lower limb swing leg. Additionally, if the swing leg's folding angle is too large, it further compresses the front swing amplitude, making it difficult for the stride to fully extend. This research provides significant theoretical support for coaches and athletes, helping them optimize the race-walking technique structure and ensuring that athletes maintain an appropriate front swing distance during competitions, thereby fully unleashing their technical potential and improving athletic performance.

Partial dependence plot for front swing distance.
Through in-depth analysis of SHAP values, the optimal air time for race walkers during competitions was precisely determined to be between 0.033 s and 0.05 s (as shown in Figure 20). During race-walking, as the athlete's speed increases, a brief air time phenomenon occurs, according to Newton's laws of motion. However, the race-walking rules clearly state that a penalty is only imposed when the air time is visibly noticeable. Considering that the human visual frame rate is approximately 1/24 s, studies have confirmed that air time below 0.042 s (i.e. 1/24 s) is considered within the acceptable limit for air time. 44 Domestic scholars and researchers have conducted extensive studies on the time limits for penalty assessments by referees and classified them into three intervals: Air time below 0.042 s is considered a reasonable air time limit, 0.042 s to 0.080 s is the ambiguous air time limit, and air time exceeding 0.080 s is considered a fou.l,45 This means that the longer the air time, the higher the risk of a penalty. Therefore, in pursuit of speed improvement, both athletes and coaches must pay close attention to controlling air time. During training, athletes and coaches should carefully monitor air time, ensuring that the athlete maintains efficient speed while keeping air time within a reasonable range. By accurately combining technique and air time control, athletes can approach competitions with greater confidence and improve their athletic performance.
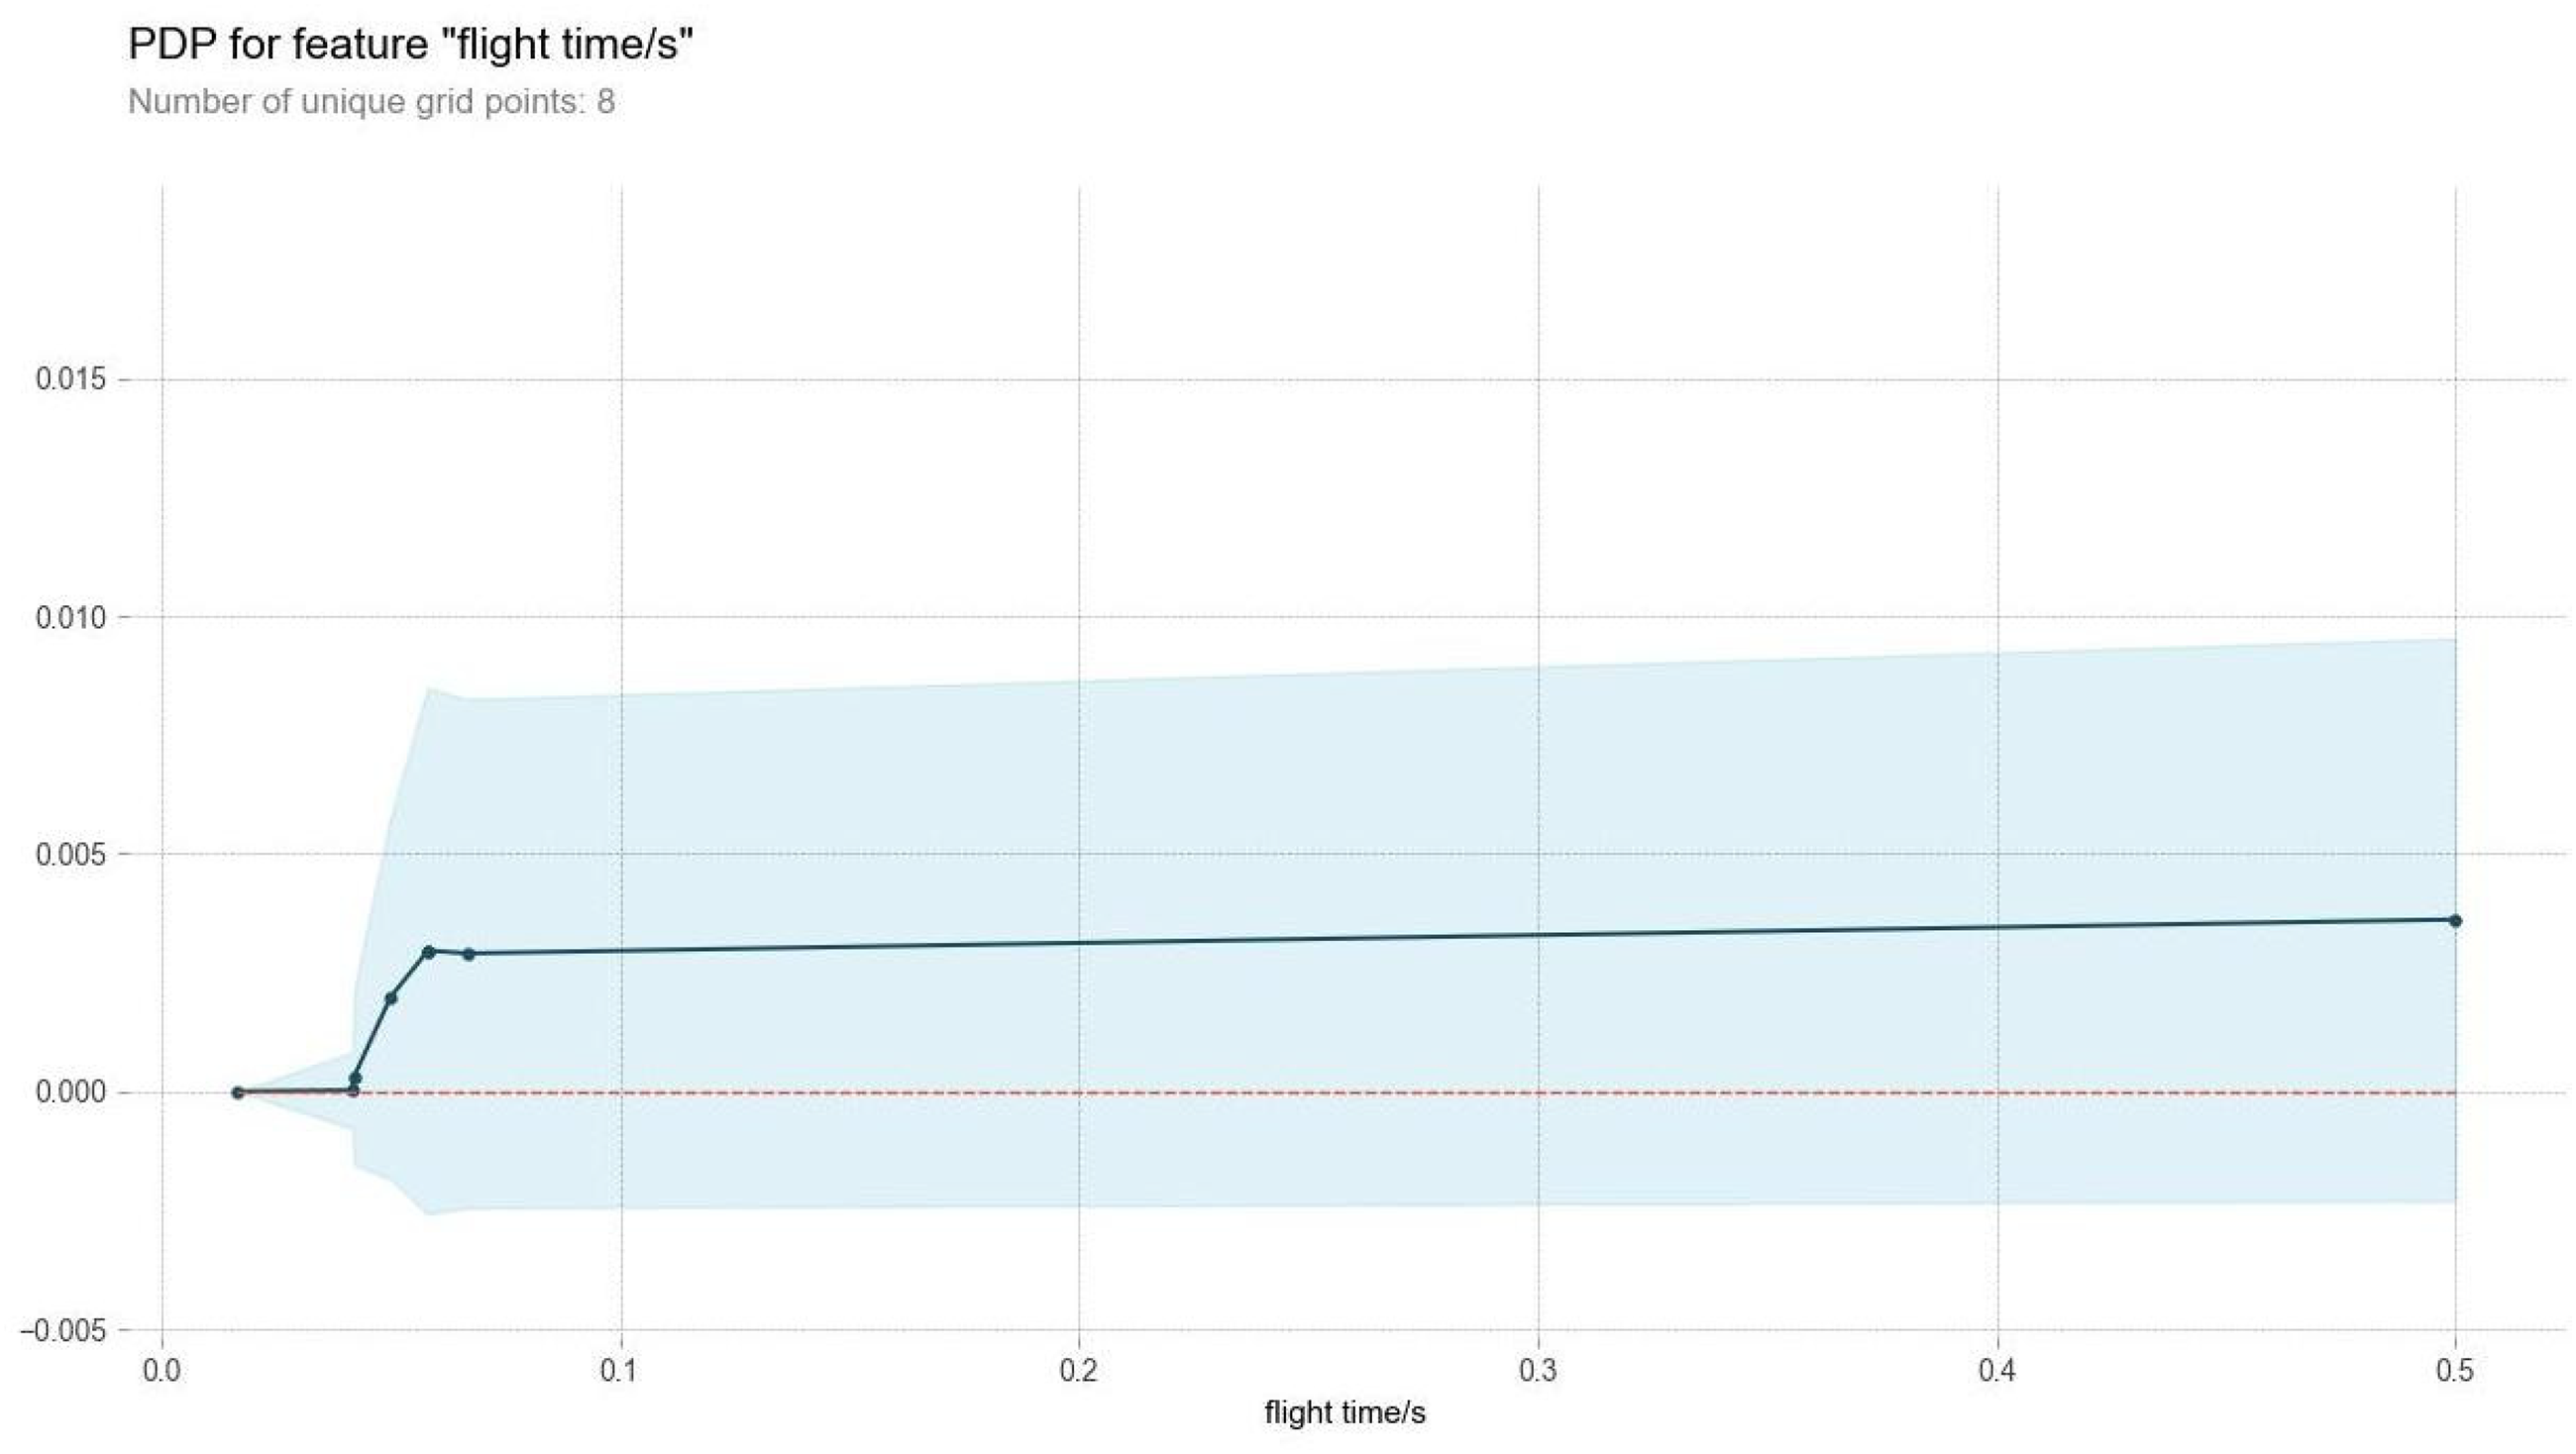
Partial dependence plot for flight time.
Discussion
In this study, a “Speed-Technique” model for race-walking was constructed using machine learning, and SHAP values were employed to analyze athletic performance. This section discusses the precision test results of various models, evaluates the relationship between technique and performance, and explores the strengths and limitations of the research.
Accuracy of the models
The performance of various machine learning models based on the evaluation metrics presented in Table 4. The RF model demonstrates the lowest MAE and RMSE, indicating that its predictions are, on average, closest to the actual values. Additionally, RF achieves a relatively high Spearman's rank correlation coefficient and Kendall's tau, both of which are statistically significant (p < 0.001), suggesting a strong monotonic relationship between the predicted and actual values. This implies that the RF model not only provides accurate point estimates but also effectively captures the overall trend in the data. In contrast, the LASSO model exhibits the highest negative Spearman's and Kendall's coefficients, indicating a strong but inverse monotonic relationship. This unusual result may suggest that LASSO is capturing some form of inverse dependency or that the model is not well-suited for the underlying data structure. The SVR and KNN models show similar performance metrics, with moderate RMSE and sMAPE values, but their R2 values are negative, indicating poor fit to the data. The DT model performs slightly better than SVR and KNN in terms of MAE and RMSE but still has a negative R-squared value. The Bagging model achieves the lowest sMAPE and a relatively high R2 value, comparable to RF. This suggests that ensemble methods like Bagging can effectively reduce prediction errors and improve model robustness. Overall, the results highlight the importance of selecting appropriate models and evaluation metrics for specific datasets. Future work should focus on exploring more advanced ensemble techniques or hybrid models to further enhance prediction accuracy and interpretability.
The influence of techniques on speed
After comparing and evaluating multiple models, the most optimized SHAP explanation model was selected to analyze the complex relationship between race-walking speed and technique. In terms of athletic performance, race-walking speed and technique are interdependent yet contradictory elements. Specifically, when athletes pursue maximum speed and attempt to break their limits, they often approach the boundary of the rules, leading to airtime violations, highlighting the delicate balance between speed and technical compliance. On the other hand, if too much focus is placed on technical adherence, deliberately slowing down the pace to ensure correct form may avoid penalties, but can also result in insufficient speed, which could be detrimental in a competitive setting. Therefore, the study focuses on how to optimize race-walking speed while respecting and enhancing technique, seeking the best balance to maximize performance.
The analysis of the modeling data revealed that the main factors affecting the performance of race walking were the lower limb techniques, including step frequency, step length, angle between thighs, flight distance, followed by the angle between upper and fore arms, head undulation distance, landing Angle, rear pedal angle, backpedal distance, back swing distance, and lastly arm swing angle, front support distance, front swing distance, flight time.
When the step length reaches 1.12 m, the speed enhancement effect decreases and stabilizes. This means that further increase in step length has a limited effect on speed enhancement. On the other hand, female speed enhancement is mainly related to an increase in step frequency, i.e. an increase in the number of steps per minute. However, an increase in step frequency needs to be cautious in order to avoid causing gait instability or sports injuries. Therefore, a balance between step length and step frequency should be maintained during training to achieve optimal exercise performance. 40 Race walkers maintain an angle between thighs in the range of 50°–65° to help improve performance. Too much angle between thighs may lead to gait problems and affect performance. Angle between thighs is the key to affecting step length, which in turn affects speed. Therefore, adjusting the angle between thighs can help athletes control their step length, increase their speed, and achieve better performance. This finding is of great value for both athlete training and coaching. 46 The optimal distance for an athlete when flight distance is about 0.26 m. This finding emphasizes the importance of maintaining proper posture in the air. Athletes must have precise control of their body posture in order to maintain balance and accelerate. Precise body control is the key to maintaining balance and acceleration in race walkers. Athletes need to pay special attention to postural control during training to ensure optimal aerial performance during competition. 47
Athletes achieve optimal exercise efficiency when maintaining an angle between upper and lower arms of approximately 77°. This conclusion was reached through an in-depth analysis of exercise biomechanics and extensive experimental data. Maintaining this specific angle helps athletes use muscle power more efficiently, reduces energy expenditure, and enhances athletic performance. This optimization not only improves athletic performance, but also prevents injuries and ensures that athletes remain in top form during training and competition. 26 The head undulation distance should be precisely controlled within the interval of 0.06–0.08 m. Such a range of values coincides with a widely recognized and accepted standard in the academic community. Specifically, this range ensures that the amplitude of the head movement is neither too large nor too small, thus ensuring that the movement is effective while avoiding possible discomfort or injury to the body. This precise control not only meets the requirements of scientific research, but also fulfills the criteria for penalization in practical applications, ensuring stability and reliability during the exercise process. 48 The optimal landing angle for race walkers should be between 23° and 27°, which corresponds to the actual angle of top athletes and helps to reduce energy expenditure and improve gait stability and efficiency. Deviations from this range result in a poor gait and increased energy expenditure. Maintaining this landing angle is therefore critical to improving performance and reducing the risk of injury. 49 The rear pedal angle should be controlled between 32° and 39° when the athlete races off the ground to improve movement efficiency and fluidity. Adjusting to this angle range reduces the upward force, saves energy, helps athletes easily overcome gravity, and maintains aerial balance and stability. This optimized rear pedal angle is conducive to the smooth and fast completion of the jump and landing transition movements, which will enhance the performance of the competition. 50 At the same time, the two key technical parameters, backpedal distance and back swing distance, have been precisely defined within specific ranges. Specifically, the backpedal distance was set between 0.37 and 0.43 m, while the back swing distance was set between 0.43 and 0.47 m. These specific values provide a quantitative basis for athletes’ technical training, allowing them to adjust and optimize their movements to improve their overall performance. 4
In order for athletes to effectively maintain the balance between power and speed during the swing, the optimal arm swing angle range should be stabilized between 57° and 62°. This finding is an important guideline for athletes’ technical training because it provides a clear angular reference to help them better control the swing of the great arm during training and competition, thus optimizing their athletic performance. By practicing within this angular range, athletes can better coordinate the output of muscular power with the increase of movement speed, ultimately improving the overall athletic performance. 51 Front support distance setting is critical for athletes and is typically set between 0.19 and 0.25 m, matching 13–15% of the athlete's height. This setting takes into account individual differences and allows coaches to personalize training to improve technique and prevent injuries, thus enhancing performance and athleticism. 52 With the data from this study, the optimal front swing distance should range between 0.25 and 0.30 m. This finding is highly consistent with the actual performance of the world's best female race walkers in competition, whose front swing distance is usually around 0.3 m. This finding reaffirms the practicality and accuracy of the study results, indicating that these data are not only theoretically feasible, but also widely used and validated in actual competitions. 39 In the process of in-depth exploration of the flight time, it was finally confirmed that the optimal flight time of race walkers in competition should be strictly controlled within a very narrow time range, i.e. between 0.033 s and 0.05 s. Through the analysis and experimental validation of a large amount of competition data, it was further found that when the flight time is less than or equal to 0.042 s (i.e. 1/24th of a second), such a flight time can be regarded as complying with the upper limit of the rules. This important finding not only provides a more precise and detailed reference standard for the referees in making penalties, but also provides clear technical guidance for coaches and athletes in the training process, helping them to better control the flight time in the game, so as to avoid fouls and improve the performance of the game.53,54
Limitations and future work
While this study provides valuable insights into the relationship between race-walking technique and speed, several limitations should be acknowledged: This study focused solely on elite female race walkers, which may limit the generalizability of the findings to male athletes or those at different performance levels. The influence of sex, age, and experience on the identified technical factors could vary, and further research should include a more diverse sample of athletes to validate the results across different populations. The kinematic data used to construct the “Speed-Technical” model were likely gathered under controlled conditions (e.g. laboratory settings or during competition), which may not fully represent real-world variations. Factors such as fatigue, environmental conditions, or the psychological state of the athlete were not accounted for, which could influence the technical execution and speed. Future research should consider incorporating these variables to provide a more holistic view of race-walking performance. While RF algorithms and SHAP values offer a sophisticated approach to understanding the relationship between technical factors and performance, the model's interpretability remains a challenge. While SHAP provides insight into the importance of each feature, understanding the complex interactions between variables (e.g. how changes in step frequency might influence other factors such as step length or thigh angle) requires further analysis. Exploring more transparent machine learning methods or incorporating domain expertise in model design may help in better interpreting these interactions.
To address these limitations and expand the understanding of race-walking performance, future research could focus on the following areas: Future studies should explore the optimal technical ranges for male athletes and novice or intermediate race-walkers to identify potential gender-based differences and determine if the identified technical factors apply universally or if they vary with skill level. Conducting longitudinal studies would allow researchers to track the evolution of technical performance over time, helping to understand how training, fatigue, and recovery influence the identified technical factors. This would also enable the development of adaptive models that can adjust to changes in an athlete's condition and performance. Integrating additional factors, such as muscle activation patterns, metabolic rates, and overall fatigue levels, could enhance the model's accuracy and relevance. Technologies like EMG and metabolic monitoring could provide more comprehensive data that links biomechanical technique with physiological performance.
By addressing these areas, future studies could help further refine the optimal technical model for race-walking, ultimately contributing to the development of more effective training regimens and enhancing competitive performance.
Conclusion
In this study, the numerous patterns identified are highly consistent with the research findings of previous scholars, further validating the robustness of race-walking scientific research. At the same time, some subtle differences between indicators were observed, which can be attributed to the timeliness of the literature and the ongoing evolution of race-walking techniques, which, although stable, continue to experience gradual innovations.
Through the analysis using the SHAPly interpreter, a series of specific technical indicators that significantly influence race-walking speed were identified. This discovery not only deepens our understanding of the complex relationship between speed and technique in race-walking but also points the way for future sports training practices.
In the subsequent sports training process, training plans will be formulated more precisely and scientifically based on the identified technical indicators and their feature importance. By specifically strengthening or adjusting the athletes’ performance in certain technical indicators, it will be possible to effectively enhance race-walking speed, while ensuring the correctness and compliance of technical movements, thus avoiding penalties for air time violations and other unfavorable situations.
Footnotes
Author contributions
Y.W. conceived and designed the experiments. Y.W. and Y.Q.P. analyzed the data and contributed to the manuscript's writing. X.Z. and Y.X.P. helped draft the manuscript. H.L. and X.W. contributed to the conception and design of the study. All authors reviewed the manuscript.
Funding
The authors disclosed receipt of the following financial support for the research, authorship, and/or publication of this article: This work was supported by the following funding sources: the Great Wall Scholars Program for High-quality Teacher Development in Beijing Colleges and Universities (Grant No. CIT&TCD20190335), the Emerging Interdisciplinary Platform for Medicine and Engineering in Sports (EIPMES), and the Beijing Science and Technology Plan Project (Grant No. Z221100005222031).
Declaration of conflicting interests
The authors declare no conflict of interest.
Data availability statement
The data used is kept confidential as it comes from active athletes. Please contact Yibing Wang (wangyibing2022@cupes.edu.cn) for details.