
Abstract
Liposomes, which are bilayer lipidic nanocarriers, have been utilized in many pharmaceutical applications to enhance the solubility and therapeutic index of drugs. Liposomes have also been used as carriers for smaller drug carriers, such as cucurbiturils, to achieve a more controlled release of the drug into the targeted site in the body. In this study, we investigated the effects of cucurbit[7]uril, a macrocyclic organic compound, on the integrity of liposome lipid membranes. The average liposome size, measured by dynamic light scattering, increased with increasing concentrations of cucurbit[7]uril. In addition, fluorescence spectroscopy was used to calculate an association constant (Ka) between cucurbit[7]uril and cholesterol of 3
Introduction
Recent decades witnessed many advances in drug delivery systems particularly through the use of nanoparticles, cucurbiturils (CBs), and cyclodextrins (CDs). These systems have advanced the delivery of pharmaceutical agents to the disease-affected sites, offering improved therapeutic outcomes and reduced side effects.1–4 Among these, liposomes have emerged as a main platform due to their ability to encapsulate both hydrophobic and hydrophilic molecules. Encapsulation of active drugs in liposomes enables specific targeting and drug localization. For example, doxorubicin encapsulated in PEGylated liposomes became the first FDA-approved liposomal formulation with anticancer activity. 5
Liposomal drug nanocarriers are favored over other nanoformulations due to higher biocompatibility, the ability to enhance drug solubility, and targeted delivery while reducing toxicity.3,6 These sophisticated properties of liposomes aid in improving the therapeutic index, establishing liposomes as a cornerstone in modern chemotherapy.7,8 Furthermore, recent innovations in developing multifunctional liposomes, which incorporate combined targeting mechanisms, represent advanced strategies for targeted treatments.9,10
CBs are a class of macrocyclic compounds synthesized by acid-catalyzed condensation reaction between glycoluril and formaldehyde. 11 CBs are versatile for use in drug delivery and other research areas because of their ability to form stable binary and ternary host–guest complexes. 12 For example, cucurbit[7]uril (CB[7]) has been shown to selectively bind to insulin and β-amyloid, offering potential applications in Alzheimer's and diabetes research by inhibiting protein aggregation. 11 Additionally, CBs have been explored for developing stable drug-in-CB-in-liposome formulations to improve drug delivery and control lipophilic drugs’ rapid release from liposomes. 13
Despite these advances in the use CBs and liposomes for drug delivery, the interaction of CBs with liposomes remains unclear and needs further investigation. To address this gap, this study aims to investigate the effects of CB[7] on the integrity and stability of liposomes. Conventional liposomes composed of 1,2-dipalmitoyl-sn-glycero-3-phosphocholine (DPPC) and cholesterol (Chol) were prepared using the thin-film hydration technique. The prepared liposomes were characterized in terms of their average size, zeta potential (ξ), morphology, and thermal behavior. The ability of CB[7] to act as a host for Chol and DPPC was also explored using fluorescence spectroscopy. Furthermore, the permeability of the liposomal membrane was assessed by monitoring the release of the fluorescent dye (calcein) in the presence of different concentrations of CB[7]. Finally, the biocompatibility of CB[7] was evaluated using a hemolysis assay with human red blood cells (RBCs). Elucidating the mechanisms underlying the CBs–liposomes interactions can contribute to the development of stable and efficient drug delivery systems, while also providing deeper insights into the interaction of CBs with cell membranes.
Materials and methods
Materials
CB[7] was supplied by Dr Anthony Day, University of New South Wales (Australia), and used as received. Deuterium oxide (D2O; 99 at% D) and deuterated chloroform (CDCl3) were purchased from Sigma-Aldrich, and deionized water was prepared using an Osmo Aries device (CA, USA). High-performance liquid chromatography (HPLC) isocratic-grade chloroform stabilized with ethanol was purchased from CARLO ERBA reagents (Sabadell, Spain). Pierce® radio immunoprecipitation assay (RIPA) buffer was obtained from Thermo Scientific (Waltham, MA, USA). Chol and DPPC were purchased from Avanti Polar Lipids, Inc. (Alabaster, AL, USA). Phosphate-buffered saline (PBS; pH 7.4, 1×) was obtained from Gibco Thermofisher (Paisley, UK). Calcein was purchased from Sigma-Aldrich, Inc. (Baden-Württemberg, Germany). Absolute ethanol (HPLC-grade, 99.9%) was obtained from Carbon Group (Cork, Ireland).
Preparation of liposomes
Liposomes were prepared using the thin-film hydration–extrusion method.
14
Briefly, 4.77
Dynamic light scattering measurements
The mean hydrodynamic diameter, PDI, and zeta potential (ξ) of the liposomes were measured via dynamic light scattering (DLS)16,17 using a Nano ZS (Malvern Instruments, UK) before and after incubation with CB[7] for 2 and 24 hours at room temperature. 16 The liposomes were diluted with PBS to obtain a suitable count rate of between 200 and 300 K. The measurements were performed in triplicate at 25 °C for each sample. The standard deviation (SD) was calculated to estimate the repeatability of the measurements. 17
Fluorescence measurements
The fluorescence intensity of calcein dye released from the liposomes was measured using a fluorometer (Promega, Glama®-Multi Detection System, Madison, WI, USA) to evaluate the integrity of the liposome bilayer in response to CB[7] addition. Briefly, 80 mM calcein in PBS (pH = 12.00 ± 0.01) was added to liposomes during the hydration step. The liposomal suspension was then extruded below the transition temperature of liposomes (

Benesi–Hildebrand (B–H) linear regression analysis of the fluorescence spectra was used to determine the association constant (

Titration of liposomes with different concentrations of CB[7] using nuclear magnetic resonance
Nuclear magnetic resonance (NMR) spectroscopy was performed in deuterium oxide (D2O; 99.0 at% D, Sigma-Aldrich, USA) using a Bruker Biospin AG Magnet system, 500MHz/54 mm instrument (Bruker BioSpin, Switzerland) with a PA BBO 500S1 BBF-H-D-05 Z SP probe. The temperature was controlled at a constant 298 K using a variable temperature unit. The effect of CB[7] on the liposomes was investigated by adding different concentrations of CB[7] (0.3189–1.085 mM) and measuring the resulting 1H-NMR spectra. The results were then compared with the 1H-NMR spectra of the liposomes and CB[7] alone.
Thermogravimetric analysis
Thermogravimetric analysis (TGA) was used to investigate the thermal stability and mass loss of the liposomal suspensions after CB[7] addition. TGA is an empirical technique in which the mass of a sample is measured as a function of the sample temperature or time to obtain a thermogram or thermal decomposition curve. 23 Liposome suspensions were mixed with CB[7] solutions of different concentrations in a 1:1 volume ratio in alumina crucibles, and the wt% versus temperature for the different solutions was measured using a thermogravimetric analyzer (Mettler Toledo, TGA/DSC2 STAR® System, Greifensee, Switzerland) and compared with the thermogram of blank liposomes.
Biocompatibility of CB[7]:hemolysis test
Hemoglobin loss or hemolysis is an indicator of the stability of the cell membrane of RBCs.
24
A hemolysis assay using CB[7] was conducted by isolating fresh RBCs from serum through centrifugation at 2000 r/minute for 5 minutes. The supernatant containing plasma and platelets was discarded, and the remaining suspension was washed continuously with PBS (pH 7.4) to obtain a clear supernatant. The resultant RBC suspension (200 μL or more) was diluted in 9.8 mL of PBS, producing a stock RBC suspension containing approximately 2% RBCs. RBCs incubated with deionized water and 3% acetic acid, and RBCs incubated with PBS were used as the positive and negative controls, respectively. In these experiments, 50 μL of the 2% RBC suspensions were incubated with 450 μL CB[7] samples for at least 2 hours at 37 °C and 100 r/minute. The final concentrations of the resulting solutions ranged from 0.16 to 3.1 mg/mL. The absorbance of the supernatant was measured at 541–543 nm (Evolution™ 220 UV–Visible Spectrophotometer, Thermo Scientific™, Waltham, MA, USA) to evaluate the release of hemoglobin. All measurements were performed in triplicate, and the hemolysis rate was calculated using the below equation:

Transmission electron microscopy
The structure and morphology of the liposomes with and without added CB[7] were analyzed using transmission electron microscopy (TEM). TEM analysis of the liposome samples was performed using a negative staining method. First, 200-mesh formvar copper grids (SPI Supplies, USA) were equally coated with carbon using a low-vacuum Leica EM ACE200 glow discharge coating system (Leica, Austria). The carbon-coated grids were then coated with 1.5% vinylec K solution in chloroform. A drop of PBS-diluted liposome suspension was placed on the carbon-coated copper grids and left to air-dry overnight to evaluate the stability of the liposome samples over extended periods according to Odeh et al. and Alshaer et al.3,16 Then, the loaded grids were stained using a 3% (v/v) aqueous solution of uranyl acetate dye for 20 minutes at room temperature. The grids were then rinsed with distilled water and air-dried at room temperature. The assembled grids were examined using a Versa 3D TEM system (FEI, Netherlands) with an acceleration voltage of 30 kV. 27
Statistical analysis
The reported results were the averages of three or four complete and independent experiments. Data were reported as the mean ± SE (standard error of measurement) or
Results and discussion
Effect of CB[7] on liposome properties
This study investigated the effect of CB[7] on the stability of a DPPC:liposome (65:35) formulation. Previous research identified DPPC ratios of 60–40% and 70–30% as the most stable, with a 2:1 lipid ratio being optimal for characterization.
28
Liposomes lacking electrosteric stabilization tend to aggregate because of electrostatic interactions between vesicles. Nevertheless, the liposomal formulation consisting of a 65:35 molar ratio of DPPC, lipid, and Chol was considered stable, with a surface potential sufficient to reduce the rate of aggregation and fusion.
29
Table 1 presents the DLS measurements of conventional liposomes at different CB[7] concentrations. The results reveal a significant increase in the average size of liposomes at the highest CB[7] concentration (1.548 mM) compared to liposomes without CB[7]. Liposome size increased with higher CB[7] concentrations during both 2- and 24-hours incubation periods (Table 1). Particle size is an essential property of lipidic nanocarriers that influences the encapsulation efficiency, stability, bio-distribution, cellular uptake, mucoadhesion, and drug release profile.
30
The sizes of liposomes used for clinical applications range from 50 to 450 nm.
31
Table 1 indicates that the sizes of the blank liposomes (L1) and those with CB[7] were smaller than 450 nm, except for L7 (with the highest CB[7] concentration), which reached 507.1 ± 173.7 nm after 2 hours. The PDI value was below 0.1 for L1 and increased with higher CB[7] concentrations, unaffected by the incubation time. The PDI value of
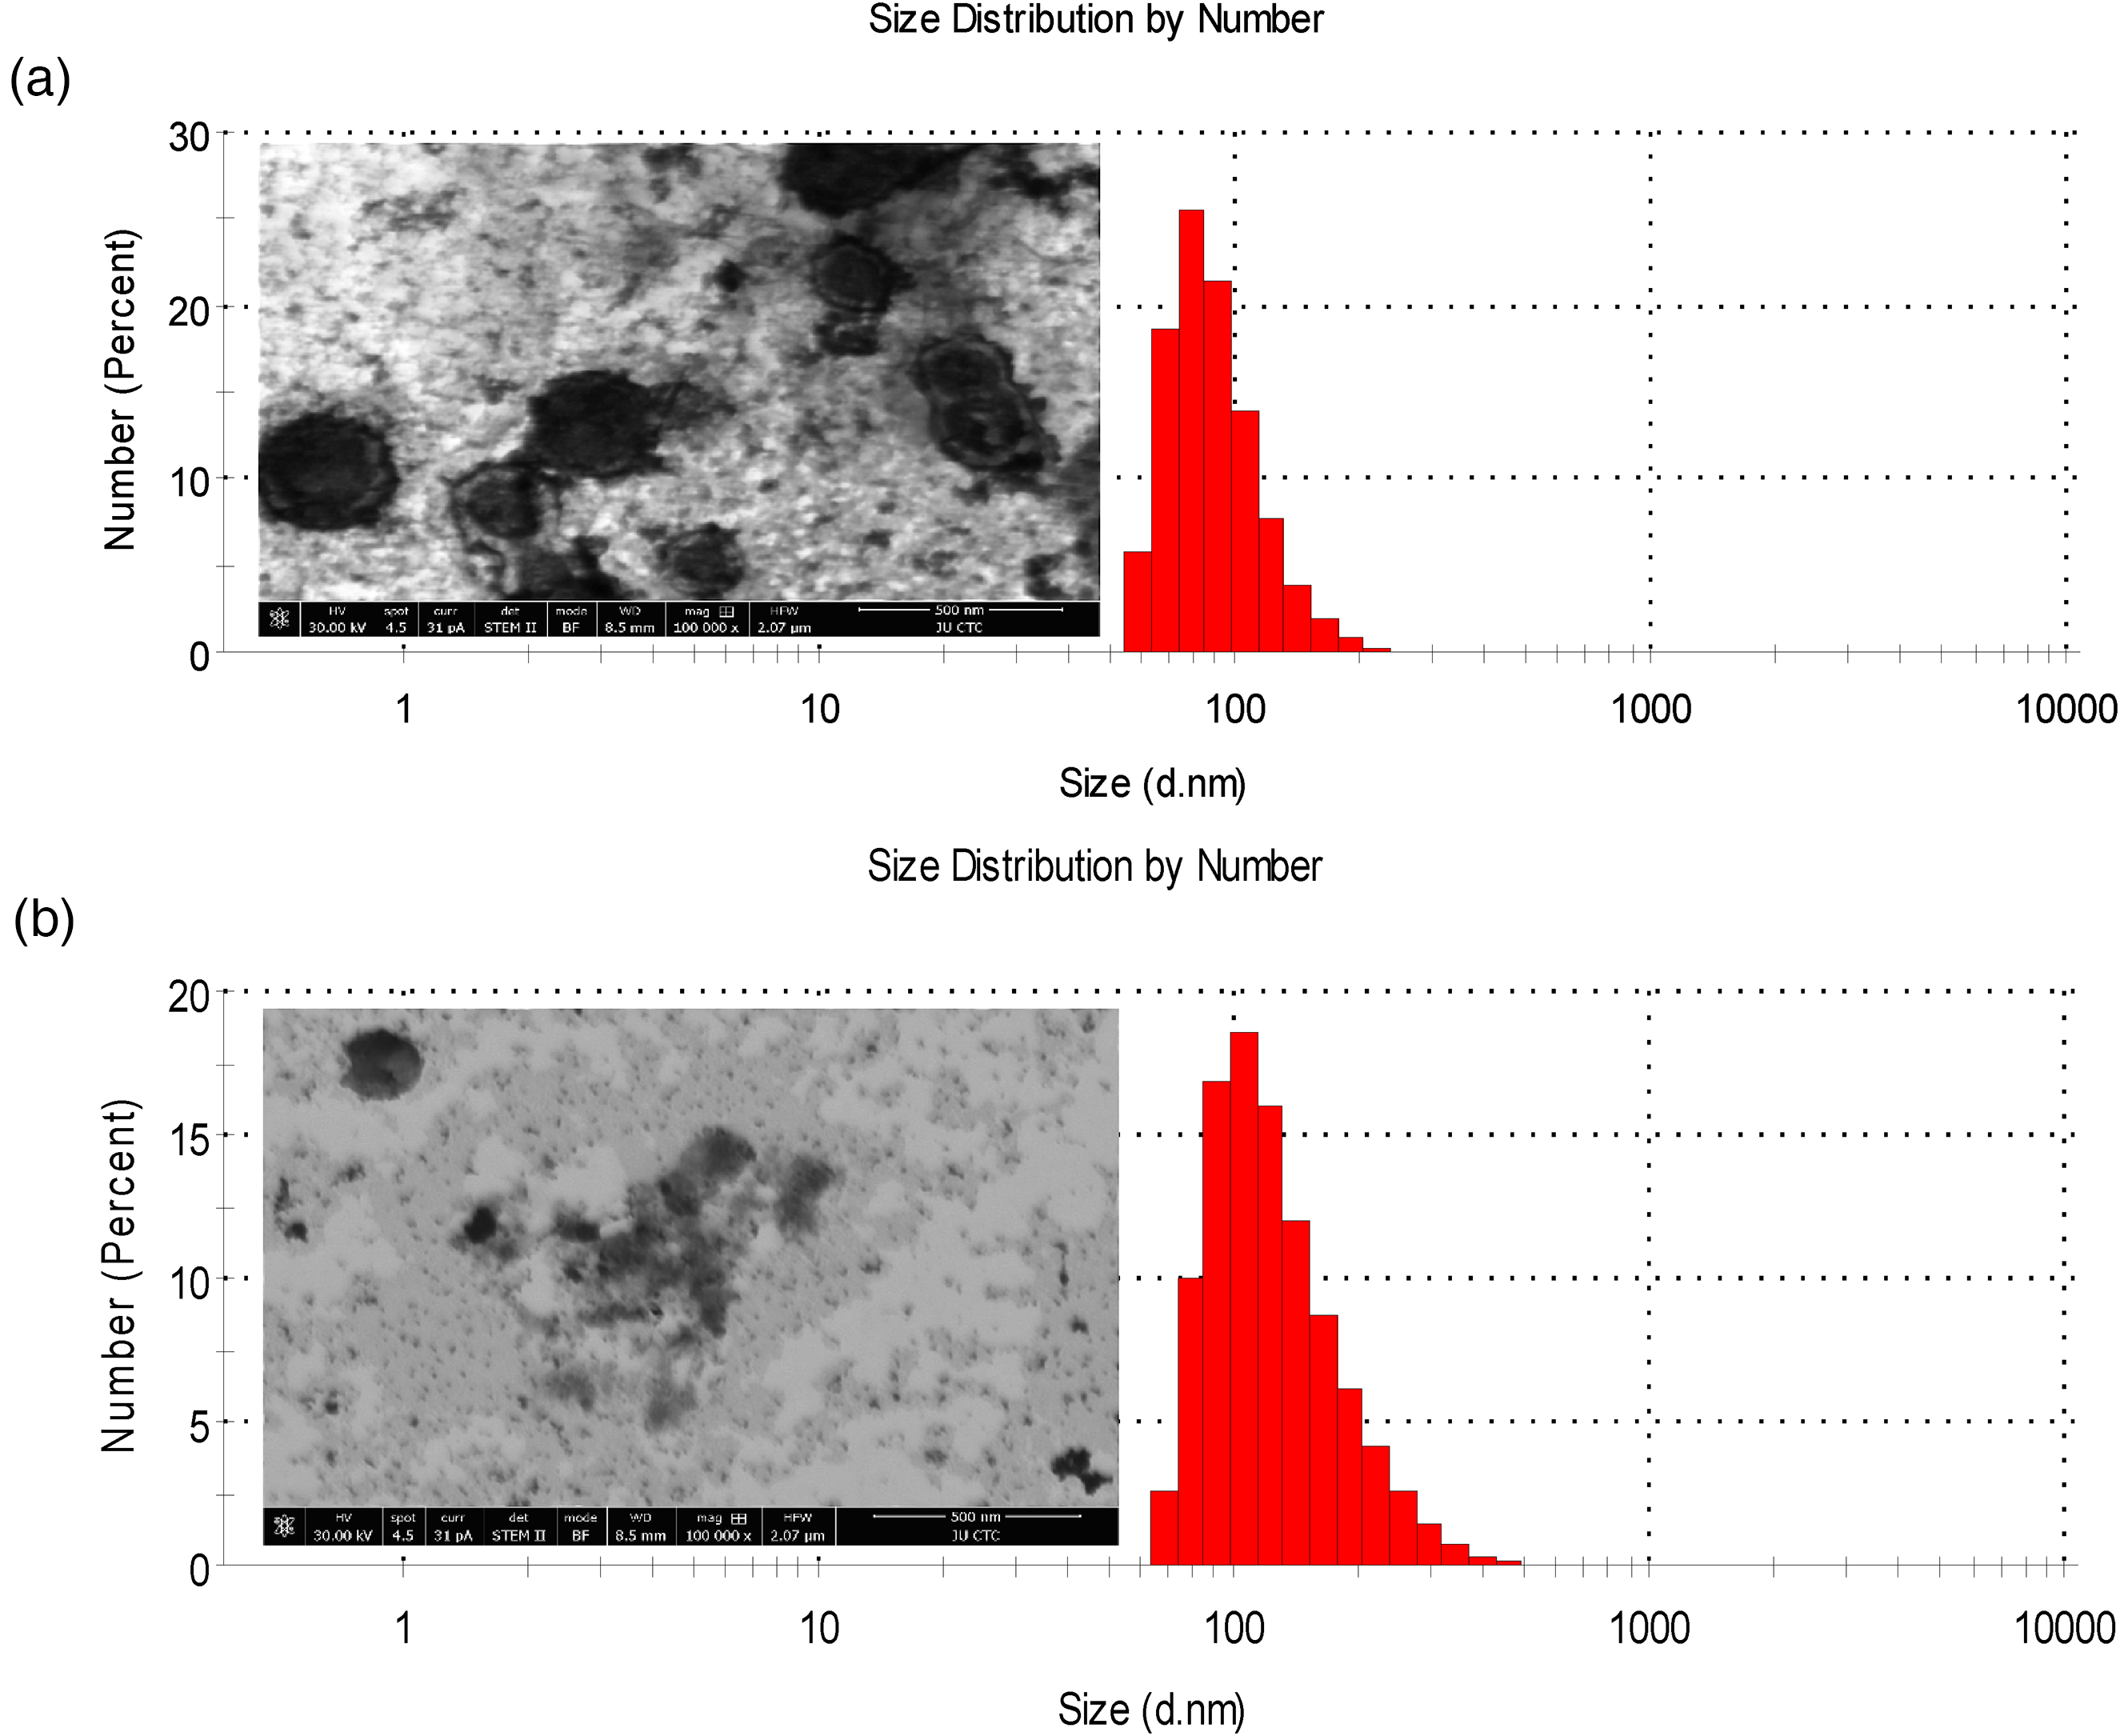
Representative DLS (size measurement) and TEM plots of (a) blank liposomes and (b) liposomes with 0.1698 mM CB[7] 24 hours after preparation. DLS measurements were performed at 25 °C, and the results are reported as triplicate averages ± SD.
DLS measurements of conventional liposomes (formulas) at different CB[7] concentrations after 2 and 24 hours of treatment at 25.0 ±
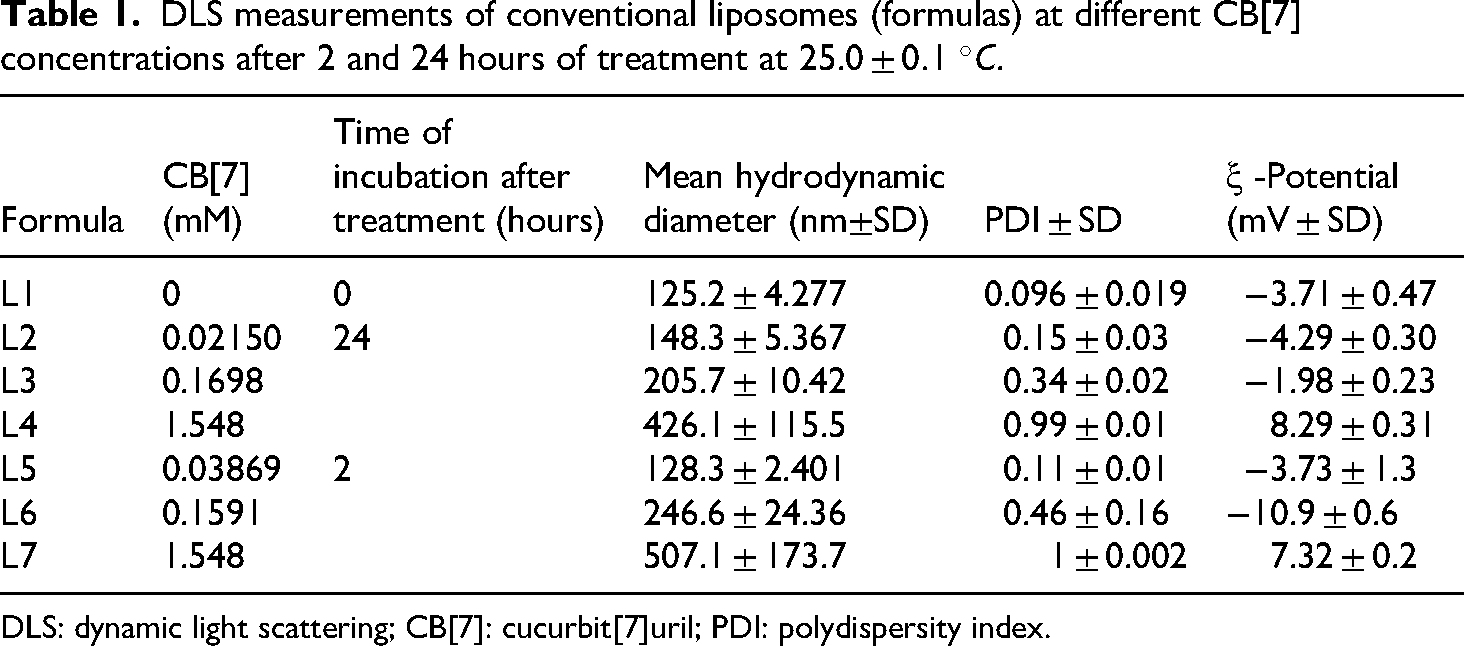
DLS: dynamic light scattering; CB[7]: cucurbit[7]uril; PDI: polydispersity index.
The remarkable increase in the average size of liposomes along with the fluctuating PDI values with increasing CB[7] concentration was attributed to the high affinity of CB[7] toward the lipid molecules forming the synthetic liposome bilayer, particularly Chol. Consequently, CB[7] may disrupt liposomes by solubilizing the lipids forming the liposomes.
33
The tendency of CB[7] to migrate to the suspension surface reduces the packing density of the lipid membrane.
34
Low negative values of the ξ-potential of the liposomal formulations indicated that phosphate ions in the phosphate buffer did not adsorb to the liposome head groups in large quantities. In addition, the ξ-potential depends on the ionic strength of the phosphate buffer used (I = 0.165 M). As noted by Chibowski and Szcześ,
35
at high ionic strengths, the choline groups are located above the phosphate group in the polar heads of DPPC lipids. Additionally, compression of the diffuse part of the electric double-layer around the liposomes at high ionic strength results in low negative ξ-potential values.
35
However, liposomal formulations with high CB[7] concentrations (
Calcein release assay and liposome stability
Liposomes can form leaky structures when the phospholipids are hydrated under specific conditions.
36
Calcein release from liposomes depends on the bilayer rigidity, diffusion coefficient calcein, and its solubility in the release medium.
19
A calcein release assay was used in this study to evaluate the changes in the liposome stability and permeability with varying CB[7] concentrations. Self-quenching has been used for quantitative leakage assays of lipid formulations. Initially, a high-concentration fluorophore is encapsulated inside the membrane to enhance self-quenching (Supplemental 1). An increase in the volume or permeability of the membrane decreases the concentration of fluorophore inside the liposomes. This generates a fluorescence signal of the fluorophore due to the decrease in self-quenching.
37
Changes in the fluorescence intensity (
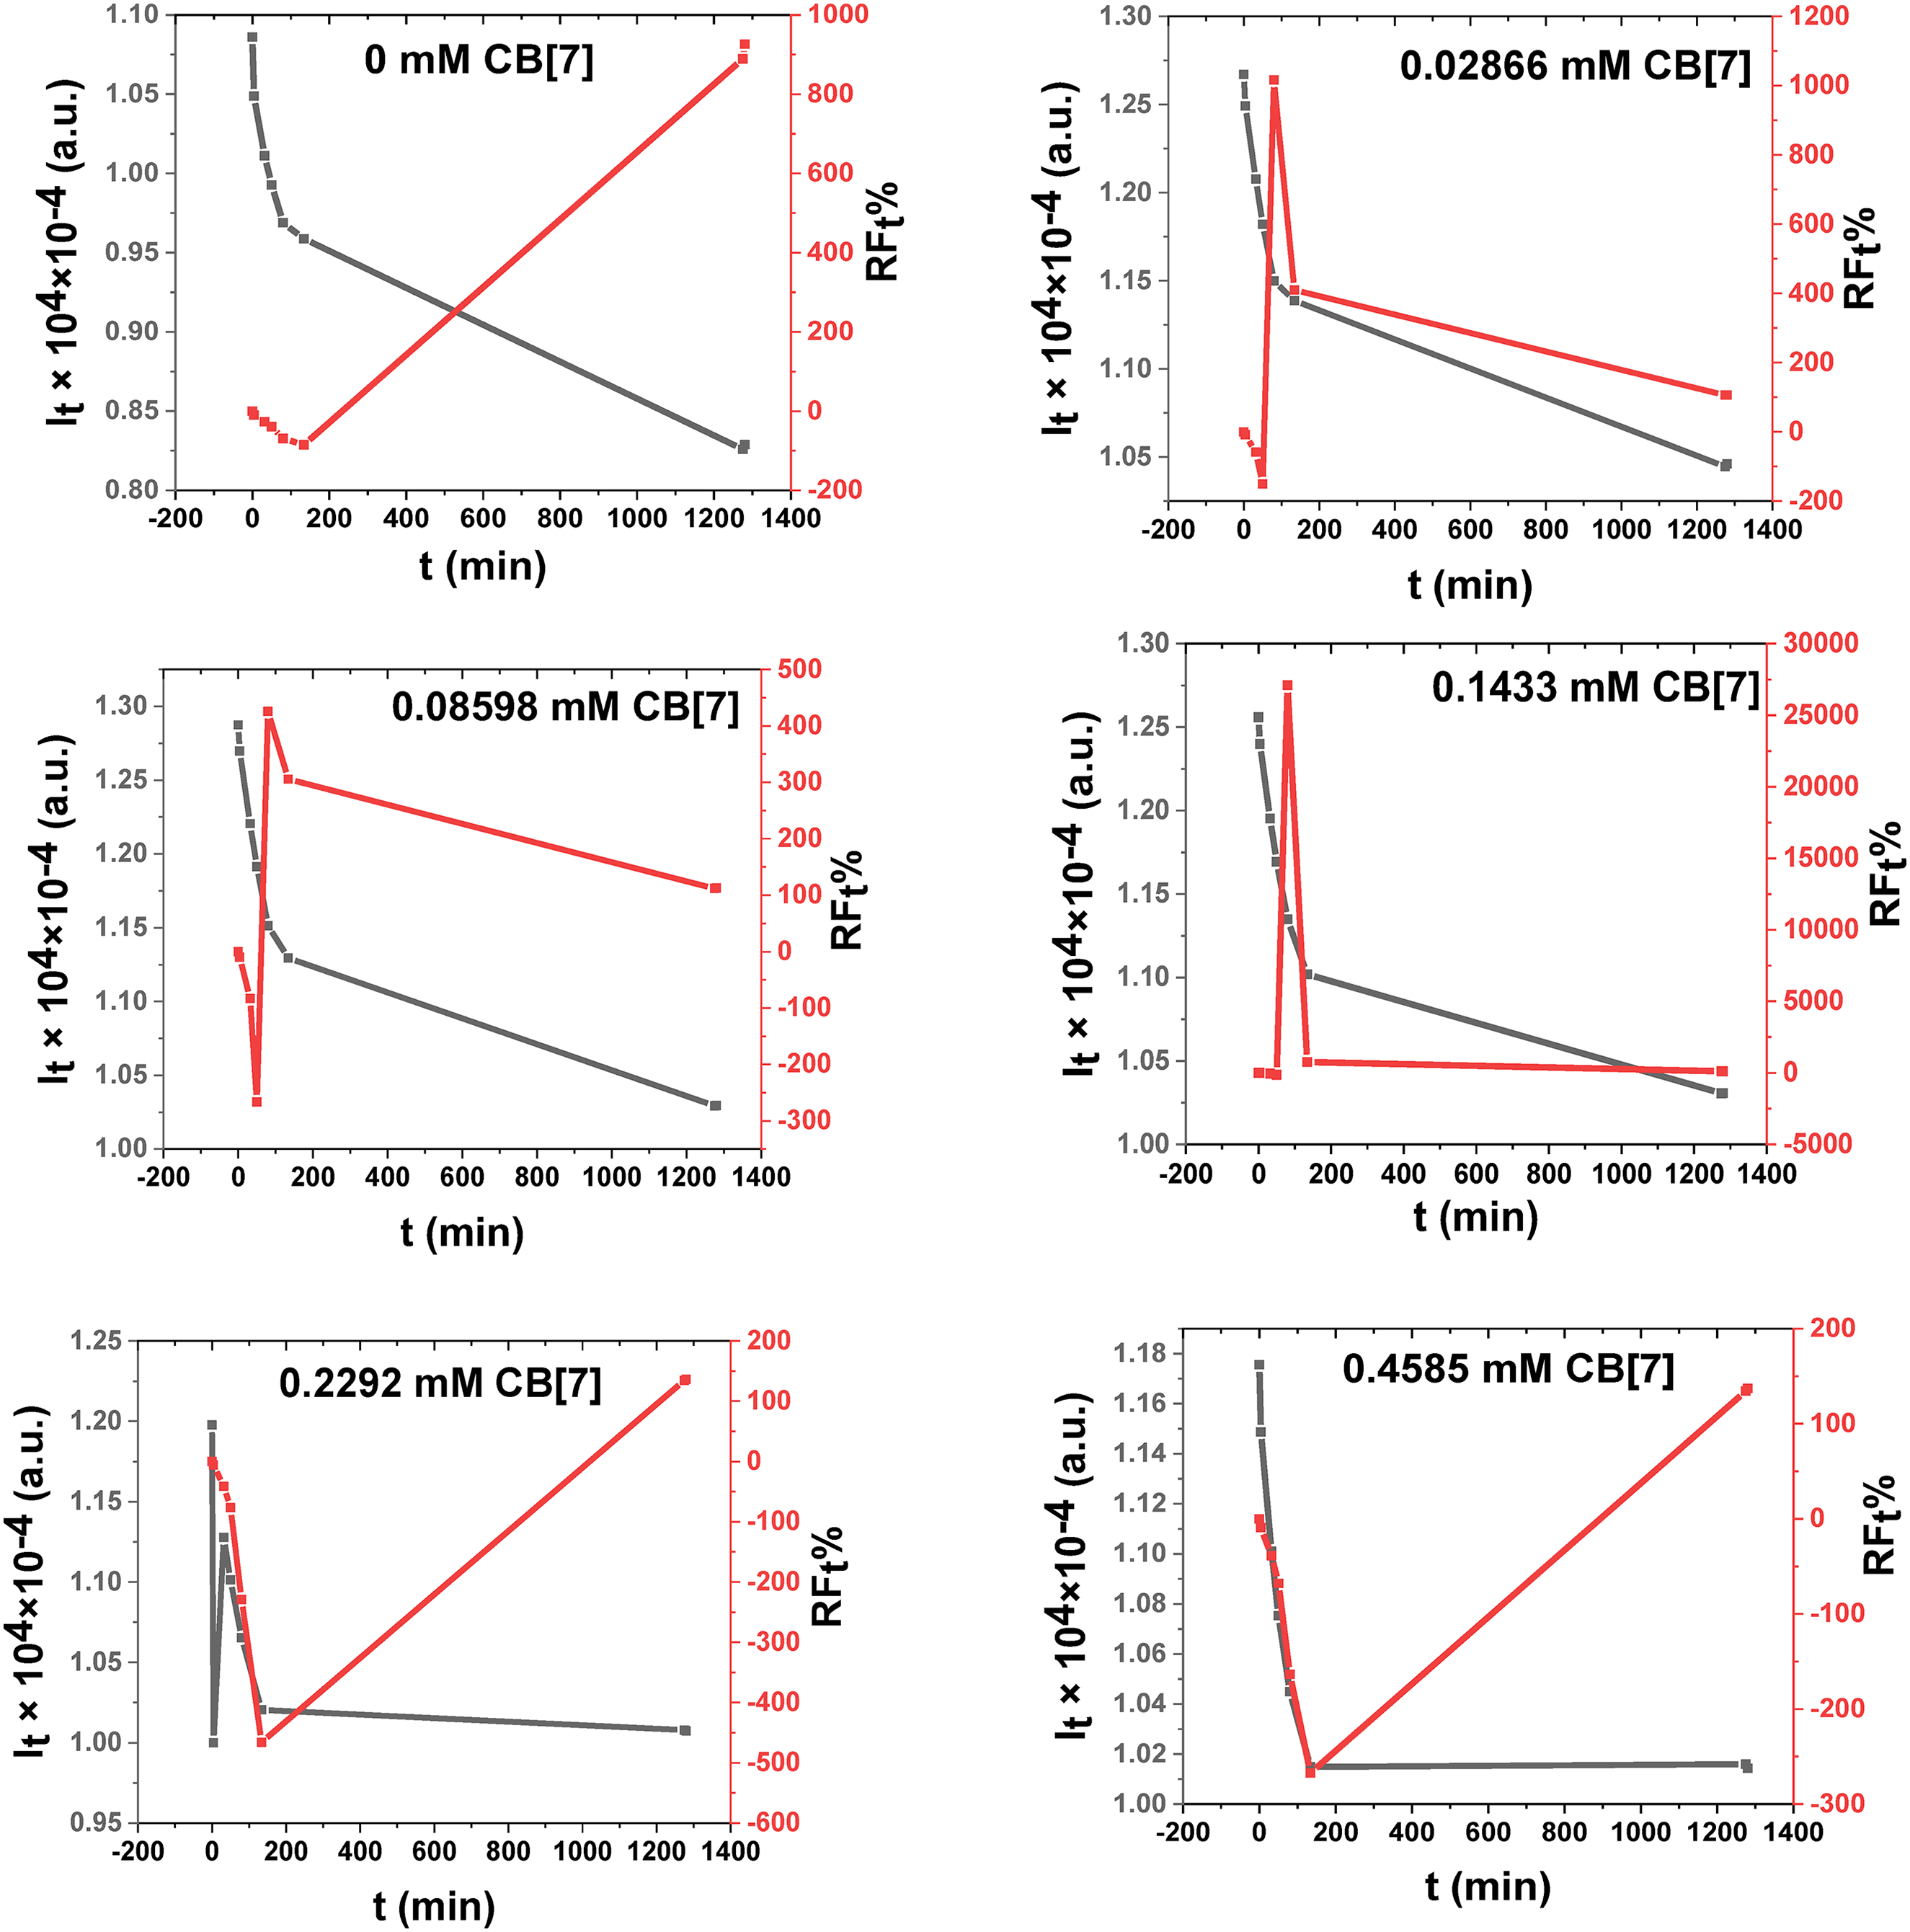
Fluorescence intensities (
Behavior of calcein release from liposomes
Neutral vesicles have a net surface potential of zero, whereas calcein is a polyanion with a negative surface potential. The calcein molecule has approximately 3.5 negative charges at pH 7.4, as confirmed by acid–base titration (Figure 3). Consequently, a significant increase in the ionic strength inside the liposome produces a large difference in the osmolarity between the external and internal parts of the liposome. Considering the very small distance between the two lipid layers (nearly 4 nm), the external surface potential is influenced by the internal surface potential. Osmotic pressure inside the liposome forces calcein to diffuse through the lipid bilayer. Consequently, the release of calcein follows zero-order kinetics with a constant release rate. However, the release rate decreased over time because of the desorption/migration of calcein molecules from the surface to the outer aqueous sections of the liposomes, producing a non-zero or first-order release (Table 2, Supplemental 2). 19
Chemical structure of calcein.
Apparent rate constants (k) and permeability coefficients

CB[7]: cucurbit[7]uril.
Data with standard errors were obtained from at least three independent experiments. All experiments were performed at 25 °C.
Considering the time-dependent release of calcein, the permeability coefficient (
Finally, the permeability coefficient of calcein was calculated using the below equation:
The values of ln (
Liposome size is an essential factor for calcein release, as indicated in Table 2. The permeability of hydrophilic molecules increases with increasing size of liposomes having the same unilamellarity. 19 As indicated in Table 2 and Supplemental 3, the permeability of calcein from the liposomes increased with the liposome size and reached a maximum (0.2692 nm/second) for the liposomal sample with the highest CB[7] concentration (1.433 mM).
The results showed that increasing concentrations of CB[7] (from 0.02866 to 1.433 mM) caused the size of large unilamellar vesicles (over 150 nm) to increase, which also increased their permeability (Table 2, Supplemental 3). CB[7] molecules, which strongly bind to lipids such as Chol, can solubilize Chol and DPPC from the lipid bilayer.
33
Moreover, the packing density was reduced, which in turn disturbed the barrier to calcein permeation and resulted in increased
Stoichiometry and association constant determination
The stoichiometry and association constants
The difference in fluorescence intensity (
According to the kinetic indicator displacement assay (kinIDA) reported by Sinn et al.,
46
the addition of a guest solution (Chol or DPPC) to a pre-equilibrated host–dye pair ([CB[7]]:[Calcein] solution) results in the replacement of the dye molecules with guest molecules. Therefore, the fluorescence intensity of calcein changed because DPPC or Chol replaced the dye molecules inside the CB[7] cavity. The latter phenomenon was attributed to the higher affinity of CB[7] toward lipid molecules, particularly Chol.
33
To further explain this observation, 1H-NMR spectra were recorded for Chol and 1:1 [CB[7]]:[Chol] in D2O (Supplemental 7(a)). As reported by He et al.,
47
the hollow cavity of CB[7] shields protons, causing guest molecules to exhibit higher field signals in 1H-NMR. The protons inside the cavity shift upfield, whereas those near the carbonyl oxygen atoms at the portals shift downfield. This makes 1H-NMR an effective method for studying host–guest interactions.
47
The formation of hydrogen bonds causes a loss of electron density around the hydrogen nucleus, resulting in a downfield shift.
48
According to Supplemental 7(a), H3 and H19 shifted downfield and upfield, respectively. The downfield shift for H3 was due to the formation of a hydrogen bond between the hydroxyl group of Chol and the highly electronegative carbonyl-fringed portals of CB[7]11,49 (Supplemental 5 and 7(a)). However, the upfield shift for H19 arose from the encapsulation of ring B of the Chol molecule (Supplemental 5) inside the CB[7] cavity. In conclusion, rings A and B of the nearly planar Chol molecule (Supplemental 5) were included in a single CB[7] cavity.
49
To verify this result, the association constant was determined using equation (6) by plotting the inverse of the fluorescence differences against the inverse of the concentration of DPPC or Chol (Figure 4(b)):

Formation of CB[7]–Chol inclusion complexes: (a) fluorescence intensity over 13 minutes as a function of Chol concentration; (b) Benesi–Hildebrand method based on fluorescence spectroscopy by titration of the CB[7] host solution with a Chol guest solution at different ratios. The temperature was 25 °C. The measurements represent averages of five independent trials with SE and RSD% values of ≤ 0.083 a.u. and ≤ 0.033%, respectively.
The association constant between CB[7] and Chol was strong:
This result can be attributed to the ability of DPPC to form micelles starting from extremely low concentrations.53,54 As shown by Smith and Tanford, 53 the critical micelle concentration of DPPC decreased rapidly as the methanol concentration in the solvent was reduced, reaching a value of 0.46 nM in water. To investigate the stoichiometry of the interaction between DPPC and CB[7], the condition of the lipid in solution must be known. Therefore, the amounts of lipids existing as monomers and micelles must be accounted for. 53 However, the interaction between DPPC monomers or vesicles and CB[7] did not occur or was minimal. 55 The addition of ethanol to DPPC vesicles in the gel phase caused structural changes, leading to hydrocarbon interdigitation. This resulted from the interaction of ethanol with the polar region of the lipid bilayer, which enhanced the head group solvation. 56
To investigate the interactions of DPPC with CB[7], the 1H-NMR spectrum of DPPC and 1:1 [CB[7]]:[DPPC] in D2O was recorded; the shielded and deshielded protons are shown in Supplemental 7(b). As illustrated in Supplemental 7(b), most of the protons at the sn-1 and sn-3 positions of the glycerol backbone shifted upfield. In addition, the methyl protons of the tail groups were also shifted upfield. The peak at 3.2444 ppm corresponds to the nine hydrogens of the three methyl groups of the quaternary amine, and it was shifted downfield to 3.2469 ppm. The peak at 2.3020–2.2304 ppm is representative of the four β-hydrogens of DPPC on C1 of the tail groups. 57 Most of the latter peaks were also shifted downfield. A schematic structure of the DPPC:CB[7] complex32,49 (Supplemental 7(b), right) was used to identify the shielded and deshielded protons. Nagle and Tristram-Nagle 58 reported that CB[7] formed very stable complexes with several cationic cholines. Regarding the phosphocholine group, the phosphate P exhibits a small downfield shift because the anionic groups are positioned outside the CB[7] cavity. The stabilization of the complex is achieved by ion–dipole and dipole–dipole interactions of the protonated and polar head groups of the guests with carbonyl-laced portals. In addition, the quadrupolar cavity of CB[7] stabilizes the oxygen in the carboxylate through dipolar–quadrupolar interactions with the trimethylammonium group, which is located near the carbonyl groups at the portals of the cavity. 58 The peaks of the 1H-NMR spectrum for the 1:1[CB[7]]:[DPPC] sample are consistent with a downfield shift of the protons of N(CH3)3+ and C1 of the tail groups (both are located at or outside of the portal). For the CB[7] molecules residing at the end of the alkyl chain of the fatty acids of DPPC, He et al. 47 showed that the alkyl chains stabilize the CB[7] host when it bonds to external sites, and their hydrophobic character prevents the CB[7] host from sliding. The 1H-NMR spectrum in Supplemental 7(b) clearly shows that the protons of the fatty acid tails were shifted upfield from 1.3130–1.2340 ppm to 1.2971–1.1783 ppm, except for the C1 and C2 protons. Anderson et al. and Zidovetzki and Levitan40,41 considered the relative dimensions of the macrocycle cavity (e.g. the height) and phospholipid acyl chains. The phospholipid used in the latter study contained one acyl chain, which is the same as that used in this study (palmitoyl group). Accordingly, the length of the previous acyl chain was about 2 nm or 20 Å. The height of CB[7] is equal to 9.1 Å; thus, according to the previous study, 41 each acyl chain requires two CB[7] molecules to form an inclusion complex. As presented in Supplemental 7(b), the C1 and C2 protons were shifted downfield, and thus two C–C bonds with lengths of 1.54 Å 59 were excluded from the total length of the acyl chain available for complexation with CB[7]. Consequently, the remaining length was (20 Å − (2 × 1.54 Å)) = 16.92 Å; thus, each acyl chain had one CB[7] molecule to complex with. Simultaneously, the peak of the free alkyl chain was considerably induced, which may have been caused by the inclusion of two tail chains in CB[7] separately. 47
NMR titration of liposome with CB[7]
The stability of the liposomes toward CB[7] was investigated by measuring the chemical shifts of protons in both the liposomes and CB[7] (Supplemental 4) after the addition of CB[7] to the liposomes (Figure 5). The resulting spectra were compared to 1H-NMR spectra for 5.00 mM liposomes and 5 mM CB[7] solutions. The 1H-NMR spectrum of liposomes appeared as a high-resolution spectrum (Figure 5), as if the sample was in a liquid state (fast isotropic tumbling of the molecules canceled out the anisotropy); 60 however, the formation of the liposomes usually caused broadening in the NMR signals. 32 In solids and soft matter, molecular motions do not exist or, when present, are slow and/or anisotropic, producing substantial line broadening, which completely prevents the separation of different peaks in the spectrum in some circumstances. 60 A Chol concentration of 35 mol% increased the membrane fluidity, which explains the distinct peaks observed in the NMR spectrum of the liposomes. 61

Stacked 1H-NMR spectra of liposomes titrated with CB[7]. The proton peak of D2O is distinguished by an asterisk. D2O, 25 °C, 500 MHz.
The differences in the chemical shift values of the protons (
A comparison of the proton peaks of Chol in CDCl3 and the proton peaks of liposomes in D2O (Supplemental 6(b) and (c)) shows that the liposome protons appeared at approximately the same frequency as Chol protons H3 and H19 (Supplemental 5, Figure 5). The Chol proton peaks were not obvious in D2O because of the weak solubility of Chol in D2O (spectrum not presented). However, the solubility of Chol in D2O was enhanced by the addition of CB[7] at a 1:1 molar ratio (Supplemental 6(a)). The purpose of this comparison was to identify the liposome proton peaks using the same solvent (D2O); however, Chol was not soluble in D2O even after heating. Consequently, the addition of CB[7] to liposomes mainly affected the Chol proton peaks by shielding them, and they were also slightly broadened. Therefore, the Chol molecules were encapsulated inside the CB[7] cavity at a fast-to-intermediate exchange rate. 64 CB[7] can also interact with the DPPC molecule, but it has a higher affinity toward Chol because it can solubilize one Chol molecule for every five DPPC molecules, as demonstrated by Tovani et al. 33 The comparison between the spectra did not exclude the presence of DPPC proton peaks in the 1H-NMR spectrum of liposomes. However, the DPPC proton peaks possibly overlapped with those of Chol. For example, methyl and methylenic protons in the lipid chains resonate in the region of 0.85–1.50 ppm, but the methylenic protons of choline were assigned at 3.6 ppm. 65
Thermogravimetric analysis
TGA was used to detect the change in the mass percent of liposomes after the addition of different concentrations of CB[7] as a function of the sample temperature.
23
The thermal stability of the sample and the presence of residual components in the sample were evaluated using TGA curves.
66
The weight of blank liposomes decreased between
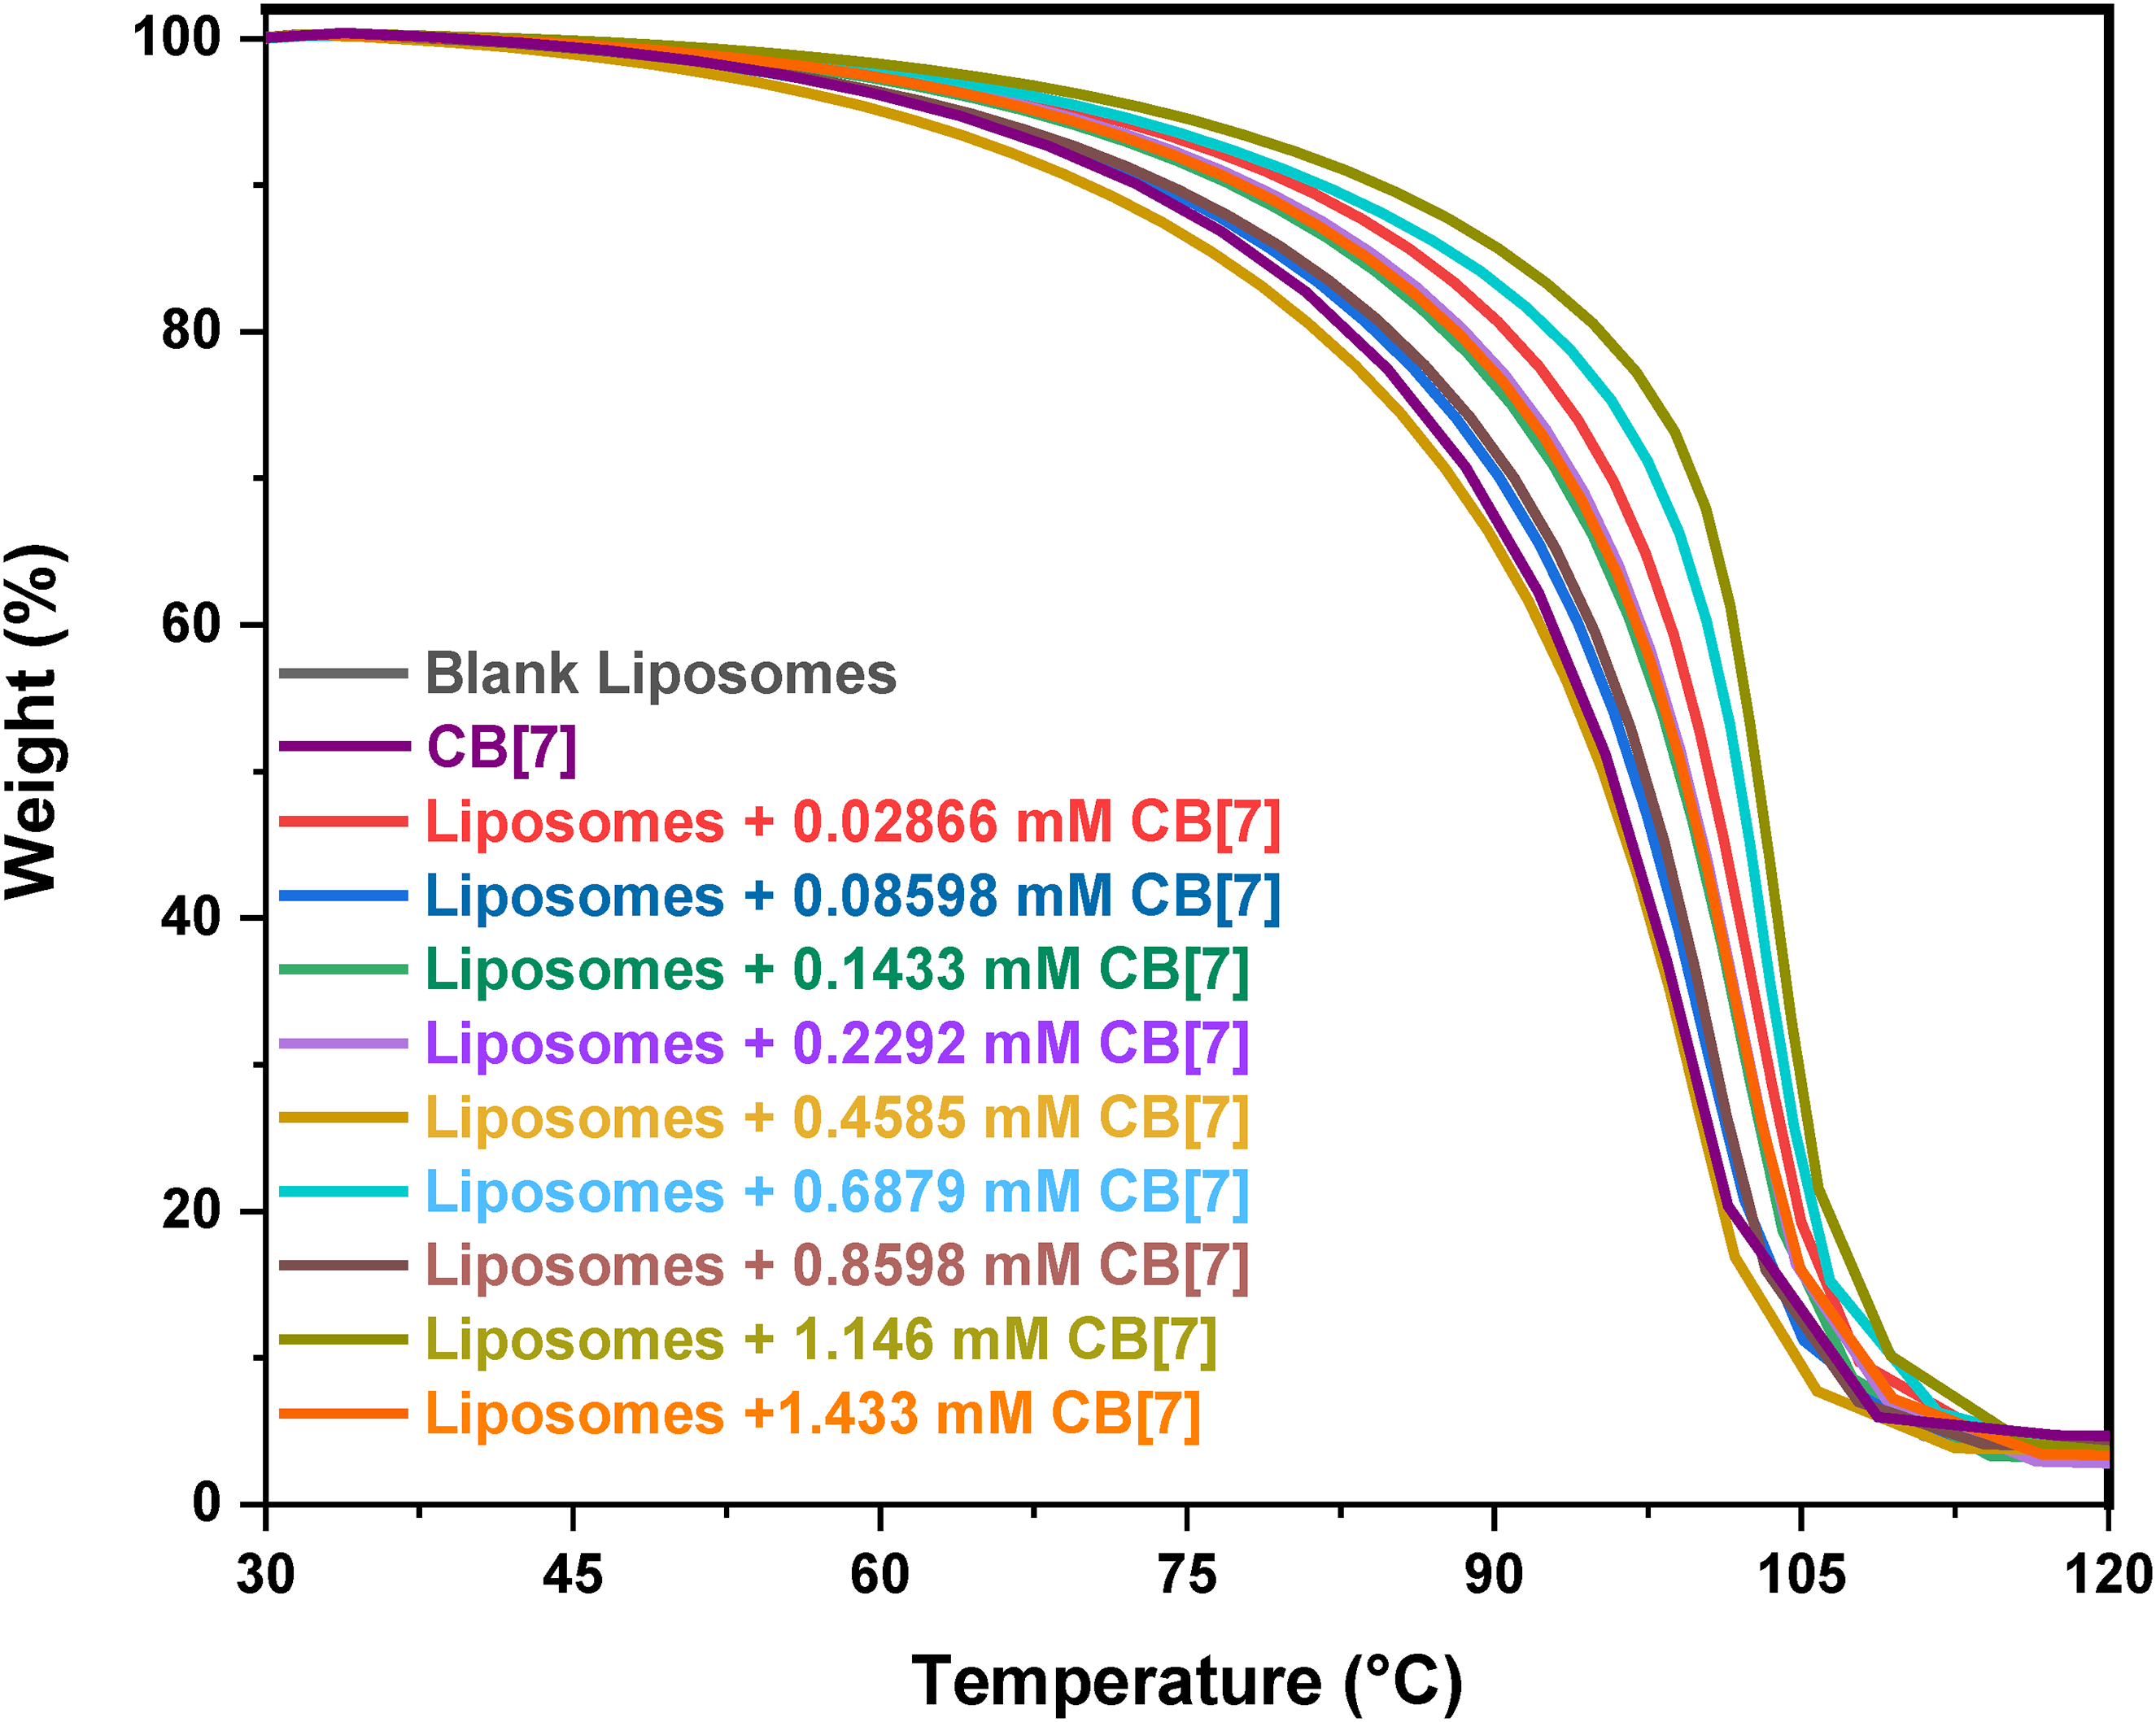
TGA thermograms representing the mass losses (%) of CB[7] and liposomes with different concentrations of CB[7] versus temperature. Heating rate: 10 °C/minute.
Hemolysis
Erythrocytes or RBCs were used to evaluate the hemolysis rate. One method of toxicity evaluation relies on measuring the release of hemoglobin from suspended RBCs. To investigate the concentration–response hemolysis of CB[7], a suspension of RBCs (2% RBCs) was incubated with solutions containing different concentrations of CB[7] for 2 hours or more at 37 °C and 100 r/minute. To determine the hemolysis rate (%), the amount of hemoglobin in the supernatant was detected using a UV–Vis spectrophotometer at wavelengths of 541–543 nm. The concentration of hemoglobin released in the supernatant was directly related to the number of cells that had undergone lysis. The level of in vitro cytotoxicity of hemolytic action is assessed by the observed mortality rates, as follows: 0–9% is classified as non-toxic materials, 10–49% are slightly toxic, 50–89% are toxic, and 90–100% are highly toxic materials. 24 The hemolysis results showed that 2.580 mM of CB[7] resulted in 56.88% hemolysis (Figure 7). However, CB[7] at concentrations 0.05159 to 0.8254 mM yielded hemolysis rates of less than 1%, as shown in Figure 7. Moreover, Fink et al. 25 reported that incubation with CB[5]–CB[7] did not cause hemolysis. The concentration of the CB samples ranged from 0.3955 to 25.80 mM. The hemolytic ratio was below 1% for all of the CB samples tested, which was comparable to the negative control (negative values were caused by statistical deviations of the medium blank). 25 The concentrations of CBs used in the previous study were much higher than those used in recent studies and yet did not cause hemolysis. Many factors can increase the hemolysis rate, such as inappropriate handling during processing of blood, inappropriate storage conditions, bacterial hemolysins, antibodies that cause complementary lysis, defects in the RBC membrane, or an abnormality in the blood donor. 70 In summary, as demonstrated by the mortality rates of RBCs in a previous study, 24 it is advisable to use concentrations of CB[7] in the range of 0.05159–0.8254 mM, which yield hemolysis rates below 1% . One possible explanation for the induction of hemolysis at CB[7] concentrations equal to or greater than 1 mM is the extraction of Chol molecules from the cell membrane of RBCs by CB[7]. 25
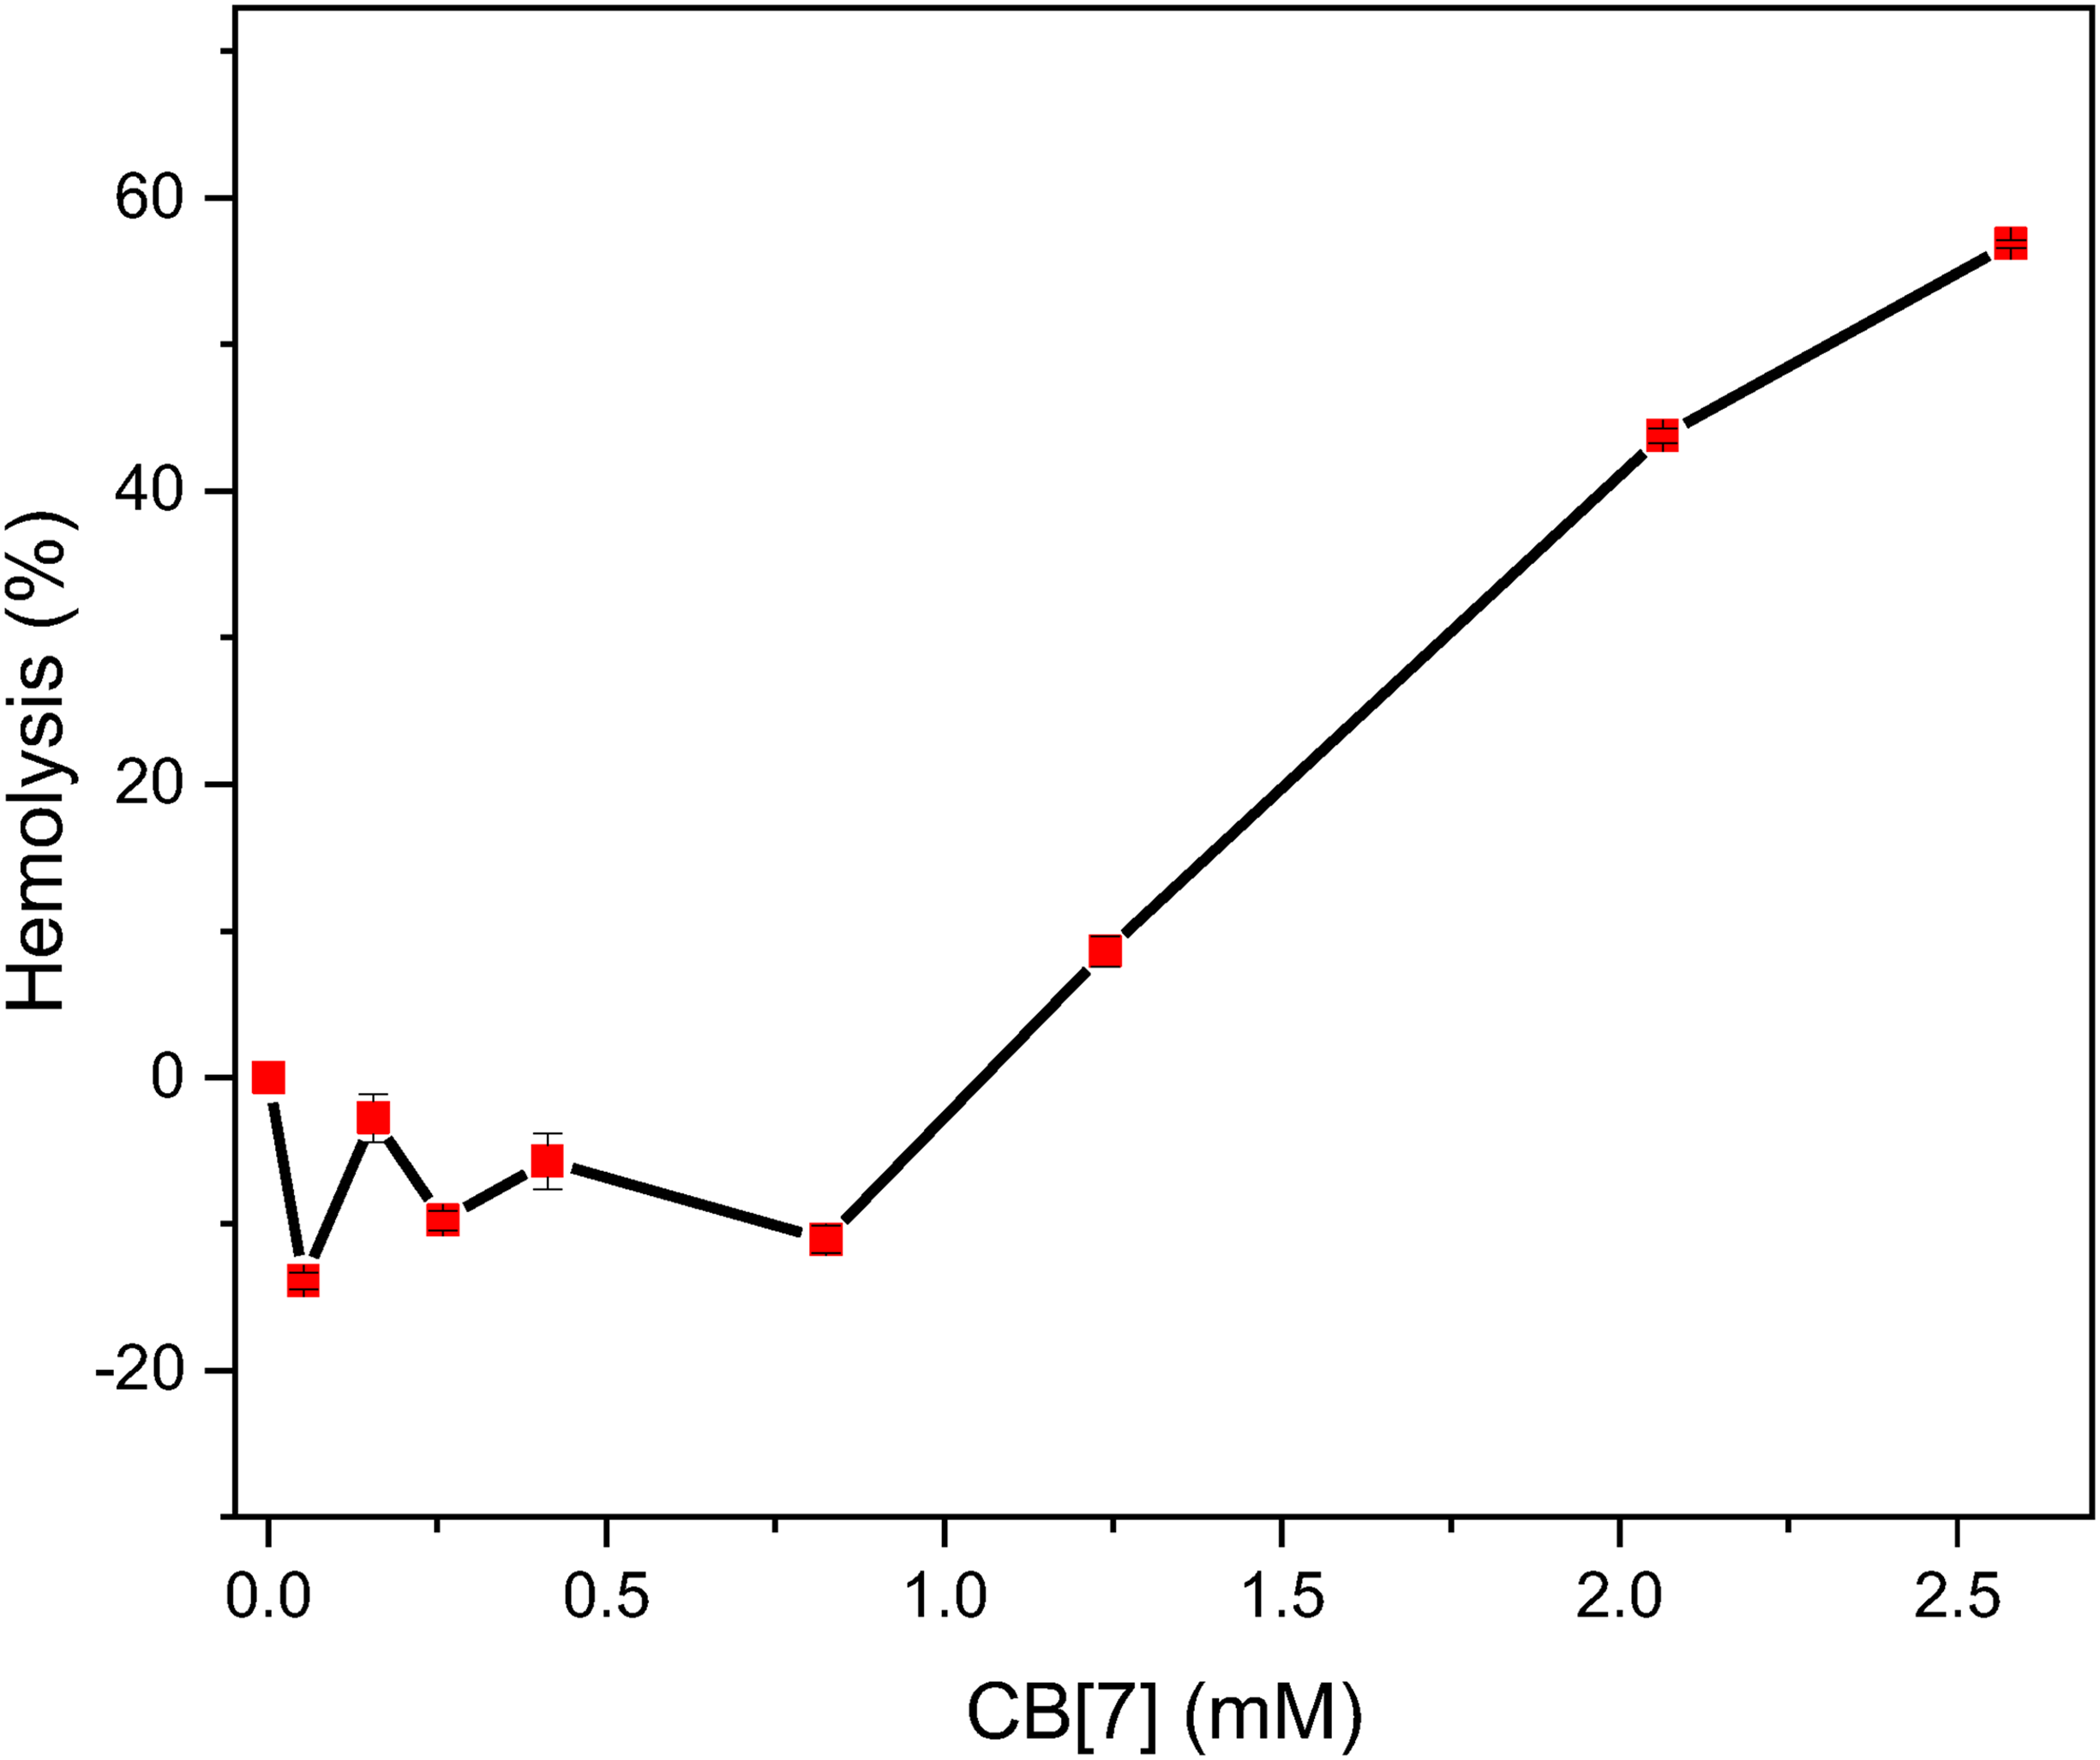
Hemolysis rate of RBCs under the effect of different CB[7] concentrations. The temperature was 37 °C, and the data are averages of three independent experiments with RSD% ≤ 1%.
Conclusion
In this study, the effects of CB[7] on the lipid bilayer of conventional liposomes were investigated. The CB[7] molecules were mainly localized on the surface of the liposomes and at low concentrations (
Supplemental Material
sj-docx-1-sci-10.1177_00368504251334687 - Supplemental material for Effect of cucurbit[7]uril on DPPC-containing liposomes: Interactions with the lipid bilayer
Supplemental material, sj-docx-1-sci-10.1177_00368504251334687 for Effect of cucurbit[7]uril on DPPC-containing liposomes: Interactions with the lipid bilayer by Summay Altaher, Walhan Alshaer, Fedaa Al Adaileh, Hamdi Nsairat, Shrouq Alsotari, Majdoleen H Rababah, Abeer Al Bawab and Fadwa Odeh in Science Progress
Footnotes
Acknowledgements
The authors would like to acknowledge the Cell Therapy Center, The University of Jordan. They would also like to thank Mrs Rula Hassoneh and Mrs Rula Buqaien (The University of Jordan) for their assistance with the NMR and TEM analyses, respectively.
Data availability
All data generated or analyzed during this presented work are included within this article.
Declaration of conflicting interests
The authors declared no potential conflicts of interest with respect to the research, authorship, and/or publication of this article.
Funding
The authors disclosed receipt of the following financial support for the research, authorship, and/or publication of this article: This study was supported by the Deanship of Scientific Research at the University of Jordan, Jordan.
ORCID iDs
Supplemental material
Supplemental material for this article is available online.
References
Supplementary Material
Please find the following supplemental material available below.
For Open Access articles published under a Creative Commons License, all supplemental material carries the same license as the article it is associated with.
For non-Open Access articles published, all supplemental material carries a non-exclusive license, and permission requests for re-use of supplemental material or any part of supplemental material shall be sent directly to the copyright owner as specified in the copyright notice associated with the article.